
High-yield bottom-up synthesis of 2D metal–organic frameworks and their derived ultrathin carbon nanosheets for energy storage†
Kuangmin
Zhao
ab,
Suqin
Liu
*a,
Guanying
Ye
ab,
Qingmeng
Gan
ab,
Zhi
Zhou
c and
Zhen
He
 *a
*a
aCollege of Chemistry and Chemical Engineering, Central South University, Changsha, Hunan 410083, P. R. China. E-mail: zhenhe@csu.edu.cn; sqliu2003@126.com
bInnovation Base of Energy and Chemical Materials for Graduate Students Training, Central South University, Changsha, Hunan 410083, P. R. China
cScience College of Hunan Agricultural University, Changsha, Hunan 410128, P. R. China
First published on 27th December 2017
Abstract
Two-dimensional (2D) metal–organic frameworks (MOFs) have been considered as promising precursors for the synthesis of 2D carbon materials for energy storage. However, the high costs and low yields of the synthetic methods for 2D MOFs are major obstacles for the preparation of 2D carbon materials from 2D MOFs. Herein, we report a facile and low-cost bottom-up synthesis of ultrathin Zn(bim)(OAc) MOF nanosheets (with a thickness of ∼5 nm and a high yield of ∼65%) and their derived N-doped porous ultrathin (2.5 ± 0.8 nm) carbon nanosheets (UT-CNSs) for energy storage. The UT-CNSs exhibit a capacitance of 278 F g−1 at a high current density of 10 A g−1, which is the highest among the reported MOF-derived carbon materials for supercapacitor electrodes. In addition, the UT-CNSs also exhibit a high reversible capacity of 553 mA h g−1 at 10 A g−1 and retain 100% coulombic efficiency after 1000 cycles at 2 A g−1 as an anode material for lithium ion batteries. The superior electrochemical properties of the UT-CNSs, especially at high current densities, are mainly due to their ultrathin morphology, large specific surface area, high conductivity, and suitable porous structure. This work provides a new strategy for the high-yield and low-cost synthesis of ultrathin MOF nanosheets as well as 2D carbon materials and their metal or metal oxide composites for various applications.
Introduction
Since the discovery of graphene, two-dimensional (2D) nanomaterials, such as nanosheets of transition-metal dichalcogenides, g-C3N4, porous carbon, and black phosphorus, have attracted much attention.1 Among these 2D nanomaterials, porous carbon nanosheets (CNSs),2 as a kind of graphene-like 2D nanomaterials with an ultrahigh specific surface area and well-defined pore structure, show great potential for energy storage applications such as supercapacitors (SCs) and lithium-ion batteries (LIBs).3 Two common approaches for the synthesis of CNSs are the hard-template (e.g., graphene oxides, SiO2, and montmorillonite)4,5 and self-template (e.g., silk6 and gelatin7) methods. However, the thicknesses of the CNSs prepared by these two methods are usually above 20 nm and cannot be well controlled. These relatively thick CNSs usually exhibit poor rate performance as electrode materials for energy storage due to the slow diffusion of ions to the inner parts of the CNSs.8 Therefore, an efficient and facile synthesis of ultrathin carbon nanosheets (UT-CNSs) is highly desired for energy storage.Recently, metal–organic framework (MOF) derived carbon materials have received much attention for energy storage due to their controllable morphologies and pore structures.9,10 MOF nanosheets, a series of inorganic–organic crystals with nanometer-scale thicknesses,11 are promising precursors for the synthesis of UT-CNSs. However, to the best of the authors' knowledge, the synthesis of UT-CNSs from ultrathin MOF nanosheets has not been reported, mainly due to the high costs and low yields of the synthetic methods for ultrathin MOF nanosheets. The MOF nanosheets are usually prepared by a top-down method through exfoliation of layered MOFs.12 M–BDC and M–BIM (M = Mn, Zn, Co, and Cu; BDC = 1,4-dicarboxybenzene; BIM = benzimidazole) are two kinds of low-cost layered MOFs13–15 that have been exfoliated by using different methods, including solvent intercalation,16 ball-milling,17 middle layer tailoring,18,19 and interlayer ligand breaking.20 However, the structural deterioration caused by the breaking of the coordination bonds during exfoliation has hampered the success in obtaining high-quality MOF nanosheets.21 Besides, the yields of the MOF nanosheets synthesized by these methods are low due to inefficient intercalation or breaking processes during exfoliation and further complicated processes for separating the MOF nanosheets from the bulk. In order to increase the yield of the MOF nanosheets and avoid the tedious post-processing steps in the top-down exfoliation method, researchers have also attempted to use the bottom-up method to directly synthesize high-quality MOF nanosheets from certain metal ions and ligands. The key point of the bottom-up method is to restrict the growth of the layered MOFs in the direction perpendicular to the layers.12 Makiura et al. utilized the liquid/liquid or liquid/air interfaces to confine the growth of the MOF nanosheets.22 Rodenas et al. synthesized Cu–BDC MOF nanosheets with a thickness of ∼25 nm by using a three-layer strategy interface reaction to control the growth of the nanosheets.23 However, the yield of the MOF nanosheets in the interface reaction was still low (∼10%) due to the small reaction area.24 Recently, Zhang's group developed a surfactant-assisted method to prepared a series of M–TCPP MOF nanosheets (M = Zn, Cd, Cu, and Co, and TCPP = tetrakis(4-carboxyphenyl)porphyrin). The thickness of the thinnest Zn–TCPP nanosheets was about 7.6 nm,25,26 but the high cost of TCPP would limit its usage for large-scale synthesis of MOF nanosheets as the precursors for CNSs. Thus, the development of a facile, controllable, and high-yield method to synthesize high-quality and low-cost MOF nanosheets, such as M–BIM and M–BDC nanosheets, is of great significance, yet still remains a challenge.
Here, we present a facile and low-cost bottom-up synthesis of ultrathin Zn(bim)(OAc) MOF (UT-Zn(bim)(OAc)) nanosheets in a thickness range of 1.0–6.5 nm and with a high yield of 65% (based on the bim). Besides, UT-CNSs with thicknesses of ∼2.5 ± 0.8 nm have been obtained through carbonization of the as-synthesized UT-Zn(bim)(OAc) nanosheets. The UT-CNSs show great potential for energy storage with a high capacitance of 352 F g−1 at 0.5 A g−1 (or 283 F g−1 at 10 A g−1) as electrode materials for SCs and 1229 mA h g−1 at 100 mA g−1 as the anode for LIBs, which are superior to most of the recently reported 2D carbon materials.
Experimental
Synthesis of Zn–bim based MOFs
Zn(NO3)2·6H2O (AR, >99.0%), sodium gluconate (BP, >98.0%), benzimidazole (bim, 98%), and diethylamine (AR, >99.0%) were purchased from Sinopharm Chemical Reagent Co., Ltd. Other chemicals were of AR grade and purchased from Xilong Scientific Co., Ltd. All the chemicals were used without further purification. The illustrations of the synthetic processes for Zn2(bim)4, Zn(bim)(OAc), and UT-Zn(bim)(OAc) are shown in Scheme 1. Zn2(bim)4 was synthesized by a reported solvothermal method.17 Typically, 7.5 mmol of Zn(NO3)2·6H2O and 5.0 mmol of bim were dissolved in 40.0 mL of dimethylformamide mixed with 2.5 mmol of diethylamine and stirred for 10 min. Subsequently, the mixture was transferred into a Teflon-lined stainless steel autoclave and kept at 140 °C for 36 h. The precipitate was collected by vacuum filtration, washed with ethanol, and dried at 60 °C for 5 h. The yield of the product (i.e., Zn2(bim)4) was about 7% based on bim.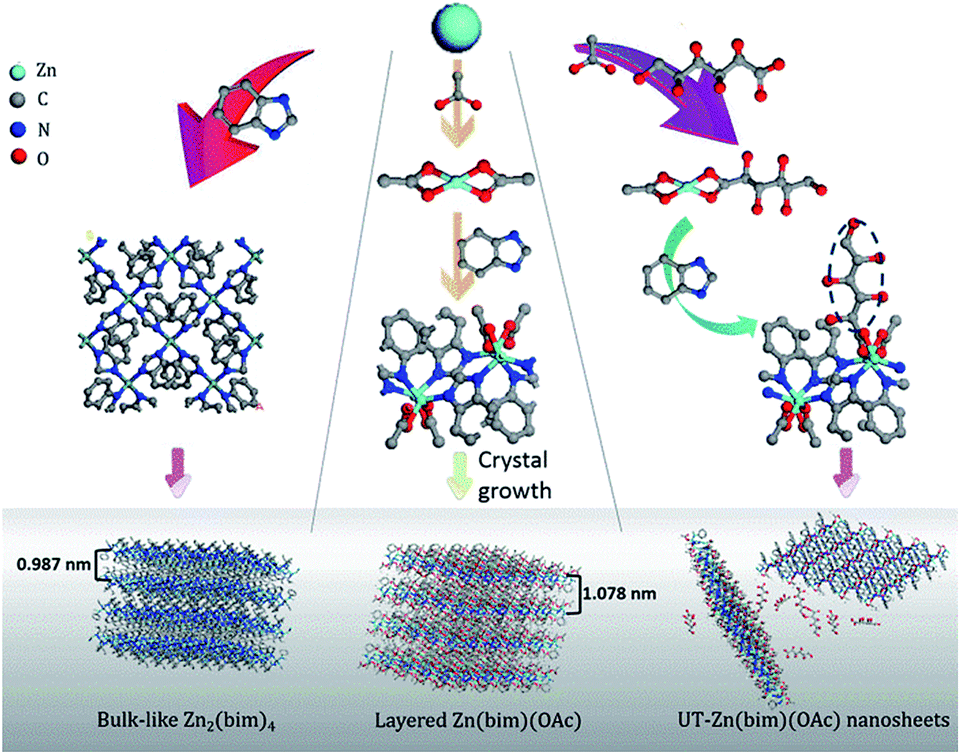 | ||
| Scheme 1 Schematic illustrations of the synthesis of Zn2(bim)4, Zn(bim)(OAc), and UT-Zn(bim)(OAc). | ||
Zn(bim)(OAc) was synthesized under ambient conditions. In detail, 5.0 mmol of bim was dissolved in 50.0 mL of ethanol to form a bim/ethanol solution. Then 50.0 mL of ethanol/water (1![[thin space (1/6-em)]](https://www.rsc.org/images/entities/char_2009.gif) :1, v/v) dissolved with 5.0 mmol of Zn(NO3)2·6H2O was rapidly added into 50.0 mL of 0.1 mol L−1 CH3COONa solution under continuous stirring. The mixture was further stirred for 10 min. Then the pre-prepared bim/ethanol solution was added dropwise into the mixture (at about 1 drop per second) under ultrasonication. The obtained white solution was kept at 100 °C until all the solvents were evaporated, and then the remaining solids were washed with ethanol and deionized (DI) water three times to remove the unreacted reagents (i.e., bim, Zn(NO3)2·6H2O, and CH3COONa). Finally, the Zn(bim)(OAc) was obtained by drying the washed solids at 60 °C for 5 h. The yield of the Zn(bim)(OAc) was about 87% based on bim (see Fig. S1 in the ESI†).
:1, v/v) dissolved with 5.0 mmol of Zn(NO3)2·6H2O was rapidly added into 50.0 mL of 0.1 mol L−1 CH3COONa solution under continuous stirring. The mixture was further stirred for 10 min. Then the pre-prepared bim/ethanol solution was added dropwise into the mixture (at about 1 drop per second) under ultrasonication. The obtained white solution was kept at 100 °C until all the solvents were evaporated, and then the remaining solids were washed with ethanol and deionized (DI) water three times to remove the unreacted reagents (i.e., bim, Zn(NO3)2·6H2O, and CH3COONa). Finally, the Zn(bim)(OAc) was obtained by drying the washed solids at 60 °C for 5 h. The yield of the Zn(bim)(OAc) was about 87% based on bim (see Fig. S1 in the ESI†).
UT-Zn(bim)(OAc) was synthesized by using a hydrophilic gluconate-assisted method (GA-method). The synthetic route for UT-Zn(bim)(OAc) was the same as that for Zn(bim)(OAc) except for that 200 mg of sodium gluconate was added into the Zn(NO3)2 solution followed by an ultrasonication treatment to form a homogeneous solution. The yield of the UT-Zn(bim)(OAc) was about 65% based on bim (Fig. S1†). For comparison, other amounts of sodium gluconate (i.e., 50, 500, 1000, and 2000 mg) were also used for the synthesis of Zn(bim)(OAc), and the corresponding products were denoted as Zn(bim)(OAc)50mg, Zn(bim)(OAc)500mg, Zn(bim)(OAc)1000mg, and Zn(bim)(OAc)2000mg, respectively. The Zn(bim)(OAc) samples prepared with hydrophobic long-chain carboxylates (e.g., sodium butyrate and sodium laurate) were also obtained by the same route and named Zn(bim)(OAc)butyrate and Zn(bim)(OAc)laurate, respectively (see details in the ESI†).
Preparation of the carbon materials from the synthesized Zn–bim based MOFs
The carbon nanocubes (CNCs), layered carbon nanocubes (L-CNCs), and UT-CNSs were prepared through carbonization of the as-prepared Zn2(bim)4, Zn(bim)(OAc), and UT-Zn(bim)(OAc), respectively. In a typical procedure, the as-synthesized Zn–bim based MOFs were annealed at 800 °C for 3 h in an Ar/H2 (10% v/v) atmosphere with a heating rate of 5 °C min−1. After that, the pyrolysis-derived products were washed with 1 M HCl to remove the Zn and ZnO (formed during the carbonization process), thoroughly rinsed using DI water, and then dried at 60 °C for 5 h. The yields of CNCs, L-CNCs, and UT-CNSs carbonized from their corresponding MOF precursors are about 27.2%, 20.8%, and 20.1%, respectively, based on the total mass. Considering that the theoretical carbon content in the MOF precursors is about 44 wt% for Zn(bim)(OAc) and 56 wt% for Zn2(bim)4, the yields of CNCs, L-CNCs, and UT-CNSs are about 48.6%, 47.2%, and 45.7%, respectively, based on carbon.Physicochemical characterization
The morphologies and compositions of the CNCs, L-CNCs, UT-CNSs, and Zn–bim based MOFs were investigated using a scanning electron microscope (SEM, FEI Nova™ NanoSEM 230) equipped with an energy dispersive X-ray spectroscopy (EDS) system at an accelerating voltage of 15 kV and a high-resolution transmission electron microscope (TEM, JEOL JEM-2100F) operated at 300 kV. The high angle annular dark field (HAADF) image and EDS mapping analysis were obtained using a spherical aberration corrected scanning transmission electron microscope (FEI Titan G2 60-300) equipped with an EDS system. The thickness of the nanosheet samples was characterized using an atomic force microscope (AFM, Veeco Multimode). The bonding states and chemical compositions of the Zn–bim based MOFs were investigated by Fourier transform infrared spectroscopy (FT-IR, Nicolet 6700) and elemental analysis (EA, PerkinElmer 2400). The Zn content in the synthesized Zn–bim based MOFs was measured using an inductively coupled plasma optical emission spectrometer (ICP-OES, PerkinElmer Optima 5300 DV). For the ICP-OES test, 2.0 mg of the synthesized Zn–bim MOFs were dissolved in ∼10 mL HCl (5 wt%) and then diluted with DI water in a 250.00 mL volumetric flask. The diluted solution was injected into the ICP-OES at a rate of 1.5 mL min−1 and a plasma power of 1300 W. The crystalline structures of the samples were characterized by X-ray diffraction (XRD, Rigaku D/max 2500) using Cu Kα radiation (λ = 0.15418 nm) and Raman spectroscopy (LabRAM HR, HORIBA) with a HeNe laser (λ = 633 nm). The XRD data were collected at 40 kV and 250 mA in the 2θ range of 5–80° (for carbon materials) or 5–40° (for Zn–bim based MOFs) in the linear focal spot mode with a graphite monochromator. The surface chemical compositions of the samples were characterized by X-ray photoelectron spectroscopy (XPS, ThermoFisher ESCALAB 250Xi) with an Al Kα source (λ = 1486.6 eV). The C 1s peak at 284.6 eV was used as a reference to correct the specimen charging of the XPS spectra. The fitting of peaks was performed after Shirley background subtraction. The pore structures of the CNCs, L-CNCs, UT-CNSs, and Zn–bim based MOFs were analyzed based on the nitrogen adsorption–desorption measurements conducted at 77 K (Quantachrome, Autosorb 6iSA). The electrical conductivities of the samples were obtained using a four-point probe system (RTS-8, 4 probes TECH). In order to measure the electrical conductivity, the powder sample was compressed into a flake at a pressure of 10 MPa, and the thicknesses of the flakes are about 2.2 mm.Electrochemical measurements
The performance of the CNCs, L-CNCs and UT-CNSs as the electrode materials for SCs was measured in 6 M KOH at room temperature in a three-electrode cell with a platinum plate as the counter electrode and a saturated calomel electrode (SCE) as the reference electrode in the potential range of −1 to 0 V (vs. SCE). The performance of the prepared UT-CNSs as the anode materials for LIBs was evaluated in a CR2016-type coin cell using a piece of Li metal as the counter electrode and 1 M LiPF6 in 1:1 v/v dimethyl carbonate/ethylene carbonate (Guangzhou Tinci Materials Technology Co., Ltd) as the electrolyte. More details about the electrochemical measurements are in the ESI.†
Results and discussion
The crystalline structures of the as-prepared Zn–bim based MOFs were investigated by XRD. Fig. 1a (the black curve) shows the diffraction pattern of the Zn2(bim)4, which matches well with the simulated XRD pattern of the layered Zn2(bim)4 crystal (ref. no. 675375, the Cambridge Structural Database (CSD)). Besides, the XRD pattern of the Zn(bim)(OAc) (the red curve in Fig. 1a) was indexed and refined (P21/c, a = 10.817 Å, b = 9.834 Å, c = 8.817 Å, β = 98.95°, see Fig. S2†). The result shows that the crystalline structure of the Zn(bim)(OAc) matches well with that of a previously reported layer-structured poly[μ2-acetato-μ2-benzimidazolato-zinc(II)] coordination polymer.27 The interactions between the adjacent layers are weak van der Waals forces, and each layer is constructed by two kinds of chains (i.e., the Zn2(bim)4 chains along the b axis and the Zn2(OAc)4 chains along the c axis) cross-connected by Zn2+ (Fig. S3†). Furthermore, the diffraction peaks of the UT-Zn(bim)(OAc) (the blue curve in Fig. 1a) match well with those of the Zn(bim)(OAc), indicating that the crystalline structure of the UT-Zn(bim)(OAc) remains the same as that of the Zn(bim)(OAc). It is worth mentioning that the (100) and (110) peaks of the UT-Zn(bim)(OAc) slightly shift to lower diffraction angles compared to those of the Zn(bim)(OAc), as shown in Fig. 1b. This phenomenon indicates that the interplanar distances along the [100] and [110] directions in UT-Zn(bim)(OAc) are larger than those in Zn(bim)(OAc), which could facilitate the formation of the layered crystals with low thicknesses.12 The chemical composition investigations (see details in Table S1†) show that the molar ratio of [Zn]:[bim] in the Zn2(bim)4 is about 1:2, whereas the molar ratios of [Zn]: [bim]:[OAc] in the Zn(bim)(OAc) and UT-Zn(bim)(OAc) are about 1:1:1, which are consistent with the corresponding chemical formula.
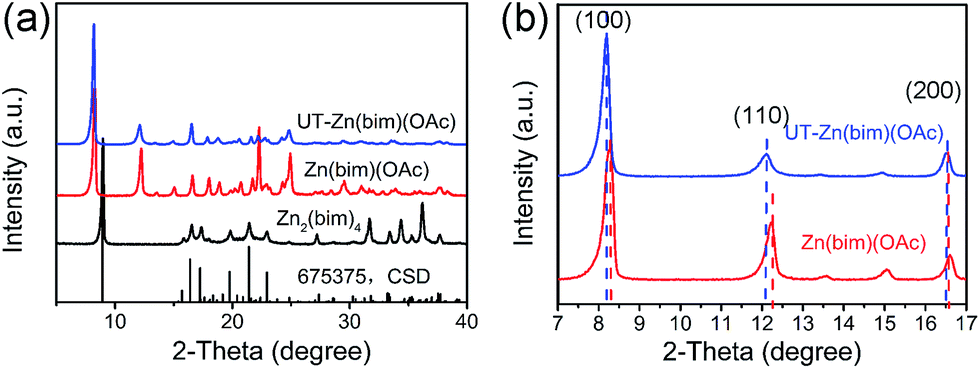 | ||
| Fig. 1 (a) XRD patterns of the as-synthesized Zn2(bim)4 (black curve), Zn(bim)(OAc) (red curve), and UT-Zn(bim)(OAc) (blue curve). The simulated XRD pattern of the layered Zn2(bim)4 crystal based on the crystal structure ref. no. 675375 in the CSD is also shown at the bottom of the plot. (b) Comparison of the XRD patterns of the UT-Zn(bim)(OAc) (blue curve) and Zn(bim)(OAc) (red curve) obtained at a slow scan rate of 0.5° min−1 in the 2θ range of 7 to 17°. | ||
The morphologies of the as-synthesized Zn2(bim)4, Zn(bim)(OAc), UT-Zn(bim)(OAc), Zn(bim)(OAc)butyrate, and Zn(bim)(OAc)laurate were characterized by SEM, TEM, and AFM. The SEM results show that the UT-Zn(bim)(OAc) has a sheet-like morphology (Fig. 2a), whereas the Zn(bim)(OAc)butyrate, Zn(bim)(OAc)laurate, Zn2(bim)4, and Zn(bim)(OAc) show a bulk-like morphology (Fig. S4 and S5†). The representative AFM height profile (Fig. 2b) reveals that the UT-Zn(bim)(OAc) sheets have fairly flat surfaces with an average thickness of ∼5.12 nm. The statistical analyses (based on the AFM measurements) on the thickness and size (diameter) of the UT-Zn(bim)(OAc) nanosheets are shown in Fig S6 in the ESI.† The results reveal that the thicknesses of the UT-Zn(bim)(OAc) nanosheets are basically in the range of 1.0 to 6.5 nm (with most of the nanosheets around 5 nm), and most of the UT-Zn(bim)(OAc) nanosheets have a size around 2.6 μm. These results demonstrate that the UT-Zn(bim)(OAc) nanosheets have been successfully prepared through the GA-method. The TEM image (Fig. 2c) further exhibits the few-layer structure of the UT-Zn(bim)(OAc) nanosheets. The high-resolution TEM (HRTEM) image of the UT-Zn(bim)(OAc) nanosheet (Fig. 2d) displays a d-spacing of 1.08 nm, which corresponds to the (100) planes of Zn(bim)(OAc). It is worth mentioning that the characterization of MOF nanosheets by HRTEM has been known to be difficult due to the rapid degradation of the inorganic–organic frameworks exposed to electron beam irradiation.22 Therefore, the successful acquisition of the lattice fringes of the UT-Zn(bim)(OAc) nanosheet indicates its excellent stability.
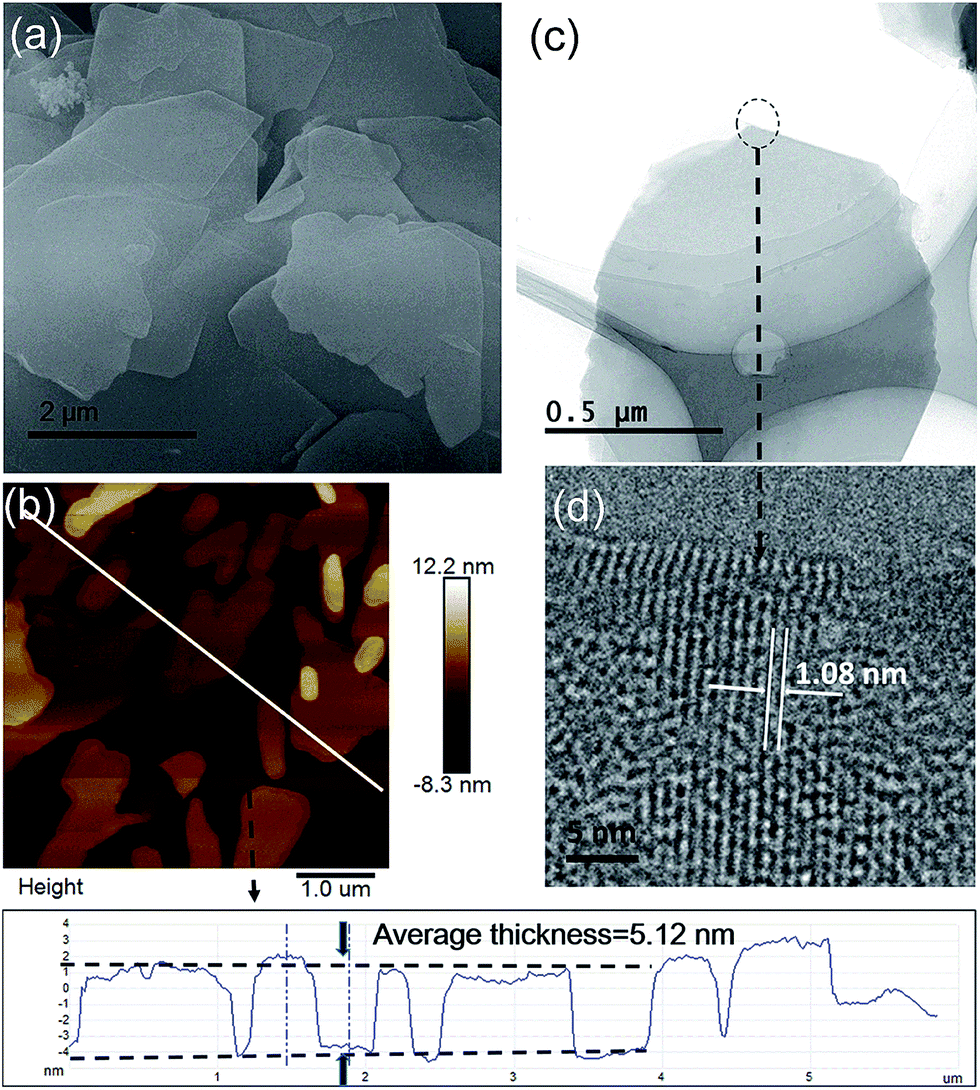 | ||
| Fig. 2 (a) SEM image, (b) AFM image and height profile, (c) TEM image, and (d) HRTEM image of the UT-Zn(bim)(OAc) nanosheets. | ||
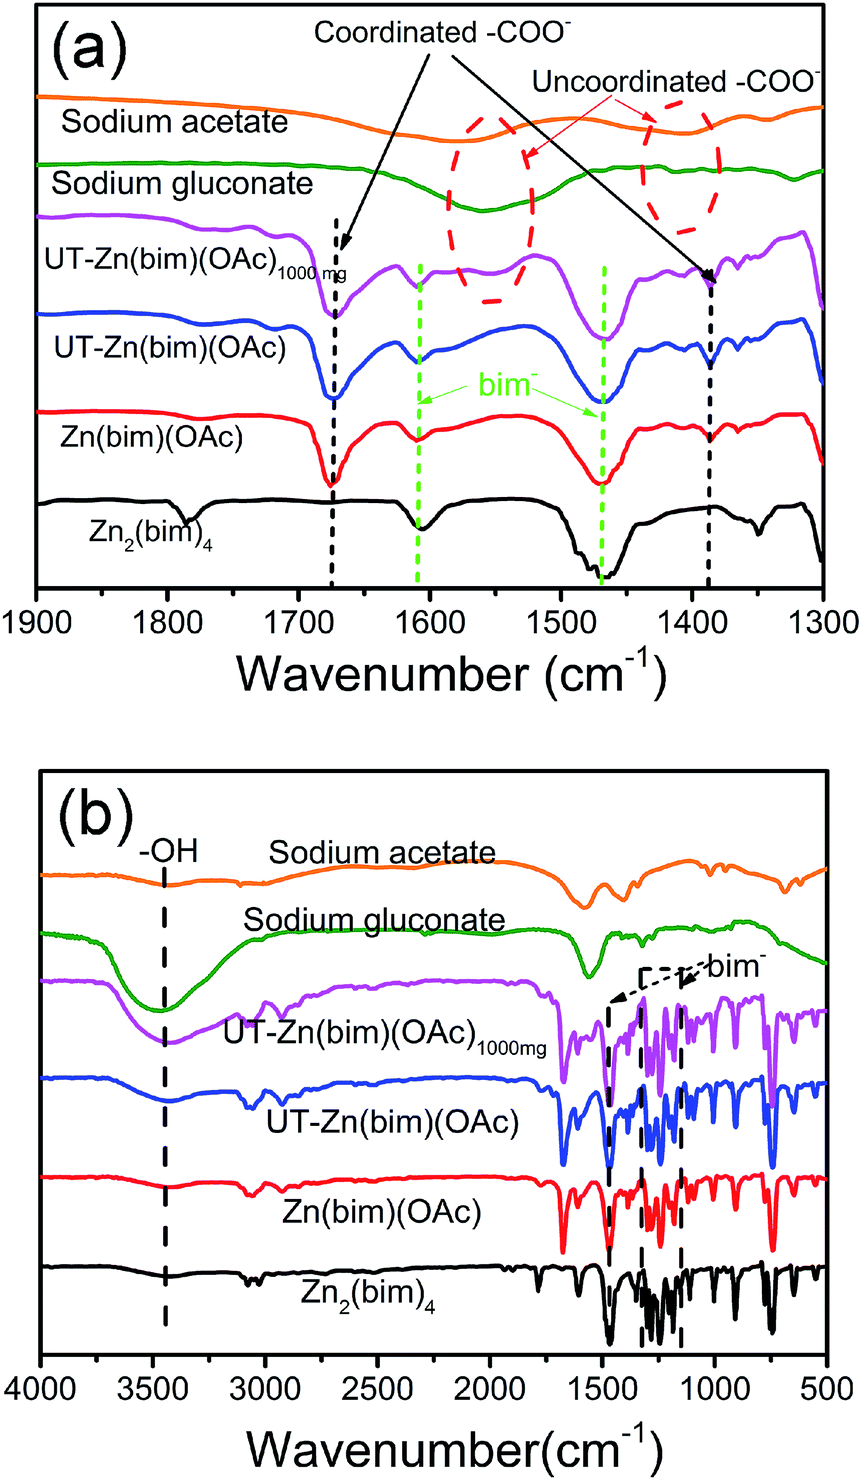
In order to clarify the roles of gluconate and CH3COO− in the synthesis of the UT-Zn(bim)(OAc) nanosheets, the as-synthesized Zn–bim based MOFs were studied by FT-IR. Generally, sodium acetate and sodium gluconate (i.e., the uncoordinated –COO− groups) in a typical FT-IR spectrum (Fig. 3a) would have one characteristic stretching vibration peak at around 1570 cm−1, which is due to the formation of the resonance hybrids through equal distribution of the charges between the two oxygen atoms of –COO−.28 However, the FT-IR spectra of the Zn(bim)(OAc) and UT-Zn(bim)(OAc) both exhibit two peaks at about 1650 and 1375 cm−1 due to the v(–C![[double bond, length as m-dash]](https://www.rsc.org/images/entities/char_e001.gif) O)– and v(–C–O)-stretching vibrations, respectively. This result indicates that the –COO− has probably coordinated with the Zn ions in the Zn(bim)(OAc) and UT-Zn(bim)(OAc). Besides, the –CO in the monodentate –COO− usually shows a peak at about 1740 cm−1, and therefore the shift of the –CO peak to around 1650 cm−1 in Zn(bim)(OAc) and UT-Zn(bim)(OAc) indicates that the –COO− groups probably function as the bidentate ligands when coordinated with the Zn ions (as shown in Scheme 1).29 Meanwhile, the FT-IR spectra of UT-Zn(bim)(OAc) show broad v(–OH)-stretching peaks around 3400 cm−1 and the intensity of these v(–OH)-stretching peaks increases as the usage of sodium gluconate during the synthesis increases (UT-Zn(bim)(OAc) vs. Zn(bim)(OAc)1000mg). These phenomena suggest the existence of gluconate in UT-Zn(bim)(OAc). No obvious peak corresponding to the uncoordinated carboxylate groups is found in the FT-IR spectrum of UT-Zn(bim)(OAc), indicating that the gluconate groups have probably coordinated with the Zn ions. As shown in Scheme 1, according to the synthetic procedures of UT-Zn(bim)(OAc), the Zn ions first coordinate with the acetate and gluconate. As the bim is added, most of the coordinated gluconate groups would be replaced by the bim, whereas a small amount of the gluconate would still coordinate with the Zn ions on the surface of the Zn(bim)(OAc) crystals. This proposed mechanism is based on the fact that the synthesized UT-Zn(bim)(OAc) and Zn(bim)(OAc) have the same crystalline structure (Fig. 1) and very similar chemical compositions, but the oxygen content in the UT-Zn(bim)(OAc) is slightly higher than that in the Zn(bim)(OAc) (Table S1†). In addition, we have also studied the capabilities of bim and gluconate to coordinate with Zn2+ (see details in Fig. S7†), and the results show that the bim has a stronger capability of coordination with Zn2+ compared to gluconate. The long chains of the gluconates coordinating with the Zn ions on a certain crystal plane (e.g., the (100) plane) of the Zn(bim)(OAc) crystals could inhibit the crystal growth in the direction perpendicular to that plane and therefore result in UT-Zn(bim)(OAc) nanosheets. Moreover, the N2 adsorption–desorption analysis (Fig. S8†) shows that the exposed surface area of the UT-Zn(bim)(OAc) (369.42 m2 g−1) is much larger than that of the Zn(bim)(OAc) (53.83 m2 g−1), which suggests a lower sheet thickness of the UT-Zn(bim)(OAc) compared to that of the Zn(bim)(OAc).
O)– and v(–C–O)-stretching vibrations, respectively. This result indicates that the –COO− has probably coordinated with the Zn ions in the Zn(bim)(OAc) and UT-Zn(bim)(OAc). Besides, the –CO in the monodentate –COO− usually shows a peak at about 1740 cm−1, and therefore the shift of the –CO peak to around 1650 cm−1 in Zn(bim)(OAc) and UT-Zn(bim)(OAc) indicates that the –COO− groups probably function as the bidentate ligands when coordinated with the Zn ions (as shown in Scheme 1).29 Meanwhile, the FT-IR spectra of UT-Zn(bim)(OAc) show broad v(–OH)-stretching peaks around 3400 cm−1 and the intensity of these v(–OH)-stretching peaks increases as the usage of sodium gluconate during the synthesis increases (UT-Zn(bim)(OAc) vs. Zn(bim)(OAc)1000mg). These phenomena suggest the existence of gluconate in UT-Zn(bim)(OAc). No obvious peak corresponding to the uncoordinated carboxylate groups is found in the FT-IR spectrum of UT-Zn(bim)(OAc), indicating that the gluconate groups have probably coordinated with the Zn ions. As shown in Scheme 1, according to the synthetic procedures of UT-Zn(bim)(OAc), the Zn ions first coordinate with the acetate and gluconate. As the bim is added, most of the coordinated gluconate groups would be replaced by the bim, whereas a small amount of the gluconate would still coordinate with the Zn ions on the surface of the Zn(bim)(OAc) crystals. This proposed mechanism is based on the fact that the synthesized UT-Zn(bim)(OAc) and Zn(bim)(OAc) have the same crystalline structure (Fig. 1) and very similar chemical compositions, but the oxygen content in the UT-Zn(bim)(OAc) is slightly higher than that in the Zn(bim)(OAc) (Table S1†). In addition, we have also studied the capabilities of bim and gluconate to coordinate with Zn2+ (see details in Fig. S7†), and the results show that the bim has a stronger capability of coordination with Zn2+ compared to gluconate. The long chains of the gluconates coordinating with the Zn ions on a certain crystal plane (e.g., the (100) plane) of the Zn(bim)(OAc) crystals could inhibit the crystal growth in the direction perpendicular to that plane and therefore result in UT-Zn(bim)(OAc) nanosheets. Moreover, the N2 adsorption–desorption analysis (Fig. S8†) shows that the exposed surface area of the UT-Zn(bim)(OAc) (369.42 m2 g−1) is much larger than that of the Zn(bim)(OAc) (53.83 m2 g−1), which suggests a lower sheet thickness of the UT-Zn(bim)(OAc) compared to that of the Zn(bim)(OAc).
 | ||
| Fig. 3 FT-IR spectra of sodium acetate (orange), sodium gluconate (green), Zn(bim)(OAc)1000mg (pink), UT-Zn(bim)(OAc) (blue), Zn(bim)(OAc) (red), and Zn2(bim)4 (black) in the wavenumber range of (a) 1300 to 1900 cm−1 and (b) 500 to 4000 cm−1. The peaks from the bim are as marked in the plots. | ||
The synthesized UT-Zn(bim)(OAc) nanosheets were directly converted to UT-CNSs by carbonization in an Ar/H2 atmosphere for application in energy storage. For comparison, the Zn(bim)(OAc) and Zn2(bim)4 were also carbonized under the same conditions and their products were named L-CNCs and CNCs, respectively. The SEM images (Fig. 4a and S9†) show that the morphologies of the UT-CNSs, L-CNCs, and CNCs are similar to their corresponding MOF precursors. That is, the UT-CNSs derived from the UT-Zn(bim)(OAc) have a sheet-like morphology (Fig. 4a and S10†), whereas the L-CNCs and CNCs both show bulk-like morphologies (Fig. S9†). In addition, the 2D structure of the UT-CNSs is clearly displayed in the TEM image in Fig. 4b. The edge widths of the UT-CNSs are in the range of 1 to 3 μm. The EDS mapping analysis (Fig. S11†) shows the uniform distribution of C and N on the surface of the UT-CNSs. Fig. 4c shows a representative AFM measurement on the size and thickness of an individual nanosheet of the UT-CNSs. The statistical analyses on the thickness and size of the UT-CNSs (based on the AFM measurements of 57 UT-CNSs) are shown in Fig. S12 in the ESI.† The average thickness of the UT-CNSs is about 2.5 ± 0.8 nm (with a thickness range of 1.8 to 3.3 nm) and the average size of the UT-CNSs is around 2.5 ± 1.1 μm. In general, the obtained UT-CNSs are thinner than the precursor UT-Zn(bim)(OAc) nanosheets due to the volume shrinkage of the MOFs during the carbonization.30 The results above show that the obtained UT-CNSs are few-layer nanosheets with low thicknesses, which are expected to be one of the most promising structures for ultrafast ion charge and discharge.31
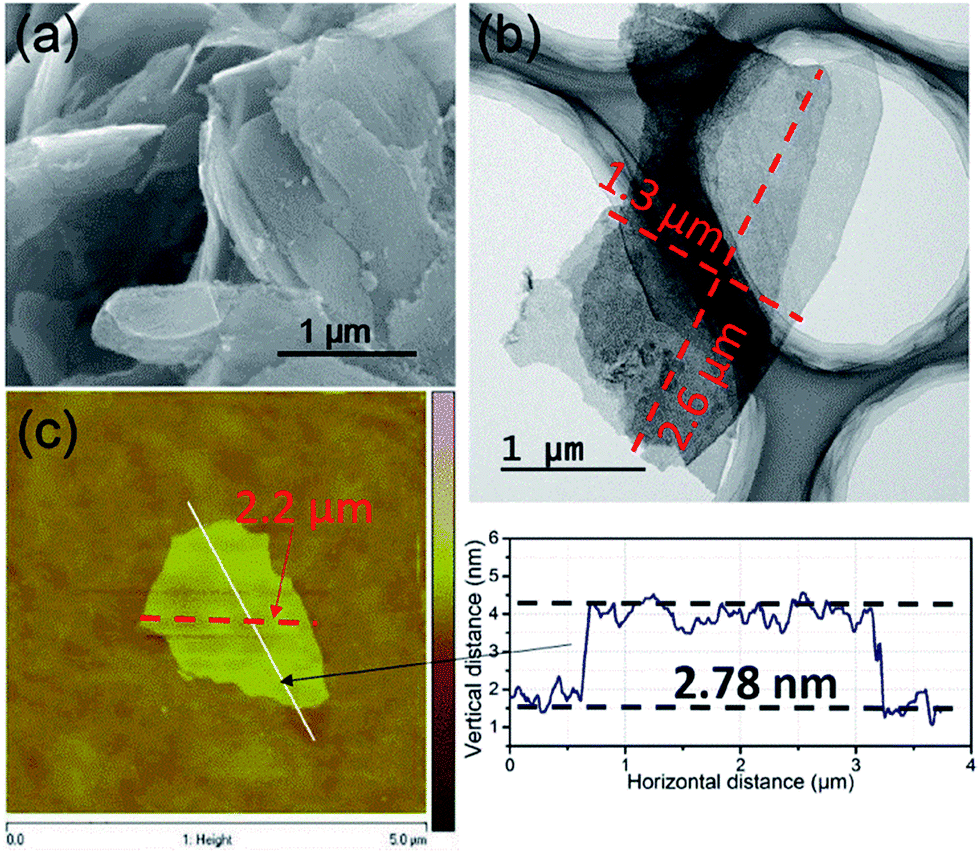 | ||
| Fig. 4 (a) SEM, (b) TEM, and (c) AFM images with measured dimensions of the UT-CNSs. | ||
The structures of the UT-CNSs, L-CNCs, and CNCs were studied by XRD and Raman spectroscopy. As shown in Fig. 5a, two broad peaks can be found in their XRD patterns around the 2-theta angles of 24 and 44°, corresponding to the (002) and (101) planes of the amorphous carbon, respectively.32 The broad D and G peaks revealed in their Raman spectra (Fig. 5b) arise from the defective graphitic structure of the sp3-phase and the ordered graphene layers of the sp2-phase, respectively.33 Besides, the peak intensity ratios of D to G (ID/IG) of the UT-CNSs (1.059), L-CNCs (1.088), and CNCs (1.079) are close to 1, which are consistent with those of the reported amorphous carbon materials.34 Moreover, the UT-CNSs show the lowest ID/IG ratio among these three MOF-derived carbon materials, indicating the highest degree of graphitic ordering of UT-CNSs.27 A higher degree of graphitization could result in a higher electronic conductivity and stability of the materials.35
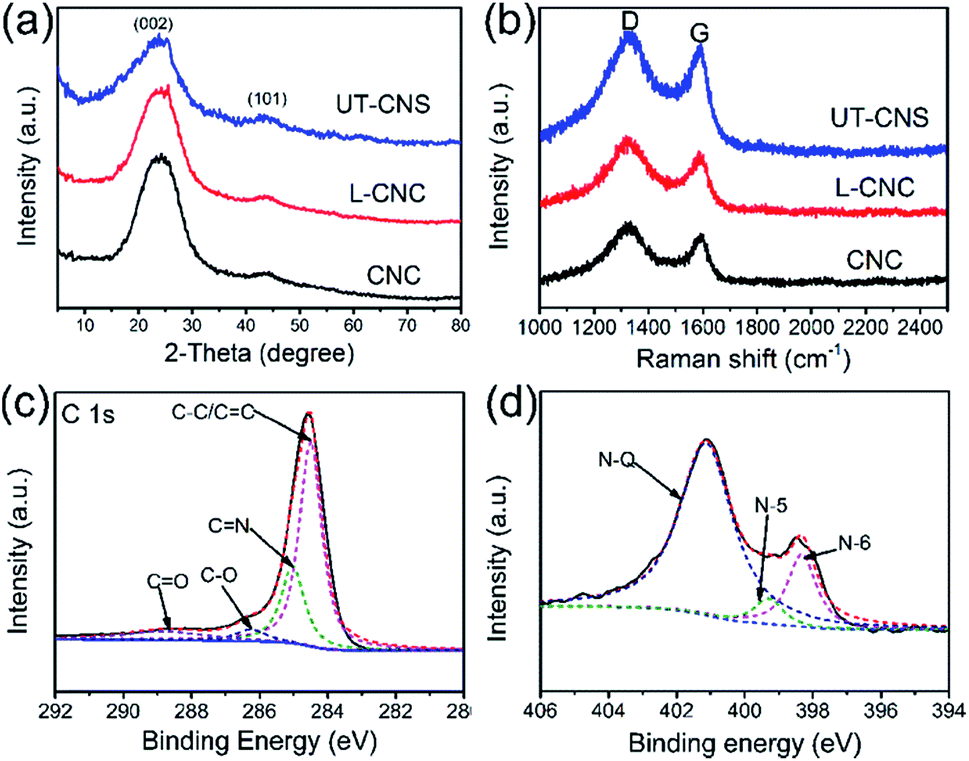 | ||
| Fig. 5 (a) XRD patterns and (b) Raman spectra of UT-CNSs, L-CNCs, and CNCs. High resolution (c) C 1s and (d) N 1s XPS spectra of UT-CNSs. | ||
The surface chemical compositions of the UT-CNSs, L-CNCs, and CNCs were investigated by XPS. The XPS survey scans (Fig. S13†) show that the main elements on the surfaces of the UT-CNSs, L-CNCs, and CNCs are carbon, oxygen, and nitrogen (Table 1). The zinc content in them is below 0.1 at%, which implies that the zinc has been removed by high-temperature evaporation combined with the HCl treatment. The XPS spectra of the UT-CNSs, L-CNCs, and CNCs show that the chemical bonding states in them vary only slightly (Fig. S13† and Table 1), so the high-resolution XPS spectra of the UT-CNSs are discussed as representatives. The high-resolution C 1s spectrum of the UT-CNSs (Fig. 5c) can be deconvoluted into four peaks at 284.7, 285.6, 286.8, and 287.9 eV, corresponding to the CC (sp2 C), CN, C–O, and CO, respectively.36 The high content of the sp2 C in the UT-CNSs evidences that the abundant graphitic domains have been constructed. The CN peak demonstrates the existence of nitrogen in the UT-CNSs, mainly derived from the benzimidazole. The nitrogen in the UT-CNSs can be assigned to three different forms as previously reported,37i.e., the quaternary (N-Q, 401.0 eV), pyrrolic or pyridonic (N-5, 399.8 eV), and pyridinic (N-6, 398.6 eV) nitrogen, as shown in Fig. 5d. The N-Q is also called the graphitic N, which anchors at the center position of the graphitic lattice and can effectively improve the electric conductivity of carbon materials. The N-5 is one of the unstable doping atoms for carbon-based electrode materials. The N-6 is considered to represent the pseudocapacitance effect or provide active sites for Li storage.38 The contents of the three forms of nitrogen in the UT-CNSs, L-CNCs, and CNCs are given in Table 1. The high content of nitrogen and abundant N-Q (3.66 at%) and N-6 within the UT-CNSs could result in a superior electric conductivity and abundant active sites, ensuring that UT-CNSs can meet the requirements for electrode materials for high power energy storage.6
| Sample | Conductivity [S cm−1] | S BET [m2 g−1] | V [cm−3 g−1] | C [at%] | O [at%] | N [at%] | |||
|---|---|---|---|---|---|---|---|---|---|
| Total | N-5 | N-6 | N-Q | ||||||
| UT-CNS | 4.5 | 1535.24 | 1.92 | 91.82 | 2.24 | 5.92 | 0.53 | 1.34 | 3.05 |
| L-CNC | 3.8 | 1453.24 | 1.21 | 91.74 | 2.45 | 5.72 | 0.77 | 1.93 | 3.02 |
| CNC | 3.6 | 1132.25 | 1.01 | 91.51 | 1.92 | 6.47 | 0.95 | 2.34 | 3.18 |
The porosities of the UT-CNSs, L-CNCs, and CNCs were obtained from their nitrogen adsorption–desorption isotherms. The N2 adsorption–desorption curves (Fig. 6a) of these three carbon materials all belong to a type-IV isotherm. As shown in Table 1, the BET specific surface areas of the UT-CNSs, L-CNCs, and CNCs are 1836, 1321, and 1098 m2 g−1, respectively. The UT-CNSs obtained by the GA-assisted method in this work have a much higher specific surface area than the other two bulk-like carbon materials. The abrupt changes in the N2 adsorption–desorption curves at the relative pressure of about 0 and the existence of hysteresis loops at relative pressures above 0.4 indicate that the pore structures of these carbon materials consist of mostly micropores and partially mesopores.29 Moreover, the UT-CNSs and L-CNCs exhibit larger hysteresis loops compared to the CNCs, revealing more developed mesopores in the UT-CNSs and L-CNCs that are beneficial for fast ion storage and release.39 The pore size distributions (Fig. 6b) of these three carbon samples are further determined by density functional theory (DFT). The micropore distribution peaks of these three materials are centered at about 1.2 nm. The micropores might be formed from the gas generation during the carbonization and/or the porous structures of the MOF precursors. The main mesopore peaks of the UT-CNSs, L-CNCs, and CNCs are centered at about 3.8 nm, which could be mainly attributed to the removal of the nanosized metallic zinc or zinc oxide particles formed during the carbonization of these Zn-based MOF precursors by the HCl treatment. The HRTEM images of the UT-CNSs (Fig. 6c and d) and the high-angle annular dark field (HAADF) image of the UT-CNSs (Fig. S11†) also reveal the highly porous nature of the UT-CNSs. The diameters of the mesopores shown in these microscopic images are about 3.8 nm, consistent with the result of the pore size distribution analysis. Due to the presences of these pores in the UT-CNSs, abundant microchannels could be accessible for fast ion transport when the UT-CNSs are used as an energy storage material.3
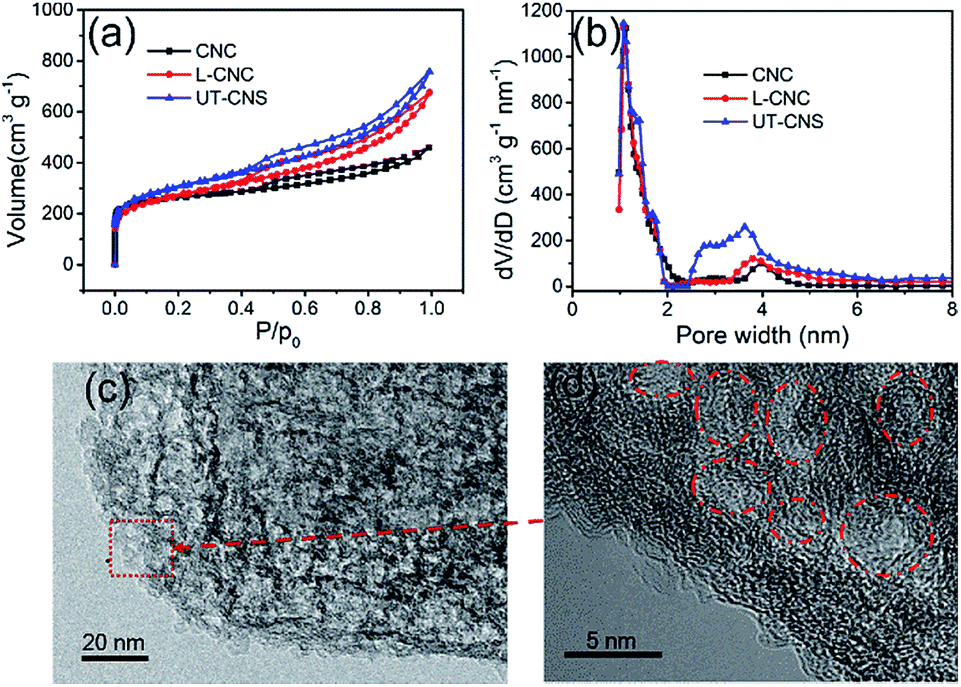 | ||
| Fig. 6 (a) N2 adsorption–desorption isotherms and (b) pore-size distributions of the UT-CNSs, L-CNCs, and CNCs. (c) & (d) High-resolution TEM images showing the pores in the UT-CNSs (marked by the red circles). | ||
The electrochemical performance of the UT-CNSs as the electrode material for SCs was investigated in 6 M KOH at room temperature. The cyclic voltammograms (CVs) of the UT-CNS electrode at different scan rates (Fig. 7a) all show an approximately rectangular shape without obvious redox peaks, which is the characteristic of the electrochemical double layer capacitance (EDLC) behavior of the carbon-based materials in alkaline electrolytes.40 It is worth mentioning that the CVs of the UT-CNS electrode at a high scan rate of 200 mV s−1 shows no obvious distortion, revealing a small equivalent series resistance and the fast charge-propagation capability of the UT-CNSs.35 The excellent linear relationships between the evolved charge/discharge current densities and scan rates for the UT-CNS electrode (Fig. 7b) also verify its remarkably fast charge/discharge capability even at high scan rates.37 The galvanostatic charge–discharge profiles of the UT-CNS electrode (Fig. 7c) barely show an IR drop at the beginning of the discharge curves, implying a good electrochemical capacitive characteristic and a low internal resistance of the UT-CNS electrode.41 The charge-transfer resistance (Rct) of the UT-CNS electrode calculated from the high frequency region of the Nyquist plot (Fig. 7d) is the lowest and the electric conductivity of the UT-CNSs measured by the four point probe method is the highest among the three synthesized MOF-derived carbon materials (Table 1). The specific capacitances of the UT-CNSs at different current densities are calculated from the corresponding discharge curves and plotted in Fig. 7e. For comparison, the specific capacitances of the CNC, L-CNC and recently reported CNS materials are also shown in Fig. 7e and Table 2. The UT-CNSs have a specific capacitance of 347 F g−1 at the current density of 0.5 A g−1, which is higher than those of the CNC, L-CNC, and recently reported CNS materials. Even at a high current density of 10 A g−1, the UT-CNSs still exhibit the highest gravimetric capacitance (283 F g−1) among the previously reported carbon sheet materials (as shown in Table 2) as well as the recently reported MOF-derived carbon materials as reviewed in the literature.42 It is also worth mentioning that the amount of the gluconate used during the synthesis would affect the morphologies of the Zn(bim)(OAc) MOF precursor as well as its carbonized product (Fig. S14†). Based on our measurements, the UT-CNSs derived from the UT-Zn(bim)(OAc) nanosheet synthesized by using 200 mg sodium gluconate show the best performance for SC applications (Fig. S15†). The capacitance retentions of the UT-CNSs, L-CNCs, and CNCs after charge–discharge for 5000 cycles at the current density of 5 A g−1 are 98.8%, 97.5%, and 98.2%, respectively (Fig. 7f). These results show that the UT-CNSs, CNCs, and L-CNCs all possess excellent cycling stability, comparable to the best performance of the carbon materials previously reported for SC electrodes.3,6,37,43,45–48,53 The high capacitance, great rate capability, and excellent cycling stability of the UT-CNSs could be ascribed to their high electric conductivity (due to the high degree of graphitization), low contact resistance of the 2D materials,32 and large ultrathin nanosheet morphology with a highly porous structure, which could provide fast charge transfer, suitable micro-channels for the fast diffusion of electrolyte ions (see details in Fig. S16†), and large active surfaces for ion storage.
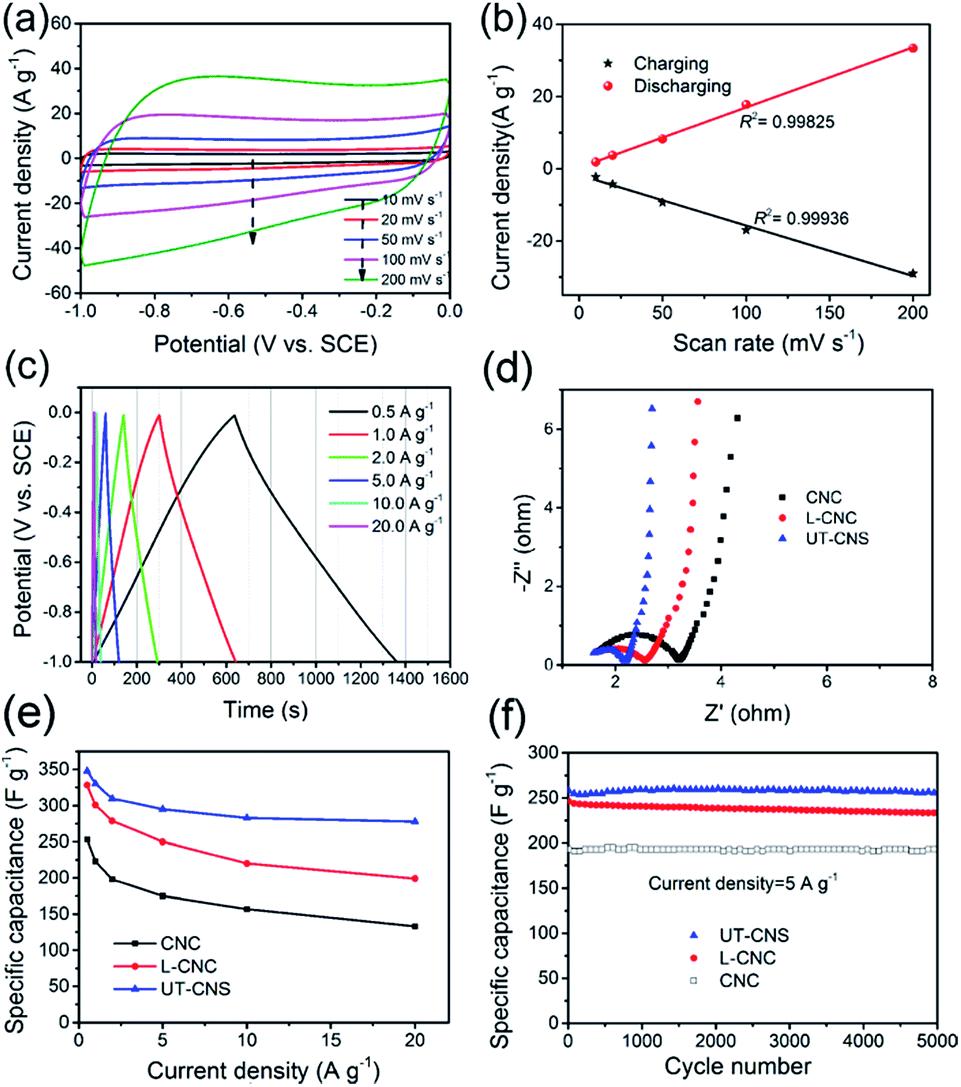 | ||
| Fig. 7 (a) Cyclic voltammograms of the UT-CNS electrodes at a scan rate of 50 mV s−1 in 6 M KOH at room temperature. (b) The dependence of the capacitive current density on the scan rate for the UT-CNS electrode. (c) Galvanostatic charge–discharge profiles of the UT-CNS electrode at different current densities. (d) Calculated specific capacitance at different current densities for the UT-CNS, L-CNC, and CNC electrodes. (e) EIS spectra of the UT-CNS, L-CNC, and CNC electrodes. (f) Long-term cycling performance of the UT-CNS, L-CNC, and CNC electrodes at the current density of 5 A g−1. | ||
| Samples | Electrolytes | C g at 0.5 A g−1 [F g−1] | C g at 10 A g−1 [F g−1] | Surface area [m2 g−1] | Thickness [nm] | Ref. |
|---|---|---|---|---|---|---|
| G-PCNS | 6 M KOH | 300 | 254 | 2774 | N/A | 43 |
| GA/NMC-95% | 1 M H2SO4 | 312 | 278 | 1569 | N/A | 4 |
| Silk derived PCNS | 6 M KOH | 201 | 152 | 2494 | 15–30 | 6 |
| Sandwich-type MCN | TEABF4/AN | 103 | — | 1293 | 17 | 37 |
| N,S-PCNs1-1 | 6 M KOH | 298 | 262 | 1589 | N/A | 39 |
| TPPs CNS | 6 M KOH | 342 | 201 | 810 | 17 | 44 |
| GNa-CA | 1 M H2SO4 | 212 | 168 | 1890 | 80 | 45 |
| PCNS | BMIM BF4/AN | 121 | 81 | 1945.7 | 20 | 46 |
| Nitrogen-doped PCNS | 1 M LiPF6 | 157 | 117 | 1735 | 100–200 | 47 |
| Oriented and interlinked PCNS | 6 M KOH | 257 | 201 | 2633 | 10–20 | 48 |
| N-PGCNS | 6 M KOH | 338 | 264 | 2129.8 | 80 | 49 |
| PFC-700 | 6 M KOH | 270 | 238 | 655 | 35–120 | 50 |
| RGNC-NS | 6 M KOH | 322 | 271 | 1946 | 5 | 35 |
| PN-ECB | 6 M KOH | 265 | 219 | 1440 | 3.5 | 51 |
| 3DG1000 | 6 M KOH | 231 | 208 | 1545 | N/A | 52 |
| UT-CNS | 6 M KOH | 347 | 283 | 1535 | 2.5 ± 0.8 | This work |
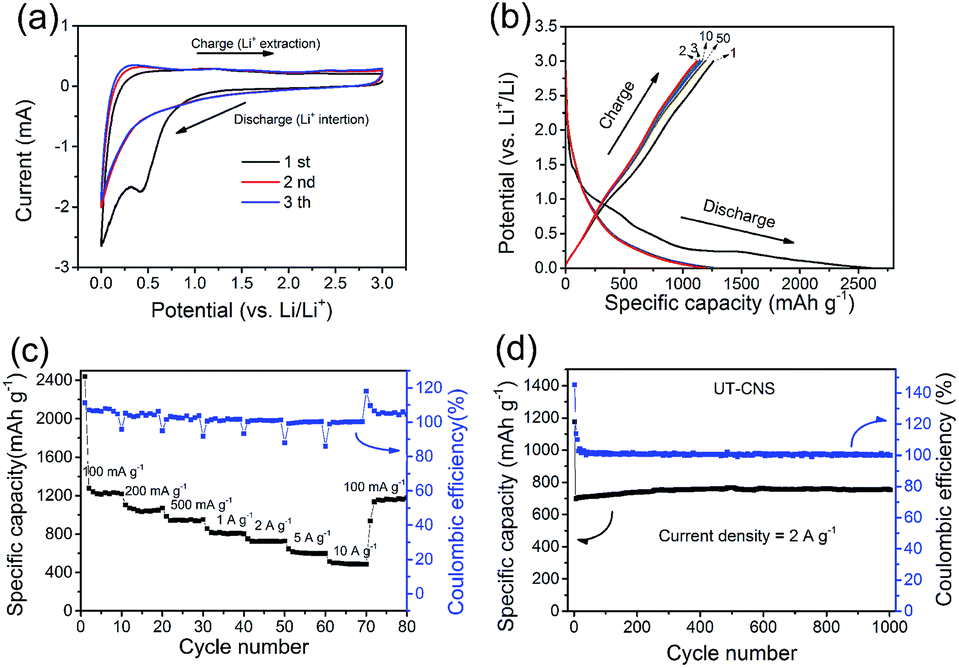
The performance of the UT-CNSs as the anode material for LIBs was also investigated. The first three CVs on the UT-CNS electrode at the scan rate of 0.5 mV s−1 (Fig. 8a) are typical CVs for carbon materials with a distinct peak at about 0.5 V in the first cycle, which is related to the formation of the solid–electrolyte interface (SEI).54 The 2nd and 3rd CVs are almost the same, suggesting the good stability of the UT-CNSs. In addition, the capacities of the UT-CNSs at different current densities are calculated from the galvanostatic charge–discharge curves (Fig. 8b). The initial discharge capacity of the UT-CNSs at the current density of 100 mA g−1 is about 2493 mA h g−1, which decreases to 1229 mA h g−1 in the second cycle. The capacity loss of the UT-CNSs after the first cycle, similar to what has been previously reported for other carbon materials as LIB anodes, is due to the decomposition of the electrolytes in the first discharge process.54 Moreover, the discharge curve of the UT-CNSs barely changes from the 2nd to the 50th cycle, indicating the high stability of the UT-CNSs as the LIB anode. As the current density increases to 0.2, 0.5, and 1 A g−1, the reversible capacities of UT-CNSs are stabilized at 1123, 961, and 840 mA h g−1, respectively. Even at a higher current density of 10 A g−1, the UT-CNSs still exhibit a high reversible capacity of 553 mA h g−1, showing great potential for application in high-power LIBs. The excellent rate capability of the UT-CNSs could be ascribed to their ultrathin sheet-morphology and porous structure, which reduce the distance of lithium ion diffusion.55,56 Furthermore, the UT-CNSs present a highly stable cycling performance at the current density of 2 A g−1 for 1000 cycles (Fig. 8d). The coulombic efficiency almost remains stable at 100% and a reversible capacity of 712 mA h g−1 is obtained after 1000 cycles.
 | ||
| Fig. 8 Performance of the UT-CNSs as the anode material for LIBs. (a) CV curves at the scan rate of 0.5 mV s−1, (b) charge–discharge profiles at the current density of 100 mA g−1, (c) rate performance at current densities from 100 to 10000 mA g−1, and (d) cycling performance at the current density of 2 A g−1 for 1000 cycles. | ||
Conclusions
In summary, a facile and low-cost approach (i.e., the GA-assisted method) is developed for the synthesis of the UT-Zn(bim)(OAc) nanosheets with a thickness of ∼5 nm and high yield of ∼65%. Subsequently, the N-doped UT-CNSs (with thicknesses of 2.5 ± 0.8 nm) with a high specific surface area, suitable porous structure, and high conductivity are obtained through carbonization of the as-synthesized UT-Zn(bim)(OAc) nanosheets. The UT-CNSs show high capacities, great rate capabilities, and excellent cycling stability as the electrode materials for both SCs and LIBs. The superior performance of the UT-CNSs could be mainly attributed to their ultrathin morphology, porous structure, and high conductivity, which could provide sufficient active specific surface area for ion storage and improve the ion diffusion and charge transfer during the charge–discharge. Such high-performance and high-yield MOF-derived porous UT-CNSs might hold great potential for the large-scale application in high-power energy storage. In addition, the strategy developed in this work for the high-yield and controllable synthesis of ultrathin Zn(bim)(OAc) MOF nanosheets should also be applicable for synthesizing other 2D MOF nanosheets for applications such as energy storage,57 catalysis,58 gas separation,59 and sensors.60Conflicts of interest
There are no conflicts to declare.Acknowledgements
This work was supported by the National Natural Science Foundation of China (grant nos. 51372278, U1507106, and 21303270), the Hunan Provincial Science and Technology Plan Project, China (grant no. 2017TP1001), and the Innovation-Driven Project of Central South University (grant no. 2016CXS031).References
- F. Bonaccorso, L. Colombo, G. Yu, M. Stoller, V. Tozzini, A. C. Ferrari, R. S. Ruoff and V. Pellegrini, Science, 2015, 347, 1246501 CrossRef PubMed.
- H. Fan and W. Shen, ChemSusChem, 2015, 8, 2004–2027 CrossRef CAS PubMed.
- A. Turchanin, A. Beyer, C. T. Nottbohm, X. Zhang, R. Stosch, A. Sologubenko, J. Mayer, P. Hinze, T. Weimann and A. Gölzhäuser, Adv. Mater., 2011, 21, 1233–1237 CrossRef.
- Y. Song, J. Yang, K. Wang, S. Haller, Y. Wang, C. Wang and Y. Xia, Carbon, 2016, 96, 955–964 CrossRef CAS.
- S.-K. Park, J. Lee, T. Hwang, B. Jang and Y. Piao, ACS Appl. Mater. Interfaces, 2017, 9, 2430–2438 CAS.
- J. Hou, C. Cao, F. Idrees and X. Ma, ACS Nano, 2015, 9, 2556–2564 CrossRef CAS PubMed.
- H. Fan and W. Shen, ACS Sustainable Chem. Eng., 2016, 4, 1328–1337 CrossRef CAS.
- K. M. Zhao, S. Q. Liu, Y. Z. Wu, K. Z. Lv, H. Yuan and Z. He, Electrochim. Acta, 2015, 174, 1234–1243 CrossRef CAS.
- K. M. Zhao, K. Z. Lyu, S. Q. Liu, Q. M. Gan, Z. He and Z. Zhou, J. Mater. Sci., 2017, 52, 446–457 CrossRef CAS.
- M. Jahan, Z. Liu and K. P. Loh, Adv. Funct. Mater., 2013, 23, 5363–5372 CrossRef CAS.
- X. Zhu, J. W. Zhao, B. L. Li, Y. Song, Y. M. Zhang and Y. Zhang, Inorg. Chem., 2010, 49, 1266–1270 CrossRef CAS PubMed.
- M. Zhao, Q. Lu, Q. Ma and H. Zhang, Small Methods, 2017, 1, 1600030 CrossRef.
- Q.-F. Yang, X.-B. Cui, J.-H. Yu, J. Lu, X.-Y. Yu, X. Zhang, J.-Q. Xu, Q. Hou and T.-G. Wang, CrystEngComm, 2008, 10, 1534–1541 RSC.
- B. Garai, A. Mallick, A. Das, R. Mukherjee and R. Banerjee, Chem.–Eur. J., 2017, 23, 7361–7366 CrossRef CAS PubMed.
- S. Zhao, Y. Wang, J. Dong, C.-T. He, H. Yin, P. An, K. Zhao, X. Zhang, C. Gao, L. Zhang, J. Lv, J. Wang, J. Zhang, A. M. Khattak, N. A. Khan, Z. Wei, J. Zhang, S. Liu, H. Zhao and Z. Tang, Nat. Energy, 2016, 1, 16184 CrossRef CAS.
- H. L. Liu, Y. J. Chang, T. Fan and Z. Y. Gu, Chem. Commun., 2016, 52, 12984–12987 RSC.
- Y. Peng, Y. Li, Y. Ban, H. Jin, W. Jiao, X. Liu and W. Yang, Science, 2014, 346, 1356–1359 CrossRef CAS PubMed.
- M. Xu, S. Yuan, X.-Y. Chen, Y.-J. Chang, G. Day, Z.-Y. Gu and H.-C. Zhou, J. Am. Chem. Soc., 2017, 139, 8312–8319 CrossRef CAS PubMed.
- M. J. Cliffe, E. Castillo-Martínez, Y. Wu, J. Lee, A. C. Forse, F. C. N. Firth, P. Z. Moghadam, D. Fairen-Jimenez, M. W. Gaultois, J. A. Hill, O. V. Magdysyuk, B. Slater, A. L. Goodwin and C. P. Grey, J. Am. Chem. Soc., 2017, 139, 5397–5404 CrossRef CAS PubMed.
- Y. Ding, Y. P. Chen, X. Zhang, L. Chen, Z. Dong, H. L. Jiang, H. Xu and H. C. Zhou, J. Am. Chem. Soc., 2017, 139, 9136–9139 CrossRef CAS PubMed.
- Y. Peng, Science, 2014, 346, 1356–1359 CrossRef CAS PubMed.
- R. Makiura, S. Motoyama, Y. Umemura, H. Yamanaka, O. Sakata and H. Kitagawa, Nat. Mater., 2010, 9, 565–571 CrossRef CAS PubMed.
- T. Rodenas, I. Luz, G. Prieto, B. Seoane, H. Miro, A. Corma, F. Kapteijn, F. X. Llabrés i Xamena and J. Gascon, Nat. Mater., 2015, 14, 48–55 CrossRef CAS PubMed.
- S. S. Lee, P. Fenter, K. L. Nagy and N. C. Sturchio, Nat. Commun., 2017, 8, 15826 CrossRef PubMed.
- M. Zhao, Y. Wang, Q. Ma, Y. Huang, X. Zhang, J. Ping, Z. Zhang, Q. Lu, Y. Yu, H. Xu, Y. Zhao and H. Zhang, Adv. Mater., 2015, 27, 7372–7378 CrossRef CAS PubMed.
- Y. Huang, M. Zhao, S. Han, Z. Lai, J. Yang, C. Tan, Q. Ma, Q. Lu, J. Chen, X. Zhang, Z. Zhang, B. Li, B. Chen, Y. Zong and H. Zhang, Adv. Mater., 2017, 29, 1700102 CrossRef PubMed.
- X.-M. Li, Acta Crystallogr., Sect. E: Struct. Rep. Online, 2007, 63, m1984 CAS.
- Y.-Z. Zheng, M.-L. Tong, W.-X. Zhang and X.-M. Chen, Angew. Chem., Int. Ed., 2006, 118, 6458–6462 CrossRef.
- M. E. Chapman, P. Ayyappan, B. M. Foxman, G. T. Yee and W. Lin, Cryst. Growth Des., 2001, 1, 159–163 CAS.
- H.-L. Jiang, B. Liu, Y.-Q. Lan, K. Kuratani, T. Akita, H. Shioyama, F. Zong and Q. Xu, J. Am. Chem. Soc., 2011, 133, 11854–11857 CrossRef CAS PubMed.
- M. Sevilla and A. B. Fuertes, ACS Nano, 2014, 8, 5069–5078 CrossRef CAS PubMed.
- H. Wang, Z. Xu, A. Kohandehghan, Z. Li, K. Cui, X. Tan, T. J. Stephenson, C. K. King'Ondu, C. M. Holt and B. C. Olsen, ACS Nano, 2013, 7, 5131–5141 CrossRef CAS PubMed.
- Z. Fan, Y. Liu, J. Yan, G. Ning, Q. Wang, T. Wei, L. Zhi and F. Wei, Adv. Energy Mater., 2012, 2, 419–424 CrossRef CAS.
- L. Chen, Z. Wang, C. He, N. Zhao, C. Shi, E. Liu and J. Li, ACS Appl. Mater. Interfaces, 2013, 5, 9537–9545 CAS.
- W. Tian, Q. Gao, L. Zhang, C. Yang, Z. Li, Y. Tan, W. Qian and H. Zhang, J. Mater. Chem. A, 2016, 4, 8690–8699 CAS.
- M. Vikkisk, I. Kruusenberg, U. Joost, E. Shulga and K. Tammeveski, Electrochim. Acta, 2013, 87, 709–716 CrossRef CAS.
- G.-P. Hao, A.-H. Lu, W. Dong, Z.-Y. Jin, X.-Q. Zhang, J.-T. Zhang and W.-C. Li, Adv. Energy Mater., 2013, 3, 1421–1427 CrossRef CAS.
- Z. He, Y. Jiang, W. Meng, J. Zhu, Y. Liu, L. Dai and L. Wang, Electrochim. Acta, 2016, 222, 1491–1500 CrossRef CAS.
- B. Xu, S. Yu, H. Wang, C. Hu, Q. Zhu and N. Qiao, J. Mater. Chem. A, 2016, 4, 16341–16348 Search PubMed.
- Y. Li, G. Wang, T. Wei, Z. Fan and P. Yan, Nano Energy, 2016, 19, 165–175 CrossRef CAS.
- X. Zhang, L. Ma, M. Gan, G. Fu, M. Jin, Y. Lei, P. Yang and M. Yan, J. Power Sources, 2017, 340, 22–31 CrossRef CAS.
- G. Xu, P. Nie, H. Dou, B. Ding, L. Li and X. Zhang, Mater. Today, 2017, 20, 191–209 CrossRef CAS.
- X. Fan, C. Yu, J. Yang, Z. Ling, C. Hu, M. Zhang and J. Qiu, Adv. Energy Mater., 2015, 5, 1401761 CrossRef.
- X. Zhuang, F. Zhang, D. Wu and X. Feng, Adv. Mater., 2014, 26, 3081–3086 CrossRef CAS PubMed.
- A. B. Fuertes and M. Sevilla, ACS Appl. Mater. Interfaces, 2015, 7, 4344–4353 CAS.
- Y. S. Yun, M. H. Park, S. J. Hong, M. E. Lee, Y. W. Park and H. J. Jin, ACS Appl. Mater. Interfaces, 2015, 7, 3684–3690 CAS.
- X. Yu, J. Zhao, R. Lv, Q. Liang, C. Zhan, Y. Bai, Z.-H. Huang, W. Shen and F. Kang, J. Mater. Chem. A, 2015, 3, 18400–18405 CAS.
- X. Zheng, W. Lv, Y. Tao, J. Shao, C. Zhang, D. Liu, J. Luo, D.-W. Wang and Q.-H. Yang, Chem. Mater., 2014, 26, 6896–6903 CrossRef.
- B. Chang, H. Yin, X. Zhang, S. Zhang and B. Yang, Chem. Eng. J., 2017, 312, 191–203 CrossRef CAS.
- B. Liu, Y. Liu, H. Chen, M. Yang and H. Li, J. Power Sources, 2017, 341, 309–317 CrossRef CAS.
- J. Jin, X. Qiao, F. Zhou, Z.-S. Wu, L. Cui and H. Fan, ACS Appl. Mater. Interfaces, 2017, 9, 17317–17325 CAS.
- J. Zhao, Y. Jiang, H. Fan, M. Liu, O. Zhuo, X. Wang, Q. Wu, L. Yang, Y. Ma and Z. Hu, Adv. Mater., 2017, 29, 1604569 CrossRef PubMed.
- Q. M. Gan, S. Q. Liu, K. M. Zhao, Y. Z. Wu, Z. He and Z. Zhou, RSC Adv., 2016, 6, 78947–78953 RSC.
- J. Sun, C. Lv, F. Lv, S. Chen, D. Li, Z. Guo, W. Han, D. Yang and S. Guo, ACS Nano, 2017, 11, 6186–6193 CrossRef PubMed.
- N. Liao, B. Zheng, H. Zhou and W. Xue, J. Power Sources, 2016, 334, 39–43 CrossRef CAS.
- Z. He, Y. Jiang, J. Zhu, Y. Li, Z. Jiang, H. Zhou, W. Meng, L. Wang and L. Dai, J. Alloys Compd., 2018, 731, 32–38 CrossRef.
- D. Sheberla, J. C. Bachman, J. S. Elias, C.-J. Sun, Y. Shao-Horn and M. Dinca, Nat. Mater., 2017, 16, 220–224 CrossRef CAS PubMed.
- Q.-L. Zhu, W. Xia, T. Akita, R. Zou and Q. Xu, Adv. Mater., 2016, 28, 6391–6398 CrossRef PubMed.
- B. Li, H.-M. Wen, Y. Cui, W. Zhou, G. Qian and B. Chen, Adv. Mater., 2016, 28, 8819–8860 CrossRef CAS PubMed.
- J. Zhao, Y.-N. Wang, W.-W. Dong, Y.-P. Wu, D.-S. Li and Q.-C. Zhang, Inorg. Chem., 2016, 55, 3265–3271 CrossRef PubMed.
Footnote |
| † Electronic supplementary information (ESI) available: The yields of the UT-Zn(bim)(OAc) and Zn(bim)(OAc) MOFs; additional details about the electrode preparation and electrochemical measurements; XRD characterization of the Zn(bim)(OAc) MOF; elemental and ICP-OES analyses of the synthesized Zn–bim based MOFs; SEM studies on Zn(bim)(OAc), Zn2(bim)4, CNCs, and L-CNCs; statistical analysis on the thickness and size of the UT-Zn(bim)(OAc) and UT-CNSs; UV-vis study on the role of gluconate in the synthesis of UT-Zn(bim)(OAc); N2 adsorption–desorption isotherms of Zn(bim)(OAc) and UT-Zn(bim)(OAc); HAADF image of UT-CNSs; XPS analysis of UT-CNSs, L-CNCs, and CNCs; effects of gluconate on the morphology and electrochemical performance of the UT-CNSs; ion diffusion of the UT-CNS, L-CNC, and CNC electrodes. See DOI: 10.1039/c7ta06916b |
| This journal is © The Royal Society of Chemistry 2018 |