
 Open Access Article
 This Open Access Article is licensed under a Creative Commons Attribution-Non Commercial 3.0 Unported Licence
MnO2 nanosheet mediated “DD–A” FRET binary probes for sensitive detection of intracellular mRNA†
Min
Ou
,
Jin
Huang
*,
Xiaohai
Yang
,
Ke
Quan
,
Yanjing
Yang
,
Nuli
Xie
and
Kemin
Wang
*
State Key Laboratory of Chemo/Biosensing and Chemometrics, College of Chemistry and Chemical Engineering, Key Laboratory for Bio-Nanotechnology and Molecular Engineering of Hunan Province, Hunan University, Changsha, P. R. China. E-mail: jinhuang@hnu.edu.cn; kmwang@hnu.edu.cn
First published on 5th September 2016
Abstract
The donor donor–acceptor (DD–A) FRET model has proven to have a higher FRET efficiency than donor–acceptor acceptor (D–AA), donor–acceptor (D–A), and donor donor–acceptor acceptor (DD–AA) FRET models. The in-tube and in-cell experiments clearly demonstrate that the “DD–A” FRET binary probes can indeed increase the FRET efficiency and provide higher imaging contrast, which is about one order of magnitude higher than the ordinary “D–A” model. Furthermore, MnO2 nanosheets were employed to deliver these probes into living cells for intracellular TK1 mRNA detection because they can adsorb ssDNA probes, penetrate across the cell membrane and be reduced to Mn2+ ions by intracellular GSH. The results indicated that the MnO2 nanosheet mediated “DD–A” FRET binary probes are capable of sensitive and selective sensing gene expression and chemical-stimuli changes in gene expression levels in cancer cells. We believe that the MnO2 nanosheet mediated “DD–A” FRET binary probes have the potential as a simple but powerful tool for basic research and clinical diagnosis.
Introduction
Over the last three decades, fluorescence resonance energy transfer (FRET) binary probes have become a routine technique for nucleic acid analysis because of their excellent selectivity, fast response and low false positive signals.1–7 The occurrence of FRET depends upon various parameters, including the distance between the donor and acceptor fluorophores with an inverse sixth power law and the spectral overlap between the donor emission and acceptor absorption spectra.6,7 Basically, one probe is labelled with a donor while another contains an acceptor fluorophore. In the absence of the target, the fluorophores of the binary probes are randomly distributed in solution, and because the concentration of the probes are very low, intermolecular FRET is not observed. Only the hybridization of the probes with the target can bring the two dyes into close proximity, thus enabling FRET.1In order to apply the FRET binary probes to intracellular detection, we need resolve two issues. Since some targets of interest may be present in very small amounts in living cells, it is necessary to further improve the FRET signals that enable the detection of trace levels of molecules. The sensitivity depends upon how efficiently the fluorescence of the donor fluorophore is quenched and to what extent the intensity of the acceptor is increased when the binary probes bind to the target. However, the current donor–acceptor (D–A) FRET binary probes limit the sensitivity because of inadequate FRET efficiency.8 Additionally, the probes must be introduced into cells through the plasma membrane, which is quite lipophilic and restricts the transport of various molecules.9 Recently, ultrathin MnO2 nanosheets have attracted increasing attention in bioanalysis and drug delivery as a result of their appealing physicochemical properties:10–17 (a) MnO2 nanosheets can strongly adsorb ssDNA; (b) MnO2 nanosheets can efficiently quench broad-spectrum fluorescence; (c) MnO2 nanosheets can act as carrier to penetrate across the cell membrane; (d) MnO2 nanosheets can be reduced to Mn2+ ions by intracellular glutathione (GSH). Therefore, MnO2 nanosheets can be utilized as a smart intracellular delivery tool for DNA probes.
Donor donor–acceptor (DD–A) systems have been shown to remarkably enhance the FRET efficiency the fluorescence emission ration of acceptor to donor (FA/FD) compared to ordinary “D–A” systems.8 Our previous studies,18,19 which used the ordinary “D–A” system to detect mRNA, showed an undesirable FRET efficiency. Thus, we chose “DD–A” FRET binary probes combined with MnO2 nanosheets for sensitive detection of intracellular mRNA. As shown in Scheme 1, the “DD–A” FRET binary probes are adsorbed on the surface of the MnO2 nanosheets and can be efficiently delivered into the cytoplasm. Once endocytosed, the MnO2 nanosheets are reduced by intracellular GSH, releasing the probes. The oligonucleotides bring the two donors and the one acceptor into close proximity only when hybridized to the target mRNA, enabling the intense “DD–A” FRET signal.
 | ||
| Scheme 1 Working principle for intracellular detection of TK1 mRNA by the MnO2 nanosheet mediated “DD–A” FRET binary probes. | ||
Results and discussion
MnO2 nanosheets were synthesized using H2O2 to oxidize MnCl2 in the presence of tetramethylammonium hydroxide.10 The product was identified by transmission electron microscopy (TEM) (Fig. S1 in the ESI†), UV/vis absorption (Fig. S2 in the ESI†), zeta potential analysis (Fig. S3 in the ESI†) and dynamic light scattering (Fig. S4 in the ESI†). The results showed that the products had a sheet-like structure, an intense UV/vis absorption with a band centered at 360 nm in the absorption spectrum, negative charged potential and ∼100 nm zeta size. Further, the excellent fluorescence quenching ability of MnO2 nanosheets made it possible to test the amount of the binary probes adsorbed on the MnO2 nanosheets by fluorescence analysis. Accordingly, when 100 nM of the FAM-labelled probe was mixed with different concentrations of MnO2 nanosheets, the fluorescence of the FAM gradually decreased with the increasing concentration of the nanosheets until it was totally quenched at a concentration of 78.75 μg mL−1. The fluorescence of FAM can be effectively quenched by the MnO2 nanosheets within 5 min (data not show). Similar results were also observed using TAMRA-labelled probes (Fig. S5 in the ESI†). MnO2 nanosheets could be dissolved into Mn2+ ions in the presence of GSH. The response of the nanosheets to different concentrations of GSH was tested by UV-vis and fluorescence spectral analysis. As shown in Fig. S6 in the ESI,† the UV-vis absorption band of the MnO2 nanosheets gradually decreased until it disappeared when the concentration of GSH increased from 0 to 1 mM, indicating that MnO2 nanosheets were reduced to Mn2+ ions. As shown in Fig. S7 in the ESI,† with the dissolution of the MnO2 nanosheets (acting as a quencher), the fluorescence of FAM recovered gradually until it was fully recovered.Then, a set of binary probes labelled with different fluorophores were utilized to compare the FRET efficiency. Single- or double-labelled donor (FAM) and acceptor (TAMRA) probes were prepared for the same target sequence (50 nM). These binary probes contained donor–acceptor acceptor (D–AA), donor–acceptor (D–A), donor donor–acceptor acceptor (DD–AA), and donor donor–acceptor (DD–A) models. The results showed that the use of double-labelled donor probes could remarkably enhance the FRET efficiency (A/D = 1.06) compared with a single donor–acceptor FRET pair (A/D = 0.60) (Fig. 1). In contrast, the double-labelled acceptor probe had a negative effect (A/D = 0.40), which was possibly due to self-quenching of the acceptor fluorophore, resulting in a relatively low FRET efficiency.
 | ||
| Fig. 1 Effects of the number of labelled fluorophores of the FAM-TAMRA system. The “DD”, “D”, “AA” and “A” indicate “double-labelled donor probe”, “single-labelled donor probe”, “double-labelled acceptor probe” and “single-labelled acceptor probe”, respectively. | ||
To test the in vitro target sensing behavior of the MnO2 nanosheet mediated “DD–A” FRET binary probes, we monitored the kinetics toward 50 nM target DNA. The results showed that the FRET signals gradually increased with time until about 30 min (Fig. S8 in the ESI†), which suggests that half an hour is enough time to finish the detection in vitro. We subsequently examined the response to varying concentrations of synthetic DNA targets, instead of mRNA, at 37 °C. The results in Fig. 2 illustrate excellent FRET signal changes with different concentrations of the targets. It suggests that the acceptor-to-donor ratio is dependent upon the target concentrations. An estimated detection limit (three times the standard deviation in the blank solution) of the “DD–A” model is 1.0 nM, which is about one order of magnitude higher than 9.8 nM in the ordinary “D–A” model (Fig. S9 in the ESI†). Moreover, the result of Fig. S10 in the ESI† showed that the A/D signal of the perfectly matched target is about 3.5-fold higher than that of the single-base mismatched target. These results suggested that the “DD–A” model is efficient at signaling the presence of a specific target.
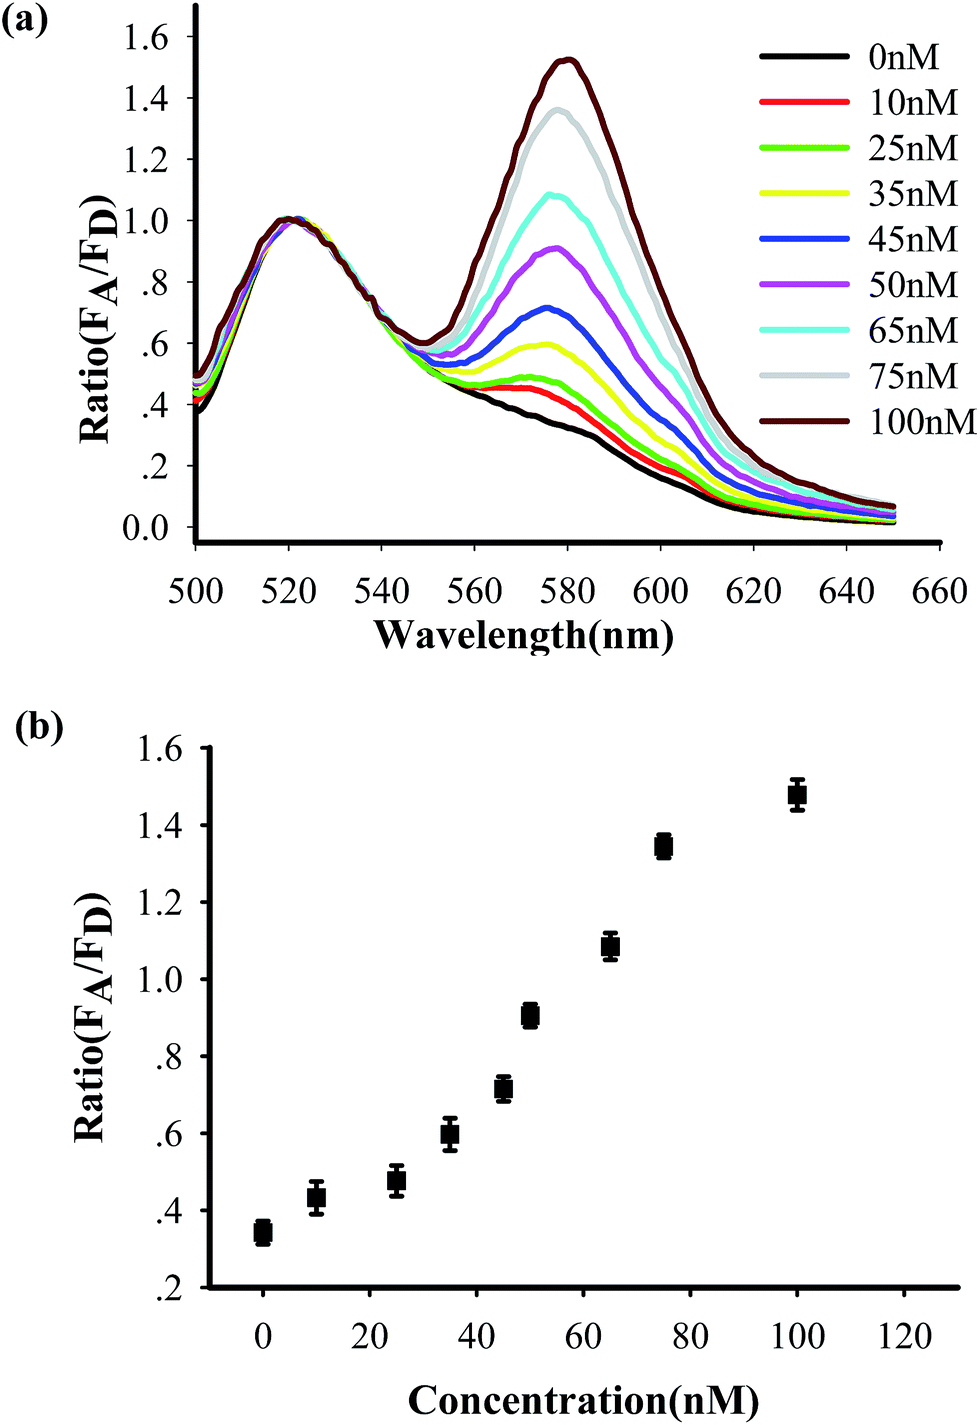 | ||
| Fig. 2 (a) Fluorescence profile of the “DD–A” FRET binary probes response to different synthetic DNA targets in vitro at 37 °C. (b) A plot of acceptor-to-donor ratio as a function of target concentrations. | ||
To demonstrate the feasibility of the MnO2 nanosheet mediated “DD–A” FRET binary probes in the living cells, we chose TK1 as a target mRNA, which is associated with cell division and is proposed to be a marker for tumor growth.20,21 Our previous studies further showed that TK1 mRNA was commonly overexpressed in tumor cells compared with normal cells.18,19,22 In this work, HepG2 (a human liver hepatocellular carcinoma cell line) and L02 (a normal human hepatocyte cell line) were selected as the target cell and control cell, respectively. First, the efficacy of the delivery of the MnO2 nanosheets was examined by comparing the internalization of the MnO2 nanosheet mediated FAM-labelled probes and that of the free FAM-labelled probes in HepG2 cells. As shown in Fig. S11 in the ESI,† cells incubated with the MnO2 nanosheet mediated FAM-labelled probes presented stronger fluorescence signals in the cytoplasm than those incubated with free probes, indicating that the MnO2 nanosheets could enhance the cellular uptake of the DNA probes. Moreover, MnO2 nanosheets were found to have a relatively low cytotoxicity in the range of some concentrations (Fig. S12 in the ESI†), confirming that the nanosheets can be used for intracellular application with good biocompatibility. However, higher concentrations of the MnO2 nanosheets may have an effect on the cells viability, which may be caused by Mn2+ ions.
To further validate the unique phenomenon that double-labelled donor probes yield a remarkable increase in the fluorescence intensity compared to an ordinary FRET, we arranged four sets of FRET binary probes (D–AA, D–A, DD–AA, DD–A) for in situ TK1 mRNA detection in HepG2 cells with MnO2 nanosheets. As shown in Fig. 3, the “DD–A” FRET binary probes exhibited intense TAMRA fluorescence signals in HepG2 cells, whereas relatively weak signals were observed in the “D–AA” model. Furthermore, flow cytometry reveals that the HepG2 cell population treated with the “DD–A” FRET binary probes is more fluorescent than the population treated with the other three models (Fig. S13 in the ESI†). The results were similar to our in vitro experiments (Fig. 1). Therefore, both the in-tube and in-cell experiments clearly demonstrated that the “DD–A” FRET binary probes can indeed improve the FRET efficiency and provide a higher imaging contrast, which is important in the detection of trace levels of a specific mRNA and the determination of small changes in the expression levels of mRNA.
 | ||
| Fig. 3 (a) Fluorescence imaging of TK1 mRNA in HepG2 cells by MnO2 nanosheet mediated “D–AA”, “D–A”, “DD–AA”, “DD–A” FRET binary probes. (b) Histogram of the relative fluorescence intensity (A/D) of the above four models. The excitation wavelength is 488 nm, and the images were collected in the range of 505–560 nm (FAM) and >560 nm (TAMRA). Scale bar: 10 μm. | ||
To test the specificity of the probes, the MnO2 nanosheet mediated “DD–A” FRET binary probes were used to detect TK1 mRNA in HepG2 and L02 cells, respectively. Fig. 4 shows that strong FRET signals (TAMRA fluorescence) were observed in HepG2 cells and almost no FRET signal was detected in the L02 cells. The results are also consistent with the results of the flow cytometry (Fig. S14 in the ESI†) and another conventional technique qPCR (Fig. S15 in the ESI†) and further indicated that the FRET signals correlate very well with the levels of mRNA expression.
 | ||
| Fig. 4 Fluorescence imaging of TK1 mRNA in HepG2 cells by MnO2 nanosheet mediated “DD–A” FRET binary probes. The green fluorescence represents FAM, the red fluorescence represents TAMRA, and the blue fluorescence represents DAPI stained cell nuclei. The merged image represents an overlay of the FAM, TAMRA and DAPI signals. The excitation wavelength is 488 nm, and the images were collected in the ranges of 505–560 nm (FAM) and >560 nm (TAMRA). Scale bar: 10 μm. | ||
The ability of the MnO2 nanosheet mediated “DD–A” FRET binary probes to identify the changes in the TK1 mRNA expression level in HepG2 cells was then studied. It was reported that tamoxifen induced the down-regulation of TK1 mRNA expression and β-estradiol induced the up-regulation of TK1 mRNA expression.23–26 The HepG2 cells were separated into three groups in parallel. One group was treated with tamoxifen to decrease the TK1 mRNA expression, and another was treated with β-estradiol to increase the TK1 mRNA expression. An untreated group served as a control. The MnO2 nanosheet mediated “DD–A” FRET binary probes were subsequently applied to image the TK1 mRNA in the cells of the three groups. As shown in Fig. 5, the TAMRA fluorescence intensity is lower in the tamoxifen-treated cells and higher in the β-estradiol cells compared to that in the untreated cells. Furthermore, flow cytometry confirmed that the level of TK1 mRNA expression decreased after tamoxifen treatment and increased after β-estradiol treatment. (Fig. S16 in the ESI†). These results indicated that the MnO2 nanosheet mediated “DD–A” FRET binary probes are capable of sensing changes in gene expression levels in cancer cells.
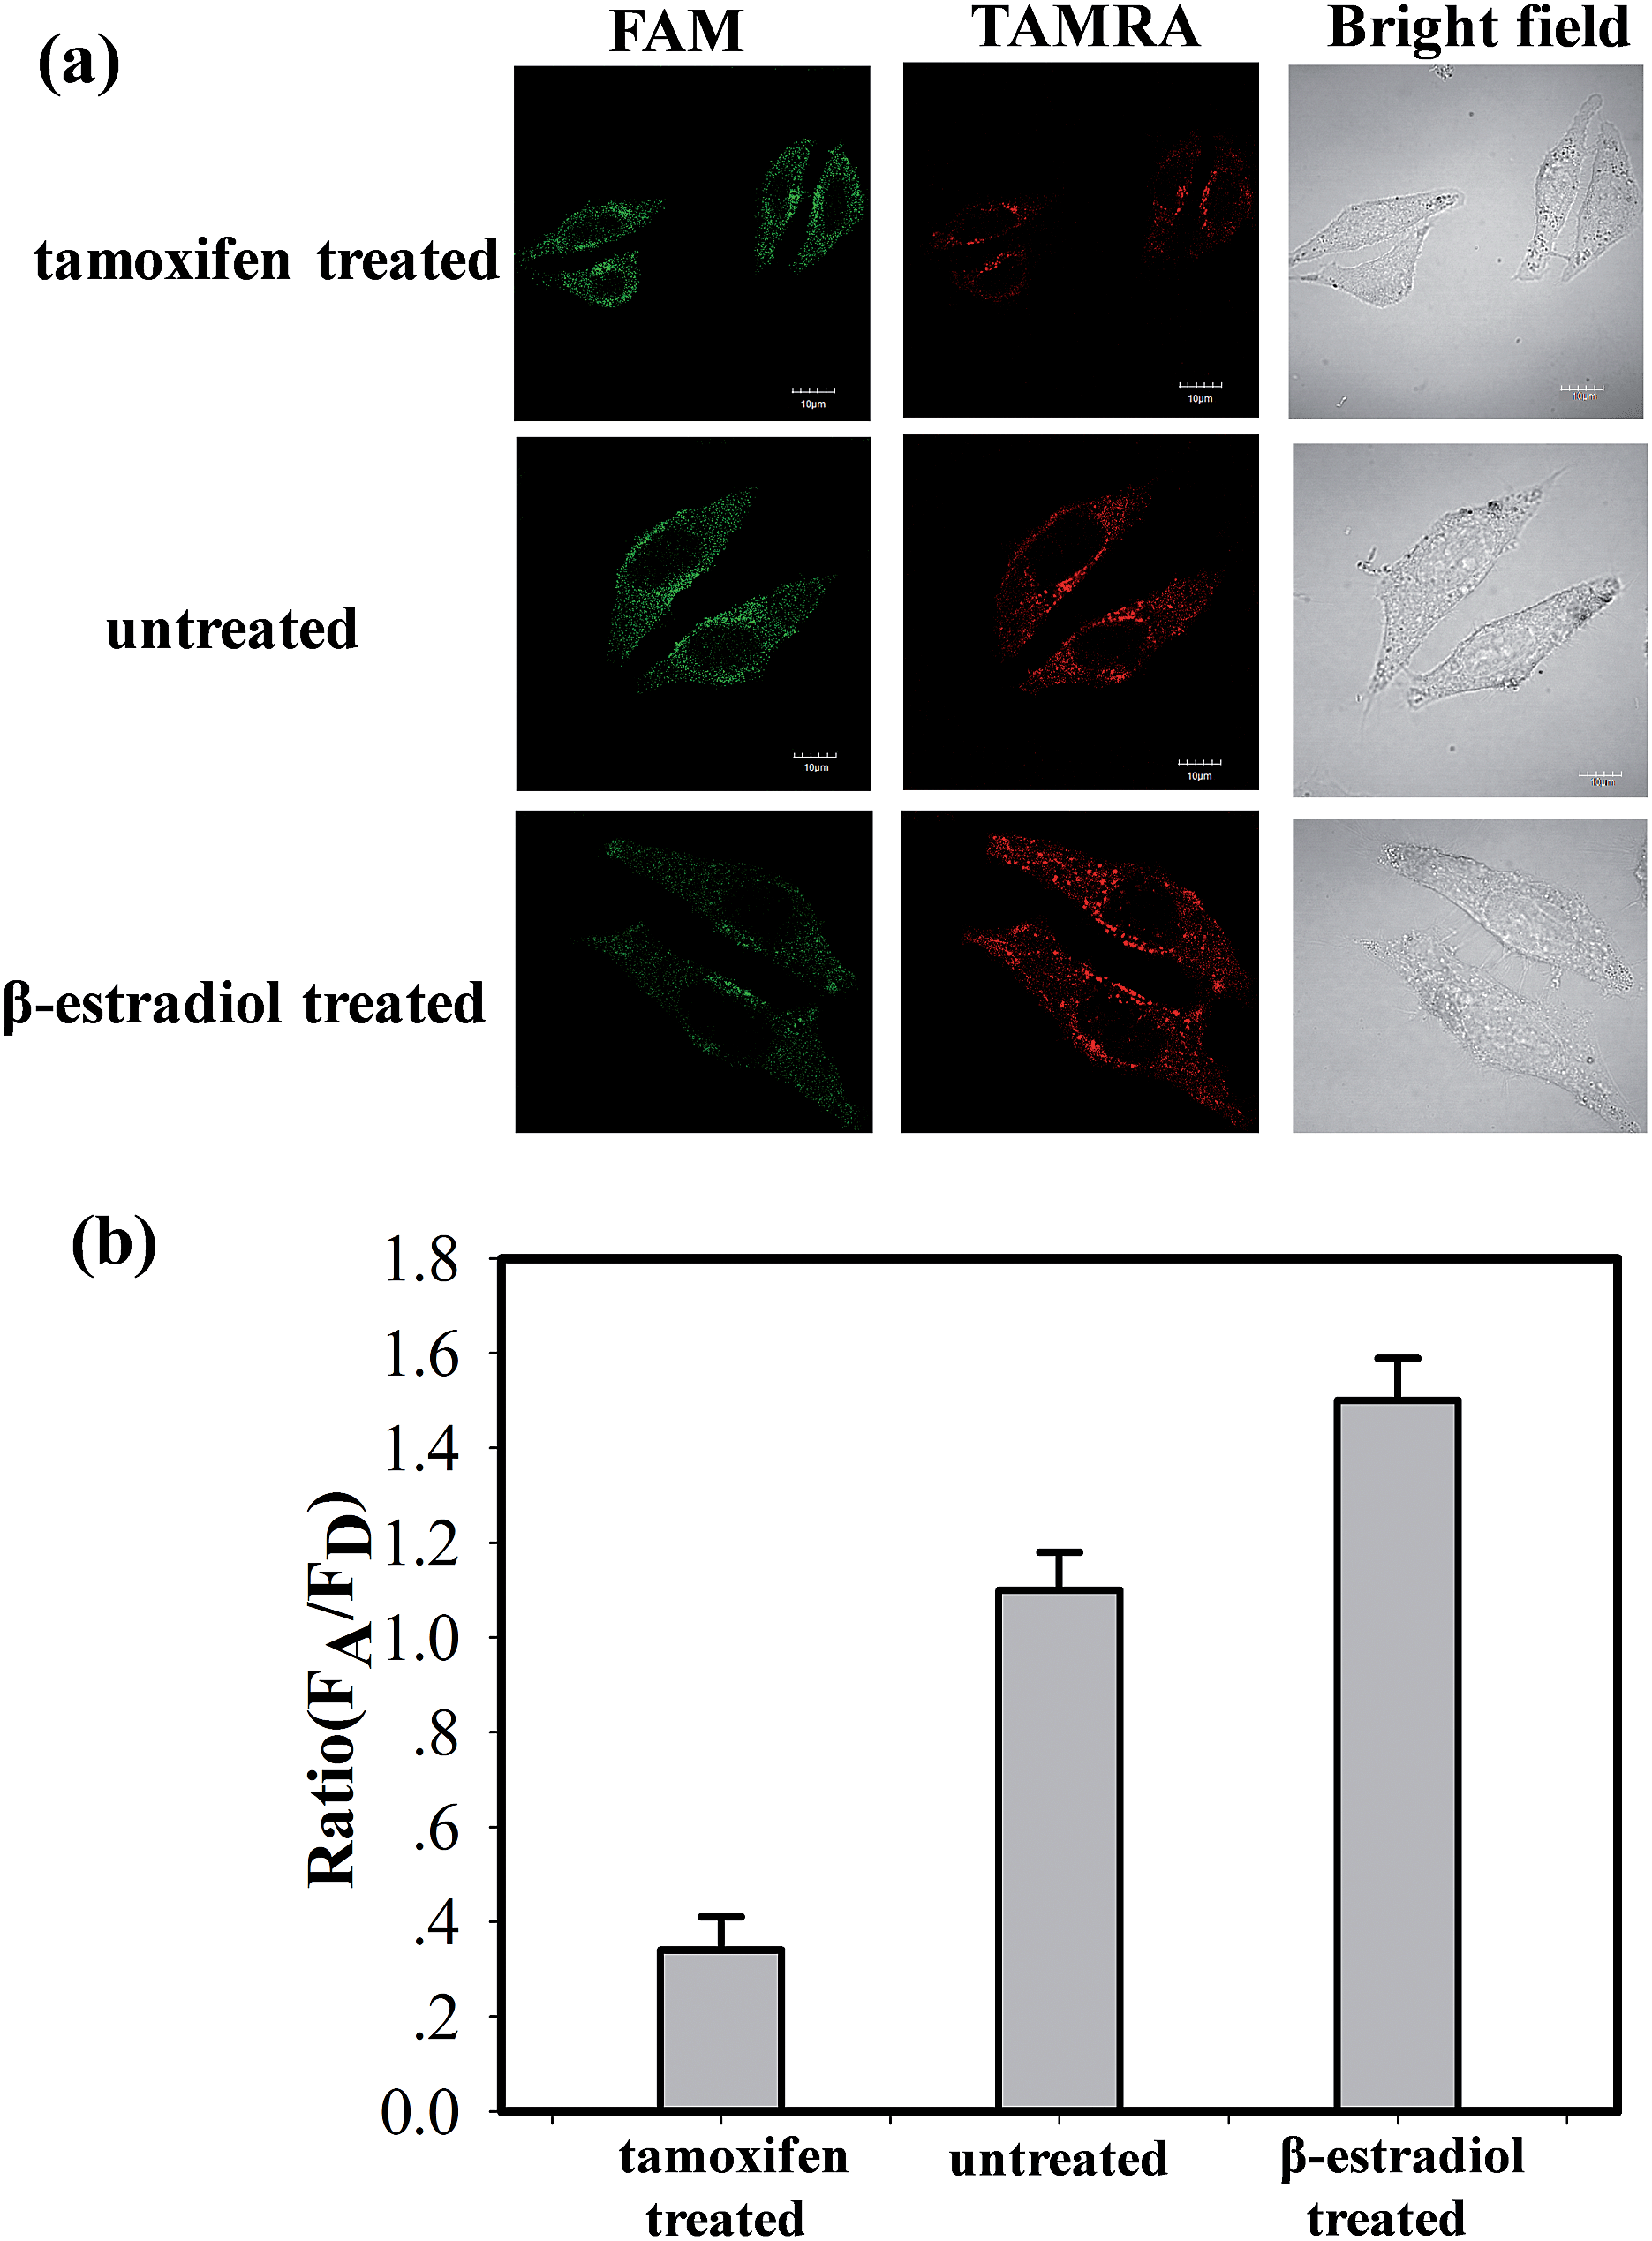 | ||
| Fig. 5 (a) Fluorescence imaging of TK1 mRNA in HepG2 cells (tamoxifen treated, untreated and β-estradiol treated) by MnO2 nanosheet mediated “DD–A” FRET binary probes. (b) The histogram of the relative fluorescence intensity (A/D) of the above three groups. The excitation wavelength is 488 nm, and the images were collected in the range of 505–560 nm (FAM) and >560 nm (TAMRA). Scale bar: 10 μm. | ||
Conclusions
In summary, we developed MnO2 nanosheet mediated “DD–A” FRET binary probes for intracellular TK1 mRNA detection. In this detection system, the double-labelled donor strategy can enhance the FRET signals relative to pairs utilizing a single-labelled donor. Further, the MnO2 nanosheets can adsorb ssDNA probes, deliver them into living cells and be reduced to Mn2+ ions by intracellular GSH. We believe that the MnO2 nanosheet mediated “DD–A” FRET binary probes have potential as a simple but powerful tool for basic research and clinical diagnosis.Experimental section
Chemicals and materials
Tetramethylammonium hydroxide pentahydrate (TMA·OH), hydrogen peroxide (H2O2, 30 wt%), manganese chloride tetrahydrate (MnCl2·4H2O) and L-glutathione reduced (GSH) were purchased from Alfa Aesar (China). The oligonucleotides used in this work (Table S1†) were synthesized by Sangon Biological Co. Ltd (Shanghai, China). Tamoxifen and β-estradiol were from Sigma Aldrich Chemical Co. Ltd. (St. Louis, MO). All solutions were prepared using ultrapure water, which was obtained through a Millipore Milli-Q water purification system (Billerica, MA, USA) and had an electric resistance >18.3 MΩ.Apparatus and characterization
All fluorescence measurements were carried out on a F-7000 fluorescence spectrometer (Hitachi, Japan). Ultraviolet-visible light (UV-vis) absorption spectra were recorded on a UV-2600 UV-vis spectrometer (Shimadzu, Japan). The transmission electron microscopy (TEM) images were obtained on a JEM-2100 transmission electron microscope (JEOL Ltd., Japan). Zeta potential and DLS measurements were taken using a Nano ZS90 laser particle analyzer (Malvern Instruments, UK). The confocal laser scanning microscopy (CLSM) images were obtained on a Fluoview FV500 (Olympus, Japan). The flow cytometry analysis was gained from a Gallios machine (Beckman Coulter, USA).Preparation of MnO2 nanosheets
MnO2 nanosheets were synthesized according to previous reports.10 Twenty milliliters of a mixed solution of 0.6 M TMA·OH and 3.0 wt% H2O2 were added to 10 mL of a 0.3 M MnCl2·4H2O aqueous solution within 15 s, and a dark brown suspension was formed immediately. The product was stirred vigorously overnight in the open air at room temperature. Subsequently, the crude product was collected by centrifugation at 2000 rpm for 40 min, washed with alcohol and ultrapure water several times, and the bulk MnO2 was then placed under high vacuum at −60 °C to remove the residual solvent. To acquire the MnO2 nanosheets, 10 mg of MnO2 solid was dispersed in 20 mL of ultrapure water and degraded by an ultrasonic cell crasher and ultrasonic cleaning machine.Preparation of binary probes/MnO2 nanosheets
The physisorption of binary probes on MnO2 nanosheets was carried out by mixing MnO2 nanosheets with donor probes and acceptor probes at the desired concentration for 20 min at room temperature. Then, HEPES buffer (20 mM, pH 7.2, containing 150 mM NaCl and 2 mM MgCl2) was added and incubated at room temperature for another 20 min.UV-vis and fluorescence analysis
To measure the fluorescence quenching ability of MnO2 nanosheets, 100 nM single-labelled donor probe and single-labelled acceptor probe were incubated with various concentrations of MnO2 nanosheets, respectively. Then, the solution was centrifuged at 12![[thin space (1/6-em)]](https://www.rsc.org/images/entities/char_2009.gif) 000 rpm, and the supernatant was collected for fluorescence spectral analysis. To detect the response of the ssDNA probes/MnO2 nanosheets to GSH, the prepared ssDNA probes/MnO2 nanosheets containing 100 nM of the single-labelled donor probe were mixed with various concentrations of GSH for 1 h incubation. The response of the ssDNA probes/MnO2 nanosheets to different concentrations of GSH was characterized by a UV-2600 UV-vis spectrophotometer (Shimadzu) and F-7000 fluorescence spectrometer (Hitachi, Japan).
000 rpm, and the supernatant was collected for fluorescence spectral analysis. To detect the response of the ssDNA probes/MnO2 nanosheets to GSH, the prepared ssDNA probes/MnO2 nanosheets containing 100 nM of the single-labelled donor probe were mixed with various concentrations of GSH for 1 h incubation. The response of the ssDNA probes/MnO2 nanosheets to different concentrations of GSH was characterized by a UV-2600 UV-vis spectrophotometer (Shimadzu) and F-7000 fluorescence spectrometer (Hitachi, Japan).
Fluorescence experiments
To compare the effects of the number of labelled fluorophores to the FRET signal, double-labelled donor (DD) and double-labelled acceptor (AA) probes were examined. The prepared probes (“D–A”, “D–AA”, “DD–A”, “DD–AA”) were mixed with GSH (1 μM) and then incubated with the target for 45 min at 37 °C. For the detection of the DNA target, different concentrations of the targets (0, 10, 25, 35, 45, 50, 65, 75, 100 nM) were reacted with “DD–A” FRET binary probes after treatment with GSH (1 μM) for 45 min at 37 °C. In a single-base mismatch recognition study, “DD–A” FRET binary probes were employed. The fluorescence was recorded on a F-7000 fluorescence spectrometer exciting at 488 nm and measuring emission from 500 nm to 650 nm in 1 nm increments. For FRET fluorescence detection, the excitation and emission wavelengths were 488 nm and 500–650 nm, respectively. For TAMRA fluorescence detection, the excitation and emission wavelengths were 543 nm, and 560–650 nm, respectively. (The average and standard deviation were obtained by 3 parallel experiments in each trial).Cell culture
HepG2 cells (Human hepatocellular liver carcinoma cell line), and L02 cells (human hepatocyte cell line) were grown in DMEM media supplemented with 10% inactivated fetal bovine serum, 100 U mL−1 1% penicillin and streptomycin solution. All cells were cultured in a humidified CO2 incubator containing 5% CO2 at 37 °C. Phosphate-Buffered Saline (PBS) (pH 7.4, Ca2+ and Mg2+ free) was used to wash cells.Confocal imaging analysis
In a comparative experiment of “D–A”, “D–AA”, “DD–A” and “DD–AA” binary probes, the HepG2 cells were plated on 35 mm confocal laser culture dishes for 24 h. After washing twice with PBS, the HepG2 cells were incubated with binary probes/MnO2 nanosheets for 4 h. After incubation, the cells were washed three times with PBS and subjected to confocal microscope imaging. For fluorescence colocalization imaging, HepG2 cancer cells and L02 normal cells were incubated with binary probes/MnO2 nanosheets for 4 h. Before imaging, the washed cells were incubated with a DAPI solution for 15 min and then washed three times with PBS. In the experiments for expression levels of TK1 mRNA, two groups of HepG2 cells were treated with tamoxifen (10−6 mol L−1) and β-estradiol (10−8 mol L−1) for 24 h, respectively. One group of cells without regulation served as the control. Other steps were performed the same as described above. The fluorescence emission was collected and imaged with an objective of 100×.Flow cytometry experiments
HepG2 cells (3 × 10⁵) were incubated with binary probes/MnO2 nanosheets for 4 h at 37 °C. Then, the cells were washed three times with PBS and detached with a Trypsin-EDTA solution. Finally, the cells were resuspended in PBS for flow cytometric analysis on a Beckman Coulter Gallios machine.Cytotoxicity of MnO2 nanosheets
HepG2 cells were seeded in 96-well plates at a density of 1 × 10⁵ cells per well. After overnight incubation, the cells were treated with 100 μL of a cell medium containing MnO2 nanosheets at different concentrations and incubated for 4 h. Then, the cell medium was removed and 100 μL of fresh cell medium was added. After 24 h incubation, the cell medium was replaced with 100 μL of cell medium containing MTT solution (0.5 mg mL−1) to each well for 4 h. Then, the medium was withdrawn and 150 μL of DMSO was added to dissolve the precipitated formazan violet crystals. The cell viability was determined by measuring the absorbance at 490 nm by a multi-detection microplate reader.qRT-PCR
Total cellular RNA was extracted from HepG2 cells or L02 cells using Trizol reagent S5 (Sangon Co. Ltd., Shanghai, China) according to the indicated protocol. The cDNA samples were prepared by using the reverse transcription (RT) reaction with AMV First Strand cDNA Synthesis Kit (BBI, Toronto, Canada). qRT-PCR analysis of mRNA was performed with SG Fast qPCR Master Mix (2X) (BBI) on a LightCycler480 Software Setup (Roche). The primers used in this experiment were shown in Table S1.† We evaluated all the data with respect to the mRNA expression by normalizing to the expression of GAPDH and using the 2−ΔΔCt method.Acknowledgements
This work was supported by the National Natural Science Foundation of China (21190044 and 21205032), and the Fundamental Research Funds for the Central Universities.Notes and references
- R. A. Cardullo, S. Agrawal, C. Flores, P. C. Zamecnik and D. E. Wolf, Proc. Natl. Acad. Sci. U. S. A., 1988, 85, 8790–8794 CrossRef CAS.
- J. L. Mergny, A. S. Boutorine, T. Garestier, F. Belloc, M. Rougee, N. V. Bulychev, A. A. Koshkin, J. Bourson, A. V. Lebedev, B. Valeur, N. T. Thuong and C. Helene, Nucleic Acids Res., 1994, 22, 920–928 CrossRef CAS PubMed.
- C. T. Wittwer, M. G. Herrmann, A. A. Moss and R. P. Rasmussen, BioTechniques, 1997, 22, 130–138 CAS.
- Y. Sei-Iida, H. Koshimoto, S. Kondo and A. Tsuji, Nucleic Acids Res., 2000, 28, e59 CrossRef CAS PubMed.
- E. Lyon and C. T. Wittwer, J. Mol. Diagn., 2009, 11, 93–101 CrossRef CAS PubMed.
- A. A. Marti, S. Jockusch, N. Stevens, J. Ju and N. J. Turro, Acc. Chem. Res., 2007, 40, 402–409 CrossRef CAS PubMed.
- D. M. Kolpashchikov, Chem. Rev., 2010, 110, 4709–4723 CrossRef CAS PubMed.
- Y. Okamura, S. Kondo, I. Sase, T. Suga, K. Mise, I. Furusawa, S. Kawakami and Y. Watanabe, Nucleic Acids Res., 2000, 28, e107 CrossRef CAS PubMed.
- K. Wang, J. Huang, X. Yang, X. He and J. Liu, Analyst, 2013, 138, 62–71 RSC.
- K. Kai, Y. Yoshida, H. Kageyama, G. Saito, T. Ishigaki, Y. Furukawa and J. Kawamata, J. Am. Chem. Soc., 2008, 130, 15938–15943 CrossRef CAS PubMed.
- Z. Zhao, H. Fan, G. Zhou, H. Bai, H. Liang, R. Wang, X. Zhang and W. Tan, J. Am. Chem. Soc., 2014, 136, 11220–11223 CrossRef CAS PubMed.
- H. Fan, Z. Zhao, G. Yan, X. Zhang, C. Yang, H. Meng, Z. Chen, H. Liu and W. Tan, Angew. Chem., Int. Ed., 2015, 54, 1–6 CrossRef.
- Y. Yuan, S. Wu, F. Shu and Z. Liu, Chem. Commun., 2014, 50, 1095–1097 RSC.
- Y. Chen, D. Ye, M. Wu, H. Chen, L. Zhang, J. Shi and L. Wang, Adv. Mater., 2014, 26, 7018–7026 CrossRef CAS.
- W. Zhai, C. Wang, P. Yu, Y. Wang and L. Mao, Anal. Chem., 2014, 86, 12206–12213 CrossRef CAS PubMed.
- C. Wang, W. Zhai, Y. Wang, P. Yu and L. Mao, Analyst, 2015, 140, 4021–4029 RSC.
- Y. Yuan, S. Wu, F. Shu and Z. Liu, Chem. Commun., 2014, 50, 1095–1097 RSC.
- Y. Yang, J. Huang, X. Yang, K. Quan, H. Wang, L. Ying, N. Xie, M. Ou and K. Wang, J. Am. Chem. Soc., 2015, 137, 8340–8343 CrossRef CAS PubMed.
- J. Huang, H. Wang, X. Yang, K. Quan, Y. Yang, L. Ying, N. Xie, M. Ou and K. Wang, Chem. Sci., 2016, 7, 3829–3835 RSC.
- P. Broet, S. Romain, A. Daver, G. Ricolleau, V. Quillien, A. Rallet, B. Asselain, P. M. Martin and F. Spyratos, J. Clin. Oncol., 2001, 19, 2778–2787 CAS.
- C. Chen, T. W. Chang, F. M. Chen, M. F. Hou, S. Y. Hung, I. W. Chong, S. C. Lee, T. H. Zhou and S. R. Lin, Oncology, 2006, 70, 438–446 CrossRef CAS PubMed.
- J. Huang, H. Wang, X. Yang, Y. Yang, K. Quan, L. Ying, N. Xie, M. Ou and K. Wang, Chem. Commun., 2016, 52, 370373 Search PubMed.
- J. C. Alwine, D. J. Kemp, B. A. Parker, J. Reiser, J. Renart, G. R. Stark and M. G. Wahl, Methods Enzymol., 1979, 68, 220–242 CAS.
- A. Kasid, N. E. Davidson, E. P. Gelmann and M. E. Lippman, J. Biol. Chem., 1986, 261, 5562–5567 CAS.
- J. A. Foekens, S. Romain, M. P. Look, P. M. Martin and J. G. M. Klijn, Cancer Res., 2001, 61, 1421–1425 CAS.
- N. Li, C. Chang, W. Pan and B. Tang, Angew. Chem., Int. Ed., 2012, 51, 7426–7430 CrossRef CAS PubMed.
Footnote |
| † Electronic supplementary information (ESI) available. See DOI: 10.1039/c6sc03162e |
| This journal is © The Royal Society of Chemistry 2017 |