 Open Access Article
Designed porous milli-scale reactors with enhanced interfacial mass transfer in two-phase flows
Aditi
Potdar
a,
Lidia N.
Protasova
b,
Leen
Thomassen
ac and
Simon
Kuhn
 *a
*a
aKU Leuven, Department of Chemical Engineering, Celestijnenlaan 200F, 3001 Leuven, Belgium. E-mail: simon.kuhn@kuleuven.be
bFlemish Institute for Technological Research – VITO, Boeretang 200, 2400 Mol, Belgium
cKU Leuven, Faculty of Industrial Engineering, Lab4U, Agoralaan Building B Box 8, 3590 Diepenbeek, Belgium
First published on 15th December 2016
Abstract
The hydrodynamics and mass transfer characteristics in liquid–liquid flow through various structured and well-defined porous reactors are characterized using laser based optical measurements (PIV and PLIF) in combination with chemical extraction methods. We investigate both high and low interfacial tension fluid systems (toluene–water and n-butanol–water), and we have identified that depending on the fluid properties different design parameters of the porous structures play a crucial role in determining the overall mass transfer performance. In general, the porous reactors enhance slug breakup, resulting in lower mean slug lengths for both phases compared to an empty tube and an associated enhancement in surface renewal velocities. The designed porous milli-scale reactors provide enhanced mass transfer performance, with an order of magnitude reduced energy dissipation compared to conventional milli-scale packed bed reactors.
1. Introduction
Microreaction technology has evolved into an established tool for chemical synthesis1,2 and reaction automation3 on a laboratory scale. This is driven by the enhanced mass and heat transfer coefficients obtained by decreasing the characteristic reactor length scale and thus increasing the surface-to-volume ratio. Furthermore, microreaction technology allows for safer operation, which then enables synthesis at elevated temperatures and pressures,4 which in turn allows access to novel process windows5,6 to further intensify the involved chemical processes. Especially in the field of pharmaceuticals, these developments have led to the integration of microreactors into continuous-flow production.7–10Most of the relevant chemical transformations involve multiple immiscible phases, and for fast reaction kinetics, interfacial mass transfer then becomes the rate limiting step. The interfacial mass transfer rate scales with the volumetric mass transfer coefficient kLa, and the comparison of experimentally obtained kLa values between conventional equipment and various microreactors for gas–liquid and liquid–liquid systems reveals larger mass transfer coefficients on the micro-scale.11 In the case of solid catalyzed multiphase reactions, microstructured packed bed reactors are commonly used.12,13 In these reactors, the solid catalyst particles are retained in the microchannel creating a porous structure, which increases both the interfacial mass transfer and the diffusion of the reactive species to the catalyst surface. In addition, it was also observed that for bi-phasic reactions using a phase transfer catalyst the presence of an inert packed bed will improve mixing leading to full conversion at lower residence times.14 This is an important observation for scale-up, as increasing the fluid–structure interaction was shown to result in comparable volumetric mass transfer coefficients, kLa, across reactor length scales.15 Consequently, packed beds represent a versatile reactor system to improve mixing and mass transfer for multiphase transformations. However, the main drawbacks limiting their use, especially for scale-up applications, is their large associated pressure drop, flow maldistribution resulting in non-uniform contact time, and attrition of small particles.
An interesting alternative to create porous structures similar to a packed bed is the use of open cell metal foams. Metal foam systems were initially developed for light weight construction,16,17 but due to their superior thermal performance they were subsequently employed as compact heat exchangers.18–21 Single phase hydrodynamic studies revealed that inserting metal foam structures into tubular reactors results in plug flow behaviour,22,23 and the corresponding pressure drop is lower compared to the one observed in packed beds, primarily due the large void fraction of open cell foams.22,24 A combined experimental and numerical approach identified the ligament shape and thickness of the foam structure as the key design parameters to enhance mixing via induced turbulent kinetic energy.25–27 These hydrodynamic properties, combined with the large specific surface area of open cell foams, explain their use as internal mixers and as catalyst supports.28 The design concept of these porous reactors is analogous to structured mixers, e.g. Sulzer type static mixers.29,30 However, the use of open cell foams offers a more complex structure on the micro- and milli-scales, rendering them a flexible choice at these length scales.
In terms of multiphase flow, metal foams were primarily investigated for gas–liquid systems. An air–water system was used to study the hydrodynamics and mass transfer in both co-current and counter-current operations in solid foam packings of 5–40 pores per linear inch (ppi).31–33 For counter-current operation, three flow regimes were identified, both bubble and pulsating flows for high liquid hold-up and trickle flow for low liquid hold-up. Furthermore, in the case of low liquid hold-up, the liquid side mass transfer coefficient increases with increasing ppi and liquid Reynolds number.33 This behavior was not observed for the co-current operation, where the mass transfer coefficient is independent of the ppi but increases with increasing gas and liquid velocities.32 In a recent study, a 2 mm square channel was filled with an open cell foam and developed gas–liquid Taylor flow was passed through it.34,35 It was observed that the Taylor flow breaks up when it came into contact with the porous structure, inducing a pulsed flow with a considerable slip between the liquid and gas phases. The pulsing regime results in enhanced mixing and convective mass transport. Accordingly, when the same open cell foam was wash-coated with a Pd/Al2O3 catalyst and applied to hydrogenation, enhanced external mass transfer coefficients compared to those in fixed beds were observed.36
The above discussion highlights the potential of open cell foams as novel reactors for multiphase transformations, combining increased specific surface area with low pressure drops. However, the influence of the geometrical details (e.g. pore and ligament sizes, orientation) of the porous structure on two-phase hydrodynamics and interfacial mass transfer is not yet fully established. In this paper, we study liquid–liquid flow hydrodynamics and mass transfer in various structured and well-defined porous structures similar to open cell foams. We make use of rapid prototyping techniques (3D fibre deposition and selective laser sintering) which allow a systematic variation of the unit cell geometry. Using laser based optical measurements and chemical extraction methods, the impact of these geometric changes on two-phase flow hydrodynamics and interfacial mass transfer in two liquid–liquid systems (toluene–water and n-butanol–water) is investigated. We choose these two fluid systems to characterize different flow patterns, in which the two-phase flow of toluene–water is established as slug flow (or Taylor flow) in an empty tube, whereas that of n-butanol–water results in stratified flow (see Fig. 1 for a sketch of the two flow patterns). Furthermore, we benchmark the obtained results against those of an empty tube of the same inner diameter and packed beds of comparable void volume. The results of this study allow further design optimization of defined porous structures as novel reactors for continuous manufacturing.
2. Methods
2.1. Porous structures
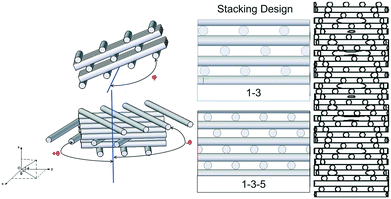
We investigate various custom designed porous structures produced by either selective laser sintering (SLS,37,38 manufactured by inspire AG, Switzerland) or 3-dimensional fibre deposition (3DFD,39–41 manufactured by VITO, Belgium). The 3DFD samples were prepared using a modified CNC machine and extrusion system to build the structures layer by layer by computer controlled movements in the x, y and z-directions. All structured porous reactors are made of stainless steel with an internal diameter of 3.4 mm and were designed using the CAD software Solid Edge V20. The base structure of such a porous reactor is shown in Fig. 2. It consists of cylindrical fibres with an outer diameter of 250 μm in a stacking arrangement. In this study, we investigate two stacking arrangements, 1–3 and 1–3–5.39 In 1–3, cylinders in consecutive layers are shifted by half of the inter-fibre distance, while in 1–3–5, cylinders in consecutive layers are shifted by a third of the inter-fibre distance (Fig. 2). These stacking arrangements can readily be manufactured using 3DFD, whereas SLS allows further design variations. The structured reactors made using the SLS technique consist of these two stacking arrangements consecutively arranged over each other, and additional rotations between fibre layers are introduced with respect to the mean flow direction (z-axis, angle θ) and with respect to the plane normal to the mean flow direction (x,y-plane, angle φ), see Fig. 2. Table 1 summarizes the geometric details of the structured porous reactors analyzed in the present study.| Name | Method | Void volume (μL) | Porosity (%) | Specific surface area (m2 m−3) | Description |
|---|---|---|---|---|---|
| Vito | 3DFD | 437.9 | 72% | 4480 | 1–3–5 design, φ = 0° and θ = 0° |
| Insp 1 | SLS | 449.6 | 74% | 4160 | θ = ±22.5° in alternate stacks, φ = 45° around the x,y-plane |
| Insp 2 | SLS | 448.6 | 74% | 4160 | θ = ±45° in alternate stacks, φ = 45° around the x,y-plane |
| Insp 3 | SLS | 450 | 74% | 4160 | θ = 0°, 45°, 90°… for alternate rows, φ = 45° around the x,y-plane |
| Insp 4 | SLS | 447.4 | 74% | 4160 | θ = 0° and φ = 45° around the x,y-plane |
| Insp 5 | SLS | 449.6 | 70% | 4800 | θ = ±22.5° for alternate stacks and φ = 0° |
| PB 1 | Packed bed | 394.6 | 40% | 37![[thin space (1/6-em)]](https://www.rsc.org/images/entities/char_2009.gif) 895 895 |
Stainless steel spheres, particle size: 60–125 μm |
| PB 2 | Packed bed | 409.8 | 42% | 4640 | Glass spheres, particle size: 750 μm |
For benchmark purposes, the two-phase flow hydrodynamics and interfacial mass transfer in these novel porous structures are compared with conventional milli-scale packed bed reactors (entries PB 1 and PB 2 in Table 1) with an internal diameter of 3.8 mm. The first packed bed (PB 1) has an equivalent void volume to that of the porous reactors but a larger specific solid surface area due to the small size of the stainless steel spheres used as packing material. These packed bed characteristics correspond to reactors commonly encountered for bi-phasic reactions.14 However, as the main source of pressure drop in the packed bed is the viscous dissipation on the introduced solid surfaces, an additional packed bed matching both void volume and specific surface area of the porous structures was prepared using larger glass spheres (PB 2). Consequently, both packed beds can be applied under identical operating conditions to those of the porous reactors, and their performance can therefore be used to benchmark the mass transfer performance and energy dissipation in the novel structures.
2.2. Experimental methods
The hydrodynamics and interfacial mass transfer in these porous flow reactors were characterized for two liquid–liquid systems, toluene–water and n-butanol–water (see Table 2 for their physical properties). For toluene–water, laser based optical measurements are established, while for n-butanol–water a chemical method is used to quantify interfacial mass transfer. All chemicals are of analytical grade and were used as received (Sigma Aldrich).| Properties | Fluid | ||
|---|---|---|---|
| Water | Toluene | n-Butanol | |
| Density, ρ (kg m−3) | 998 | 867 | 810 |
| Viscosity, η (Pa s) | 1.00 × 10⁻³ | 0.59 × 10⁻³ | 2.95 × 10⁻³ |
| Interfacial tension, σ (N m−1) | 3.30 × 10⁻² | 8.00 × 10⁻⁴ | |
![[thin space (1/6-em)]](https://www.rsc.org/images/entities/char_2009.gif) :
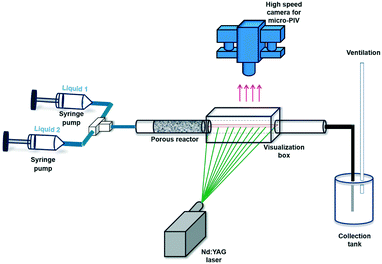
:![[thin space (1/6-em)]](https://www.rsc.org/images/entities/char_2009.gif) 1, and the experiments are carried out at total volumetric flow rates of 1 ml min−1 and 3 ml min−1, which are controlled using syringe pumps (CHEMYX Fusion 200). As the manufactured reactors are opaque, the outlet of the porous section is connected to a glass tube with identical internal diameter (3.4 mm) via a push-in connector. The flow at the end of this connection, approximately 2 cm downstream of the reactor outlet, is recorded using a dual Nd:YAG laser (LaVision, 65 mJ, 532 nm) and a high speed camera (LaVision Imager LX 2M) attached to a Zeiss Discovery.V20 stereomicroscope equipped with a Plan-Apochromat 1.0× objective. The resulting pixel resolution of the images is 1608 × 1208 pixels with an individual pixel size of 7.4 μm. The camera is fitted with a band pass filter (580 ± 10 nm) to block all wavelengths except for the emission of the fluorescent dye (PLIF) or particles (PIV). The temporal resolution for the PIV measurements is 3 Hz, while for the PLIF analysis a recording frequency of 1.5 Hz is used. In order to avoid image distortions due to the curved surface of the cylindrical glass tube, it is inserted in a rectangular visualization box filled with glycerol achieving an identical refractive index (index matching). The laser sheet (thickness 100 μm) enters the visualization box and glass tube from the side, while images are captured from the top as shown in Fig. 3.
1, and the experiments are carried out at total volumetric flow rates of 1 ml min−1 and 3 ml min−1, which are controlled using syringe pumps (CHEMYX Fusion 200). As the manufactured reactors are opaque, the outlet of the porous section is connected to a glass tube with identical internal diameter (3.4 mm) via a push-in connector. The flow at the end of this connection, approximately 2 cm downstream of the reactor outlet, is recorded using a dual Nd:YAG laser (LaVision, 65 mJ, 532 nm) and a high speed camera (LaVision Imager LX 2M) attached to a Zeiss Discovery.V20 stereomicroscope equipped with a Plan-Apochromat 1.0× objective. The resulting pixel resolution of the images is 1608 × 1208 pixels with an individual pixel size of 7.4 μm. The camera is fitted with a band pass filter (580 ± 10 nm) to block all wavelengths except for the emission of the fluorescent dye (PLIF) or particles (PIV). The temporal resolution for the PIV measurements is 3 Hz, while for the PLIF analysis a recording frequency of 1.5 Hz is used. In order to avoid image distortions due to the curved surface of the cylindrical glass tube, it is inserted in a rectangular visualization box filled with glycerol achieving an identical refractive index (index matching). The laser sheet (thickness 100 μm) enters the visualization box and glass tube from the side, while images are captured from the top as shown in Fig. 3.
PIV is applied to measure the velocity fields in the aqueous slugs, and therefore, the water phase is seeded with fluorescent particles (mean diameter of 10 μm) coated with Nile Red. The post processing of the PIV data is carried out using the commercial software Davis 8.2.2. For the cross-correlation to obtain the velocity fields, a multi-pass algorithm with interrogation areas of 128 × 128 pixels and 64 × 64 pixels is used, where a 50% overlap is applied on the final pass. A total of 2000 image pairs for 1 ml min−1 and 1000 image pairs for 3 ml min−1 are captured at a frame rate of 3 Hz. In order to eliminate instantaneous spurious vectors, the average velocity field of each aqueous slug is calculated by a sliding average method using an in-house MATLAB code.
These PIV measurements are combined with PLIF to quantify the interfacial mass transfer of the fluorescent dye Rhodamine B (RhB). RhB is soluble in both water and toluene, but it only displays fluorescence in the water phase, whereas in the toluene phase it forms a colorless lactone.46 For all experiments, the inlet concentration of the aqueous RhB solution (Caq,i) is maintained at 22 μmol l−1. A total of 1000 images for 1 ml min−1 and 600 images for 3 ml min−1 are captured at a frame rate of 1.5 Hz. The image post processing for PLIF is also carried out using the commercial software Davis 8.2.2. Further quantification of slug characteristics, e.g. slug length and void fraction, is carried out using an in-house MATLAB code.47 The two phase PIV and PLIF results of the different structured porous reactors are further compared with an empty glass tube (ET) with identical internal diameter.
 | (1) |
 | (2) |
The overall extraction can be quantified by calculating the extraction efficiency E, which describes the concentration difference reached between the channel inlet and outlet compared to the maximum possible concentration difference between the inlet concentration and the equilibrium concentration between the two phases
 | (3) |
 | (4) |
The pressure drop for the empty tube ET could not be accurately measured experimentally and was therefore calculated using the homogeneous two-phase flow model.51,52
3. Results
3.1. Hydrodynamic study
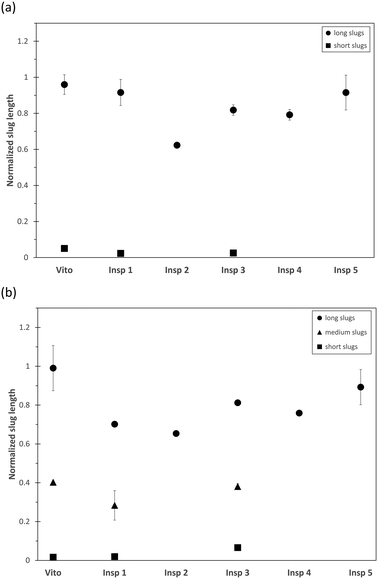
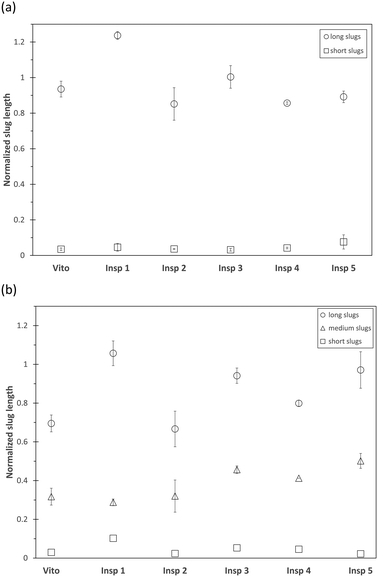
The combination of PIV and PLIF allows a detailed hydrodynamic study of the two-phase distribution of the toluene–water system downstream of the different porous reactors. For the chosen operating conditions, the two-phase flow of toluene–water is established as slug flow in an empty tube as the interfacial tension is sufficiently large to stabilize individual slugs.53The averaged slug length of the continuous water phase and dispersed toluene phase is measured using PLIF and is plotted in Fig. 5 for a total flow rate of 1 ml min−1. As we observe an alternating sequence of uniform water and toluene slugs in the empty tube, these values are used for normalization of the slug length obtained in the porous reactors, as this allows a clear visualization of the effect of the porous structures. For the reactors Vito, Insp 1, and Insp 3, a combination of long and short water slugs is observed (Fig. 5(a)), indicating the breakup of the continuous water phase through the interaction with the porous structure. For these structures, the dispersed toluene phase is also split into long, medium and short slugs (Fig. 5(b)). These 3 categories are defined based on the maximum slug length of each porous reactor, short slugs are smaller than 20% of the maximum, long slugs are larger than 80% of the maximum, and medium slugs are in between these values. The other porous structures (Insp 2, Insp 4, and Insp 5) exhibit an alternating sequence of uniform water and toluene slugs at this flow rate. However, it is also worth noting that all porous structures result in shorter slug sizes compared to the empty tube case, which is especially pronounced for the Insp 2 reactor which shows a slug size reduction of around 40%. Furthermore, it needs to be highlighted that we determined the slug sizes 2 cm downstream of the structure, as such obtained results are indicative of the hydrodynamics inside the structures but are not able to yield local information on e.g. the two-phase slip inside the porous structure.
Fig. 6 depicts the number distribution of the different slug sizes of the continuous water phase and dispersed toluene phase for a total flow rate of 1 ml min−1. An equal number fraction of short and long slugs indicates an alternating pattern, while a larger number fraction of short slugs indicates that more than one short slug is in between two long slugs. In the case of the water phase (Fig. 6(a)), it is observed that the 3 structures leading to slug breakup (Vito, Insp 1, and Insp 3) generate a larger number of short slugs. This is also true for the toluene phase (Fig. 6(b)) for the Vito and Insp 3 structure, resulting in the least amount of medium and long slugs for these two structures. This increased slug breakup of the toluene phase is not observed for the Insp 1 structure. When increasing the total flow rate to 3 ml min−1, all porous reactors induce slug breakup due to the increased shear forces acting inside the structure (Fig. 7). Similar to the total flow rate of 1 ml min−1, the resulting mean slug lengths of the water and toluene phases are smaller compared to the empty tube due to slug breakup. This is also true for the Insp 1 structure, where the long slugs of the water and toluene phases are 20% and 5% larger than in the empty tube case (indicating coalescence at the outlet of the porous reactor before the measurement location) but where also more medium and short size slugs are generated in each phase (Fig. 8). Comparing the obtained slug sizes and their respective number fraction between flow rates (Fig. 5–8), it is observed that an increase in flow rate leads to a decrease in the slug length, and this effect is more pronounced for the dispersed toluene slugs. For structures Insp 1 to Insp 5, an increase in flow rate leads to an increase in the number of short and medium sized slugs in both phases (Fig. 6 and 8), which indicates an increased slug breakup for these porous reactors with increasing shear forces.
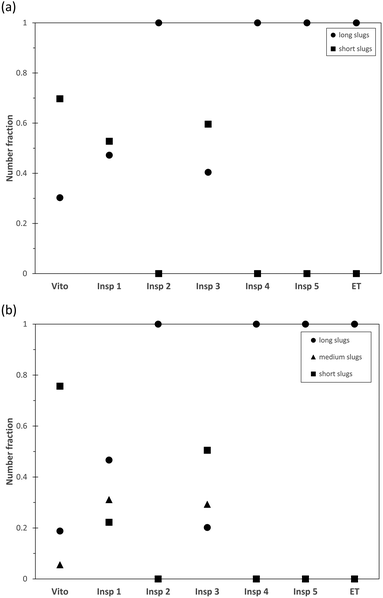 | ||
| Fig. 6 Distribution of slug sizes of the continuous water phase (a) and dispersed toluene phase (b) for a total flow rate of 1 ml min−1. | ||
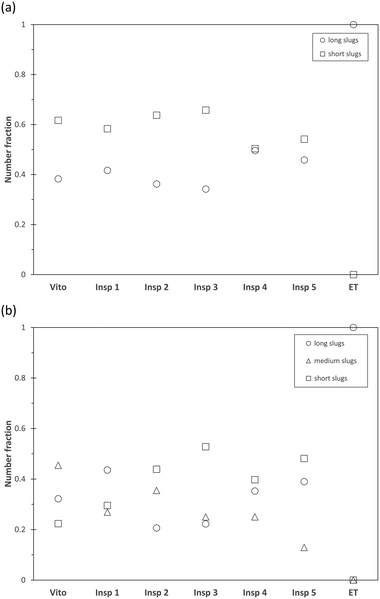 | ||
| Fig. 8 Distribution of slug sizes of the continuous water phase (a) and dispersed toluene phase (b) for a total flow rate of 3 ml min−1. | ||
Interestingly, this behavior is not observed in the Vito structure, where the number fraction of short water slugs decreases with increasing flow rate. Furthermore, in the toluene phase, the number fraction of medium slugs increases with an increase in flow rate, while the number fraction of short slugs is decreasing as well. This indicates a reduction in slug breakup efficiency when increasing the shear forces inside this particular porous structure. The major geometrical difference between the Vito and the Insp porous reactors is the lack of rotation between the fibre layers in the Vito design, thus the reduced slug breakup could be explained by channeling effects enabled by its design.
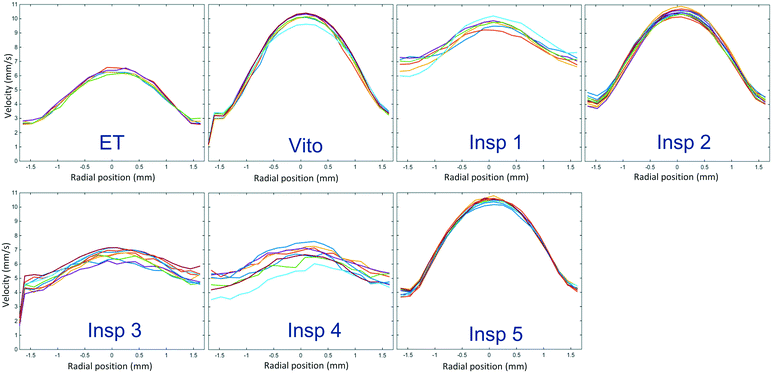
In addition to the distribution of slug sizes in each phase, we also investigated the individual slug velocities. 2D PIV is used to measure the local velocity distribution in each water slug, and the mean local phase velocity averaged over the length of the water slug is depicted in Fig. 9 for a total flow rate of 3 ml min−1. In this figure, each solid line represents the streamwise averaged velocity profile of an individual water slug. The obtained velocity profiles for 1 ml min−1 are identical and will not be presented here for brevity. The velocity profiles of the water phase in the empty tube correspond to fully developed slug flow, and hence any deviation from these profiles indicates the influence of the porous structure. It is observed that the porous reactors Insp 3 and Insp 4 exhibit velocity profiles similar to the empty tube, suggesting that the effects of these particular porous structures on the phase velocity are negligible as the profiles redevelop to their original shape rather quickly. The porous reactors Vito, Insp 2, and Insp 5 show a steep parabolic velocity profile. For the Insp 2 structure, this can be explained by the fact that this structure generates smaller slugs for both the water phase and the toluene phase, which then results in these steep parabolic velocity profiles. On the other hand, for the Vito and Insp 5 structures, we observe long slugs, which is another indication of the aforementioned channeling in these structures, also resulting in steep velocity profiles. The porous reactor Insp 1 exhibits the largest deviation from the developed empty tube velocity profile, also in its relatively flat profile, but more pronounced by the fact that the maximum velocity is two times larger compared to the empty tube. This indicates that the effect of this particular porous structure on the original slug flow is largest, as it is still redeveloping into its original pattern at the measurement location.
In Fig. 10, the averaged phase velocities of the water and toluene phases for both flow rates of 1 ml min−1 and 3 ml min−1 are compared. The averaged phase velocity of the water phase is obtained by averaging the PIV profiles shown in Fig. 9, and the phase velocity of the toluene phase is calculated from the PLIF measurements which allows the determination of the two-phase slip. Compared to the developed slug flow in the empty tube, all porous reactors lead to an increased velocity for both phases, which is expected as the presence of the porous structures reduces the available flow cross-section and thus results in higher local phase velocities. At both flow rates, the porous reactor Insp 1 exhibits the largest velocities of the water and toluene phases, which further illustrate the large influence of this particular porous design on slug flow. Furthermore, the toluene phase velocity is always greater compared to the water phase velocity. As toluene is the dispersed phase (also in the stainless steel porous structure), it will occupy a smaller cross-section, which then results in the observed velocity difference. This velocity difference, in combination with the overall phase velocity, will also lead to the development of secondary flow structures, which will affect interfacial mass transfer.
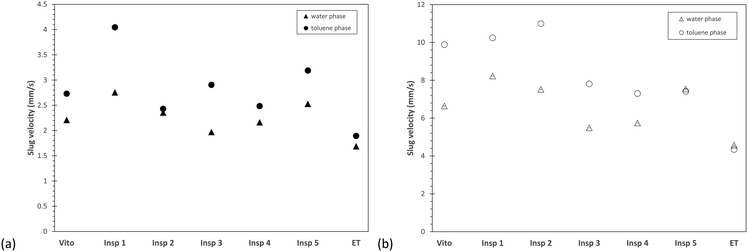 | ||
| Fig. 10 Average slug velocities of the continuous water phase and dispersed toluene phase for total flow rates of (a) 1 ml min−1 and (b) 3 ml min−1. | ||
3.2. Mass transfer characterization
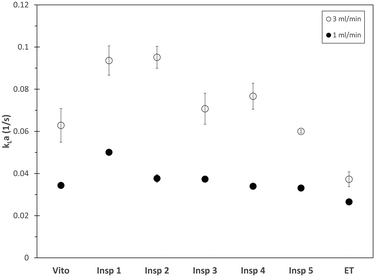
For the toluene–water system, the overall volumetric mass transfer coefficient kLa is obtained using the PLIF technique with RhB as transfer species. The toluene–water–RhB system is characterized by a large distribution coefficient of 760,46 which means that the transfer of RhB from the interface to the toluene phase is favored, while the transfer of RhB from the bulk of the water phase to the interface is the rate limiting step. Therefore, this system allows one to characterize the influence of the individual phase velocities and slug sizes on the overall mass transfer performance. The overall volumetric mass transfer coefficient kLa for the different porous reactors in comparison to the empty tube is depicted in Fig. 11.For both considered flow rates, the porous reactors result in an increased mass transfer coefficient compared to the empty tube. Furthermore, for all considered reactors, the overall mass transfer coefficient increases with increasing flow rate. Moreover, for the lower flow rate, the porous reactor Insp 1 results in the largest kLa value, whereas for the higher flow rate the reactors Insp 1 and Insp 2 exhibit the best mass transfer performance. As outlined above, the resistance to mass transfer is located in the bulk water phase, and consequently, the surface renewal velocities inside the water slug as well as the number fraction of short water slugs will directly influence the observed mass transfer. As such, the mass transfer performance of the individual porous reactors is supported by the hydrodynamic study. For a total flow rate of 1 ml min−1, the Insp 1 structure is characterized by the largest velocities of the water and toluene phases, together with a large phase velocity difference and a high number fraction of short water slugs. Increasing the total flow rate to 3 ml min−1, the Insp 2 structure will become equally effective as it also shows increased phase velocities and a large number fraction of short slugs. On the other hand, the porous reactor Insp 5 also showed increased water phase velocity, however paired with a limited phase velocity difference and a low number fraction of short slugs, and thus a lower overall mass transfer is observed. The combination of long water slugs with increased phase velocity observed for this structure can also be attributed to the aforementioned channeling phenomena. For the porous reactors Vito and Insp 3, a large number fraction of short slugs is observed, but their phase velocity is low, resulting in a comparatively lower mass transfer performance. The Insp 4 structure results in the lowest number fraction of short slugs, together with low phase velocities, and consequently also comparatively low kLa values are observed.
As mentioned above, the undisturbed water–toluene system in an empty tube will be established as elongated slug flow, and it has been shown that asymmetrical recirculation patterns within individual slugs enhance mass transfer.54 Such asymmetrical recirculation patterns can be generated when meandering channels are used.55 The analogy to meandering channels can be used to explain the increased mass transfer performance of the Insp 1 and Insp 2 structures compared to the other porous reactors. In these two structures, all design parameters are varied simultaneously, whereas all other structures only alter one or two parameters at a time. This increased degree of freedom in the design of Insp 1 and Insp 2 leads to a non-uniform channel path, which in turn results in improved inter-phase penetration and mass transfer coefficients.
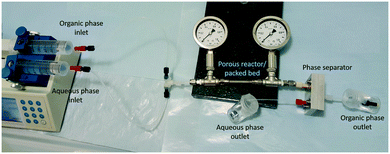
We then extended the mass transfer study using the n-butanol–water system with succinic acid as transfer species. While toluene–water is characterized by a large interfacial tension and slug flow, n-butanol–water has a low interfacial tension which then results in stratified flow.15 As a benchmark, the mass transfer performance of the porous reactors is compared with those of the two packed beds of comparable void volume but varying specific solid surface areas (Table 1). The observed overall volumetric mass transfer coefficient kLa is depicted in Fig. 12(a). For all considered reactors, the usual trend of increasing mass transfer with decreasing residence time is found. The results also demonstrate that the porous reactors Insp 1 and Insp 2 exhibit the largest mass transfer coefficients, approximately 14% larger than the observed values for the packed bed reactor PB 1 with similar void volume but significantly larger specific solid surface area. This is further illustrated by the extraction efficiency, depicted in Fig. 12(b). Complete mass transfer is obtained for these two porous reactors for residence times exceeding 20 s as the extraction efficiency reaches 100%, which further highlights their mass transfer improvements for low interfacial tension fluid pairs. Furthermore, and similar to the toluene–water system, in comparison with the Insp 1 structure, Insp 2 exhibited improved mass transfer performance with increasing flow rate (decreasing residence time). The observed kLa value of Insp 2 is smaller than Insp 1 for residence times above 10 s, but below this residence time a larger kLa is observed, which further illustrates that this particular design is beneficial for higher flow rates. All other porous reactors have a lower mass transfer coefficient compared to Insp 1, Insp 2, and PB 1. It is worth highlighting that the packed bed PB 2 with similar void volume and specific solid surface area to those of the porous structures exhibits comparatively low mass transfer coefficients which are found to be smaller than Insp 4 and Insp 5, only exceeding Insp 3 and the empty tube ET. This highlights the improved performance of the designed porous structures, which on average increases mass transfer compared to packed beds with similar void volume and similar specific solid surface area.
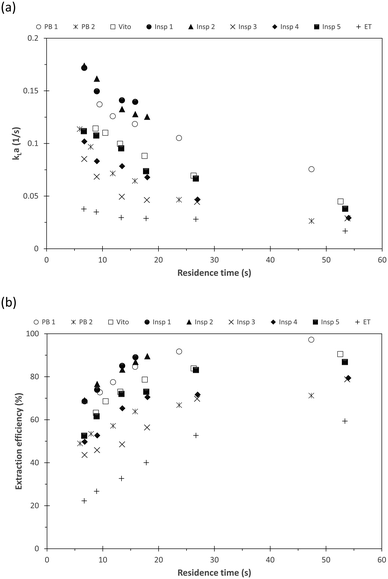 | ||
| Fig. 12 (a) Overall mass transfer coefficient kLa and (b) extraction efficiency for the different porous reactors and packed beds using the n-butanol–water–succinic acid system. | ||
As the n-butanol–water system is established as stratified flow, the enhancement of interfacial mass transfer is directly correlated with the degree of radial mixing, whereas for the toluene–water system established as slug flow improved inter-phase penetration is more important. Comparing the obtained mass transfer coefficients, we can conclude that the porous reactors Insp 1 and Insp 2 enhance both inter-phase penetration and radial mixing, since the largest kLa values are observed for both fluid pairs. As outlined above, this can be explained by the non-uniform channel path, which is achieved by simultaneously varying all design parameters throughout the porous structure. Insp 3 and Insp 4 perform better for toluene–water but worse for n-butanol–water compared to the Vito and Insp 5 structures. Consequently, the Insp 3 and Insp 4 structures achieve comparatively larger inter-phase penetration, which can be related to their geometry as they introduce a rotation with respect to the plane normal to the mean flow direction (x,y-plane, angle φ). On the contrary, the Vito and Insp 5 structures are characterized by a radial offset and a rotation of fibre layers with respect to the mean flow direction (z-axis, angle θ), respectively. This leads to an increase in radial mixing and consequently a comparatively better mass transfer performance for the n-butanol–water system.
3.3. Pressure drop and energy dissipation
In order to quantify the mass transfer performance of each reactor, it is important to consider the energy required to achieve the observed kLa values. This energy input is related to the pressure drop across the porous reactor, which is depicted in Fig. 13 for the n-butanol–water system at different total flow rates. For the studied range of operating conditions, a linear relationship between pressure drop and flow rate is observed, which indicates that turbulence inside the porous structures is negligible. Furthermore, it is evident that all porous reactors are characterized by a significantly lower pressure drop compared to the packed bed reactors, where PB 1 exhibits the largest pressure drop due to viscous dissipation at the comparatively large solid surface area. However, the pressure drop induced by PB 2 with similar specific solid surface area as the designed porous structures is still an order of magnitude larger compared to them. Within the structured porous reactors, and at a given flow rate, Vito and Insp 5 yield the lowest pressure drop values, which might again signify channeling effects in these two designs. The reactors Insp 2, Insp 3 and Insp 4 experience similar pressure drop across all flow rates, and the largest pressure drop is experienced by the reactor Insp 1.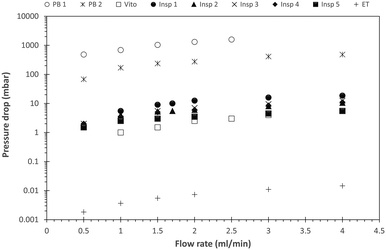 | ||
| Fig. 13 Pressure drop across the porous reactors for varying total flow rates. The pressure drop is plotted on a logarithmic scale to accommodate the visibility of the data points in a single figure. | ||
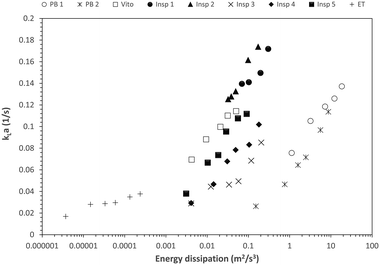
However, when considering the energy dissipation, the reactor Insp 1 has the best overall performance across all flow rates (Fig. 14). The porous structure Insp 2 only achieves larger mass transfer coefficients at elevated energy dissipation (increased flow rates). Comparing the different porous reactors, the second best mass transfer performance is achieved by Vito and Insp 5, which is connected to their improvement in radial mixing, while Insp 3 and Insp 4 perform least good. However, it has to be noted that for comparable kLa values, all structured porous reactors result in an order of magnitude lower energy dissipation compared to the packed bed reactors. This clearly highlights the potential of structured porous reactors for their application in efficient chemical processes.
4. Conclusions
A hydrodynamic study of novel designed porous milli-scale reactors for improved mass transfer in an immiscible liquid–liquid flow system is carried out using PIV and PLIF. The obtained results are compared with an empty tube case, and the results illustrate that porous reactors induce slug breakup and thus inter-phase penetration especially at higher flow rates. Consequently, the resulting mean slug lengths of the individual phases are significantly reduced compared to the empty tube. The geometry of the porous reactors greatly affects the velocity profile in the slugs, and porous designs with no structural variation in the streamwise direction (Vito and Insp 5) are susceptible to channeling. However, all porous reactors result in enhanced local phase velocities.The effect of these different hydrodynamics is further observed when quantifying the interfacial mass transfer. For this, we considered the slug flow (in an empty tube) of toluene–water (RhB as transfer species) and the stratified flow (in an empty tube) of n-butanol–water (succinic acid as transfer species). By addressing different flow regimes, we have identified the link between the orientation of the constituting layers of the porous geometry and if it is able to enhance inter-phase penetration and/or radial mixing. Overall, the porous reactors Insp 1 and Insp 2 have been identified as the most promising designs, as they result in the largest kLa values for both flow regimes. These particular designs are characterized by a non-uniform channel path, which is achieved by simultaneously varying all design parameters throughout the porous structure, most importantly rotations parallel and normal to the mean flow directions. Having only a single component of rotation results in lower mass transfer performance for either slug or stratified flow.
This study also highlights that structured porous reactors achieve the same order of interfacial mass transfer performance as packed bed reactors but at orders of magnitude lower energy dissipation. This clearly proves their potential for integration in novel flow reactors.
Nomenclature
Roman symbols
| a | Interfacial area (m2 m−3) |
| C | Concentration (mol l−1) |
| E | Extraction efficiency |
| k L a | Overall mass transfer coefficient (1/s) |
| Δp | Pressure drop (Pa) |
| Q | Flow rate (ml min−1) |
| V R | Reactor volume (m3) |
| x, y, z | Cartesian coordinates |
Greek symbols
| ε | Energy dissipation (m2 s−3) |
| η | Viscosity (Pa s) |
| φ | Rotation angle with respect to the x,y-plane |
| θ | Rotation angle around the z-axis |
| ρ | Density (kg m−3) |
| σ | Interfacial tension (N m−1) |
| τ | Residence time (s) |
Abbreviations
| 3DFD | 3 Dimensional fibre deposition |
| PIV | Particle image velocimetry |
| PLIF | Planar laser induced fluorescence |
| RhB | Rhodamine B |
| SLS | Selective laser sintering |
Acknowledgements
We thank Adriaan Spierings (inspire AG – innovation center for additive manufacturing, Switzerland) for manufacturing the custom designed porous reactors. S. K. acknowledges funding from Marie Curie CIG and FWO-Odysseus II.References
- R. L. Hartman, J. P. McMullen and K. F. Jensen, Angew. Chem., Int. Ed., 2011, 50, 7502–7519 CrossRef CAS PubMed.
- K. F. Jensen, B. J. Reizman and S. G. Newman, Lab Chip, 2014, 14, 3206–3212 RSC.
- J. P. McMullen and K. F. Jensen, Annu. Rev. Anal. Chem., 2010, 3, 19–42 CrossRef CAS PubMed.
- T. Razzaq and C. O. Kappe, Chem. – Asian J., 2010, 5, 1274–1289 CAS.
- V. Hessel and T. Noël, in Ullmann's Encyclopedia of Industrial Chemistry, Wiley-VCH Verlag GmbH & Co. KGaA, 2012, DOI:10.1002/14356007.q16_q01.
- V. Hessel and T. Noël, in Ullmann's Encyclopedia of Industrial Chemistry, Wiley-VCH Verlag GmbH & Co. KGaA, 2012, DOI:10.1002/14356007.b16_b37.pub2.
- A. Adamo, R. L. Beingessner, M. Behnam, J. Chen, T. F. Jamison, K. F. Jensen, J.-C. M. Monbaliu, A. S. Myerson, E. M. Revalor, D. R. Snead, T. Stelzer, N. Weeranoppanant, S. Y. Wong and P. Zhang, Science, 2016, 352, 61–67 CrossRef CAS PubMed.
- B. Gutmann, D. Cantillo and C. O. Kappe, Angew. Chem., Int. Ed., 2015, 54, 6688–6728 CrossRef CAS PubMed.
- S. Mascia, P. L. Heider, H. Zhang, R. Lakerveld, B. Benyahia, P. I. Barton, R. D. Braatz, C. L. Cooney, J. M. B. Evans, T. F. Jamison, K. F. Jensen, A. S. Myerson and B. L. Trout, Angew. Chem., Int. Ed., 2013, 52, 12359–12363 CrossRef CAS PubMed.
- P. Poechlauer, J. Manley, R. Broxterman, B. Gregertsen and M. Ridemark, Org. Process Res. Dev., 2012, 16, 1586–1590 CrossRef CAS.
- M. N. Kashid, A. Renken and L. Kiwi-Minsker, Chem. Eng. Sci., 2011, 66, 3876–3897 CrossRef CAS.
- V. Hessel, P. Angeli, A. Gavriilidis and H. Löwe, Ind. Eng. Chem. Res., 2005, 44, 9750–9769 CrossRef CAS.
- M. W. Losey, M. A. Schmidt and K. F. Jensen, Ind. Eng. Chem. Res., 2001, 40, 2555–2562 CrossRef CAS.
- J. R. Naber and S. L. Buchwald, Angew, Chem., Int. Ed., 2010, 49, 9469–9474 CrossRef CAS PubMed.
- A. Woitalka, S. Kuhn and K. F. Jensen, Chem. Eng. Sci., 2014, 116, 1–8 CrossRef CAS.
- J. Banhart, Int. J. Vehicle Des., 2005, 37, 114–125 CrossRef.
- F. Baumgärtner, I. Duarte and J. Banhart, Adv. Eng. Mater., 2000, 2, 168–174 CrossRef.
- A. Bhattacharya, V. V. Calmidi and R. L. Mahajan, Int. J. Heat Mass Transfer, 2002, 45, 1017–1031 CrossRef CAS.
- K. Boomsma, D. Poulikakos and F. Zwick, Mech. Mater., 2003, 35, 1161–1176 CrossRef.
- T. J. Lu, H. A. Stone and M. F. Ashby, Acta Mater., 1998, 46, 3619–3635 CrossRef CAS.
- M. S. Phanikumar and R. L. Mahajan, Int. J. Heat Mass Transfer, 2002, 45, 3781–3793 CrossRef CAS.
- C. Hutter, A. Zenklusen, R. Lang and P. Rudolf von Rohr, Chem. Eng. Sci., 2011, 66, 1132–1141 CrossRef CAS.
- A. Montillet, J. Comiti and J. Legrand, Chem. Eng. J., 1993, 52, 63–71 CrossRef CAS.
- J. G. Fourie and J. P. Du Plessis, Chem. Eng. Sci., 2002, 57, 2781–2789 CrossRef CAS.
- D. Butscher, C. Hutter, S. Kuhn and P. Rudolf von Rohr, Exp. Fluids, 2012, 53, 1123–1132 CrossRef.
- C. Hutter, C. Allemann, S. Kuhn and P. Rudolf von Rohr, Chem. Eng. Sci., 2010, 65, 3169–3178 CrossRef CAS.
- C. Hutter, A. Zenklusen, S. Kuhn and P. Rudolf von Rohr, Chem. Eng. Sci., 2011, 66, 519–529 CrossRef CAS.
- M. V. Twigg and J. T. Richardson, Ind. Eng. Chem. Res., 2007, 46, 4166–4177 CrossRef CAS.
- M. D. Das, A. N. Hrymak and M. H. I. Baird, Chem. Eng. Sci., 2013, 101, 329–344 CrossRef CAS.
- F. Theron, N. Le Sauze and A. Ricard, Ind. Eng. Chem. Res., 2010, 49, 623–632 CrossRef CAS.
- C. P. Stemmet, J. N. Jongmans, J. van der Schaaf, B. F. M. Kuster and J. C. Schouten, Chem. Eng. Sci., 2005, 60, 6422–6429 CrossRef CAS.
- C. P. Stemmet, M. Meeuwse, J. van der Schaaf, B. F. M. Kuster and J. C. Schouten, Chem. Eng. Sci., 2007, 62, 5444–5450 CrossRef CAS.
- C. P. Stemmet, J. Van Der Schaaf, B. F. M. Kuster and J. C. Schouten, Chem. Eng. Res. Des., 2006, 84, 1134–1141 CrossRef CAS.
- M. Serres, M.-L. Zanota, R. Philippe and V. Vidal, Int. J. Multiphase Flow, 2016, 85, 157–163 CrossRef CAS.
- J.-N. Tourvieille, R. Philippe and C. de Bellefon, Chem. Eng. Sci., 2015, 126, 406–426 CrossRef CAS.
- J.-N. Tourvieille, R. Philippe and C. de Bellefon, Chem. Eng. J., 2015, 267, 332–346 CrossRef CAS.
- L. Lü, J. Y. H. Fuh and Y. S. Wong, in Laser-Induced Materials and Processes for Rapid Prototyping, Springer US, Boston, MA, 2001, pp. 89–142, DOI:10.1007/978-1-4615-1469-5_5.
- A. B. Spierings, N. Herres and G. Levy, Rapid Prototyp. J., 2011, 17, 195–202 CrossRef.
- J. Lefevere, M. Gysen, S. Mullens, V. Meynen and J. Van Noyen, Catal. Today, 2013, 216, 18–23 CrossRef CAS.
- S. Danaci, L. Protasova, J. Lefevere, L. Bedel, R. Guilet and P. Marty, Catal. Today, 2016, 273, 234–243 CrossRef CAS.
- J. Luyten, S. Mullens and I. Thijs, KONA Powder Part. J., 2010, 28, 131–142 CrossRef CAS.
- T. Misek, R. Berger and J. Schröter, Standard test systems for liquid extraction, Institute of Chemical Engineers, 1985 Search PubMed.
- D. C. Meinhart, T. S. Wereley and G. J. Santiago, Exp. Fluids, 1999, 27, 414–419 CrossRef.
- G. J. Santiago, T. S. Wereley, D. C. Meinhart, J. D. Beebe and J. R. Adrian, Exp. Fluids, 1998, 25, 316–319 CrossRef.
- J. P. Crimaldi, Exp. Fluids, 2008, 44, 851–863 CrossRef CAS.
- H. Watarai and F. Funaki, Langmuir, 1996, 12, 6717–6720 CrossRef CAS.
- S. Fransen and S. Kuhn, React. Chem. Eng., 2016, 1, 288–299 CAS.
- M. E. Leblebici, S. Kuhn, G. D. Stefanidis and T. Van Gerven, Chem. Eng. J., 2016, 293, 273–280 CrossRef CAS.
- R. P. Verma and M. M. Sharma, Chem. Eng. Sci., 1975, 30, 279–292 CrossRef CAS.
- T. Vandermeersch, R. Goovaerts, J. Luyten, J. F. M. Denayer and W. De Malsche, Chem. Eng. J., 2015, 279, 9–17 CrossRef CAS.
- D. R. H. Beattie and P. B. Whalley, Int. J. Multiphase Flow, 1982, 8, 83–87 CrossRef CAS.
- H. Müller-Steinhagen and K. Heck, Chem. Eng. Process.: Process Intesif., 1986, 20, 297–308 CrossRef.
- H. S. Joshua, D. Tice, A. D. Lyon and R. F. Ismagilov, Langmuir, 2003, 19, 9127–9133 CrossRef.
- D. Fries, S. Waelchli and P. Rudolf von Rohr, Chem. Eng. J., 2008, 135, S37–S45 CrossRef CAS.
- P. Plouffe, D. M. Roberge, J. Sieber, M. Bittel and A. Macchi, Chem. Eng. J., 2016, 285, 605–615 CrossRef CAS.
| This journal is © The Royal Society of Chemistry 2017 |


