
Microfluidics with in situ Raman spectroscopy for the characterization of non-polar/aqueous interfaces†
Bruno
Pinho
and
Ryan L.
Hartman
 *
*
Department of Chemical and Biomolecular Engineering, New York University, 6 MetroTech Center, Brooklyn, NY 11201, USA. E-mail: ryan.hartman@nyu.edu
First published on 15th December 2016
Abstract
The design of microfluidics with in situ Raman spectroscopy is reported in the present work for the investigation of immiscible non-polar/aqueous interactions. A dynamic aqueous phase in contact with a static hydrophobic phase (semi-flow) was engineered on-chip by performing a force balance, and it was validated using high-resolution in situ Raman spectroscopy. The semi-flow microfluidic device isolated non-polar solvents in a series of micro-reservoirs that communicated with aqueous laminar flows via molecular diffusion. As a consequence, the inspection of concentration and density profiles from the bulk-to-bulk of toluene–, diethyl ether–, and xylenes–water were made possible. The Schlieren pattern was observed for all solvent pairs, and the bulk-to-bulk region was characterized by water rarefaction (17.5 to 23.2 μm), mixing (3.4 to 6.4 μm), and hydrophobic shockwaves (34.9 to 38.8 μm). Understanding the position, thickness, and profiles of each zone revealed new insight on the chemistry at the interface, which could someday be used to validate molecular simulations, reduce the quantities of solvents wasted during separations/purifications of compounds, and improve kinetic models for mixed mass-transfer-reaction-rate-limited and mass-transfer-limited scenarios in continuous-flow processes.
Introduction
The engineering of continuous-flow techniques has changed the way fine chemicals, materials, natural products, and pharmaceuticals are synthetized1–3 and how well their reaction chemistry is understood.4,5 Performing reactions at the micro-scale,6 for instance, can reduce the amount of chemical waste generated,7 minimize the facilities footprint,8 generate in situ data and faster,9 yield accurate predictive mathematical models, and enable safer handling of hazardous compounds.10,11 The integration of analytical methods for in situ reaction discovery12 and kinetics development13 are key roadblocks of autonomous reactors of the future that make recommendations for scale-ups.14The preparation of fine chemicals, materials, natural products, and pharmaceuticals commonly require multiphase reactions and liquid–liquid separations. Interfacial phenomena and mass transport must be understood in order to develop intrinsic kinetic and separation models. Interfacial contact is crucial to drive reactions near equilibrium towards target products, but also, in some cases, the synthesis takes place at the fluid–fluid interface,15 such as Schotten–Baumann reaction (synthesis of amides from amines and acid chlorides). Today, we have reached a state where a fundamental understanding of the structure and dynamic of the interface is required to further develop processes.15 As an example, it is still not completely understood how and where organometallic reactions with hydrophilic ligand take place in the presence of water (e.g., the Heck alkynylation, a.k.a., the copper-free Sonogashira coupling, of 1-bromo-4-trifluoromethyl benzene with phenyl acetylene).16–20 Such transformations might occur on the organic bulk with water solubilized, or within a thin interfacial film between the aqueous and the organic phase. Water is an attractive solvent for organometallic reactions because it is cheap, easily accessible, and non-toxic. Many polar salt by-products formed during C–C and C–N bond formations are also soluble in water. Finally, aqueous solvents have the potential to reduce the mass of chemical waste, also known as E-factor.16
Two basic questions need to be answered when performing aqueous-organic (biphasic) reactions: (1) “what is the thickness of the interface?”, and (2) “what are the concentration profiles of the transition zone (from the aqueous-bulk to the organic-bulk)?”. Despite the underlying nature of these questions, the interfacial region has a unique set of properties21 governed by repulsive and attractive driving forces related with viscosity, density, diffusivity and polarity. Its discussion normally involves molecular simulations or experimental probing. However, the experimental knowledge for liquid–liquid immiscible systems is quite scattered and filled with uncertainties, due to the instrumental noise22 and the limited availability of in situ chemical analytical methods.
In the microfluidic segmented flow of two immiscible phases (e.g., where the flow is laminar), the flow rate controls the interfacial film thickness.23 Thin film theory for fluid–fluid reactions applied to estimate the diffusive flux across the interface,24 ranging from 1 to 10 μm,25 overlook that the concentration and the density profiles can be much broader. From a process design point of view, characterization of the interface provides opportunities to: (1) accurately estimate mass transport coefficients, (2) identify efficient chemical pathways (by doing in situ experiments), (3) understanding chemical reaction dynamics and thermodynamics at different fluid phases and stages of the process, and (4) design catalysts/ligands that take advantage of the solvation and adsorption at the interface.22
Direct (surface and interfacial tension) and indirect (optical and spectroscopic) methods have been engineered to study interfaces with limited knowledge available to understand reactor design and transport phenomena. Regarding the spectroscopic methods, X-ray and neutron are commonly applied to investigate the interfacial region at molecular scale (angstroms), with primary applications focused on the study of the gas–liquid-free-surface at the stationary state. Other spectroscopic techniques have been employed, such as IR,26 PLIF27 and Raman;28–31 providing microscopic information from the bulk-to-bulk. For instance, Mühlfriedel & Baumann27 applied laser-induced fluorescence (PLIF) techniques on a 148 μL quartz cuvette to investigate two immiscible liquid's bulks (1-butanol-water). The distance between the bulks was reported as up to 2 mm. Serio et al.28 monitored the water–carbon tetrachloride interface with Raman spectroscopy on a cuvette, having a thickness ∼900 nm. More recently, Poltorak et al.29 used in situ Raman spectroscopy and electrical potential to analyse two immiscible solutions (aqueous and organic, 1,2-dichloroethane). Albeit the authors were able to detect the position of the interface, neither the thickness was evaluated, nor were the density or the concentration profiles discovered. As a consequence, not enough information was provided to understand mass transfer phenomena; a consistent theme in the current state-of-the-art. Furthermore, the previous works reported advances in steady-state batch systems, which are not always representative of continuous systems no matter what the length scales, e.g., molecular-, micro-, meso-, and macro-scales. For instance, viscous forces, interfacial contact areas and thicknesses, and phase behaviors all vary from batch to flow, which can also influence the mass transfer phenomena.
The aim of the present study is to understand the behaviour of an aqueous and hydrophobic interface, through the design of semi-flow microfluidics with high-resolution in situ Raman. Our novel semi-flow microfluidics are based on two working principals: (1) the entrapment of a hydrophobic fluid inside a micro-reservoir (μReservoir), and (2) its infinite, steady-state contact with an aqueous fluid flowing near the μReservoir. The design enables a static liquid–liquid interface and the continuous replacement of the aqueous phase with fresh solvent (semi-flow). In this paper, we report the location, identification, and thickness of transport zones near the interface at a microfluidic level: aqueous-bulk, aqueous rarefaction, mixture, hydrophobic shockwave, and hydrophobic-bulk. Three different liquid–liquid systems, relevant to synthetic chemistry, are examined: toluene–water, xylenes–water, and diethyl ether–water. The semi-fow microfluidics with in situ Raman spectroscopy could be used to improve the accuracy of mass transport coefficients, identify chemical pathways, understand intrinsic kinetics and thermodynamics, and design catalysts.
Experimental section
Chemicals
High purity water was produced using a Milli-Q system (Millipore). Toluene (>99.8% purity) was purchased from VWR. Acetonitrile, diethyl ether and ethanol (>99.8%, >99% and 99.5% purity) were purchased from Millipore. Xylenes (>99.5% purity, 106.17 g mol−1) were purchased from Sigma-Aldrich. Phenylacetylene (>98% purity) was purchased from Alfa Aeser.Experimental set-up
The experimental set-up is shown schematically in Fig. 1. The set-up was carefully designed to avoid dust particles, fluid contamination, leakages, backflow, and air bubbles, being consequently divided into four blocks: (I) pump system, (II) control module, (III) assembled microfluidic semi-flow device and (IV) process downstream. Various types of tubing were used: peek and stainless steel (both having inner diameters of 1/50 in and outer diameters of 1/16 in, respectively). The stainless steel tubing was only used on the control module (II). | ||
| Fig. 1 Schematic of the experimental microfluidic set-up to investigate liquid–liquid immiscibility. The Raman laser is pointed at the microchannels of the device, which operates in continuous mode. | ||
At the pump system (I), two Harvard Apparatus PHD Ultra Syringe Pumps with Hamilton 1010C 10 mL syringes were used to drive the fluids: aqueous, organic, and ethanol (for cleaning purposes). Each syringe was carefully filled to avoid air bubbles, which could otherwise have introduced reproducibility problems due to the presence of unwanted stochastic events. Following each pump, filters with 2 μm pores (stainless steel frits from IDEX Health and Science®) were placed to prevent dust particles circulation.
All the fluids were passed through a control module (II), which consist of a set of purge valves (on-off valves), check valves, and pressure transducers (Honeywell SPT4V0500PG5W02, max. 32 bars, accuracy ±0.25%). The check valves (0.03 bar) were placed to prevent backflow circulation, in order to avoid contamination of the lines with pure fluid (before the mixing point).
After the control module (II), the fluids reach the assembled microfluidic semi-flow device (III), which is composed by check, on-off valves, and the silicon-based device (Si/Pyrex). They are placed to avoid backflow and, most importantly, ensure quick response to flow-rate changes in the microfluidic device, i.e., the delay time of each fluid is independent of the tubing length. The temperature was controlled using ceramic electrical resistance (Watlow 100 W) coupled to a PID controller (Watlow EZ-Zone, accuracy ±0.2 K). The microfluidic device (Si/Pyrex) and the near tubing were assembled inside a class 1 laser enclosure surrounding the Raman's microscope stage. The microsystem was fixed on a chuck/clamp module (for more information, see Marre et al.11 and Hartman et al.32). Two calibrated thermocouples type K were used to monitor the temperature. One was placed inside the spectrometer's enclosure, to measure the environmental temperature, and another was placed at the screw position of the microsystem's clamp. The temperature of this thermocouple was correlated to the microsystem's optical surface (Pyrex). This was achieved by operating an IR thermal camera (ICI 9640p). The experimental data was acquired using in situ confocal Raman spectroscopy (Horiba LabRam HR evolution, Jobin-Yvon) equipped with a 532 nm laser, a magnification of 10× (MPlanN Olympus, 0.25 NA, 10.6 mm WD), CCD Synapse EM detector, and Horiba's DualScan and Swift technologies. The Raman spectrometer and additional devices were ergonomically placed on a vibration-free optical table (TMC, USA). All Raman spectra were recorded with Labspec V6, and the results were processed using Matlab R2016a with third-party libraries, such as: GSTools (import “.spc” file's data) and iSignal (correct spectra baseline). A linear baseline correction was applied to all the peaks, in exception to the water peak, which the baseline was corrected by subtraction of the average intensity value at neat the right tail of the water peak. Pressure, temperature, and flow-rates were recorded using an acquisition board (National Instruments, cDAQ-9171) and a LabView code developed in-house. Regarding the process downstream (IV), the pressure was controlled using an IDEX back pressure regulator (BPR) at 0.34 bar (gauge) (sweep volume of 134 μL), and afterwards, the fluid was collected in a closed vial.
Semi-flow microfluidics
Conceptual design
To study bulk-to-bulk concentration profiles, a silicon-based microfluidic semi-flow device was designed at New York University, USA, and it was fabricated using standard lithography/dry etching techniques (by Micronit), known to produce anisotropic features. A thin-film of dielectric barrier (e.g., stoichiometric silicon nitride) was also deposited on the substrate by chemical vapour deposition. By design, the resultant microfluidic device has two defined zones: cooled and heated. The cooled zone is composed by inlet/outlet, mixing, and heat thermal insulation4,11 (Fig. 2). The heated zone consists of μReservoirs and a long microchannel (Fig. 2). The concept behind this design proposition (later presented in more detail) is to have a hydrophobic phase trapped inside each μReservoir while an immiscible aqueous phase flows through a long microchannel. The design provided continuous refreshing of one species being studied, and it enabled the examination of a static interface between the immiscible phases. | ||
| Fig. 2 A) Microfluidic semi-flow device. B) Hydrophobic phase injection into a microchannel filled with air, and electrical analogue for its stationary state. C) Hydrophilic phase injection into a microchannel filled with a hydrophilic phase, and electrical analogue for its stationary state. | ||
The μReservoirs and the main channel communicated via rectangular capillaries (Fig. 2A) where the fluids contacted and the interface was developed. Regarding the volumes of each zone (Fig. 2A), a μReservoir has 0.32 μL, a capillary has 0.01 μL, and the main channel has 235 μL. The depth of the microdevice is approximately 500 μm. The rectangular aspect ratios of the microchannels (width/depth) vary from 0.1 to 1.6 (see dimensions on Fig. 2A). In total, there are 119 μReservoirs in the microsystem (17 μReservoirs per series), which, as will be later discussed, confirmed that no invasion of the aqueous phase within the μReservoirs occurred.
A reproducible stepwise procedure for cleaning and initiation of the system was adopted; before performing each experiment, the device was carefully cleaned with ethanol, then air was manually pumped into the device to dry it, preventing contaminations. This procedure was repeated until all the μReservoirs were dried. Next, the hydrophobic fluid was injected into the system at 30 μm min−1 at 0.33 bar (imposed by the back pressure regulator) (Fig. 2B). The pressure was increased using a micrometric valve until all the air bubbles trapped were dissolved, and then the pressure was decreased to the working conditions, 0.33 bar. Afterwards, only the aqueous phase was pumped into the system (Fig. 2B) at 30 μm min−1.
When adding fluid to the microsystem (Fig. 2B and C), the meniscus position at the top and bottom of the capillaries varied with time until the hydrostatic, capillary, and viscous forces were balanced. The fluid invasion mechanism depended on the type of capillaries33 used (open-ended or close-ended). Our system was described by an open-ended capillary when the hydrophobic fluid was injected into the microfluidic device filled with air. At this stage, the fluid was pushed by capillary forces into the μReservoir without having any constraint. In contrast, when the aqueous phase was pumped into the system, it reached the top and bottom capillary, which was blocked by a hydrophobic static phase. This can be compared to a behaviour of a close-ended capillary. To have an invasion, the viscous and hydrostatic forces have to be significant enough to overcome the capillary forces (applied on the meniscus, which were at the top and the bottom capillary). By experimental visualization of the set-up, when there was an invasion of the μReservoir (filled with a hydrophobic phase), the meniscus (top capillary) moves towards the μReservoir, leading to a dispersed phase (in the form of droplets created by pinch-off34,35).
Theory
A force balance can be performed to better understand the microfluidic semi-flow device. Fig. 2(B and C) shows the analogue electrical network for the flow distribution between the main channel and the μReservoirs (hydraulic network). The pressure drop when infusing the fluid phases (hydrophobic or hydrophilic) can be modelled as a voltage drop, using Kirchhoff's voltage laws (KLV).36 Our objective is to have a simplified model that could be useful to rationalize the ongoing phenomena and help to design systematic experiments. For the models proposed, the assumptions are: (I) the system is in a stationary state, (II) the capillary forces are negligible for the hydrophilic phase invasion at stationary state (Fig. 2B), (III) the additional flow resistances caused by geometrical effects (e.g., meniscus stretching and folding) are not considered, and (IV) the variations of the contact angle are not incorporated (arising from interactions between a continuous and a stationary phase). Assumptions (I) through (IV) are later validated by experiments.A series of μReservoirs channels (1 out of 7 series, having each 17 μReservoirs) can be represented by systems of linear equations: (1) [stationary state; hydrophobic phase] and (2) [stationary state; hydrophobic + hydrophilic phase],
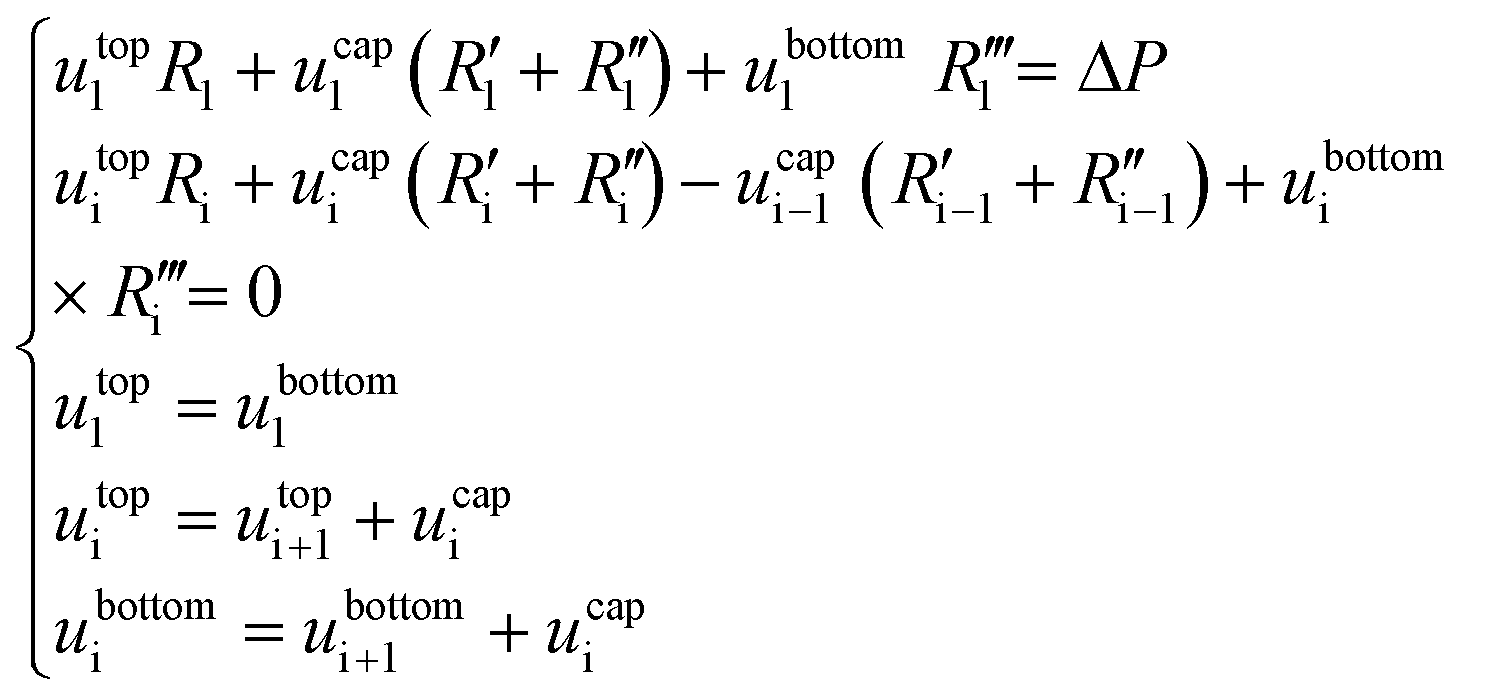 | (1) |
 | (2) |
The flow inside the channels can be considered as laminar flow (Re < 50 for a maximum flow-rate of 1 mL min−1). According to Hagen–Poiseuille's equation, the hydraulic resistance (viscous term) can be defined as:
 | (3) |
Eqn (3) can be applied to the main channel and the capillaries when the microsystem is filled with air (Fig. 2B), but it should not be applied when there is a meniscus between a hydrophobic and hydrophilic phase. According to Lim et al.33 the reasons are: (I) the velocity profile at the entrance of the capillary is unlikely to have a parabolic shape, which defines the laminar flow, and (II) the velocity profile has higher velocity gradients, having higher shear stress and dampening of oscillations. Consequently, the viscous term is underestimated, and a fitting factor K must be added. Therefore, (3) can be redefined as:33
 | (4) |
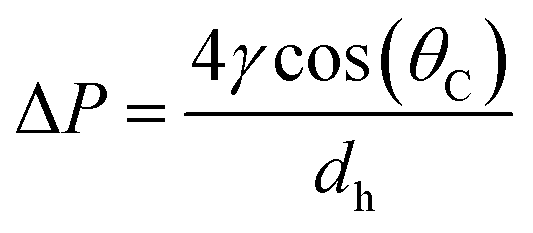
In the capillary microchannel, the longitudinal component of the surface tension force must balance the viscous forces at the meniscus. According to Laplace–Young's equation, the capillary forces can be defined by:
 | (5) |
| Species | Contact anglea (°) (water convex side, organic concave side) | γ (mN m−1) |
|---|---|---|
| a Values measured on a chip, using ImageJ. b When the value was not available in literature at the required temperature, the value available at 298.15 K was assumed to be close to the one at 313.15 K. | ||
| Toluene–water | 119.1 | 32.8 (ref. 37) |
| Diethyl ether–water | 118.8 | 10.7 (ref. 38) |
| Xylenes–water | 124.5 | 37.9 (ref. 39) |
After solving (1), which describes the wetting of the device's surfaces by a hydrophobic solvent (Fig. 2B), it is now possible to identify the flow-rate distribution at each μReservoir relatively to the inlet (Q1) (Fig. 3). As expected, the flow-rate is not equally divided, being 20 times superior at the first μReservoir when compared to the last of the same series. Similar fluid distributions were obtained independent of the specie injected, but having different pressure drop. For the microsystem designed, at least 7.8 minutes are required to fill all μReservoirs at a flow-rate of 30 μL min−1, assuming no air trapped. The total pressure drop across the microsystem (7 series of μReservoirs) at 313.15 K and 0.32 bar is expected to be 0.532, 0.103 and 0.489 mbar, for toluene (μ = 0.55 mPa s), diethyl ether (μ = 0.11 mPa s) and xylenes (μ = 0.51 mPa s), respectively.
 | ||
| Fig. 3 Flowrate distribution inside the μReservoirs in relation to the inlet flow-rate (Qi/Q1, where Q1 is the inlet flow-rate) for a system with hydrophobic phase in stationary state (Fig. 2B). Similar results are obtained for different fluids and flow-rates below 500 μL min−1. | ||
When solving (2), a K value must be defined. Since this parameter comes from experimental fitting, the system of eqn (2) were only applied after proceeding with experiments.
Results and discussion
Proof of concept
Before applying the microfluidic design to identify the liquid–liquid interface, a proof of concept for the semi-flow device was done experimentally (continuous phase: hydrophilic phase; stationary phase: hydrophobic phase). The microfluidic semi-flow device was tested for toluene–water, xylenes–water, and diethyl ether–water using Raman mapping capabilities (automated moving stage). All spectra were recorded from 2700 to 3900 cm−1 at the nodes pointed at each μReservoir (nB), and at the proximity of the top capillary entrance (nA) (Fig. 4). A 532 nm laser was used with an acquisition time set to 1 s (with the second acquisition) at 100% of intensity, and the flow-rate of the hydrophilic phase was defined from 0 to 500 μL min−1 at 313.15 K. The fluid passed through the microfluidic device for 60 minutes before acquiring any spectra. The mapping overall took about 20 minutes. The spectra were recorded using a 600 gr mm−1 grating (2700 to 3900 cm−1), which allow us to cover two zones: the OH stretching region, only present in the aqueous phase used, and the CH stretching, only present in the hydrophobic phase. Fig. 4 shows the mapping results for one of the systems studied (toluene–water) at 20 μL min−1. It clearly illustrates that the CH stretching bond was only present inside the μReservoir (nB), and that the OH stretching bond was only present in the long channel (nA).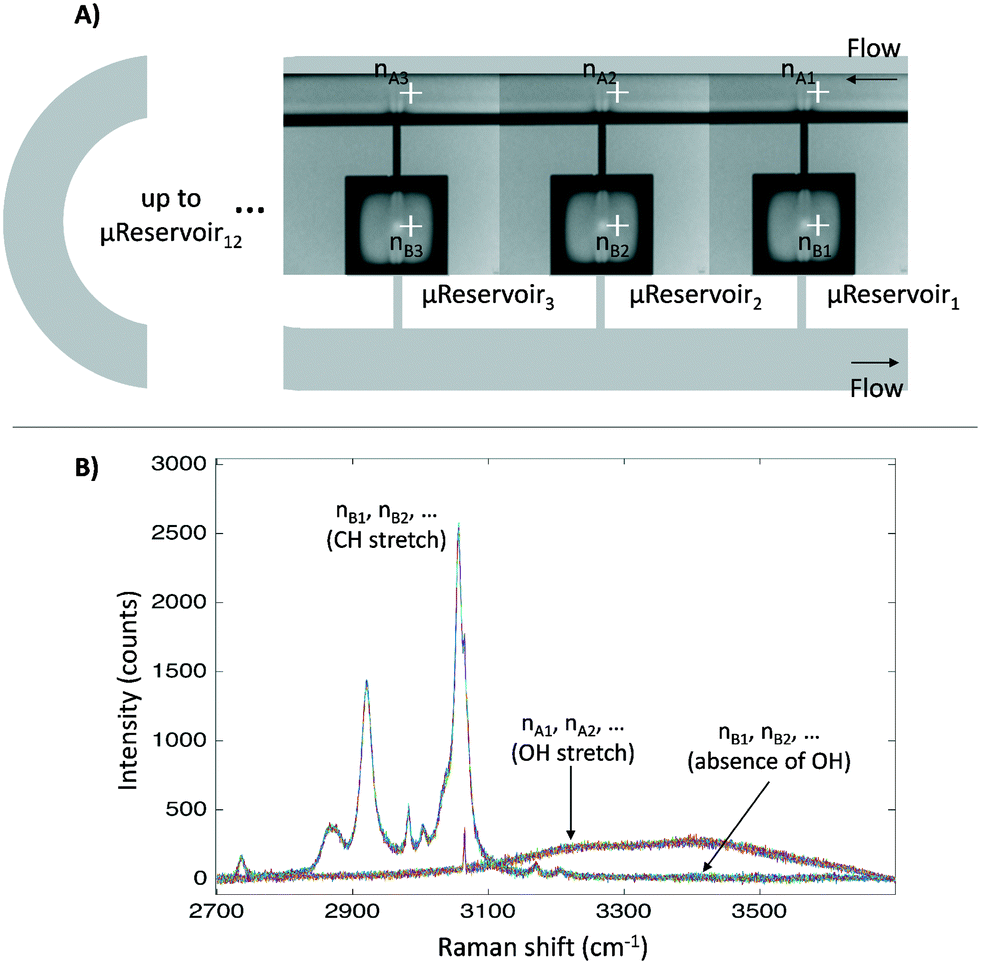 | ||
| Fig. 4 A) Nodes where the Raman spectra were recorded. They are displayed from the first μReservoir (nB1) to the last (nBn), from the left to the right. B) Raman spectra for the overall nodes. | ||
For the toluene–water system, a series of Raman spectra maps were performed in a conservative mode, having an experimental Raman runtime time of 17 hours (before Raman: 1 h; Raman analysis: 17 h), where no invasion of the μReservoirs was observed. By having this information, and applying the model previously detailed (2), the K value (4) can be estimated as higher than 107 for a negligible flow-rate of the hydrophilic through the μReservoir. For instance, for K = 107, the flow-rate was estimated to be 2.2 × 10⁻⁷ μL min−1 at the first μReservoir of the series, which corresponds to a total volume of 0.02 μL. Regarding the other fluids, only an experimental Raman runtime of one hour was tested (total of 2 hours of continuous-flow), and no invasion of the μReservoir was observed. Based on this information, K values were estimated to be at least 4 × 10⁶, which corresponds to a flow-rate of 5.2 × 10⁻⁶ μL min−1 at the first μReservoir of the series.
Bulk-to-bulk Raman mapping methodology
Raman spectroscopy and mapping techniques were applied in order to characterize the bulk-to-bulk regions. Fig. 5 shows the Raman 1D map region acquired (160 μm covered), which begins in the hydrophilic bulk (−80 μm), localized at the long channel before the centre of the top capillary entrance, and ends in the hydrophobic bulk (80 μm), localized inside the μReservoir. In our study, 1D mapping was chosen instead of a 2D mapping, because it was less time-consuming and it provided analogous information from the bulk-to-bulk regions. The map was acquired with a 0.1 μm step, using an infrared laser of 532 nm set to full power with an acquisition time of 0.05 s per spectra. The spatial and depth resolution were 1.3 μm (0.61 × λ/NA, where λ is the laser wavelength and NA the numerical aperture) and ∼12 μm (n × λ/NA2, where n is the refractive index of the medium [1.33 for water at 313.15 K and 1.48 for toluene at 313.15 K]), using 10× magnification (NA 0.25). This resolution was compared against 0.4 μm special resolution and 1.2 μm depth resolution (×100 magnification, NA 0.8), and the results (behaviour and zones identified) were similar to the system studied, but more time consuming (around 40× acquisition time is required to have a signal-to-noise ratio >5). The width depth resolution using a 10× objective (∼12 μm) has a negligible effect on the results obtained, which was proved by a 2D Raman map (position versus depth) (see Fig. 2S†). Interestingly, no different behaviour was observed in the spectra obtained (increasing and decreasing) mapped along the reservoir's entrance wall or center. This means it is unlikely that reflection at the interface dominates our results. Therefore, it was assumed that changes in intensity should be related to concentration variations. We are aware that the spectra intensity can also be influenced by refraction.40 During the experiments, no bubbles were observed to form due to the laser heating the fluids. Two Raman shift ranges were studied (each separately) with a 600 gr mm−1 (from 1070 to 2550 cm−1 (hydrophobic phase peaks) and from 2550 to 3795 cm−1 (aqueous phase peaks)) to avoid readjustments of the grating position, which leads to longer acquisition times. The map acquisition duration per range was 4.5 min, and thus the overall runtime for the entire map (two ranges acquired) was 9 min. Between both acquisitions, our hypothesis was that the interface position and concentration profiles would not vary (later verified). The peak area was integrated with Simpson's rule,41 and it was directly related to specie concentration. We decided to use peak area instead of peak intensity because it helps to reduce the overall baseline noise. To know the species concentration, a linear calibration was applied based on the device design. Here, we assumed that (I) the water concentration is known at the main channel (equal to the concentration injected) with the water concentration inside the μReservoir being negligible, and (II) the toluene concentration is known at the μReservoir (equal to the concentration injected) with the toluene concentration inside the main channel also being negligible. This calibration technique was performed at each single mapping.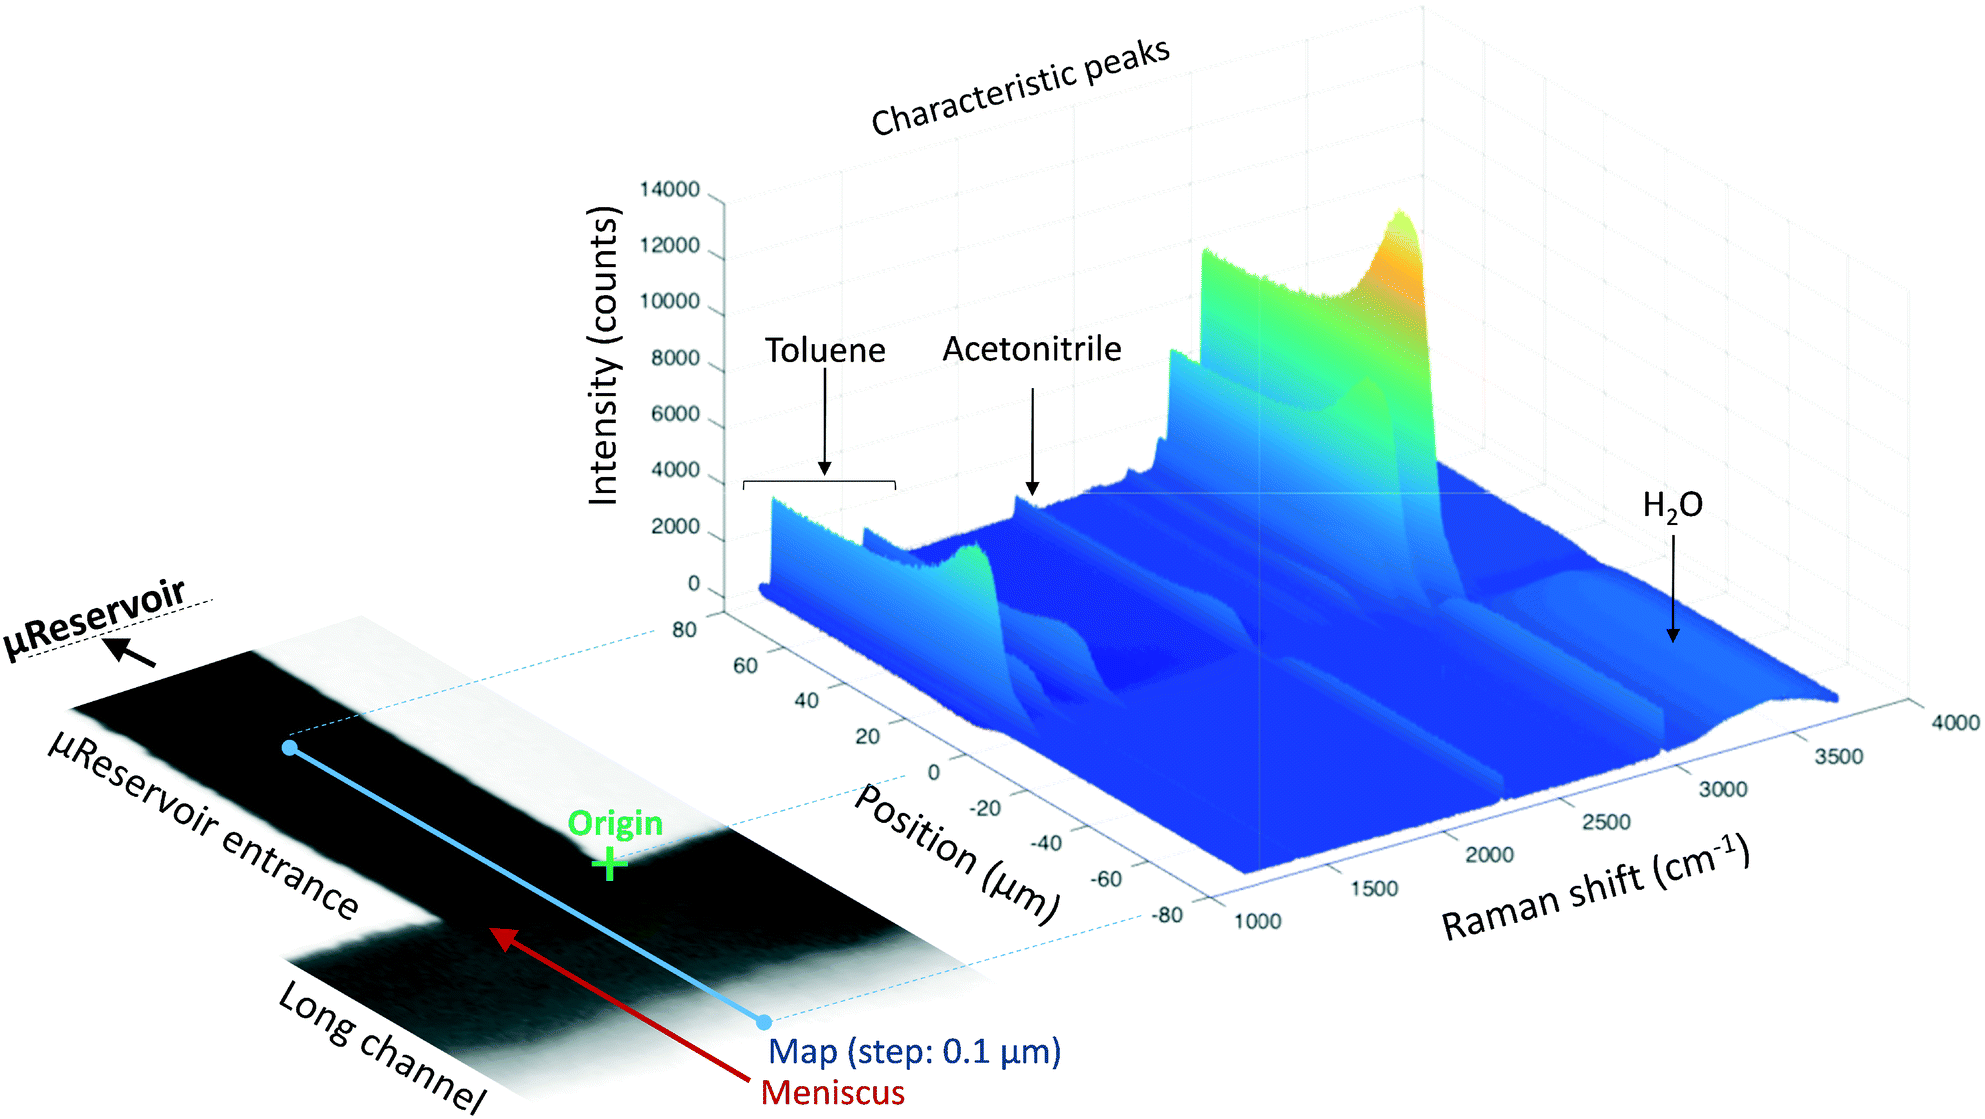 | ||
| Fig. 5 Map of the bulk-to-bulk region for a toluene–water system (313.15 K and water flow-rate of 20 μL min−1). In the graphics is presented the intensity (counts) versus the position (μm) versus the Raman shift (cm−1), and its geometrical correspondence. | ||
Depending on the phase, different refraction patterns can appear (rarefaction: local concentration in the neighbourhood of the interface is lower than its bulk concentration, and shockwave: local concentration in the neighbourhood of the interface is greater than bulk concentration). These patterns appeared near the interface, being shaped by intermolecular attractive or repulsive forces between Newtonian immiscible fluids.21,42,43 To better understand the physics of such a pattern formation and its effects on the interface, we used an approach based on an internal standard. Our aim was to add a species that is physicochemically inert to the mixture (similar affinity to hydrophobic and hydrophilic phase) and one that would have negligible mass transport (similar concentration in each phase). Consequently, any variation on the internal standard's peak could only be related to local changes in the index of refraction, which is correlated to density fluctuations ( , where ρ is the true density (kg m−3) and n the index of refraction).44 Since
  is difficult to obtain for mixtures, an apparent density term was used, being Δρ* = Δn. Also, the concentration variations throughout the manuscript are expressed as apparent. Acetonitrile was chosen as the internal standard because it has good miscibility in both phases, and it has a distinct spectral shift at 2258 cm−1 (CN bond). It was added in the same concentration to each phase (internal standard/solvent: 1/10 mL mL−1). On the “position” axis of Fig. 5, the origin is fixed at the μReservoir entrance, which served, in each experiment, as a reference to the starting point (translated 25 μm on the x-axis and 80 μm on the y-axis). The density profile obtained using acetonitrile was used to close the mass balance. Outside the zone were the species mix, the media molar mass (Mi, g mol−1) of a specie should be constant (Mi−1 = Ci/ρ*, where ρ* is the fluid apparent density (kg m−3) and Ci is the concentration of the specie i (mol m−3)) [for more information see Fig. 1S in ESI†].
Fig. 5 reports the results of a complete run of a 3D form (position versus Raman shift versus intensity) of a water-toluene immiscible system. The information was obtained at 30 μm below the Pyrex wall, which is the zone with highest intensity (evaluated by several trials). When the laser was positioned at the μReservoir entrance, the peaks near 1200 cm−1 (aromatic ring stretching, toluene) were observed to have a plateau with constant intensity value when acquiring data from 20 to 80 μm. This peak signal suddenly increased (up to 20%) and then decreased near the meniscus (roughly located at 0 μm; Fig. 5), and it vanished when it reached the main channel (water bulk). This observation is in line with the expected behaviour, known as Schlieren pattern,45 which is associated with apparent density gradients. Regarding the OH stretching peak (2800 to 3700 cm−1; water), a similar behaviour was observed in the opposite direction, from toluene-bulk to aqueous-bulk. For the OH peak, the sudden intensity increase was not present, but rather it decreased. Deeper analyses of the profiles with different immiscible mixtures offers a better understand of the previous results.
Toluene–water investigations
From the microscopic point-of-view, the liquid–liquid profiles across the interface can be assigned to zones: (I) water bulk, (II) water rarefaction, (III) mixture zone, (IV) toluene shockwave, and (V) toluene bulk. In doing so, we intend to emphasize the property variations associated with the concentration gradients and how they might influence reaction chemistry. Fig. 6 shows the zones according to the Schlieren pattern for a toluene–water system. To define these zones, a cumulative function (f) of the dC/dy was calculated. The water rarefaction (II) zone was defined from the point when the water concentration began to decrease until the toluene started to appear, i.e., from 3% of f(dCwater/dy) to 3% of f(dCtoluene/dy). In this zone, the concentration near the interface was lower (deficit of water) than the one on the bulk,21 owing to repulsive forces near the interface and undergoing structural rearrangement of the OH bond28,46,47 to interact with the non-polar phase. The apparent density of this zone was observed to range from 1000 to 400 kg m−3.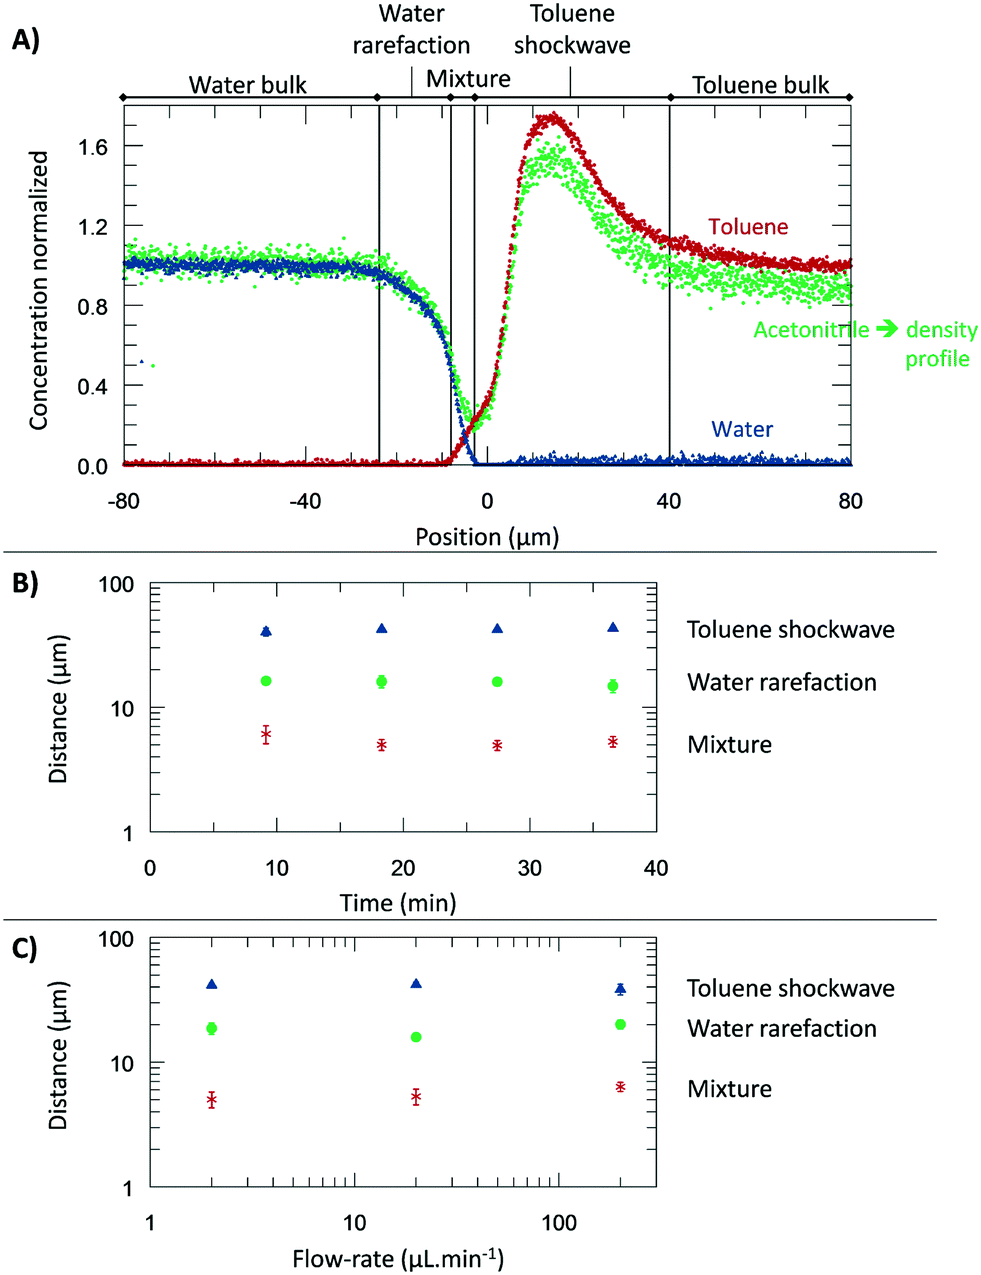 | ||
| Fig. 6 The experiments were performed at 313.15 K, 0.3 bar, and for a system of toluene–water. A) Concentration normalized by each fluid bulk concentration as a function of its position where the origin represents the μReservoir entrance (see Fig. 5). The bulk-to-bulk region was defined by serval zones: water bulk, water rarefaction, mixture, toluene shockwave and toluene bulk. The acetonitrile normalized concentration is directly related with the apparent density function. In the water bulk, density is 1.0 g cm−3, and multiplying it by the acetonitrile apparent density function, the apparent density profile is obtained. Since it was multiplied by 1, the normalized concentration and apparent density profile have the same y axis. B) Thickness of each zone as a function of the acquisition time (end of a spectra acquisition). C) Thickness of each zone as a function of the aqueous flow-rate. | ||
The mixture zone (III) was defined from the point in Fig. 6A where the toluene began to appear to point where the water disappeared, i.e., from 3% f(dCtoluene/dy) to 97% of f(dCwater/dy). In this zone, water molecules interact with toluene, possibility resulting in hydrophobic hydration of toluene molecules. The apparent density of this zone ranged from 400 to 200 kg m−3.
The toluene shockwave (IV) was defined from where the water disappeared to the point where the toluene concentration stabilized, i.e., from 97% f(dCwater/dy) to 97% of f(dCtoluene/dy). In this zone, the concentration near the interface is higher (accumulation of toluene) than in the bulk,21 owing to attractive forces near the interface. The apparent density of this zone was observed to varying from 200 to 1500 kg m−3. It is noteworthy that the results reported were neither influenced by the internal standard (confirmed by experiments without acetonitrile, Fig. 2S†), nor by the contact with the microchannel wall (see Fig. 3S†). Furthermore, the depth had negligible influence on the bulk-to-bulk behaviour.
In the present study, we were also interested in how the thickness of the zones previously discussed (I–IV) are influenced by the time and the flow-rate. Regarding time dependency, a study was carried out with a flow-rate of 20 μL m−1 at 313.15 K for 40 minutes, having each map an overall runtime of 9 minutes. The experiment was repeated three times to ensure reproducibility. According to the results (Fig. 6), the thickness of each zone appears to be constant during the time-range evaluated, being 17.5 ± 2.2 μm (water rarefaction), 6.4 ± 1.0 μm (mixture), and 34.9 ± 9.0 μm (toluene shockwave). Interestingly, the water–toluene mixture zone was estimated to have a thickness of ∼6 μm, which is consistent with the theoretical considerations of others25 for multiphase microfluidics (e.g., 1 to 10 μm). The results reported herein certainly do differ from the typical film thickness, in the range of 0.001 to 0.10 μm,48 found in emulsions that are stabilized by agents. This mixture zone is generally defined as the space where interfacial liquid–liquid reactions take place. As we have discovered, however, the apparent concentration and the density variations extend beyond the mixture zone.
To further understand the effect of the flow-rate on the thickness, several flow-rates of the continuous phase were investigated: 2.00, 20.0, and 200 μL min−1 (±0.3% flow-rate accuracy). According to our results (Fig. 6), at the range studied, the flow-rate did not influence the thickness, which is an exciting result. It is readily known that the flow-rate in immiscible liquid–liquid segmented flows influences the film thickness.25 However, our isolation of one immiscible phase (by a main channel connected to perpendicular capillaries) reduces the viscous forces exerted on the interface. We anticipate that the negligible impact of the flow-rate, by design, will find broad utility in understanding the reaction specie contact time between the phases and the diffusive fluxes across the different zones.
Diethyl ether– and xylenes–water investigations
A part from toluene–water, we were interested in studying the effect of other non-polar, hydrophobic phases on the interface. It is expected that different fluids could have different behaviours due to differences in their repulsive and attractive forces. Therefore, we next shifted the focus of our study on understanding the density and the concentration profiles of two additional systems: diethyl ether– and xylenes–water. The same procedure to the water–toluene analysis was adopted. A water flow-rate of 20 μL min−1 was applied at 313.15 K.Fig. 7A reports the apparent density profiles of the different species studied. The results reported were not influenced by the internal standard acetonitrile (Fig. 2S†). For water–toluene, recall that the water was affected by repulsive forces, which results in a rarefaction. This behaviour was again observed for the new species studied. From −20 to 0 μm, the normalized density of the system diethyl ether–water decreased first, followed by toluene–water, and then xylenes–water. This behaviour can be explained by liquid–liquid interfacial tension and molecular rearrangement. The interfacial tension is a macroscopic property of the intermolecular interactions, and thermal and viscous effects.42 At the interface, there is an excess free energy, due to the contact between different chemical species (on the bulk phases) and unbounded molecular species, and kinetic energy. This excess energy is traduced by mechanic means, namely forces applied per unit length (interfacial tensions) [tension = force per unit length (N m−1) = energy per unit area (J m−2)]. Depending on the sub-part of the fluid, it may exert a repulsive or attractive force, which will affect the density. The interfacial tension of diethyl ether–water (10.7 mN m−1 at 313.15 K) is lower than the one for toluene–water (32.8 mN m−1 at 313.15 K), which is lower than that of the xylenes–water (37.9 mN m−1 at 313.15 K) system. Our observations support that the attractive forces between water and diethyl ether molecules are stronger than toluene–water, which by its turn are stronger than xylenes–water. Another sign that xylenes–water exhibits weaker attractive forces (higher repulsive forces) is at its lowest density, around 100 kg m−3, which was lower than when analysing toluene–water and diethyl ether–water (about 200 kg m−3). Furthermore, as can be seen in Fig. 7A, the xylenes–water system appears to have a greater slope of rarefaction and a smaller amplitude of the shockwave, as compared to the other pairs. These observations might be related to molecular rearrangements.
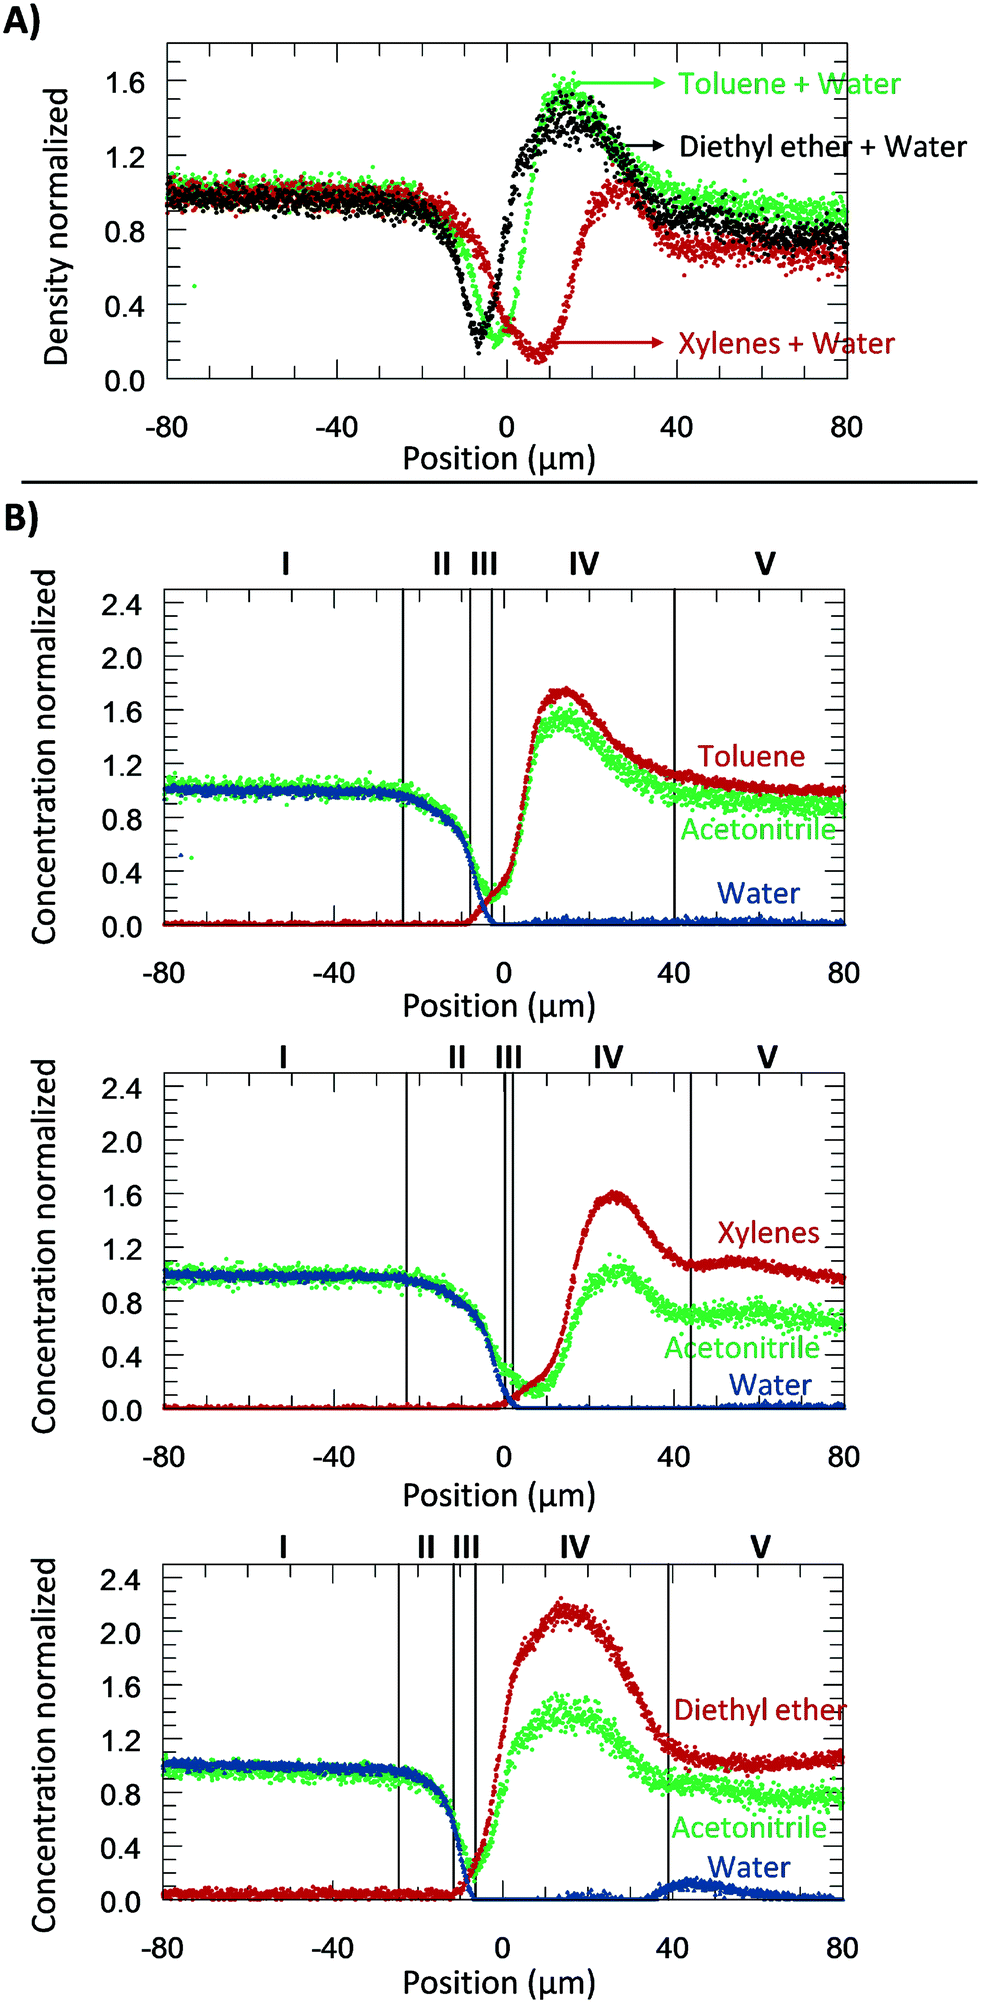 | ||
| Fig. 7 A) Relative apparent density profiles (in relation to the water bulk: 1000 kg m−3) for the species studied at 20 μL min−1 and 313.15 K. This information was acquired by the use of acetonitrile. B) Relative concentration profiles (in relation to each specie bulk concentration) for the species studied at 20 μL min−1 and 313.15 K. Zones: I: aqueous bulk; II: aqueous rarefaction; III: mixture; IV: hydrophobic shockwave; IV: hydrophobic bulk. | ||
Similar to the previous section, the several zones (Fig. 7B) were again identified: (I) water bulk, (II) water rarefaction, (III) mixture, (IV) organic shockwave and (V) organic bulk. Thickness values of the zones II–IV are expressed in Table 2. As can be seen, the mixture zone of the toluene–water system had the greatest thickness of 6.4 μm, followed by xylenes–water (3.4 μm), and diethyl ether–water (2.9 μm). Since this zone was comprised of a mixture, its thickness should be related to solubility (the macroscopic property of thermodynamic molecular interaction). The solubility of toluene in water is greater than xylenes in water (0.52 g L−1 > 0.11 g L−1), and thus the thickness of the toluene–water mixture zone is expected to be greater. In relation to the system diethyl ether–water, the water solubility is approximately 100 times greater than that of toluene in water (69 g L−1 > 0.52 g L−1); therefore, a greater mixture zone thickness should be expected. Our results do not follow this trend, which might be related to the molecular dynamics of this mixture and its interaction with water (e.g., hydrogen bonding). It is possible that the diethyl ether–water mixture zone might require more experimental time to develop a stationary profile.
| Liquid–liquid system | Zone II (μm) | Zone III (μm) | Zone IV (μm) |
|---|---|---|---|
| Toluene–water | 17.5 ± 2.2 | 6.4 ± 1.0 | 34.9 ± 9.0 |
| Diethyl ether–water | 24.1 ± 6.6 | 5.8 ± 0.6 | 49.5 ± 4.0 |
| Xylenes–water | 23.2 ± 4.3 | 3.4 ± 1.0 | 38.8 ± 9.8 |
The results of Table 2 and Fig. 7 identify and summarize crucial information for understanding multiphase reaction chemistry and engineering. Conventional thin film theory for fluid–fluid reactions24 is commonly applied to estimate the diffusive flux and its influence on apparent kinetics. This theory, however, neglects different interfacial zones reported in the present work (e.g., the rarefaction (II) and shockwave zones (IV)). These zones could have thicknesses of one order of magnitude greater than the mixture zone I (i.e., the zone traditionally used to estimate the flux). The mass transport coefficient is also a function of each zone thickness. Inclusion of zones II and IV could thus add additional resistance terms in classical mixed-mass-transport-reaction-rate-limited and mass-transport-limited rates when the rate of flux across the interface is of similar magnitude as the intrinsic kinetics.24 The mass transport coefficients could be reduced by an order of magnitude. Furthermore, neglecting zones II and IV would predict an order of magnitude lower Hatta modulus than reality.24 Similarly, the rarefaction and shockwave zones would mask the actual mass transport coefficients in liquid–liquid extraction, which is routinely used for intermediary separations during the total synthesis of useful compounds. Opportunities now exist to design more efficient separations and the advancement of kinetic models.
Conclusions
In this work, semi-flow microfluidics with in situ Raman spectroscopy were designed to investigate bulk-to-bulk interactions for liquid–liquid immiscible systems. Solving the force balance enabled a continuous hydrophilic phase in contact with a static hydrophobic, non-polar phase trapped inside a series of μReservoirs. The opportunity for the constant refreshing of species at the interface was made possible, which is obligatory in the pursuit of understanding interfacial liquid–liquid reactions. The design was validated using in situ high-resolution Raman spectroscopy for three different immiscible liquid–liquid mixtures: toluene–, diethyl ether–, and xylenes–water. To characterize the bulk-to-bulk regions, fast mapping techniques were applied, making it possible to reveal insights on chemical species around the interface.Apparent concentration and density profiles were accurately measured using semi-flow microfluidics with in situ Raman spectroscopy. Based on our observations, the location and the thickness of zones near the interface were identified: aqueous-bulk, aqueous shockwave, mixture, hydrophobic rarefaction, and hydrophobic-bulk. It was found that interfacial thicknesses are independent of the flow rate. Thicknesses of the mixture zones of three different liquid–liquid systems were consistent with the state-of-the-art of multiphase microfluidics. Their value is related with repulsive and attractive forces, which can be interpreted using indirect physicochemical concepts, such as surficial tension and solubility. Our identification and characterization of additional zones and a new technique to study them creates the opportunity for even broader understanding. For instance, by analysing concentration profiles in different zones when performing a reaction.
The semi-flow microfluidics and methodology reported here could be applied to other immiscible systems. It represents a ubiquitous tool to better understand aqueous–organic reactions, e.g., understand the role of water as an unconventional solvent in multiphase organometallic catalysis. Experimental validation of molecular interactions predicted by computational methods is also possible. Moreover, the ability to understand concentration and density profiles within each zone from the bulk-to-bulk regions could improve liquid–liquid extractions or mixed mass-transport-reaction-rate-limited and mass-transport-limited kinetic models for scale-ups in continuous-flow, which generally do not take into account the profiles near the interface.
Acknowledgements
This material is based upon work supported by the National Science Foundation under Grant Number CBET-1550483. Any opinions, findings, and conclusions or recommendations expressed in this material are those of the authors and do not necessarily reflect the views of the National Science Foundation. The authors also gratefully acknowledge Dr. Chuntian Hu for his help early in the project by drawing masks of the semi-flow microsystems with AutoCAD.Notes and references
- G. M. Whitesides, Nature, 2006, 442, 368–373 CrossRef CAS PubMed.
- A. Adamo, R. L. Beingessner, M. Behnam, J. Chen, T. F. Jamison, K. F. Jensen, J.-C. M. Monbaliu, A. S. Myerson, E. M. Revalor, D. R. Snead, T. Stelzer, N. Weeranoppanant, S. Y. Wong and P. Zhang, Science, 2016, 352, 61–67 CrossRef CAS PubMed.
- R. L. Hartman, J. P. McMullen and K. F. Jensen, Angew. Chem., Int. Ed., 2011, 50, 7502–7519 CrossRef CAS PubMed.
- B. Pinho, S. Girardon, F. Bazer-Bachi, G. Bergeot, S. Marre and C. Aymonier, Lab Chip, 2014, 14, 3843–3849 RSC.
- K. S. Elvira, X. C. I. Solvas, R. C. R. Wootton and A. J. deMello, Nat. Chem., 2013, 5, 905–915 CrossRef CAS PubMed.
- G. N. Doku, W. Verboom, D. N. Reinhoudt and A. Van Den Berg, Tetrahedron, 2005, 61, 2733–2742 CrossRef CAS.
- B. P. Mason, K. E. Price, J. L. Steinbacher, A. R. Bogdan and D. T. McQuade, Chem. Rev., 2007, 107, 2300–2318 CrossRef CAS PubMed.
- K. Belecki and B. F. Gupton, in Green Chemistry Strategies for Drug Discovery, The Royal Society of Chemistry, 2015, pp. 127–150 Search PubMed.
- J. Yue, J. C. Schouten and T. Alexander Nijhuis, Ind. Eng. Chem. Res., 2012, 51, 14583–14609 CrossRef CAS.
- T. Noal, S. Kuhn, A. J. Musacchio, K. F. Jensen and S. L. Buchwald, Angew. Chem., Int. Ed., 2011, 50, 5943–5946 CrossRef PubMed.
- S. Marre, A. Adamo, S. Basak, C. Aymonier and K. F. Jensen, Ind. Eng. Chem. Res., 2010, 49, 11310–11320 CrossRef CAS.
- M. Lee, J. P. Lee, H. Rhee, J. Choo, Y. G. Chai and E. K. Lee, J. Raman Spectrosc., 2003, 34, 737–742 CrossRef CAS.
- N. Zaborenko, M. W. Bedore, T. F. Jamison and K. F. Jensen, Org. Process Res. Dev., 2011, 15, 131–139 CrossRef CAS.
- B. J. Reizman and K. F. Jensen, Acc. Chem. Res., 2016, 49, 1786–1796 CrossRef CAS PubMed.
- K. Piradashvili, E. M. Alexandrino, F. R. Wurm and K. Landfester, Chem. Rev., 2016, 116, 2141–2169 CrossRef CAS PubMed.
- C. Hu, K. H. Shaughnessy and R. L. Hartman, React. Chem. Eng., 2016, 1, 65–72 CAS.
- R. B. DeVasher, L. R. Moore and K. H. Shaughnessy, J. Org. Chem., 2004, 69, 7919–7927 CrossRef CAS PubMed.
- A. L. Casalnuovo and J. C. Calabrese, J. Am. Chem. Soc., 1990, 112, 4324–4330 CrossRef CAS.
- D. T. Cohen and S. L. Buchwald, Org. Lett., 2015, 17, 202–205 CrossRef CAS PubMed.
- A. Chanda and V. V. Fokin, Chem. Rev., 2009, 109, 725–748 CrossRef CAS PubMed.
- H. Brenner and L. G. Leal, AIChE J., 1978, 24, 246–254 CrossRef CAS.
- I. Benjamin, Annu. Rev. Phys. Chem., 1997, 48, 407–451 CrossRef CAS PubMed.
- A. Günther and K. F. Jensen, Lab Chip, 2006, 6, 1487–1503 RSC.
- O. Levenspiel, Chemical reaction engineering, John Wiley & Sons, 3rd edn, 1999, p. 668 Search PubMed.
- M. N. Kashid, A. Renken and L. Kiwi-Minsker, Chem. Eng. Sci., 2011, 66, 3876–3897 CrossRef CAS.
- R. P. Sperline and H. Freiser, Langmuir, 1990, 6, 344–347 CrossRef CAS.
- K. Mühlfriedel and K. Baumann, Exp. Fluids, 2000, 28, 2–4 Search PubMed.
- M. De Serio, H. Mohapatra, R. Zenobi and V. Deckert, Chem. Phys. Lett., 2006, 417, 452–456 CrossRef CAS.
- L. Poltorak, M. Dossot, G. Herzog and A. Walcarius, Phys. Chem. Chem. Phys., 2014, 16, 26955–26962 RSC.
- A. Jonáš, A. C. De Luca, G. Pesce, G. Rusciano, A. Sasso, S. Caserta, S. Guido and G. Marrucci, Langmuir, 2010, 26, 14223–14230 CrossRef PubMed.
- C. Hu, X. Chen, J. Chen, W. Zhang and M. Q. Zhang, Soft Matter, 2012, 8, 4780 RSC.
- R. L. Hartman, H. R. Sahoo, B. C. Yen and K. F. Jensen, Lab Chip, 2009, 9, 1843 RSC.
- H. Lim, A. Tripathi and J. Lee, Langmuir, 2014, 30, 9390–9396 CrossRef CAS PubMed.
- J. K. Nunes, S. S. H. Tsai, J. Wan and H. A. Stone, J. Phys. D: Appl. Phys., 2013, 46, 114002 CrossRef PubMed.
- S. L. Anna, Annu. Rev. Fluid Mech., 2016, 48, 285–309 CrossRef.
- K. W. Oh, K. Lee, B. Ahn and E. P. Furlani, Lab Chip, 2012, 12, 515–545 RSC.
- M. Alpbaz, A. Bilgesü and O. Tutkun, Commun. Fac. Sci. Univ. Ankara, Ser. B: Chem. Chem. Eng., 1988, 34, 103–112 CAS.
- G. M. Kontogeorgis and S. Kiil, in Introduction to Applied Colloid and Surface Chemistry, John Wiley & Sons, Ltd, 2016, pp. 34–73 Search PubMed.
- N. J. Alvarez, S. L. Anna, T. Saigal, R. D. Tilton and L. M. Walker, Langmuir, 2012, 28, 8052–8063 CrossRef CAS PubMed.
- J. P. Tomba, Soft Matter, 2016, 12, 4510–4513 RSC.
- H. Scott Fogler, Elements of Chemical Reaction Engineering, Upper Saddle River, NJ, 3rd edn, 1999, p. 1080 Search PubMed.
- A. Marchand, J. H. Weijs, J. H. Snoeijer and B. Andreotti, Am. J. Phys., 2011, 79, 999 CrossRef CAS.
- R. R. Nourgaliev, S. Y. Sushchikh, T. N. Dinh and T. G. Theofanous, Int. J. Multiphase Flow, 2005, 31, 969–995 CrossRef CAS.
- C. Wylock, S. Dehaeck, T. Cartage, P. Colinet and B. Haut, Chem. Eng. Sci., 2011, 66, 3400–3412 CrossRef CAS.
- S. Chandrasekhar and H. E. Hoelscher, AIChE J., 1975, 21, 103–109 CrossRef CAS.
- P. Jedlovszky, J. Phys.: Condens. Matter, 2004, 16, S5389–S5402 CrossRef CAS.
- L. F. Scatena, M. G. Brown and G. L. Richmond, Science, 2001, 292, 908–912 CrossRef CAS PubMed.
- H. Yang, S. R. Schmid, T. J. Kasun and R. A. Reich, Tribol. Trans., 2004, 47, 123–129 CrossRef CAS.
Footnote |
| † Electronic supplementary information (ESI) available. See DOI: 10.1039/c6re00177g |
| This journal is © The Royal Society of Chemistry 2017 |