DOI:
10.1039/C7RA02455J
(Review Article)
RSC Adv., 2017,
7, 36632-36643
First-principles study of nitrogen-doped nanographene as an efficient charge transport and nonlinear optical material†
Received
27th February 2017
, Accepted 18th July 2017
First published on 25th July 2017
Abstract
The prospective of nitrogen doped graphene (NDG) as useful nonlinear optical (NLO) and charge transport materials is explored using first principles methods. A dual methodological strategy is adopted by performing molecular level and bulk level calculations through first principles methods. The calculated molecular geometry and absorption wavelengths are found to be in reasonable agreement with experimental results of parent NDG compound 1 (di-peri-(tert-butylbenzo)-di-peri-(tri-methoxybenzo)-di-peri-(pyrimidino)-coronene). Similarly, first principles calculations of the solid-state crystal structure show that NDG compound 1 retains a value of 1.585 eV as its direct band gap, which is potentially useful for a direct bad gap semiconductor for optical device applications. The calculation of second- (β) and third-order (γ) nonlinear optical properties indicates that compound 1 possesses reasonably large values of βtot (22.96 × 10⁻³⁰ esu) and 〈γ〉 (238.53 × 10−36 esu) amplitudes, which may fall well within the figure of merit for second harmonic generation (SHG) and two-photon absorption (TPA) applications, etc. TD-DFT calculations along with the plots of the frontier molecular orbitals show an intramolecular charge transfer from the rest of the graphene fragment to the pyridine moieties (N-doped sites) accompanied by significant oscillator strengths for involved transitions in the absorption spectra. Additionally, several key optical parameters (dielectric and conductivity functions, refractive index and extinction coefficients) are calculated to assess the overall optical efficiency of parent NDG compound 1. The present investigation not only features the substantial potential of NDG compound 1 as an efficient optical material but also highlights the importance of the substitution of its terminal groups to enhance the first- and second hyperpolarizability amplitudes, as exemplified through the design of compound 3.
1. Introduction
Recently, optical and nonlinear optical (NLO) materials have gained an immense importance owing to their diverse potential applications in a modern hi-tech scientific society.1–3 Efficient optical materials are used in electronic devices, semiconductors, field effect transistors, organic light emitting diodes (OLEDs), in solar cells, etc.4,5 On the other hand, nonlinear optical (NLO) materials show many applications in laser frequency modulation, laser protective devices, holographic imaging and digital data storage and telecommunications.6 To meet the need of novel emerging technologies, over the last few years, many kinds of materials are explored for their useful electro-optical properties.7–10 The organic class of materials played a crucial role due to their great diversity in structure, cost effectiveness as well as ease of fabrication etc. For instance, several organic classes have perhaps shown a very good potential to use them as efficient light emitting diodes, semiconducting materials and as NLO materials.11–13
Since the rise of graphene as a thin honeycomb with hexagonal lattice made up of all carbon atoms in 2007,14 this has not only dominated over the organic class of materials for their efficient electro-optical and NLO properties but also competed inorganic class of materials for their significant mechanical strength and thermal stability.15,16 Graphenes put a significant scientific interest among the scientists to explore their potential for effective optical and NLO applications.17–19 Owing to their excellent electro-optical properties, the data about the functional properties of graphenes swelled up quickly and reached to its critical point.16,20 Interestingly, then another momentum is seen in the field of graphene science triggered by the doping of graphenes with different heteroatoms.21,22 The two most frequently used heteroatoms for doping graphenes are nitrogen and boron, which are the neighbor of carbon in periodic table of elements. Graphenes are commonly doped with N and B atoms using different top-down or bottom-up approaches.21 The N and B atoms doped graphenes are found to be very efficient even in several cases better than that of their parent pure graphene fragments.23,24 The nitrogen atom having lone pair of electrons often showed its unique ability to effective modulate the π-conjugation in graphenes and/or other carbon nanomaterials.25 Several experimental and theoretical investigations have been performed to tune the electro-optical properties of graphenes by doping with nitrogen atoms. For example, some investigations about N-doped graphenes include the study of structure and electronic properties of N-doped graphenes,26 and others focused on their charge transfer properties.25,27 Some studies highlighted the contemporary progress in N-doped graphenes especially different methods for their syntheses, characterization and applications in fuel cells,28 semiconductors, field effect transistors, sensors and photocatalysis etc.29,30 Recently, Wijesinghe et al.,31 have performed experiments to functionalization of nitrogen-doped (2N- and 4N-doped) graphenes containing terminal methoxy groups. The individuality of these N-doped graphenes (NDG) became more considerable by the presence of terminal electron donating methoxy groups, which are found to be interacting effectively with the rest of N-doped graphene fragment. Over the past some years, several investigations have been performed on routine push–pull chromophores to explore their potential for optical and nonlinear optical properties.32,33 Unlike the previous investigations, in present study, we chose the N-doped graphene that has already well-characterized structure.
2. Computational methodology
For present computational methodology, we use two approaches consisting of density functional theory (DFT) for single molecule level and the first principle methods are used at bulk level with periodic boundary conditions (PBC). The goal of using dual approach is to get scientific insights into structure–property relationship at molecular level as well as at bulk-level because several optical properties like band gap, density of states, dielectric spectra, conductivity functions, refractive index, extinction coefficient and reflectivity etc. are important to study at bulk-level. All the molecular level calculations are preformed with Gaussian 09 suit of programs.34 Among the DFT methods, the PBE0 is used for ground state structure of single molecule.35,36 The 6-311G* basis set is used in all the calculations. The PBE0 is a hybrid DFT method containing the 25% of Hartree–Fock exchange energy.37 In many previous studies, it has been seen that PBE0 functional is than other global hybrids.38–41 We have calculated and compared the hyperpolarizability of parent system 1 with different DFT methods in Table S1 of ESI.† The Table S1† shows four different DFT methods including PBE0, B3LYP, M06 and CAM-B3LYP. The hybrid PBE0 functional has 25% Hartree–Fock (HF) exchange energy as compared to B3LYP (20% HF) and it does not contain empirical fitting parameterizations etc. The M06 functional is among the group of Minnesota functionals that are recently developed at the University of Minnesota by Truhlar et al.42,43 While on the other hand, CAM-B3LYP represents a mixing of long-range correction presented by Yanai et al.,44 and the hybrid qualities of B3LYP. The results of Table S1† show percentage difference among different methods to calculate the first hyperpolarizability. The PBE0 and B3LYP have shown results in similar range with 1.56% difference of (βtot) amplitudes. On the other hand, the difference of (βtot) amplitudes between PBE0 and other two methods i.e. M06 and CAM-B3LYP are 12% and 25.5% as compared to the βtot amplitude with PBE0. The percentage difference of 25.5% might be due to long-range correction parameters as implemented in CAM-B3LYP. Nevertheless, there are no catastrophic deviations among βtot amplitudes as calculated with PBE0 and other methods. The time dependent (TD) TD-PBE0 method is used along with 6-311G* basis set to compute the maximum absorption energy of NDG compound 1. The parameters for charge transfer process i.e., hole and electron reorganization energies are calculated to assess the electron transfer rates. The modifications in the molecular geometry if an electron is removed or added to a molecule give the inner reorganization energy (λ). The inner reorganization energy (λ) should be small for substantial charge transfer. The inner λ components: λ(1)rel and λ(2)rel, where λ(1)rel relates to the energy of the molecule when it relaxes its geometry from neutral to charged state, while λ(2)rel corresponds to the energy of the molecule when it relaxes its geometry from charged state to neutral state.35| | |
λ = λ(1)rel + λ(2)rel
| (1) |
The adiabatic potential energy surfaces are used to calculate λ through the following equation:45
| | |
λ = λ(1)rel + λ(2)rel = [E1(M+) − E0(M+)] + [E1(M) − E0(M)]
| (2) |
here in the above expression illustrates
E0(M) and
E0(M
+) for neutral and charged ground states energies;
E1(M) is the neutral molecule energy at the optimized charged geometry;
E1(M
+) is the charge state energy at the optimized neutral geometry.
46 The adiabatic and vertical electron affinities a/vEA and ionization potentials (a/vIP) can be evaluated as:
| | |
EAa = E0(M) − E0(M−) and EAv = E0(M) − E1(M−)
| (3) |
| | |
IPa = E0(M+) − E0(M) and IPv = E1(M+) − E0(M)
| (4) |
where
E0(M),
E0(M
+) and
E0(M
−) are the energies of neutral, cation and anion geometries at ground state, whereas
E1(M
+) and
E1(M
−) denote the charged state energy (cation and anion) at the geometries of optimized neutral molecule, respectively. The second- and third-order NLO response properties are calculated using finite field (FF) method, which is originally, Kurtz
et al.,
47 and after that many theoretician and experimentalists apply the methodology to calculate the NLO properties for many different types of advanced materials.
48,49 Many other computational methodologies (time-dependent-sum over states (TD-SOS) and response theory methods)
50 as well as experiments have provided consistent results with FF approach.
51,52 Usually, an electric field (
F) is used and under the static field, the energy (
E) of the molecule is expressed as.
| |
 | (5) |
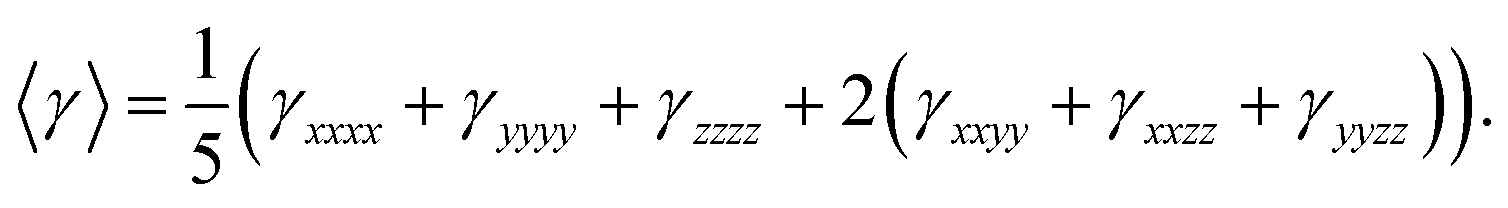
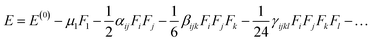
In above equation, the total energy for molecule is shown E(0), while μ, α, β, and γ are electric dipole moment, linear polarizability, second and third-order NLO polarizability, respectively. The components i, j and k represents x, y, and z coordinate axis, respectively. The above equation shows how differentiating E with respect to F gives second and third-order NLO polarizabilities.
The value of βtot is calculated by the following equations:
| |
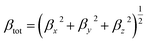 | (6) |
where
| | |
βx = βxxx + βxyy + βxzz
| (7) |
| | |
βy = βyyy + βxxy + βyzz
| (8) |
| | |
βz = βzzz + βxxz + βyyz
| (9) |
The third-order polarizability is calculated by following expression:
| |
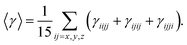 | (10) |
At least for static third-order polarizability, its all components are reduced to six components under Kleinmann symmetry assumption.
| |
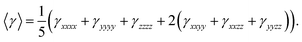 | (11) |
Gaussian 09 is used to calculate the β and γ amplitudes along with their individual components. It is important to mention that only NDG compound 1 has the reported crystal structure so NDG compound 1 is only investigated under periodic boundary conditions for its optical properties. A hybrid DFT functional called PBE (in generalized gradient approximation) is used in solid-state calculations. The norm-conserving pseudopotentials scheme along with plane-wave basis sets is used for optimization of crystal structure of NDG compound 1 by periodic boundary conditions. The Monkhorst–Pack scheme is applied to approximate the Brillouin Zone (BZ) through the reciprocal-space integration process.53 For plane-wave expansion, optimized cutoff energy is kept around 340 eV. Several optical properties including conductivity, reflectivity, dielectric function, extinction coefficient, refractive index, and the density of states are computed at bulk-level. All the solid-state or bulk-level computations are done using Car–Parrinello molecular dynamics (CPMD)54 and Cambridge Serial Total Energy Package (CASTEP) in Material studio.55
3. Results and discussion
3.1. Single molecular geometry
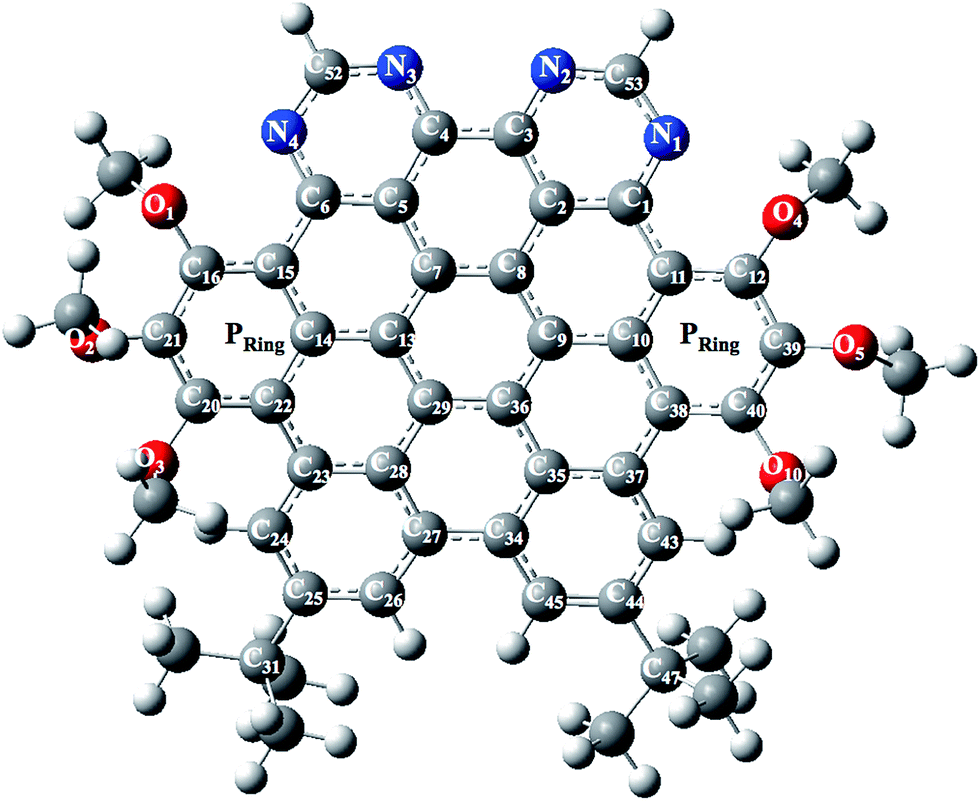
The optimized and labeled geometrical parameters for single molecule structure of NDG compound 1 (di-peri-(tert-butylbenzo)-di-peri-(tri-methoxybenzo)-di-peri-(pyrimidino)-coronene) is shown in Fig. 1 using PBE0/6-311G* level of theory. A comparative analysis between experimental and computationally calculated structures is provided in Table 1 according to Fig. 1. Among the most important bonding parameters between carbon and nitrogen atoms, it can be seen that a maximum difference of 0.012 Å for N1–C53 bond length is found between experimental and computed values. Similarly, the bond angles also show a reasonably good agreement where maximum difference among N atom containing bond angles is found to be 0.92° for C1–N1–C53 bond angle.
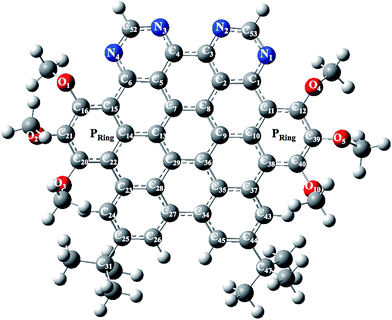 |
| | Fig. 1 Optimized and labeled structure of NDG compound 1 at PBE0/6-31G** level of theory where Pring indicates peripheral rings containing methoxy groups. | |
Table 1 Some computed (Comp.) and experimental (Exp.) molecular bond lengths (Å), bond angles (degree, °) and their average difference (ΔAvg. = Cal. − Exp.) of NDG compound 1. For labeling scheme, see Fig. 1
| Parameters |
Bond lengths |
Parameters |
Bond angles |
| Exp.a |
Comp.b |
Comp.c |
Exp.a |
Comp.b |
Comp.c |
| Exp. value are from ref. 31. Computed parameters of molecular structure of NDG compound 1 with PBE0 method and 6-311G* basis set. Computed parameters within PBC. |
| C1–N1 |
1.344 |
1.335 |
1.353 |
C1–N1–C53 |
116.22 |
117.14 |
117.42 |
| N1–C53 |
1.340 |
1.328 |
1.338 |
C3–N2–C53 |
114.36 |
115.53 |
115.29 |
| N2–C53 |
1.321 |
1.324 |
1.334 |
C52–N4–C6 |
116.86 |
117.12 |
117.48 |
| N2–C3 |
1.336 |
1.333 |
1.349 |
C16–O1–C17 |
114.73 |
114.52 |
116.94 |
| C3–C4 |
1.467 |
1.458 |
1.449 |
C21–O2–C18 |
115.57 |
116.52 |
116.65 |
| N3–C4 |
1.337 |
1.333 |
1.35 |
C20–O3–C19 |
113.59 |
114.38 |
115.08 |
| N3–C52 |
1.325 |
1.324 |
1.332 |
C12–O4–C50 |
113.68 |
116.51 |
116.11 |
| N4–C52 |
1.324 |
1.328 |
1.34 |
C39–O5–C51 |
115.41 |
116.37 |
117.13 |
| N4–C6 |
1.335 |
1.335 |
1.353 |
C40–O10–C100 |
115.80 |
113.01 |
116.86 |
| O1–C16 |
1.365 |
1.355 |
1.367 |
ΔθAvg. |
— |
−0.54 |
−1.41 |
| O2–C21 |
1.382 |
1.358 |
1.372 |
|
Torsion angles |
| O3–C20 |
1.383 |
1.362 |
1.38 |
N1–C1–C11–C12 |
−5.12 |
−13.59 |
−5.87 |
| O4–C12 |
1.363 |
1.349 |
1.366 |
N2–C3–C4–N3 |
3.79 |
−0.05 |
−5.60 |
| O5–C39 |
1.382 |
1.36 |
1.375 |
N4–C6–C15–C16 |
−9.62 |
−13.59 |
−9.10 |
| O10–C40 |
1.369 |
1.368 |
1.375 |
C26–C27–C34–C45 |
1.77 |
−1.43 |
−2.80 |
| ΔrAvg. |
— |
−0.008 |
0.004 |
ΔϕAvg. |
— |
4.15 |
0.75 |
The differences bonding parameters are provided in the form of average differences at the end of each column in Table 1. The average differences among the bond lengths (ΔrAvg.) are −0.008 Å and 0.004 Å between experimental and computationally calculated single molecular and PBC values, respectively. Additionally, the average bond angle differences are −0.54° and −1.41° between experimental bond angles (ΔθAvg.) and calculated in single molecular geometry as well as with PBC, respectively. A difference in the torsion angle of N1–C1–C11–C12 was observed almost that is possibly because of the solid-state effects. Overall, it is reasonable to say that optimized geometry parameters for NDG compound 1 are in agreement with its respective crystallographic data obtained in experiment.31
3.1.1. Molecular geometry within PBC. The ground state optimized geometries of the NDG compound 1 at PBE level within periodic boundary conditions (PBC) accompanying experimental evidences are also given in Table 1 (for numbering scheme, see Fig. 1). A methodical comparison has been accomplished among the optimized and experimental data by analysis of bond lengths, bond and torsion angles. It can be found from Table 1 that the optimized structural parameters at PBE level are in fine agreement with the experimental data. In figure, we have illustrated the optimized NDG compound 1 within PBC and experimental crystal structure. It can be seen for optimized crystal, its displacement and packing of molecules within the unit cell within PBC is in well correspondence to the experimental crystallographic parameters. There was no twisting or deformation among the molecules perceived in the optimized PBC geometry as compared to the crystal structure (Fig. 2). The reliability of the method and the reproduction of the experimental structural parameters revealed that PBE level is well grounded for further investigations. The NDG compound 1 showed some distortion of the planar core due to steric congestion, i.e., ring P is slightly bent by 10.92° with respect to the central phenyl rings which is also in excellent agreement with the experimental crystal data31 (see Fig. S1 and S2 of ESI†).
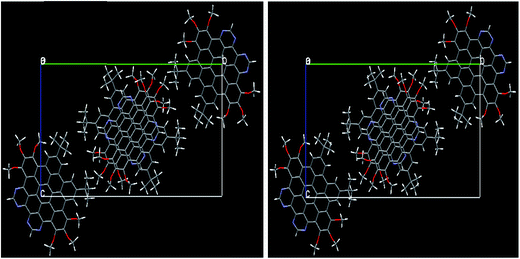 |
| | Fig. 2 The experimental crystal structure (right) of NDG compound 1 along the same [c. o. b.] axis as well as optimized within PBC (left). | |
3.2. Electro-optical properties
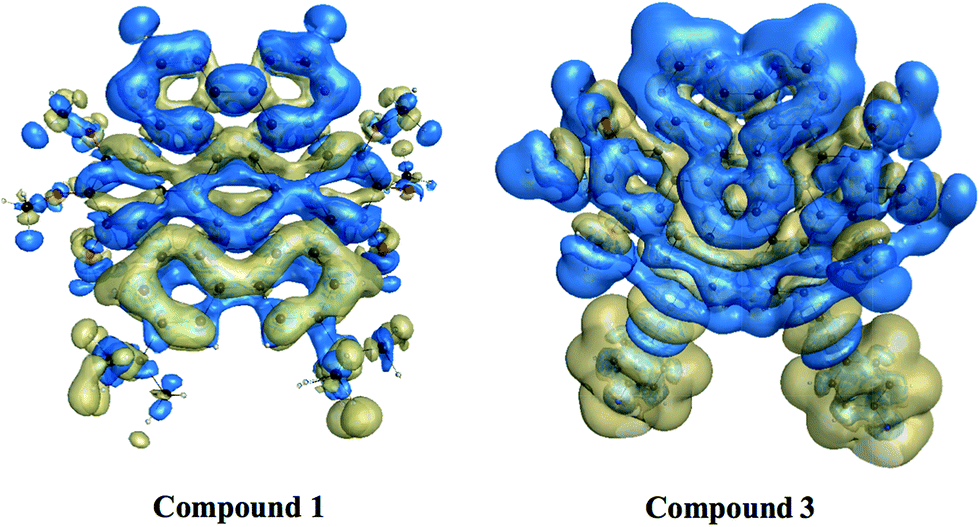
The frontier molecular orbitals energies involved in major transitions participating in the absorption spectra and their charge density distribution patterns have been illustrated in Fig. 3 and Table 2. The HOMO of the NDG compound 1 is delocalized on the lower part of the compound 1 towards the butyl substituents while LUMO is localized on the pyrimidine segments and LUMO+2 is distributed on the entire system. An intramolecular charge transfer process is seen from HOMO → LUMO and HOMO → LUMO+2. Here, it is observed that the pyrimidine units are acting as acceptor moiety and terminal butyl substituents as electron-donating groups in donor–π-conjugated-acceptor (D–π–A) configuration of NDG compound 1. The HOMO and LUMO energies in ground state as well as orbital energy gap (Eg) of N-doped graphene compound 1 have been given in Table 2 at PBE0 functional using 6-311G* basis set. Our previous studies showed that higher electron injection energy (EIE) would lead to superior electron injection ability.56 To comprehend the charge injection and charge transfer nature of the NDG compound 1 EIE was evaluated as regard the work function of aluminum, i.e., −4.08 eV as (=−ELUMO − (−work function of metal)).57 The lower EIE and HIE values illustrates that NDG compound 1 would be good electron and hole transport candidate.
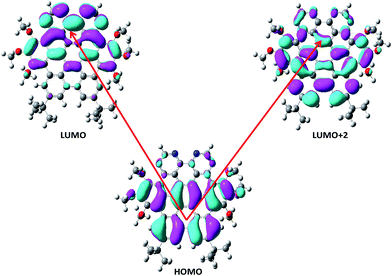 |
| | Fig. 3 Distribution patterns for HOMO and LUMOs of NDG compound 1 in optimized ground state. | |
Table 2 Orbital energies (in eV), experimental and calculated maximum absorption (λa, nm), oscillator strengths (f0), major transitions, % configuration interaction (% C.I.) at TD-PBE0/6-311G* level of theory for NDG compound 1a
| Solvent |
EHOMO |
ELUMO |
ΔEg |
Experimental, λa |
Calculated, λa |
f |
Transition |
% C.I. |
| Ref. 31 is used for Exp. data. |
| Chloroform |
−5.94 |
−2.63 |
3.31 |
470–500 |
457 |
0.134 |
H → L |
68.0 |
| |
|
|
359 |
353 |
0.480 |
H → L+2 |
43.0 |
| Toluene |
−5.89 |
−2.53 |
3.35 |
470–500 |
452 |
0.126 |
H → L |
63.0 |
| |
|
|
355 |
354 |
0.522 |
H → L+2 |
47.0 |
In Table 2 shows the computed absorption wavelengths (λa), oscillator strengths (f) and major transitions as calculated using TD-PBE0 method. The experimental λa for NDG compound 1 are 355 and 359 nm as measured in toluene and chloroform, respectively.31 In the present case, the λa of NDG compound 1 was calculated 352, 353 and 354 nm in methanol, chloroform and toluene at TD-PBE0 with 6-311G* basis set, respectively which are in accordance to the experimental data.31 The major FMOs participating in the λa of compound 1 are HOMO (H), HOMO−1 (H−1) and LUMO+2 (L+2). The major excitations were observed from H−1 → L+2 and H → L+2 for compound 1 in all the studied solvents. The highest oscillator strength (f) was seen in toluene for compound 1. Wijesinghe and co-workers calculated the HOMO–LUMO gaps for compound 1 from the transitions energies, i.e., 2.48 eV (HOMO destabilizing methoxy groups and the LUMO stabilizing N-atoms).31 The calculated HOMO–LUMO gaps (3.31/3.35 eV in chloroform and toluene, respectively) at the PBE0/6-311G* level of theory are in reasonable agreement with the experimental work.31
3.3. Charge transport properties
3.3.1. Ionization potential, electron affinity and reorganization energies. The IP and EA are imperative parameters to apprehend the smaller or greater charge transfer (CT) from semiconductor surface and its CT nature. It is well-known that the smaller IP/larger EA values mean that materials would be better hole/electron transport contenders ultimately by reducing the injection barrier, respectively. Similarly, the reorganization energy (λ) is also the major charge transfer parameter, which can help to interpret the charge transfer nature in semiconducting materials. The smaller λ value would lead to superior charge transport. The adiabatic IP (IPa), vertical IP (IPv), adiabatic EA (EAa), vertical EA (EAv), hole reorganization energy (λ (h)) and electron reorganization energy (λ (e)) of the nitrogen-doped graphene compound are given in Table 3. The λ (e) of four nitrogen atoms incorporated graphene compound (1) is smaller than that of the λ (h) enlightening that this material might be worthy to be electron transport nominee. Additionally, we have also checked the effect of diffuse function on the IP, EA and λ. For this purpose all these above mentioned charge transfer parameters were calculated at PBE0/6-311+G* level of theory. It can be seen from Table 3 that diffuse function has no significant effect on the charge transfer parameters. For instance, the largest difference of 0.1 eV is for EAa with 6-311G* and 6-311+G* basis sets while on the other hands, the smallest difference of 0.005 eV is seen for both reorganization energies λ with 6-311G* and 6-311+G* basis sets. Although the difference in above charge transport properties are smaller, the difference of computational cost for optimization of NDG compound 1 in its three states (neutral, cation and anion) is much larger between 6-311G* and 6-311+G* basis sets. As shown in Table S2 of ESI,† the average difference of computational cost is 49.34 days between 6-311G* and 6-311+G* basis sets.
Table 3 The vertical and adiabatic ionization potentials (IPv/IPa), electron affinities (EAv/EAa), hole reorganization energies λ (h), electron reorganization energies λ (e) of for NDG compound 1 (in eV) with PBE0 method and different basis setsa
| IPa |
EAa |
IPv |
EAv |
λ (h) |
λ (e) |
| Values in parentheses are at PBE0/6-311+G* level of theory. |
| 6.53 (6.58) |
1.58 (1.68) |
6.70 (6.74) |
1.44 (1.53) |
0.306 (0.311) |
0.278 (0.283) |
3.4. Band structure
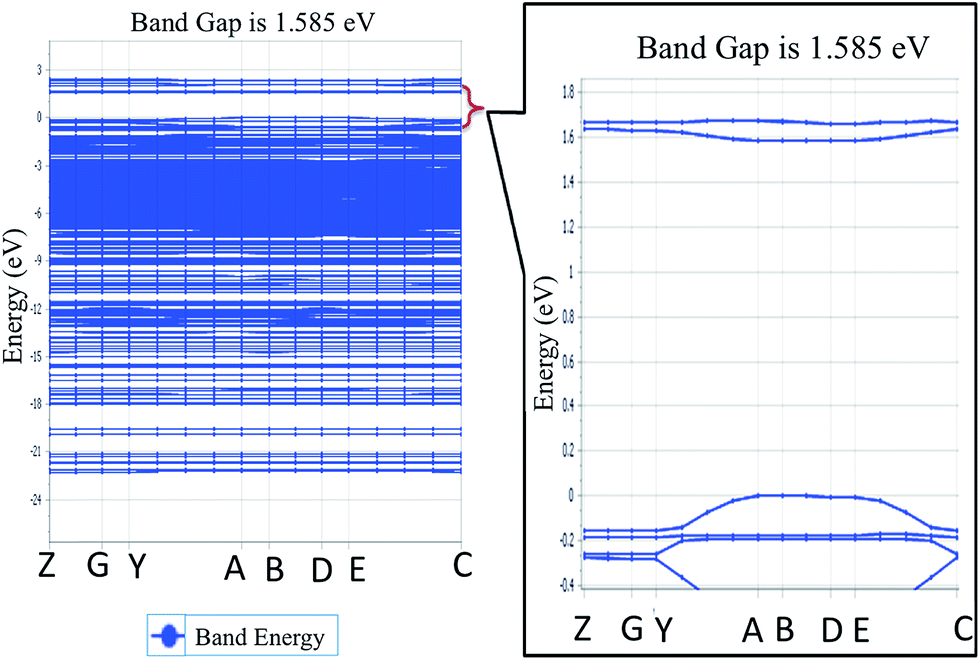
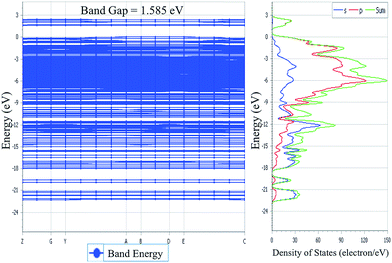
To explore the potential of NDG compound 1 for their electro-optical applications, electronic band structure is an important parameter to investigate. Fig. 4 illustrates the band structure for NDG compound 1 drawn with the Brillouin Zone (BZ), evaluated at symmetrical points. The inset part of Fig. 4 also presents the zoomed energy spectra near the Fermi level for enlighten band gap specifically. The Fig. 4 demonstrates the valence band maxima (VBM) and the conduction band minima (CBM) that are originated on the symmetrical point A in BZ and discloses that NDG compound 1 is a material with direct band gap as 1.585 eV at symmetrical point A. It is also clear from the Fig. 5 that the CBM has been controlled by the p orbitals, which might be main reason for narrow band gap of NDG compound 1. This smaller band gap for NDG compound 1 states that NDG compound 1 is a potential contender for optoelectronic applications.
 |
| | Fig. 4 The energy spectra for NDG compound 1, where inset is the zoomed-in area in the vicinity of Fermi level. | |
 |
| | Fig. 5 Electronic band structure for molecular crystal of NDG compound 1 along with its DOS at bulk level. | |
3.5. Density of states
The TDOS and PDOS for NDG compound 1 have been comprehensively drawn using GGA at the PW91 level of DFT using the CASTEP module as implemented in Material Studio. The TDOS and PDOS of NDG compound 1 have been assessed along with the participation of N, O and C atoms and graphically presented in Fig. 6 and 7, respectively. The deep valance bands between −22 and −12 eV are dominated by the s-orbitals of all atoms, however the contribution of s-orbitals in the formation of upper valance band as well as in the conduction bands is very insignificant, illuminating the negligible small contribution from s-orbitals of NDG compound 1 for electronic properties. The peaks between −9 to 0 eV at upper valance band were formed by the p-orbitals specifically from N and C atoms. Furthermore, in the conduction bands p-orbitals of nitrogen atoms are also participating in the formation of PDOS. The CBM are controlled through p-character, however the orbitals have been distributed among 1 eV to 3 eV. Similar type of participation from s and p-orbitals of carbon atoms was found in TDOS and PDOS in NDG compound 1 as displayed in Fig. 7. In valance and conduction bands the s-orbitals of oxygen atoms presenting minor contribution, though the p-orbitals from oxygen atoms show a good involvement at energy range between −9 to −1 eV in the valance bands (see Fig. 7). The electronic bands structure of NDG compound 1 exhibits that energy bands at Fermi level controlled by the p-orbitals therefore have a vital chunk in the electronic properties of NDG compound 1 that elucidates that the NDG compound 1 is remarkable contender for OPVs applications.
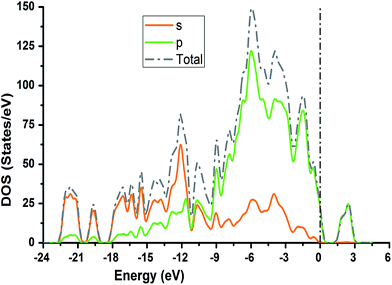 |
| | Fig. 6 Computed total density of state for NDG compound 1 and contributions from s and p orbitals. | |
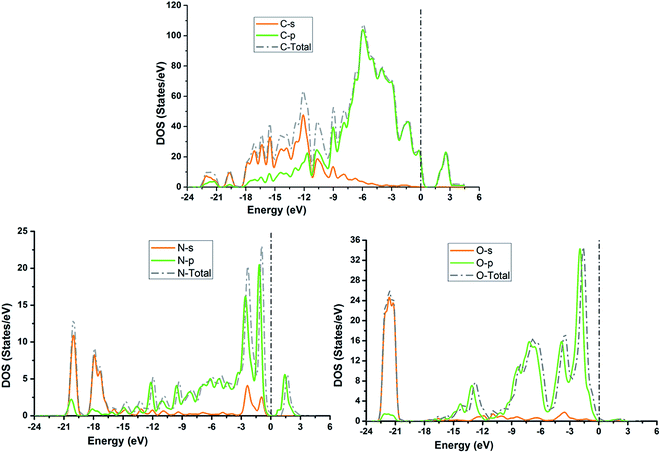 |
| | Fig. 7 Partial density of states for NDG compound 1 from carbon atom (top), nitrogen atom (bottom left) and oxygen atom (bottom right). | |
3.6. Optical properties
It is very crucial to investigate the optical properties a material for understanding its efficacy. We evaluate the optical properties of NDG compound 1 including the real and imaginary parts of dielectric function (ε1/ε2), real and imaginary parts of conductivity (σ1/σ2) along with reflectivity, refractive index (n) and extinction coefficient (k) as explained in computational details and graphically shown in Fig. 8 and 9, respectively.
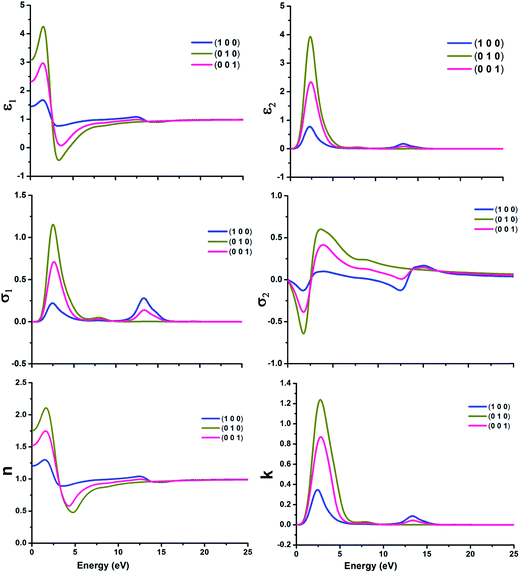 |
| | Fig. 8 The real and imaginary parts of dielectric function (ε1 and ε2) (top); real and imaginary parts of conductivity (σ1 and σ2) (center) and refractive index (n)/extinction co-efficient (k) (bottom) of nitrogen-doped nanographene NDG compound 1 in three directions, respectively. | |
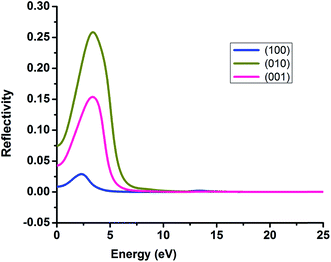 |
| | Fig. 9 The reflectivity of nitrogen-doped nanographene compound 1 in the (100), (010) and (001) directions. | |
3.6.1. Dielectric function. The dielectric function with real and imaginary parts (ε1 and ε2) have been displayed in Fig. 8 for molecular crystal of NDG compound 1 and significant alterations were establish in the spectra of dielectric function for NDG compound 1. The ε1 of NDG compound 1 exhibits high spectra in the (010) and (001) directions at 5 eV. The ε1 at 0 eV was computed in three (100), (010) and (001) directions as 1.45, 3.07 and 2.32, respectively. These good values for ε1 at 0 eV suggested the enormous potential for transferring electrons through molecular crystal of NDG compound 1. The (010) and (001) directions are primarily contributing to organize the ε2 for NDG compound 1. This exposed that the NDG compound 1 would be good intermolecular charge transport material.
3.6.2. Conductivity functions. The conductivity function with real and imaginary parts (σ1 and σ2) has been displayed graphically in Fig. 8 for NDG compound 1. The σ1 and σ2 have been dominated from the (010) and (001) directions for NDG compound 1. The conduction spectra for NDG compound 1 exhibit strong values for σ1 between the energy ranges of 1–5 eV then quickly demolished to zero after 7 eV and presenting the undeviating zero intensity spectra. This spectra revealed the stability of NDG compound 1 which eventually originating a larger capability of transporting the electrons through he molecular crystal, enlightening an enhanced charge transport characteristics of NDG compound 1 molecular crystal.
3.6.3. Refractive index and extinction co-efficient. The study of refractive index (n) and extinction co-efficient (k) are also very vibrant to study the optical behavior of NDG compound 1. The Fig. 8 shows the computed n for three directions (100), (010) and (001) as 1.2, 1.75 and 1.52, respectively at 0 eV. The high n illuminates the molecular crystal of NDG compound 1 which may enhance the photon refracting tendency with very low energy of 5 eV. The Fig. 8 displayed that NDG compound 1 would be capable of producing high outcomes at low input of 5 eV.
3.6.4. Reflectivity. Reflectivity value of NDG compound 1 in the three directions (100), (010) and (001) has been computed and graphically expressed in Fig. 9 to understand the reflectivity more clearly. The (010) and (001) directions exhibited string peaks that reached a plateau consequently after 7 eV. The highest value of reflectivity is 0.25 for NDG compound 1 in the (010) direction that occurs in between the energy range of 2–3 eV. As the transparency of any compound is inversely proportional to the reflectivity of that material hence the smaller reflectivity illuminates the fact that NDG compound 1 might be good optoelectronic materials because NDG compound 1 would be capable of absorbing more light.
3.6.5. Nonlinear optical properties and terminal substitution effect. We further inspired to get insights into the NLO properties of NDG compound 1 due to the π-conjugated planer structure, push–pull configuration and presence of terminal groups. NLO material has many advanced technological applications incorporating the laser frequency conversion, telecommunications and optical data storage etc.58 Usually, the second- and third-order polarizabilities described as microscopic second- and third-order NLO response. The second-order polarizability is prerequisite for frequency doubling while third-order polarizability is typically assumed as an origin of two-photon absorption process (TPA). The presence of two pyrimidine groups as electron acceptor and methoxy and tertiary butyl groups as electron donor might cause NDG compound 1 to show potential second- and third-order polarizabilities. The parent NDG compound 1 includes terminal bulky tertiary butyl groups as week electron donors at a relative larger end that are linked with electron deficient pyrimidine groups present at other end through π-conjugation of graphene. Methoxy groups leading to a multiple electron donors–π–acceptor structure, provide further boosts that are considered as additional advantage for obtaining best NLO response.Moreover, we planned to investigate the effect of tertiary butyl groups on second- and third-order NLO polarizabilities in NDG compound 1 and its derivative compounds 2 and 3. The t-butyl group is known as electron donating group. Similarly, the electronic transitions nature and frontier molecular orbitals patterns show the donating tendency of t-butyl group in NDG compound 1. The reason to use the C2Ph-NH2 (4-(prop-1-yn-1-yl)aniline) group is that the substitution of H atom presumed to show zero donating or accepting effect while on the other hands, the C2Ph-NH2 (4-(prop-1-yn-1-yl)aniline) group is significantly donating due to the presence of NH2 strong electron donor along with significant π-conjugation (prop-1-yn-1-ylbenzene). Furthermore, the purpose of designing NDG compound 2 and 3 is not only to compare the electron donating ability of t-butyl group but also to significantly tune the donating effect for enhancing NLO response, respectively. For above purpose, the compounds 2 and 3 are designed by replacing the terminal tertiary butyl with H atoms and C2Ph-NH2 groups, respectively, as shown in Fig. 10. For the NDG compounds 1–3, their calculated static and frequency dependent β and γ amplitudes are collected in Tables 4 and 5, respectively. As both the hyperpolarizabilities represents different NLO behavior, we will discuss these explicitly in proceeding section.
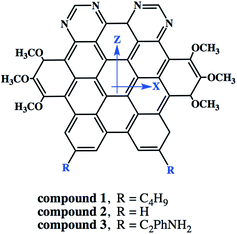 |
| | Fig. 10 The schematic diagram to represent parent NDG compound 1 and its derivative compounds 2 and 3. | |
Table 4 The second-order polarizability (βtot), its individual components and frequency dependent second-order polarizability β(−2ω;ω,ω) for NDG compounds 1–3 with PBE0 method and 6-311G* basis set
| Compound 1 |
Compound 2 |
Compound 3 |
| Component |
×10−30 esu |
Component |
×10−30 esu |
Component |
×10−30 esu |
| ω = 1907 nm. For para-nitroaniline (PNA) since computed in present investigation using PBE0 method and 6-311G* basis set, for β, 1 a. u. = 0.008629 × 10⁻³⁰ esu. |
| βxxx |
−1.29 |
βxxx |
−2.18 |
βxxx |
−1.06 |
| βxxy |
−3.18 |
βxxy |
−0.95 |
βxxy |
−0.23 |
| βxyy |
−0.36 |
βxyy |
0.67 |
βxyy |
−1.86 |
| βyyy |
0.79 |
βyyy |
0.63 |
βyyy |
−5.48 |
| βxxz |
8.23 |
βxxz |
7.09 |
βxxz |
1.94 |
| βxyz |
1.14 |
βxyz |
−1.30 |
βxyz |
2.91 |
| βyyz |
0.38 |
βyyz |
−0.21 |
βyyz |
69.97 |
| βxzz |
0.40 |
βxzz |
−0.11 |
βxzz |
−7.18 |
| βyzz |
−3.92 |
βyzz |
−1.31 |
βyzz |
−1.62 |
| βzzz |
13.43 |
βzzz |
10.65 |
βzzz |
171.68 |
| βtot |
22.96 |
βtot |
17.68 |
βtot |
243.91 |
| β(−2ω;ω,ω)a |
18.95 |
β(−2ω;ω,ω)a |
14.33 |
β(−2ω;ω,ω)a |
207.84 |
| PNA βtotb |
6.476 |
— |
— |
— |
— |
Table 5 The calculated third-order nonlinear polarizability amplitudes 〈γ〉 along with their individual components and frequency dependent third-order polarizability γ(−2ω;ω,ω,0) for compounds 1–3 at PBE0 method and 6-311G* basis set
| Compound 1 |
Compound 2 |
Compound 3 |
| γ |
×10−36 esu |
γ |
×10−36 esu |
γ |
×10−36 esu |
| ω = 1907 nm. para-Nitroaniline (PNA) at PBE0 method and 6-311G* basis set. |
| γxxxx |
490.64 |
γxxxx |
437.53 |
γxxxx |
1218.8 |
| γyyyy |
15.670 |
γyyyy |
6.753 |
γyyyy |
8.7317 |
| γzzzz |
326.72 |
γzzzz |
182.22 |
γzzzz |
4037.8 |
| γxxyy |
25.397 |
γxxyy |
21.115 |
γxxyy |
26.238 |
| γxxzz |
140.04 |
γxxzz |
93.631 |
γxxzz |
1611.66 |
| γyyzz |
14.383 |
γyyzz |
10.550 |
γyyzz |
34.048 |
| 〈γ〉 |
238.53 |
〈γ〉 |
175.42 |
〈γ〉 |
1721.4 |
| γ(−2ω;ω,ω,0)a |
312.43 |
γ(−2ω;ω,ω,0) |
226.19 |
γ(−2ω;ω,ω,0) |
2659.72 |
| PNA 〈γ〉b |
7.550 |
— |
— |
— |
— |
For second-order polarizability we have calculated its static βtotal here after referred as βtot, which is often considered as static intrinsic value as given in Table 4 along with its individual components. As seen from Table 4, among individual components, βzzz carries the largest amplitude of static second-order polarizability in all compounds 1–3, which is because of the alignment of z-axis with charge transfer (CT) axis as shown in Fig. 10. The βtot amplitudes are 22.96 × 10⁻³⁰ esu, 18.71 × 10⁻³⁰ esu and 243 × 10−30 esu for systems 1, 2 and 3, respectively. These βtot amplitudes for NDG systems 1, 2 and 3 are also larger than a proto-type NLO molecule of para nitro-aniline (PNA) with same method and basis set. Interestingly, the terminal group effect is significant because replacing bulky tertiary butyl in NDG compound 1 by hydrogen atoms reduces its βtot amplitudes ∼18% (see βtot amplitudes of compound 2). However, a similar substitution of tertiary butyl groups of parent NDG compound 1 with C2Ph-NH2 groups show a remarkable increase of βtot amplitudes by 13 times compared to NDG compound 1 (see βtot amplitudes of compound 3). This significant enhancement of βtot amplitudes in NDG compound 3 is because of the greater donor–acceptor configuration where pyrimidine rings act as electron acceptors59 and terminal C2Ph-NH2 groups as stronger electron donors. A similar pattern of changes in third-order polarizability γ is also observable for compounds 1–3 as shown in Table 5. As z-axis is the major charge transfer axis, its γzzzz illustrates the largest amplitudes among other components of γ. We make a comparison of third-order NLO polarizability of NDG compound 1 with prototype and similar NLO molecules, which show reasonably large amplitude of compound 1. For example, previously reported open-shell polycyclic aromatic hydrocarbons (PAH) including PAH [3,3] and PAH [5,5] showed their longitudinal components of γzzzz as 72.80 × 10−36 and 204 × 10−36 esu, which are significantly smaller as compared to the longitudinal component γzzzz (326.72 × 10−36 esu) of NDG compound 1.60 A furthermore comparison shows that previously reported graphene nanoflakes containing different edge types and shapes have smaller 〈γ〉 amplitude than that of our compound 1 in present investigation.61,62 In order to gain further perceptions to tune the 〈γ〉 amplitude of compound 1, we designed two more compounds i.e. compound 2 and 3 to see the terminal substitution effects. The substitution of tetra butoxy groups with H atoms in compound 2 causes a decrease of 〈γ〉 amplitude about 63.33 × 10−36 esu as compared to that of compound 1. However, the 〈γ〉 amplitude of compound 3 is found to be 1721.4 × 10−36 esu, which is remarkably larger and it is about ∼7 times greater than that of compound 1. Evidently, the C2PhNH2 groups due to their greater donating effects caused significant enhancement 〈γ〉 amplitude as compared with those of compound 1 and 2 NLO response.
The static hyperpolarizability values are usually used for comparative purpose because it represents amplitude of NLO response for a chemical system at zero-frequency limit. While on the other hands, the frequency dependent hyperpolarizability values are used in complement to the experimental results e.g. EFISHG experiments. The frequency dependent hyperpolarizability values are also important to see the dispersion effect on static hyperpolarizability amplitudes depending on the maximum absorption wavelength of a chemical system. Thus the above results and discussion about NLO responses of compounds highlights the potential of compounds 1–3 as efficient NLO-phore with remarkable second- and third-order polarizability. Moreover, for compounds 1, 2 and 3, an analysis of their dynamic hyperpolarizabilities illustrates that the γ(−2ω;ω,ω) amplitudes show similar pattern of increasing in their γ(−2ω;ω,ω) amplitudes as compared to the static 〈γ〉 values and γ(−2ω;ω,ω) amplitudes are without any dispersion effect around ω = 1907 nm of laser wavelength.
4. Conclusions
Thus, using first principles methods it has been found that NDG compound 1 is a useful NLO and charge transport material. The calculation of several electronic and optical properties are performed in solid-state for compound 1. For example, the results of solid-state crystal structure show that the NDG compound 1 possess a direct band gap of 1.585 eV where the Fermi level has been mainly controlled by the p-orbitals in the energy bands. The dielectric function as calculated in (010) and (001) directions, showed a strong spectra at lower energy of 5 eV, which illustrates a good probability of charge transport process in molecular crystal. Additionally, the calculation of second- (β) and third-order (γ) nonlinear optical polarizabilities indicates that compound 1 possesses reasonably large values of βtot (22.96 × 10⁻³⁰ esu) and 〈γ〉 (238.53 × 10−36 esu) amplitudes, which are several times greater than para-nitrianiline NLO response. Interestingly, the terminal group effect is significant because replacing bulky tertiary butyl groups of parent NDG compound 1 with hydrogen reduces its βtot amplitudes ∼18% (see βtot amplitudes of compound 2) while on the other hand, a similar substitution of tertiary butyl groups of parent NDG compound 1 with C2Ph-NH2 groups show a remarkable increase of βtot amplitudes by 13 times than that of parent compound 1. The TD-DFT calculations along with plots of frontier molecular orbitals show an intramolecular charge transfer from graphene fragment to pyridine moieties accompanied by significant oscillator strengths in absorption spectra leading to a push–pull configuration in NDG compound 1, which has been further modified to get roust NLO response as in compound 3. Thus, it is assumed that our present study will not only provide the valuable knowledge for understanding the optical and NLO behavior of already synthesized NDG compound 1 but also give guidelines to further tune such compounds with efficient and robust NLO responses.
Acknowledgements
The authors would like to express their gratitude to Research Centre of Advanced Materials Science (RCAMS), King Khalid University, Saudi Arabia for support. A. Irfan acknowledges Prof. Zhang Jingping in NENU of China to provide technical support during M.S. calculations.
References
- S. Arulmani, K. Deepa, N. Indumathi, M. V. A. Raj and S. Senthil, Mech. Mater. Sci. Eng. J., 2017, 9 DOI:10.2412/mmse.30.76.146.
- F. Li, B. Zhao, Y. Chen, Y. Zhang, T. Wang and S. Xue, Spectrochim. Acta, Part A, 2017, 185, 20–26 CrossRef CAS PubMed.
- N. Nwaji, B. Jones, J. Mack, D. O. Oluwole and T. Nyokong, J. Photochem. Photobiol., A, 2017, 346, 46–59 CrossRef CAS.
- T. Sagawa, S. Yoshikawa and H. Imahori, J. Phys. Chem. Lett., 2010, 1, 1020–1025 CrossRef CAS.
- J. Singh, Optical properties of condensed matter and applications, John Wiley & Sons, 2006 Search PubMed.
- R. W. Munn and C. N. Ironside, Principles and applications of nonlinear optical materials, Springer, 1993 Search PubMed.
- S. Biswas, A. K. Kole, C. S. Tiwary and P. Kumbhakar, RSC Adv., 2016, 6, 10319–10325 RSC.
- G. M. A. Junqueira, J. P. A. Mendonca, A. H. Lima, W. G. Quirino and F. Sato, RSC Adv., 2016, 6, 94437–94450 RSC.
- S. Muhammad, H. Xu, Y. Liao, Y. Kan and Z. Su, J. Am. Chem. Soc., 2009, 131, 11833–11840 CrossRef CAS PubMed.
- S. Muhammad, H. Xu, Z. Su, K. Fukuda, R. Kishi, Y. Shigeta and M. Nakano, Dalton Trans., 2013, 42, 15053–15062 RSC.
- B. S. Ong, Y. Wu, P. Liu and S. Gardner, J. Am. Chem. Soc., 2004, 126, 3378–3379 CrossRef CAS PubMed.
- L. R. Dalton, P. A. Sullivan and D. H. Bale, Chem. Rev., 2009, 110, 25–55 CrossRef PubMed.
- P. S. P. Silva, H. El Ouazzani, M. Pranaitis, M. R. Silva, C. T. Arranja, A. J. F. N. Sobral, B. Sahraoui and J. A. Paixão, Chem. Phys., 2014, 428, 67–74 CrossRef CAS.
- A. K. Geim and K. S. Novoselov, Nat. Mater., 2007, 6, 183–191 CrossRef CAS PubMed.
- T. Enoki, Y. Kobayashi and K.-I. Fukui, Int. Rev. Phys. Chem., 2007, 26, 609–645 CrossRef CAS.
- X. Li, W. Zhao and G. Chen, Mater. Rev., 2008, 8, 014 CAS.
- H. Nagai, M. Nakano, K. Yoneda, R. Kishi, H. Takahashi, A. Shimizu, T. Kubo, K. Kamada, K. Ohta and E. Botek, Chem. Phys. Lett., 2010, 489, 212–218 CrossRef CAS.
- S. Muhammad, H.-L. Xu, R.-L. Zhong, Z.-M. Su, A. G. Al-Sehemi and A. Irfan, J. Mater. Chem., 2013, 1, 5439–5449 RSC.
- S. Muhammad, M. Nakano, A. G. Al-Sehemi, Y. Kitagawa, A. Irfan, A. R. Chaudhry, R. Kishi, S. Ito, K. Yoneda and K. Fukuda, Nanoscale, 2016, 8, 17998–18020 RSC.
- S.-j. Li, S. Gan, H.-r. Mu, Q.-y. Xu, H. Qiao, P.-f. Li, Y.-z. Xue and Q.-l. Bao, Carbon, 2015, 82, 608 CrossRef.
- R. Lv and M. Terrones, Mater. Lett., 2012, 78, 209–218 CrossRef CAS.
- Z.-H. Sheng, H.-L. Gao, W.-J. Bao, F.-B. Wang and X.-H. Xia, J. Mater. Chem., 2012, 22, 390–395 RSC.
- Y.-B. Tang, L.-C. Yin, Y. Yang, X.-H. Bo, Y.-L. Cao, H.-E. Wang, W.-J. Zhang, I. Bello, S.-T. Lee and H.-M. Cheng, ACS Nano, 2012, 6, 1970–1978 CrossRef CAS PubMed.
- A. Irfan, A. R. Chaudhry, S. Muhammad and A. G. Al-Sehemi, J. Mol. Graphics Modell., 2017, 75, 209–219 CrossRef CAS PubMed.
- F. Joucken, Y. Tison, P. Le Fèvre, A. Tejeda, A. Taleb-Ibrahimi, E. Conrad, V. Repain, C. Chacon, A. Bellec, Y. Girard, S. Rousset, J. Ghijsen, R. Sporken, H. Amara, F. Ducastelle and J. Lagoute, Sci. Rep., 2015, 5, 14564 CrossRef CAS PubMed.
- J. Sforzini, P. Hapala, M. Franke, G. van Straaten, A. Stöhr, S. Link, S. Soubatch, P. Jelínek, T. L. Lee, U. Starke, M. Švec, F. C. Bocquet and F. S. Tautz, Phys. Rev. Lett., 2016, 116, 126805 CrossRef CAS PubMed.
- T. B. Martins, R. H. Miwa, A. J. R. Da Silva and A. Fazzio, Phys. Rev. Lett., 2007, 98, 196803 CrossRef CAS PubMed.
- L. Qu, Y. Liu, J.-B. Baek and L. Dai, ACS Nano, 2010, 4, 1321–1326 CrossRef CAS PubMed.
- R. I. Jafri, N. Rajalakshmi, K. S. Dhathathreyan and S. Ramaprabhu, Int. J. Hydrogen Energy, 2015, 40, 4337–4348 CrossRef CAS.
- H. Wang, T. Maiyalagan and X. Wang, ACS Catal., 2012, 2, 781–794 CrossRef CAS.
- L. P. Wijesinghe, B. S. Lankage, G. M. Ó. Máille, S. D. Perera, D. Nolan, L. Wang and S. M. Draper, Chem. Commun., 2014, 50, 10637–10640 RSC.
- S. Muhammad, A. G. Al-Sehemi, A. Irfan and A. R. Chaudhry, J. Mol. Graphics Modell., 2016, 68, 95–105 CrossRef CAS PubMed.
- S. Muhammad, A. G. Al-Sehemi, A. Irfan, A. R. Chaudhry, H. Gharni, S. AlFaify, M. Shkir and A. M. Asiri, J. Mol. Model., 2016, 22, 1–9 CrossRef CAS PubMed.
- M. J. Frisch, G. W. Trucks, H. B. Schlegel, G. E. Scuseria, M. A. Robb, J. R. Cheeseman, J. A. Montgomery Jr, T. Vreven, K. N. Kudin, J. C. Burant, J. M. Millam, S. S. Iyengar, J. Tomasi, V. Barone, B. Mennucci, M. Cossi, G. Scalmani, N. Rega, G. A. Petersson, H. Nakatsuji, M. Hada, M. Ehara, K. Toyota, R. Fukuda, J. Hasegawa, M. Ishida, T. Nakajima, Y. Honda, O. Kitao, H. Nakai, M. Klene, X. Li, J. E. Knox, H. P. Hratchian, J. B. Cross, V. Bakken, C. Adamo, J. Jaramillo, R. Gomperts, R. E. Stratmann, O. Yazyev, A. J. Austin, R. Cammi, C. Pomelli, J. W. Ochterski, P. Y. Ayala, K. Morokuma, G. A. Voth, P. Salvador, J. J. Dannenberg, V. G. Zakrzewski, S. Dapprich, A. D. Daniels, M. C. Strain, O. Farkas, D. K. Malick, A. D. Rabuck, K. Raghava-chari, J. B. Foresman, J. V. Ortiz, Q. Cui, A. G. Baboul, S. Clifford, J. Cioslowski, B. B. Stefanov, G. Liu, A. Liashenko, P. Piskorz, I. Komaromi, R. L. Martin, D. J. Fox, T. Keith, M. A. Al-Laham, C. Y. Peng, A. Nanayakkara, M. Challacombe, P. M. W. Gill, B. Johnson, W. Chen, M. W. Wong, C. Gonzalez and J. A. Pople, Gaussian 09, Gaussian Inc, Wallingford CT, 2004 Search PubMed.
- A. Irfan, Comput. Mater. Sci., 2014, 81, 488–492 CrossRef CAS.
- A. Irfan, Optik, 2014, 125, 4825–4830 CrossRef CAS.
- J. P. Perdew, K. Burke and M. Ernzerhof, Phys. Rev. Lett., 1996, 77, 3865 CrossRef CAS PubMed.
- C. Adamo and V. Barone, J. Chem. Phys., 1999, 110, 6158–6170 CrossRef CAS.
- C. Adamo, G. E. Scuseria and V. Barone, J. Chem. Phys., 1999, 111, 2889–2899 CrossRef CAS.
- D. Jacquemin, E. A. Perpete, I. Ciofini and C. Adamo, Acc. Chem. Res., 2008, 42, 326–334 CrossRef PubMed.
- S. Muhammad, J. Mol. Graphics Modell., 2015, 59, 14–20 CrossRef CAS PubMed.
- Y. Zhao and D. G. Truhlar, Chem. Phys. Lett., 2011, 502, 1–13 CrossRef CAS.
- Y. Zhao and D. G. Truhlar, Theor. Chem. Acc., 2008, 120, 215–241 CrossRef CAS.
- T. Yanai, D. P. Tew and N. C. Handy, Chem. Phys. Lett., 2004, 393, 51–57 CrossRef CAS.
- J. L. Brédas, J. P. Calbert, D. A. da Silva Filho and J. Cornil, Proc. Natl. Acad. Sci. U. S. A., 2002, 99, 5804–5809 CrossRef PubMed.
- Z. G. Soos, E. V. Tsiper and A. Painelli, J. Lumin., 2004, 110, 332–341 CrossRef CAS.
- H. A. Kurtz, J. J. P. Stewart and K. M. Dieter, J. Comput. Chem., 1990, 11, 82–87 CrossRef CAS.
- M. Shkir, S. Muhammad, S. AlFaify, A. Irfan and I. S. Yahia, Spectrochim. Acta, Part A, 2015, 137, 432–441 CrossRef CAS PubMed.
- M. Shkir, S. AlFaify, H. Abbas and S. Muhammad, Spectrochim. Acta, Part A, 2015, 147, 84–92 CrossRef CAS PubMed.
- M. R. S. A. Janjua, C.-G. Liu, W. Guan, J. Zhuang, S. Muhammad, L.-K. Yan and Z.-M. Su, J. Phys. Chem. A, 2009, 113, 3576–3587 CrossRef CAS PubMed.
- C. Dehu, F. Meyers and J. L. Bredas, J. Am. Chem. Soc., 1993, 115, 6198–6206 CrossRef CAS.
- S. Muhammad, M. R. S. A. Janjua and Z. Su, J. Phys. Chem. C, 2009, 113, 12551–12557 CAS.
- H. J. Monkhorst and J. D. Pack, Phys. Rev. B: Solid State, 1976, 13, 5188 CrossRef.
- R. Car and M. Parrinello, Phys. Rev. Lett., 1985, 55, 2471 CrossRef CAS PubMed.
- R. Carter, J. Sloan, A. I. Kirkland, R. R. Meyer, P. J. D. Lindan, G. Lin, M. L. H. Green, A. Vlandas, J. L. Hutchison and J. Harding, Phys. Rev. Lett., 2006, 96, 215501 CrossRef PubMed.
- A. Irfan, A. Kalam, A. R. Chaudhry, A. G. Al-Sehemi and S. Muhammad, Optik, 2017, 132, 101–110 CrossRef CAS.
- A. Irfan, A. G. Al-Sehemi, A. R. Chaudhry, S. Muhammad and A. M. Asiri, Optik, 2016, 127, 10148–10157 CrossRef CAS.
- M. G. Papadopoulos, A. J. Sadlej and J. Leszczynski, Non-linear optical properties of matter, Springer, 2006 Search PubMed.
- I. S. Park, H. Komiyama and T. Yasuda, Pyrimidine-based twisted donor–acceptor delayed fluorescence molecules: a new universal platform for highly efficient blue electroluminescence, Chem. Sci., 2017, 8(2), 953–960 RSC.
- M. Nakano, H. Nagai, H. Fukui, K. Yoneda, R. Kishi, H. Takahashi, A. Shimizu, T. Kubo, K. Kamada and K. Ohta, Chem. Phys. Lett., 2008, 467, 120–125 CrossRef CAS.
- K. Yoneda, M. Nakano, H. Fukui, T. Minami, Y. Shigeta, T. Kubo, E. Botek and B. Champagne, ChemPhysChem, 2011, 12, 1697–1707 CrossRef CAS PubMed.
- H. Nagai, M. Nakano, K. Yoneda, H. Fukui, T. Minami, S. Bonness, R. Kishi, H. Takahashi, T. Kubo and K. Kamada, Chem. Phys. Lett., 2009, 477, 355–359 CrossRef CAS.
Footnote |
| † Electronic supplementary information (ESI) available. See DOI: 10.1039/c7ra02455j |
|
| This journal is © The Royal Society of Chemistry 2017 |
Click here to see how this site uses Cookies. View our privacy policy here. 
 Open Access Article
 This Open Access Article is licensed under a Creative Commons Attribution-Non Commercial 3.0 Unported Licence
 *ab,
Aijaz Rasool Chaudhryab,
Ahmad Irfanbc and
Abdullah G. Al-Sehemibc
*ab,
Aijaz Rasool Chaudhryab,
Ahmad Irfanbc and
Abdullah G. Al-Sehemibc