 Open Access Article
Creative Commons Attribution 3.0 Unported Licence
Tools to enable the study and translation of supramolecular amphiphiles
Thomas
Allam
a,
Dominick E.
Balderston
b,
Mandeep K.
Chahal
b,
Kira L. F.
Hilton
b,
Charlotte K.
Hind
c,
Olivia B.
Keers
b,
Rebecca J.
Lilley
b,
Chandni
Manwani
 b,
Alix
Overton
b,
Precious I. A.
Popoola
b,
Alix
Overton
b,
Precious I. A.
Popoola
 b,
Lisa R.
Thompson
b,
Lisa J.
White
b and
Jennifer R.
Hiscock
b,
Lisa R.
Thompson
b,
Lisa J.
White
b and
Jennifer R.
Hiscock
 *b
*b
aSchool of Chemistry, University of Southampton, University Road, Southampton, SO17 1BJ, UK
bSchool of Chemistry and Forensic Science, University of Kent, Canterbury, CT2 7NH, UK. E-mail: J.R.Hiscock@kent.ac.uk
cResearch and Evaluation, UKHSA, Porton Down, Salisbury SP4 0JG, UK
First published on 26th September 2023
Abstract
This tutorial review focuses on providing a summary of the key techniques used for the characterisation of supramolecular amphiphiles and their self-assembled aggregates; from the understanding of low-level molecular interactions, to materials analysis, use of data to support computer-aided molecular design and finally, the translation of this class of compounds for real world application, specifically within the clinical setting. We highlight the common methodologies used for the study of traditional amphiphiles and build to provide specific examples that enable the study of specialist supramolecular systems. This includes the use of nuclear magnetic resonance spectroscopy, mass spectrometry, X-ray scattering techniques (small- and wide-angle X-ray scattering and single crystal X-ray diffraction), critical aggregation (or micelle) concentration determination methodologies, machine learning, and various microscopy techniques. Furthermore, this review provides guidance for working with supramolecular amphiphiles in in vitro and in vivo settings, as well as the use of accessible software programs, to facilitate screening and selection of druggable molecules. Each section provides: a methodology overview – information that may be derived from the use of the methodology described; a case study – examples for the application of these methodologies; and a summary section – providing methodology specific benefits, limitations and future applications.
Key learning points(1) Key characterisation techniques used for the study of supramolecular amphiphiles.(2) Benefits and limitations of different methodologies used in the study of supramolecular amphiphiles. (3) The complimentary use of methodologies to enable extensive characterisation of supramolecular amphiphile systems. (4) Gaining an understanding of supramolecular amphiphiles for translation into the clinic, the use of accessible online tools, and machine learning methods to aid rational design of drug-like molecules. (5) Use of our flow chart tool to support the full characterisation of supramolecular amphiphiles and the higher-order structures produced through their self-assembly. |
1. Introduction
Amphiphiles are molecules possessing both hydrophilic and hydrophobic components, typically a hydrophilic head and hydrophobic tail, that are traditionally held together through covalent bonding. Due to this combination of hydrophobic and hydrophilic properties, members from this class of compound can self-associate in solution to form a variety of morphologies, including micelles, vesicles, nanotubes, bilayers, tubules, and reverse micelles.1 The importance of these amphiphilic systems is highlighted by their wide range of uses including, but not limited to, therapeutic applications (anticancer2,3 or antimicrobial3 agents and drug delivery systems),4 material applications (functional biomaterials)5 and as sensors or probes.6 These amphiphilic morphologies possess characteristics that can be investigated using an extensive range of techniques, as outlined in Fig. 1. For example, techniques that are used to characterise amphiphiles include dynamic light scattering (DLS)7 and zeta potential,8 which calculate the hydrodynamic diameter (dH) and stability of the self-associated species produced respectively. In addition, diffusion ordered spectroscopy (DOSY) determines the dH of low-order self-associated and individual molecular species through the attainment of individual resonance diffusion coefficients, which are applied to the Stokes–Einstein equation.9–11 Furthermore, a range of techniques can be used to study the morphology of the higher-ordered self-associated structures that are formed, such as: atomic force microscopy (AFM);12 transition electron microscopy (TEM);13 scanning electron microscopy (SEM);14 quantitative nuclear magnetic resonance (NMR) spectroscopy;15 and ultraviolet-visible (UV-Vis) spectroscopy.16 Defined as chemistry beyond the molecule, supramolecular chemistry is the study of the complex and organised molecular systems that form due to reversible non-covalent interactions, such as hydrogen bonding, in and/or between molecules.17,18 Building on the traditional amphiphile, supramolecular chemists have developed the supramolecular amphiphile, or supra-amphiphile. This amphiphile sub-class utilises dynamic non-covalent interactions to help drive the formation of and/or stabilise amphiphile self-association events. In addition, these controllable self-assembly and disassembly events also enable the resultant higher-order structures produced to be effectively tailored towards a specific use.1,19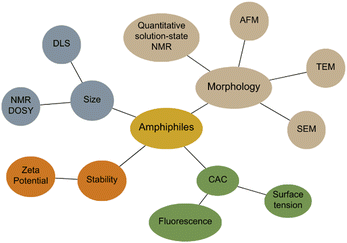 | ||
| Fig. 1 Traditional techniques used in the characterisation of amphiphilic systems. Beige = morphology, blue = size, orange = stability, green = CAC determination. | ||
In addition, the incorporation of metals into higher-order structures produced through the self-assembly of these amphiphilic systems has been shown to result in the production of novel soft materials. These systems combine the advantages of amphiphilicity, such as self-assembly and biocompatibility, with that of adding metal-containing units, introducing biomolecular sensing20 and magnetic properties21 among others.
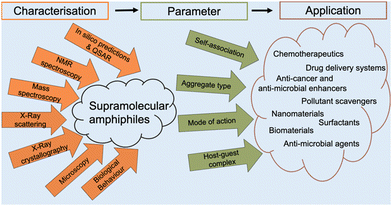
The aim of this tutorial review is to provide a single repository of information that enables the effective characterisation of supramolecular amphiphile systems, drawing on real world examples provided by literature resources, as summarised in Fig. 2. This review explores the use of NMR spectroscopy; mass spectrometry; X-ray scattering techniques, such as small- and wide-angle X-ray scattering (SAXS/WAXS); single crystal X-ray diffraction (SC-XRD); calculation of the critical aggregate concentration (CAC – which includes critical micelle concentration, CMC); various microscopy techniques; and the characterisation of metallo-centered supramolecular amphiphiles. This review also details the considerations that should be accounted for when working with supramolecular amphiphiles in a biological setting, the use of in silico property prediction models and computational quantitative structural activity relationship (QSAR) techniques. Each of the 10 sections of this review features a brief description of the technique and how it is used followed by a case study drawing on literature examples. To avoid duplication of resources, complimentary reviews and other publications have been signposted where necessary.
From our work in this area, we believe that there is a gap in the literature regarding processes to enable the full and effective characterisation of supramolecular amphiphiles and the supramolecular structures they form due to their unique nature. This review aims to begin to fulfil this unmet need and to highlight where novel innovation in this area may be required, inspiring and supporting others already working within, or with a desire to enter this sub-field of supramolecular chemistry. Figures and Tables have been colour shaded where possible to aid visual accessibility for the reader, unless this process was found to interfere with image clarity.
2. Discussion
2.1 Nuclear magnetic resonance (NMR) spectroscopy
Advances in NMR spectroscopy, combined with the large range of NMR spectroscopy active nuclei available for study, have resulted in this apparatus becoming one of the most powerful and versatile tools for use in the field of supramolecular chemistry and beyond. NMR spectroscopy is primarily used to identify and quantify molecular structure and intra- or intermolecular interaction information of both pure and complex mixtures, in either the solid,22,23 semi-solid24 or solution state.25,26NMR spectroscopy reports on the electronic environment of the nuclei under investigation. This may be affected by multiple factors, which include the presence of conjugation; the proximity of neighbouring covalently bound elements (functional groups); the presence or formation of intra- or intermolecular interactions. The slower tumbling rate of larger aggregated species can also lead to difficulties in observing these systems using conventional solution-state NMR spectroscopy. A slower tumbling rate leads to signal broadening, which complicates or prevents accurate spectral analysis.27 As a result, this technique is often used to characterise non-covalent complexation events.28,29
High-resolution magic angle spinning (HR-MAS) NMR spectroscopy utilises a combination of solid- and solution-state NMR spectroscopy techniques, enabling the spectra of semi-solid samples, which have restricted molecular mobility, to be obtained using a solution-state NMR spectrometer to run standard solution-state experiments.30 This non-destructive method is routinely used to analyse both amorphous crystalline and gel-like materials. The collection of high-resolution data is enabled by rapid specimen uniaxial rotation, which is inclined at 54° – the magic angle.31
Solid-state NMR spectroscopy is routinely used for the generation of high-resolution structures of protein aggregates, crystallised proteins, and membrane proteins.32 In addition, solid-state NMR spectroscopy has also been used to investigate the non-covalent interactions contained within model phospholipid (an amphiphilic species) bilayers which contain naturally abundant NMR active nuclei, 31P (100%) and 14N (99.63%).33
Through comparative integration of the molecular signal to that of a known internal standard, quantitative solution-state 1H NMR spectroscopy (qNMR) studies allow for the elucidation of any non-detectable (due to the size and limitations of the spectrometer), higher-order structures that may be present in a specific solvent environment.34 In addition to one-dimensional NMR spectroscopy, complimentary two-dimensional (2D) NMR spectroscopy techniques are also useful for structural determination, such as correlation spectroscopies (COSY and TOCSY), nuclear Overhauser effect spectroscopy (NOESY) and rotating-frame nuclear Overhauser effect spectroscopy (ROSEY),35 and DOSY, as described within the introduction section of this review.9–11
Supramolecular amphiphiles incorporate additional non-covalent interactions to stabilise any resultant aggregate structure formed. Therefore, to fully characterise these systems, the strength of these molecular level association events needs to be quantified. Methods to enable the quantification of these interactions are provided within the case study 1a.
Although common for standard molecular structural characterisation, this simple technique is not frequently used for amphiphilic self-association constant determination, with only a limited number of examples reported within the literature.36,37 Furthermore, molecular association events have to be observed below CAC, meaning that determining these values at lower concentrations through the use of UV-Vis spectroscopy or fluorescence may be more appropriate. However, these aforementioned methods do not give as much detailed information as 1H NMR spectroscopy, where the formation of any hydrogen bonds can be directly observed through monitoring the change in chemical shift of a specific resonance, upon change in the concentration of the amphiphile (self-association) or guest (host–guest complex formation).
There are two types of molecular association events typically of interest to those working in the field of supramolecular amphiphiles: (i) those that involve a single chemical species and undergo self-associative complexation events, and (ii) those that involve more than one molecular species, therefore undergo host–guest complexation. The strength of interaction between the molecular species involved in these events is reported, either as an association constant, or the corresponding dissociation constant.
Thordarson and co-workers have produced several very useful reviews explaining the concepts behind the calculation of these values for these different complexation events, so further discussion is not provided here.38,39 In addition, these field experts have produced a freely accessible online tool (BindFit)40 to enable calculation of various molecular association constants from not only NMR spectroscopy data, but also UV-Vis or fluorescence data. Self-associative binding constants are produced through dilution studies, in which a concentrated sample of the compound being investigated undergoes serial dilution at or below CAC in the case of amphiphilic compounds. However, association constants calculated from heterogeneous complexation events require titration experiments to be performed again at or below CAC, in the case of amphiphilic compounds, where the concentration of the ‘host’ is kept the same and the concentration of the ‘guest’ is systematically increased, usually until 6–10 molecular equivalents of the guest have been added. Upon the formation of any intermolecular interactions, a comparative change in the electronic environment of those nuclei directly involved with or in close proximity to the complex formation event is apparent. The change in chemical shift values are then fitted to a binding isotherm model that allows for elucidation of any corresponding self-associative binding constants.36,37,41
The two most widely utilised single self-associative binding models applicable here are the co-operative equal K (CoEK) model, which assumes the first association event is different from all subsequent identical association events,42 and the dimerisation/equal K (EK) model, where all association events are equal. Here both models assume one component, unidirectional homogenous aggregation events.43
Case study 1a. Hydrogen bond donating (HBD) receptors for the selective coordination of anionic guest species in competitive solvent mixtures are well recognised in the field of supramolecular chemistry.44,45 Comparatively, there are far fewer examples of low molecular weight compounds (MW < 500) which contain HBD units covalently linked to an anionic hydrogen bond accepting (HBA) substituent.46 Exploring this void in the field of supramolecular chemistry, Hiscock and co-workers developed a series of structurally related supramolecular self-associating amphiphiles (SSAs) incorporating the (thio)urea-alkyl spacer-anion motif within the modular molecular SSA skeleton (Fig. 3A).
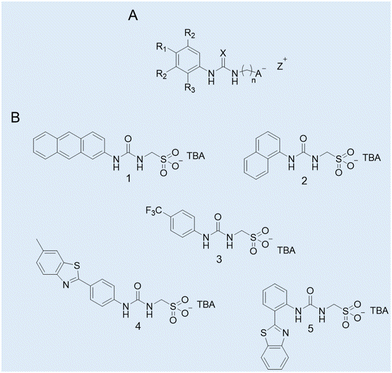 | ||
| Fig. 3 (A) General chemical structure of an SSA. R = any group; X = S or O; n = 1, 2, or 3; A− = sulfonate or carboxylate; Z+ = counter cation. (B) Molecular structures of SSAs developed by Hiscock and co-workers (1–5).11 TBA = tetrabutylammonium. Reproduced/adapted from ref. 11 with permission from RSC Chemical Science. | ||
To gain an insight into any self-association processes in the solution-state, preliminary DLS studies were performed for 1–5 (Fig. 3B) in competitive solvent systems, ranging from mostly aqueous systems through to 100% DMSO. The data generated showed the presence of higher-order structures with a dH > 100 nm in an aqueous environment. However, in a 100% DMSO solution, molecular structures with a dH ≈ 1 nm were recorded, hypothesised to be lower-order monomeric or dimeric species. To support this hypothesis a series of 2D 1H NMR DOSY spectroscopy experiments were conducted in DMSO-d6-0.5% H2O. The resonance diffusion coefficients were applied to the Stokes–Einstein equation, where a dH of ≈ 1.6 nm was generated for the anionic component of the compound, corroborating with those results from the DLS studies.11
To gain a quantitative understanding of the molecular self-association interactions of those lower-order complexation events, a series of 1H NMR spectroscopy dilution studies were performed in DMSO-d6-0.5% H2O. The downfield changes in chemical shift of the corresponding HBD N–H resonances with increasing concentration were monitored, and these data were then fitted to both the EK and CoEK binding isotherm models using BindFit, Table 1.
| SSA | EK model (M−1) | CoEK model (M−1) | |||
|---|---|---|---|---|---|
| K e | K dim | K e | K dim | p | |
| 1 | 2.9 ± 0.5 | 1.5 ± 0.2 | 8.6 ± 1.1 | 4.3 ± 0.5 | 0.5 ± 2.5 |
| 2 | <0.1 ± 1.5 | <0.1 ± 0.8 | 0.5 ± 43.1 | 0.3 ± 21.5 | 0.0 ± 47.0 |
| 3 | 0.6 ± 3.0 | 0.3 ± 1.5 | 13.0 ± 5.7 | 6.5 ± 2.9 | 0.2 ± 23.8 |
| 4 | 5.3 ± 0.6 | 2.7 ± 0.3 | 13.0 ± 0.7 | 6.5 ± 0.3 | 0.5 ± 2.0 |
| 5 | 1.2 ± 2.1 | 0.6 ± 1.1 | 6.2 ± 8.8 | 3.1 ± 4.4 | 0.4 ± 17.8 |
Comparative analyses of those values obtained show the EK model (Kdim values) to give the best fit for those data obtained, thus providing further evidence towards the presence of hydrogen bonded dimeric species in solution. Furthermore, a correlation was determined between the inverse of the calculated self-association constants and nanostructure dH determined from analogous DLS studies, where smaller self-associated aggregates exhibited stronger self-associative interactions.11
In subsequent studies, the authors have continued to utilise this technique, applying it to their extensive library of SSAs in order to investigate any self-associative complexation events.15,34,36,37,47,48
Summary
This work highlights the use of NMR spectroscopy as a non-destructive, accessible, in situ tool, offering unique insight towards the quantification of molecular level association events for supramolecular amphiphiles. Further advantages include a large temperature range (−150 °C to 150 °C) and multiple state analysis (semi-solid, solid and solution). Furthermore, NMR spectroscopy allows for the elucidation of solution-state non-covalent interactions of both pure and complex mixtures, with complimentary, freely available, simple to use, BindFit software allowing for the derivation of self-association constants and host–guest complexation events.
Limitations
As a characterisation tool, there is difficulty in spectral analysis of high molecular weight complex mixtures due to a greater potential for signal overlap. For association constant quantification using BindFit, the isotherm models are limited to either 1![[thin space (1/6-em)]](https://www.rsc.org/images/entities/char_2009.gif) :
:![[thin space (1/6-em)]](https://www.rsc.org/images/entities/char_2009.gif) 2 or 2
2 or 2![[thin space (1/6-em)]](https://www.rsc.org/images/entities/char_2009.gif) :
:![[thin space (1/6-em)]](https://www.rsc.org/images/entities/char_2009.gif) 1 for host–guest complexation events, and homogenous (1
1 for host–guest complexation events, and homogenous (1![[thin space (1/6-em)]](https://www.rsc.org/images/entities/char_2009.gif) :
:![[thin space (1/6-em)]](https://www.rsc.org/images/entities/char_2009.gif) 1) unidirectional polymerisation events for self-association constant derivation.
1) unidirectional polymerisation events for self-association constant derivation.
2.2 Mass spectrometry (MS)
The continued development of mass spectrometry (MS) methodologies and equipment has resulted in the development of high-resolution mass spectrometry (HRMS) which can determine the difference in mass of two compounds by as little as ±0.0001 Da.49 Examples of HRMS methodologies include, time of flight (ToF) MS, orbitrap MS and Fourier-transform ion cyclotron resonance (FT-ICR) MS.50There are multiple examples for the use of MS (sometimes used in combination with ion mobility spectrometry) for characterisation of supramolecular assemblies and amphiphiles throughout literature.51–54 The most common use of this technique within the field of chemistry is the determination of the m/z for a single molecule. However, there has always been a desire to develop HRMS methodologies to characterise non-covalent interactions and subsequent molecular morphologies. The most substantial advancement in MS, which has allowed the characterisation of supramolecular molecules in general, is the development of soft ionisation techniques. Examples include fast atom bombardment (FAB), matrix-assisted laser desorption ionisation (MALDI), and electrospray ionisation (ESI).55 Soft ionisation is a low energy approach to form charged species, resulting in reduced molecular and complex fragmentation events and maintenance of the parent ion, thus enabling the study of less robust molecules such as proteins, DNA, and supramolecular structures.55
A common use of MS for the study of supramolecular amphiphiles, in addition to the characterisation of the monomeric species in line with standard molecular characterisation methodologies, is the characterisation of intermolecular association events. For example, Stoikov and co-workers have used MALDI-ToF MS to demonstrate the self-assembly of amphiphilic p-tert-butylthiacalix[4]arenes based derivatives in the presence of water-soluble nanoparticles.56 The following case studies show two crucial methodologies for HRMS characterisation of amphiphiles.
Case study 2a. Perylene tetracarboxylic diimide (PDI) exhibits photo- and electro-properties, such as high charge carrier mobility and high fluorescent quantum efficiency. PDI has strong π–π interactions forming self-assembling motifs which, in the solid-state, limit quantum efficiency and therefore practical applications. Zhu and co-workers hypothesised that by increasing molecular complexity of PDI, for example by incorporating isobutyl-functionalised polyhedral oligomeric silsesquioxanes (BPOSS) and fullerene (C60), the synthesised shape amphiphile could display varying properties depending on self-assembled morphology, binding mode and quantum efficiency.57 Travelling wave ion mobility mass spectrometry (TWIM-MS) was utilised in combination with collision activated dissociation (CAD) within the quadrupole ToF MS. Within the CAD experiment, drift gas collides with the ionic species causing any self-associated species to dissociate; the energy required to overcome these supramolecular interactions is then determined. Altering electric field, gas flow, shape, and net charge influences the mobility of the ions within the experiment, in this case resulting in identification of the monomer, dimer and trimer self-associated complexes. PDI self-assembles through π–π stacking, while the POSS and C60 units increase steric bulk, thus influencing the molecular packing arrangement. Utilising complimentary ESI-TWIM-MS with CAD allowed not only the identification of the monomeric and dimeric species, but also variation in the assembly of the dimeric species through identification of differences in strength of their non-covalent interactions, Fig. 4.57
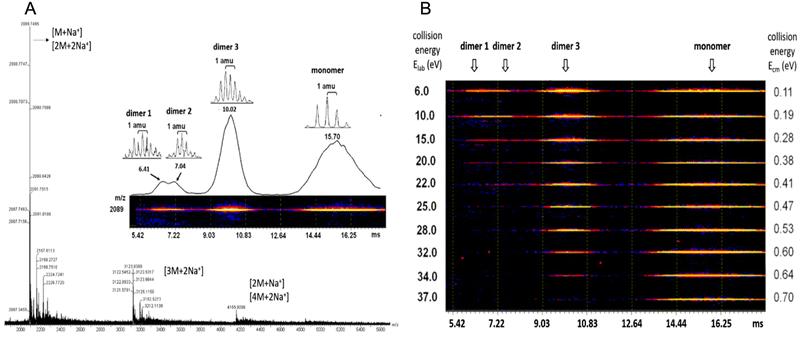 | ||
| Fig. 4 (A) ESI MS of (BPOSS-PDI-C60). (B) 2D TWIM-MS plot of dimer and monomers present and their dissociation energies. Reproduced/adapted from ref. 57 with permission from MDPI Molecules. | ||
Analysis of these dimers with TWIM-MS can be used to indicate how changes in molecular binding mode may alter quantum efficiency and subsequent photo- and/or electro-properties of aggregation induced emission (AIE) events.58 While HRMS provides data relating to the non-covalent binding mode in only the gas-phase. ESI-TWIM-quadrupole-ToF-MS provides data enabling not only the identification of the formation of monomers, dimers, trimers, and oligomers, but also provides insight into complex variation and stability. It should be noted that full characterisation of any non-covalent complex formation events requires additional complementary techniques in multiple phases, such as solid-state SC-XRD or solution-state NMR spectroscopy and CAC determination.
Case study 2b. SSAs, patented by Hiscock and co-workers, are a class of >50 structurally related chemical compounds (Fig. 3). In general, SSAs have been shown to form anionic hydrogen bonded dimers in organic polar solvents such as DMSO, spherical aggregates (dH ≈ 100–550 nm in aqueous conditions) and, in some instances, to form gel fibres upon the addition of certain salts, following an annealing process.5,15 However to support that lower-order structures formed by this class of compounds in polar organic solvents were likely to be dimers of the SSA anionic component, HRMS-ESI− methodologies were utilised to confirm those self-associated species present in the gas-phase.11 This study showed that a high percentage of those SSAs tested (Fig. 3B) existed as dimeric species in the gas phase, exemplified in Table 2.
| SSA | m/z [M]− | m/z [M + M + H+]− | ||
|---|---|---|---|---|
| Theoretical | Actual | Theoretical | Actual | |
| 1 | 329.0602 | 329.0567 | 659.1204 | 659.1210 |
| 2 | 279.0445 | 278.9615 | 559.0890 | 556.9373 |
| 3 | 229.0289 | 229.0292 | 459.0578 | 459.0649 |
| 4 | 376.0431 | 376.039 | 753.0862 | 753.0864 |
| 5 | 362.0275 | 362.0261 | Not observed | |
The self-associated SSA anionic species observed in polar organic solvents, hypothesised to be hydrogen bonded dimers, were generally shown to persist in the gas phase. However, when comparing the results from the two benzothiazole substituted SSAs 4 and 5, Table 2 and Fig. 3, anionic dimers were not observed for 5. SC-XRD of the anionic component of 5 showed the formation of a competitive intramolecular bond between the urea NH group and the nitrogen contained within the benzothiazole functionality, hypothesised to comparatively weaken any SSA anion intermolecular self-association complex formation. In addition, calculation of the dimerisation constant for the anionic component of 4 and 5 in DMSO-d6-0.5% H2O confirmed the strength of hydrogen bonding self-association to be stronger for 4 over 5, 2.7 M−1 and 0.6 M−1 respectively. This provided further evidence for the presence of an intramolecular hydrogen bond within 5, weakening any potential hydrogen bonding self-association events.11 The increased strength of SSA anion hydrogen bond formation has also been correlated to a decrease in CAC. Therefore, HRMS supports data collected from both solution and solid-state studies.
Summary
Due to the development of soft ionisation techniques, HRMS-ESI and TWIM-MS are viable methodologies to study the assembly of supramolecular amphiphiles. This methodology, although destructive, requires one of the lowest sample sizes (<1 mg) for effective analysis of those methods discussed herein. While further distinguishing between non-covalent arrangements in the gas phase provides insights into mechanism of functional properties, this methodology requires additional analytical techniques in tandem. Therefore, HRMS is best served as a key fragment in addition to other characterisation methods.
Limitations
The aggregates formed through supramolecular amphiphile self-assembly processes are often reliant on the solvent environment present, which limits the application of this gas-phase technique towards the study of these systems. MS is a destructive technique and often requires additional techniques to support any observations made.
2.3 X-Ray scattering techniques
X-Ray scattering techniques have been used to analyse many different types of structures produced through a variety of molecular self-association events, from crystalline materials to polymers, and biological macromolecules. The resulting data provides valuable information, from general structural information to material morphology59 and details relating to the material swelling process.60Of the multiple X-ray scattering techniques available, there are two of direct interest to those studying supramolecular amphiphiles: SAXS, and WAXS (also known as SAXD and WAXD). SAXS is used to analyse non-crystalline materials, whereby WAXS is used for analysing crystalline materials. This is advantageous when characterising those materials produced through the assembly of supramolecular amphiphiles that form amorphous aggregates that are not crystalline by nature or cannot be readily crystallised. In general, SAXS and WAXS are non-destructive techniques that can be used on a variety of sample types including, but not limited to, solids, powders, gels, and liquids. However, some solid materials, which are typically run on sample plates requiring around 5 μL of each material, may also require the use of capillary tubes. Depending on the specific instrument used and experimental set-up, a sample volume of 50–200 μL is required. SAXS typically scatters X-rays at small angles (<5°), while WAXS scatters X-rays of >5°. This difference in angle has a major impact on the information that is obtained. SAXS produces information relating to the dynamics and molecular structure of the sample (1–100 nm), whilst WAXS provides details of the sub-nanometre structures (0.2–1 nm), such as the crystal lattice and unit cell dimensions. While these methods are used to obtain specific structural data, they are often used in conjunction with additional techniques to allow full characterisation of a sample. These techniques can include but are not limited to NMR spectroscopy,61 differential scanning calorimetry (DSC),62 TEM,63,64 AFM, SEM and Raman spectroscopy.65
Case study 3a. This case study, produced by Lin and co-workers, focuses on the use of WAXS to characterise supramolecular amphiphile systems.63 Within this featured example, the asymmetric giant amphiphile, diBPOSS-C60 (6, composed of two polyhedral oligomeric silsesquioxanes with isobutyl surface groups, BPOSS and one C60, Fig. 5), was characterised using several techniques including WAXS. Here, temperature dependent WAXS was used to study the phase behaviour and the structural development of diBPOSS-C60.
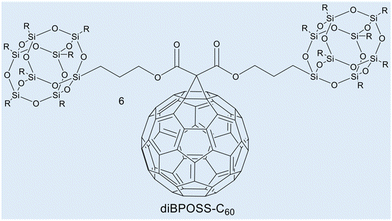 | ||
| Fig. 5 Chemical structure of diBPOSS-C606. Reproduced/adapted from ref. 63 with permission from Elsevier Polymer. | ||
Initial DSC measurements, between 0 °C and 240 °C, were carried out to determine the melting and crystallisation behaviour of diBPOSS-C60. Initially, the sample was heated to 240 °C, before being cooled to 0 °C at a rate of −10 °C min−1, followed by the second heating run at 10 °C min−1. The results of this study found several endothermic processes, between 165 °C and 200 °C, that were hypothesised to be due to either the melting of a singular crystal form with different stabilities, or multiple crystal forms with individual melting points. The data obtained from DSC measurements alone identified these anomalies but were not able to ascertain their source. Therefore, temperature dependent WAXS was employed using analogous experimental parameters.
At 30 °C, amorphous halo peaks were present at 2θ ≈ 2.8°, 9°, and 19°. As the temperature increase continued to 110 °C, diffraction peaks started to appear. The peaks became more distinguishable with increased intensity as the temperature rose to 190 °C, however, they did not change position. At 200 °C, the diffraction peaks disappeared, and the amorphous halo peaks returned, showing the structure met its isotropic melting point.
These WAXS data showed that the endothermic peaks in the DSC scan were due to one crystalline structure with varying sizes, formed with thermal annealing, and therefore with different stabilities. The information provided from the WAXS experiment was also combined with selected area electron diffraction (SAED). Analysis of these data confirmed the unit cell as orthorhombic. The resulting asymmetric supramolecular amphiphile structure was found to consist of a single C60 layer sandwiched between two BPOSS layers.
Case study 3b. In the following example, Pradham and co-workers synthesised three phenylalanine-derived amphiphiles (PDAs), NapF-DETA, NapF-EDEA and NapF-TREN.61 Other examples for the use of SAXS to characterise alternative supramolecular systems have also been produced.66,67 The aim of this work was to create three anion and pH responsive supramolecular hydrogels from these PDAs, for use as sequential drug release systems. TEM confirmed all three PDAs to form fibrillar structures upon self-assembly in water. Hydrogels of these materials were produced using the heat/cool method, at an amphiphile concentration of 10 mg mL−1. Excitingly, NapF-TREN retained a self-supporting hydrogel post syringe extrusion. Upon addition of H2PO4− and HSO4−, supplied as the sodium salt, hydrogels formed from NapF–TREN showed a rapid response in the form of a gel–sol transition. This response was examined further using circular dichroism (CD), TEM, AFM, NMR spectroscopy and SAXS. SAXS allowed the material to be studied in the solution phase, removing the possibility of artifacts produced through sample dehydration. SAXS data obtained from the NapF-TREN hydrogel, in the presence and absence of additional salts, was and subsequently fitted to the Porod cylinder model. This resulted in the identification of nanofiber diameters ≈15 nm however, upon the addition of NaCl the diameter of fibres was found to reduce to ≈7.9 nm (Fig. 6A).
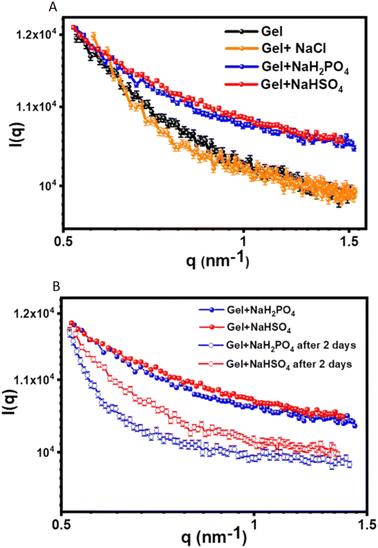 | ||
| Fig. 6 SAXS scattering plots produced from the analysis of the NapF-TREN hydrogel: (A) before and after the addition of Cl−, H2PO4− and HSO4− ions, supplied as the sodium salt; (B) showing the effect of material ageing. Reproduced/adapted from ref. 61 with permission from RSC Nanoscale. | ||
Upon the addition of HSO4− and H2PO4− to the NapF-TREN hydrogel, triggering the gel–sol transition, the SAXS data was fitted to a sphere model. Here particle diameters of ≈7–10 nm were identified, supporting results obtained from complimentary TEM and AFM studies. However, after two days of material ageing (Fig. 6B), SAXS data confirmed the reformation of nanofibers with a diameter of ≈7 nm. This anion responsive hydrogel was then subsequently tested to confirm an additional pH response in order to verify the materials potential for development as a sequential drug release system. As a proof of concept, therapeutic agents propranolol and doxorubicin were first entrapped within the hydrogel. The initial addition of NaH2PO4 was shown to release propranolol, this was followed by a change in pH, which triggered the subsequent release of doxorubicin.
Summary
WAXS is a non-destructive, high throughput technique, which can be used on several forms of materials requiring sample sizes <200 μL. Depending on the sample that is to be analysed, WAXS and SAXS, can be carried out in the laboratory using accessible benchtop equipment.
Case study 3a shows temperature dependent WAXS to be a useful tool for the analysis of crystalline materials composed of supramolecular amphiphiles, characterising phase behaviour and structural changes.
Case study 3b demonstrates the use of SAXS as a valuable method for analysing the morphology of amphiphilic systems in the solution-phase.
Limitations
WAXS can only be used on crystalline and semi-crystalline materials, as such, for supramolecular amphiphiles that do not readily crystallise, only SAXS may be accessible. For samples that are weakly scattering, specialist beam lines with high intensity X-rays are also required.
2.4 Single crystal X-ray diffraction (SC-XRD)
SC-XRD is a non-destructive solid-state technique used to determine the three-dimensional (3D) atomic arrangement of a molecule(s) in the solid-state for materials that exist as a single crystal.68 This methodology enables the determination of the length and angle of a chemical bond present in the sample,69 alongside interactions between atoms including non-covalent bonds such as hydrogen bonds70,71 and π–π stacking.72 Unlike X-ray scattering techniques, X-ray diffraction requires crystalline samples and a high energy X-ray source. SC-XRD measurements can be determined at a wide range of temperatures (80–400 K) and can distinguish between different polymorphs (a form of isomerism where the same material can form different crystal structures). Polymorphisms can cause differences in physical properties of the material, including hygroscopicity, density, and colour.73 Understanding these differences can lead to the informed design of the material.74 This technique is utilised in many different fields of chemistry, for example in macrocyclic supramolecular chemistry, where any self-assembly processes can be identified, and sizes of any supramolecular structures determined.75
Case study 4a. Haldar and co-workers utilised SC-XRD in their study characterising acid and thermal responsive supramolecular polymer gels.76 The authors synthesised 7 (Fig. 7A), designed to be complimentary to the toroidal structure of cyclodextrin, resulting in the formation of a supramolecular polymer which, upon heating and cooling, formed a gel in a DMSO![[thin space (1/6-em)]](https://www.rsc.org/images/entities/char_2009.gif) :
:![[thin space (1/6-em)]](https://www.rsc.org/images/entities/char_2009.gif) H2O (1
H2O (1![[thin space (1/6-em)]](https://www.rsc.org/images/entities/char_2009.gif) :
:![[thin space (1/6-em)]](https://www.rsc.org/images/entities/char_2009.gif) 2) solution. Here, SC-XRD was used to characterise the self-assembled structures that exist in the crystalline solid state. Here, 7 formed parallel sheet-like structures (Fig. 7B), stabilised through the formation of hydrogen bonds between different molecules and π–π stacking utilising the phenyl ring systems. An extended structure was also observed, forming a corrugated sheet-like structure that was stabilised via dispersion forces between the caproic acid alkyl chains (Fig. 7C).
2) solution. Here, SC-XRD was used to characterise the self-assembled structures that exist in the crystalline solid state. Here, 7 formed parallel sheet-like structures (Fig. 7B), stabilised through the formation of hydrogen bonds between different molecules and π–π stacking utilising the phenyl ring systems. An extended structure was also observed, forming a corrugated sheet-like structure that was stabilised via dispersion forces between the caproic acid alkyl chains (Fig. 7C).
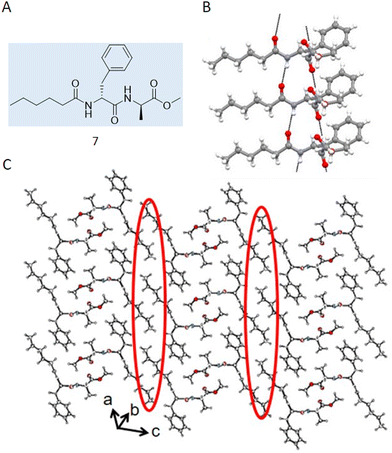 | ||
| Fig. 7 (A) Chemical structure synthesised by Halder and co-workers 7. (B) Crystal structure of 7 showing a hydrogen bonded sheet stabilised by π–π interactions. (C) Extended crystal structure, showing how hydrophobic interactions (circled in red) stabilise interactions between sheets. Carbon = grey, oxygen = red, nitrogen = blue, hydrogen = white. Reproduced/adapted from ref. 76 with permission from MDPI Chemistry. | ||
Summary
SC-XRD is a non-destructive technique which uses <5 mg of sample (depending on quality) whilst producing a substantial amount of data (including 3D positioning of the atoms in space and determination of polymorphisms) and operates at a wide range of temperatures. SC-XRD enables insight into the self-associative nature of amphiphiles in the solid state, which are often hypothesised to affect nanostructure and material formation.5
Limitations
Supramolecular amphiphiles may not readily crystallise and optically clear single crystals must be produced. Crystals should be between 50–250 μm in size. The information gathered is only applicable to solvent-free conditions when amphiphile self-assembly is influenced by solvent environment.41
2.5 Metallo-centred supramolecular amphiphiles
Characterisation of metallo-supramolecular self-assembled amphiphiles is typically realised employing conventional techniques used in their non-metallic counterparts. The list includes DLS, AFM, TEM, cryo-TEM, SEM, as well as NMR spectroscopy. These techniques have been discussed in the introduction and other sections of the review, and typically obtain information about the morphology and size distribution profile of those species present (dH ≈ 0.5 nm to 2.5 μm). Besides conventional techniques, information on metallo-centred amphiphiles is expanded using other spectroscopy techniques such as UV-Vis, emission and 1H NMR spectroscopy titrations.77 Comparative UV-Vis and emission spectral data produced through titration experiments, analogous to those described within Section 1 of this review, enables identification of shifts in absorption peak maxima and/or appearance of new peaks due to charge-transfer between metal centre and amphiphile, indicating the formation of supramolecular aggregates78 or transformations among different/discrete self-assembled states.79 Furthermore, additional insight towards the role of metals in amphiphile aggregation has been achieved by using supplementary techniques such as analytical ultracentrifugation (AUC), CD, energy dispersive X-ray (EDX) spectroscopy, X-ray photoelectron (XPS) spectroscopy, as well as coupled plasma-atomic emission spectrometry (ICP-AES). EDX, XPS and ICP-AES can detect or confirm the presence of metals in self-assembled aggregates,80,81 whereas AUC is used for the determination of micellar molar masses and dH in the case of polymeric metallo-supramolecular assemblies. CD is used to study the chirality in supramolecular assemblies and gives information relating to dynamic behaviour under the influence of external stimuli, such as metal ions or pH. In this section of the review, we will discuss how these additional techniques are used to characterise and study metallo-supramolecular amphiphiles.In characterising polymeric metallo-supramolecular assemblies, use of AUC is preferred over DLS and static light scattering (SLS).84 DLS and SLS give information about the diffusion coefficient, dH, as well as the polydispersity of aggregated species. However, in the case of polymeric metallo-supramolecular assemblies, both of these methods suffer from limitations that include: the presence of large aggregates and lack of sample uniformity, which affect the measurements, such as scattering intensity (I), where I ∝ d6 (where d is a diameter of macromolecule), therefore unable to detect smaller particles; and strong absorption by metal aggregates complicates the interpretation of light scattering data. In contrast, for AUC, sedimentation velocity experiments can discriminate whether a sample is homogeneous in solution or a mixture of forms (e.g. monomer/dimer, or aggregates), and sedimentation equilibrium is particularly useful for determination of molecular weights of aggregated species or subunit stoichiometry (monomer, dimer, trimer etc.) in solution.
Case study 5a. Schubert and co-workers have developed a strategy for the construction of metal-based block copolymer architectures.85 A metal–ligand complex is used as a supramolecular linker between the hydrophobic and hydrophilic blocks of the amphiphilic block copolymers, giving rise to a metallo-supramolecular block copolymer that forms micelles in aqueous solutions.86 DLS and TEM were used for initial characterisation of the size and morphology of non-uniform aggregates (dH = 65–202 nm).87,88 Considering the drawbacks related to DLS for studying the heterogeneous samples (low resolution and unable to detect smaller particles), AUC was used to study the aggregation of metallo-copolymers in solution.89 PS20-[Ru]-PEO70 (8) and PS20-[Ru]-PEO375 (9) copolymers were prepared by connecting two block copolymers, poly(styrene) segment and poly(ethylene oxide) block via a bis-(2,2′:6′,2′′-terpyridine-ruthenium) unit (Fig. 8).90
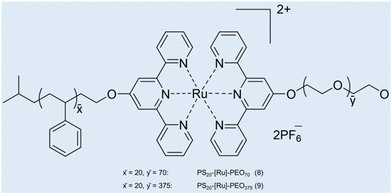 | ||
| Fig. 8 Structures of the two micelle-forming copolymers PS20-[Ru]-PEO708 and PS20-[Ru]-PEO3759. Reproduced/adapted from ref. 90 with permission from the Wiley Journal of Polymer Science Part A: Polymer Chemistry. | ||
Kinetically frozen micelles of 8 and 9 were prepared by adding water to the copolymer/DMF solution with a syringe pump, and equilibrium micelles of 9 were prepared by incubating in H2O for 2–3 weeks. The resulting micelles were characterised by sedimentation velocity and sedimentation equilibrium analyses in an analytical ultracentrifuge and by TEM. Sedimentation analysis showed unimodal size distributions. Micelles of 8 were found to have an average molar mass (M) ≈ 318![[thin space (1/6-em)]](https://www.rsc.org/images/entities/char_2009.gif) 000 g mol−1 (corresponding to 53 protomers per micelle) and dH ≈ 18 nm, whereas micelles of 9 showed M ≈ 603
000 g mol−1 (corresponding to 53 protomers per micelle) and dH ≈ 18 nm, whereas micelles of 9 showed M ≈ 603![[thin space (1/6-em)]](https://www.rsc.org/images/entities/char_2009.gif) 000 g mol−1 (31 protomers per micelle) and dH ≈ 34 nm. However, the TEM results are different from the sedimentation analysis, mainly because of imperfections in the staining procedure as TEM on unstained samples emphasise on particles with better contrast. In addition, radiation can cause damage to morphology, and shadowing the particles usually masks smaller aggregates. This case study shows that AUC is useful to characterise the aggregates formed by combining an organometallic hydrophobic part and a polymeric amphiphilic part, as DLS and TEM suffer from low resolution, thereby masking smaller particles in heterogenous solutions of self-assembled aggregates.
000 g mol−1 (31 protomers per micelle) and dH ≈ 34 nm. However, the TEM results are different from the sedimentation analysis, mainly because of imperfections in the staining procedure as TEM on unstained samples emphasise on particles with better contrast. In addition, radiation can cause damage to morphology, and shadowing the particles usually masks smaller aggregates. This case study shows that AUC is useful to characterise the aggregates formed by combining an organometallic hydrophobic part and a polymeric amphiphilic part, as DLS and TEM suffer from low resolution, thereby masking smaller particles in heterogenous solutions of self-assembled aggregates.
Case study 5b. Parquette and co-workers, reported the impact of Cu2+ coordination on the assembly of 1,4,5,8- naphthalenetetracarboxylic acid diimide (NDI)-based amphiphiles (Fig. 9A).93 The NDI-amphiphile contains lysine/Fmoc protected lysine headgroup on one end and metal-binding BIM ((indolyl)methane) unit on the other end of the molecular structure. TEM, DLS, SEM and AFM studies showed that 10 forms nanotubes at neutral pH and nonspecific aggregates at pH 2 in CH3CN![[thin space (1/6-em)]](https://www.rsc.org/images/entities/char_2009.gif) :
:![[thin space (1/6-em)]](https://www.rsc.org/images/entities/char_2009.gif) H2O (1
H2O (1![[thin space (1/6-em)]](https://www.rsc.org/images/entities/char_2009.gif) :
:![[thin space (1/6-em)]](https://www.rsc.org/images/entities/char_2009.gif) 1). A morphological change from nanotubes to vesicular structures was observed on addition of Cu2+ ions to 10 at pH 7 in CH3CN
1). A morphological change from nanotubes to vesicular structures was observed on addition of Cu2+ ions to 10 at pH 7 in CH3CN![[thin space (1/6-em)]](https://www.rsc.org/images/entities/char_2009.gif) :
:![[thin space (1/6-em)]](https://www.rsc.org/images/entities/char_2009.gif) H2O (1
H2O (1![[thin space (1/6-em)]](https://www.rsc.org/images/entities/char_2009.gif) :
:![[thin space (1/6-em)]](https://www.rsc.org/images/entities/char_2009.gif) 1). The effect of Cu2+ ions, solvents, and pH on the discrete self-assembled states of chiral 10 was studied using UV-Vis and CD spectroscopy.
1). The effect of Cu2+ ions, solvents, and pH on the discrete self-assembled states of chiral 10 was studied using UV-Vis and CD spectroscopy.
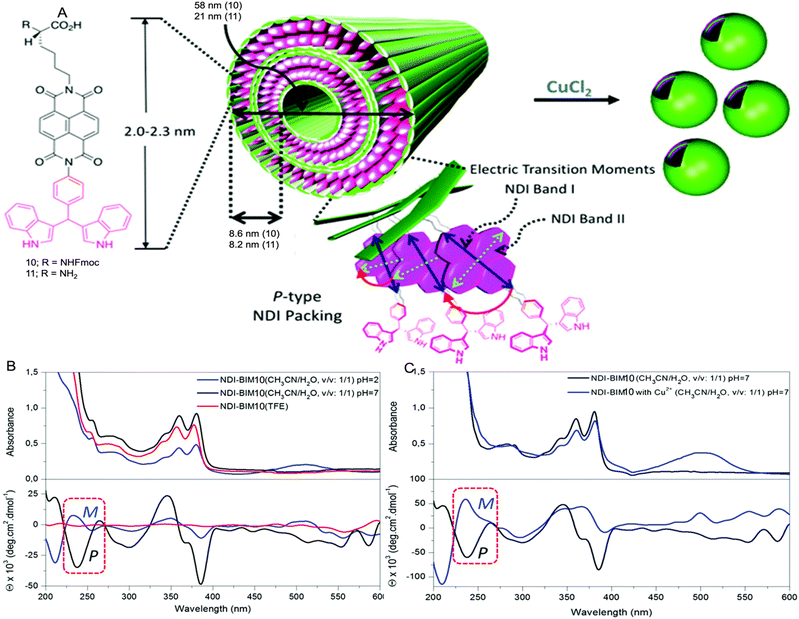 | ||
Fig. 9 (A) Self-assembly of NDI-BIMs 10 and 11. (B) UV-Vis and CD spectra of 10 in CH3CN![[thin space (1/6-em)]](https://www.rsc.org/images/entities/char_2009.gif) : :![[thin space (1/6-em)]](https://www.rsc.org/images/entities/char_2009.gif) H2O (1 H2O (1![[thin space (1/6-em)]](https://www.rsc.org/images/entities/char_2009.gif) : :![[thin space (1/6-em)]](https://www.rsc.org/images/entities/char_2009.gif) 1) in pure TFE. (C) UV-Vis and CD spectra of 10 and 10-Cu in CH3CN 1) in pure TFE. (C) UV-Vis and CD spectra of 10 and 10-Cu in CH3CN![[thin space (1/6-em)]](https://www.rsc.org/images/entities/char_2009.gif) : :![[thin space (1/6-em)]](https://www.rsc.org/images/entities/char_2009.gif) H2O (1 H2O (1![[thin space (1/6-em)]](https://www.rsc.org/images/entities/char_2009.gif) : :![[thin space (1/6-em)]](https://www.rsc.org/images/entities/char_2009.gif) 1) at pH 7. Reproduced/adapted from ref. 93 with permission from RSC Dalton Transactions. 1) at pH 7. Reproduced/adapted from ref. 93 with permission from RSC Dalton Transactions. | ||
The lysine containing amphiphile 11 forms nanotube assemblies at pH 2 but fails to bind to metals due to coordination of the free lysine headgroup. In contrast, 10 exhibits absorbance bands in the range of 240 nm (band II) and 358/378 nm (band I) corresponding to the NDI chromophore. These bands undergo red-shifting on changing the solvents from TFE (2,2,2-trifluoroethanol) to CH3CN![[thin space (1/6-em)]](https://www.rsc.org/images/entities/char_2009.gif) :
:![[thin space (1/6-em)]](https://www.rsc.org/images/entities/char_2009.gif) H2O (1
H2O (1![[thin space (1/6-em)]](https://www.rsc.org/images/entities/char_2009.gif) :
:![[thin space (1/6-em)]](https://www.rsc.org/images/entities/char_2009.gif) 1, pH 7), indicative of J-type aggregation. The CD spectrum showed cotton effects in the 300–350 nm and 350–400 nm ranges in CH3CN
1, pH 7), indicative of J-type aggregation. The CD spectrum showed cotton effects in the 300–350 nm and 350–400 nm ranges in CH3CN![[thin space (1/6-em)]](https://www.rsc.org/images/entities/char_2009.gif) :
:![[thin space (1/6-em)]](https://www.rsc.org/images/entities/char_2009.gif) H2O (1
H2O (1![[thin space (1/6-em)]](https://www.rsc.org/images/entities/char_2009.gif) :
:![[thin space (1/6-em)]](https://www.rsc.org/images/entities/char_2009.gif) 1) at pH 2 and 7, whereas there is no signal for the CD spectrum in TFE, indicative of a less efficient assembly process. The presence of an excitonic couplet at ≈240 nm, due to positive excitonic splitting of the NDI band II transition at pH 7, is indicative of P-type NDI helicity and formation of aggregated species. However, at pH 2, lower overall intensity of the CD bands and the smaller excitonic couplet at ≈240 nm suggested that the assembly process was inhibited, producing partial aggregates with opposite M-type NDI helicity (Fig. 9B). The binding of Cu2+ at pH 7 is monitored by UV-Vis and forms a 1
1) at pH 2 and 7, whereas there is no signal for the CD spectrum in TFE, indicative of a less efficient assembly process. The presence of an excitonic couplet at ≈240 nm, due to positive excitonic splitting of the NDI band II transition at pH 7, is indicative of P-type NDI helicity and formation of aggregated species. However, at pH 2, lower overall intensity of the CD bands and the smaller excitonic couplet at ≈240 nm suggested that the assembly process was inhibited, producing partial aggregates with opposite M-type NDI helicity (Fig. 9B). The binding of Cu2+ at pH 7 is monitored by UV-Vis and forms a 1![[thin space (1/6-em)]](https://www.rsc.org/images/entities/char_2009.gif) :
:![[thin space (1/6-em)]](https://www.rsc.org/images/entities/char_2009.gif) 1 complex with an association constant of 2.07 × 10⁴ M−1. The binding and morphological change is further confirmed by a change in shape of the CD spectrum for 10 after the addition of Cu2+ ions.
1 complex with an association constant of 2.07 × 10⁴ M−1. The binding and morphological change is further confirmed by a change in shape of the CD spectrum for 10 after the addition of Cu2+ ions.
The CD spectrum of 10-Cu also shows cotton effects in the 300–400 nm range, but the shape of the transitions in the 225–275 nm and 320–400 nm regions were completely different when compared to 10 only. The excitonic couplet at 240 nm for 10-Cu resembles negative chirality, with M-type NDI packing. These CD studies indicate different intermolecular monomer packing orientation of both 10, and 10-Cu (Fig. 9C). This case study demonstrates that CD spectroscopy provides a powerful tool to reveal the molecular packing in the chiral supramolecular aggregates.
Summary
The main advantages of AUC to study polymeric metallo-supramolecular assemblies involves the determination of absolute molar mass and dH of aggregated species. A large range of molar masses can be analysed (from hundreds up to several million g mol−1) using AUC in these weakly linked assemblies. Other methods, such as size exclusion chromatography or electrophoresis, are susceptible to errors caused by interactions with the matrix. In addition, mass spectrometry, though very accurate, does not normally preserve subunit interactions. CD is an important spectroscopic technique which is used not only to study the chirality in self-assembled aggregates in solution, but also to monitor the dynamic behaviour of different structural states upon exposure to external stimuli, such as addition of metal ions, anions, temperature, pH, and solvents. Another powerful technique to resolve chirality is X-ray structural analysis, but this requires the formation of crystals. Amphiphilic systems typically do not crystallise therefore they are often not suitable for this methodology.
Limitations
A major disadvantage of AUC is the high cost of the device. Various methods such as Lamm equation fitting, van Holde–Weischet function and Gosting Fujita Lechner (GFL) principle are used to analyse these data. Each method is based on different algorithms and noise handling, and therefore can result in differences in data interpretation.94 CD in chiral molecules is a relatively small effect (due to their small size relative to the wavelength) so does not provide atomic-level structural analysis. Therefore, CD is usually measured on macroscopic amounts of material in solution to get sufficient data. These ensemble-averaged measurements usually mask the sensitivity of CD to small structural variations between individual particles, or to the possible co-existence of opposite enantiomers in a system.
2.6 Critical aggregate concentration (CAC) determination
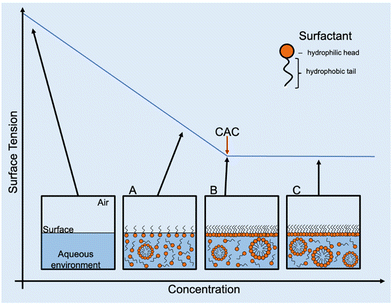
As previously described in the introduction, amphiphiles (including supramolecular amphiphiles) possess the ability to self-assemble into a variety of structures when in solution including, but not limited to, micelles, vesicles, nanotubes, bilayers, tubules, or reverse micelles.1 At low concentrations, a dynamic equilibrium occurs where amphiphiles either aggregate into higher-order morphologies or adsorb at the surface interface of the solution, affecting the surface tension. Increasing amphiphile concentration increases adsorption until the surface is fully saturated and there is no longer an effect on surface tension. This concentration is defined as the CAC.1,95 Once CAC is reached, any further increase in amphiphile concentration results in the continuous formation of the self-assembled morphologies in the bulk of the solution (Fig. 10). As the most documented morphology is the micelle, CAC is often referred to as CMC. However, depending on the chemical structure of and the environment the amphiphile is in, the type of morphology formed can differ. For this reason, the term CAC is used instead, unless the exact morphologies present in solution can be ascertained.An alternative method to measure surface tension is the pendant drop method, which involves optically analysing the curvature or contour of a liquid drop and fitting the measured contour to one calculated using the Young–Laplace equation.97,98 While this method is comparatively simple, requires less sample than others, and produces results that are easier to interpret, the main limitation is the lack of control over environmental temperature, which can affect CAC and thus distort any results obtained.97,99
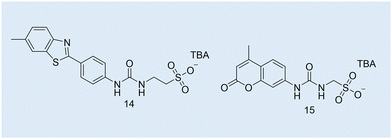 | ||
| Fig. 12 Chemical structures of SSAs 14 and 15 used to develop the CAC OD-based microplate methodology. TBA = tetrabutylammonium. | ||
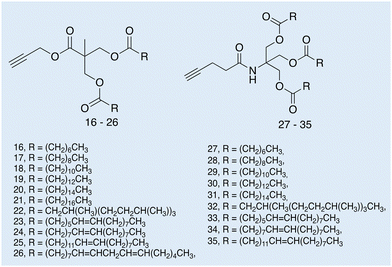 | ||
| Fig. 13 Structures of amphiphiles 16–35 synthesised by Feast and co-workers. Reproduced/adapted from ref. 115 with permission from Beilstein Journal of Organic Chemistry. | ||
Case study 6a. Hiscock and co-workers built on existing OD-based methodologies and presented a new method to obtain the CAC of four SSAs (Fig. 3–5; Fig. 12, 14 and 15) over a range of temperatures.108 After first estimating CAC using the pendant drop method at ≈291–298 K, Hiscock and co-workers then ran a series of OD microplate well scans at increasing concentrations and temperatures, and in triplicate to ensure the validity and reproducibility of any data obtained. It was found that CAC values calculated using the OD method were lower than those calculated using the pendant drop method, as shown in Table 3. However, it was hypothesised that the difference in CAC values may have arisen due to a second phase of self-association events, potentially enabling the definition of the three different phases of CAC determination as outlined in Fig. 11.
 | ||
| Fig. 15 Fluorescent microscopy images of self-associated fibres formed from (A) 4, (B) 14 and (C) 36 (5 mg mL−1) in and aqueous solution of Na2SO4 at 0.505 M. Scale bar A = 120 μm, B and C = 20 μm. Reproduced/adapted from ref. 5 with permission from RSC Journal of Material Chemistry B. | ||
| SSA | CAC (mM) | |||
|---|---|---|---|---|
| OD microplate method | Pendant drop method | |||
| 298 K | 308 K | 318 K | RT | |
| 4 | 0.41 | 0.46 | 0.48 | 0.50 |
| 5 | 8.91 | 8.69 | 7.99 | 9.54 |
| 14 | 1.51 | 1.49 | 1.37 | 1.92 |
| 15 | 14.86 | 19.64 | 14.42 | 16.20 |
Summary
This work demonstrates how determination of CAC is useful in understanding the self-associative abilities of supramolecular amphiphiles. This array of non-destructive, reliable, and accessible techniques allows the observation of properties directly linked to self-association events and CAC.
Limitations
Excluding OD, the techniques discussed within have many limitations including a lack of environmental control, contamination, requirement for a large quantity of samples, and the use of chemical probes. The use of microplates made of particular materials and/or solvents with curved surfaces reduce the sensitivity of OD measurements obtained.
2.7 Microscopy
Microscopy methods can either be destructive or non-destructive, and can be used to evaluate samples in varying states and environments.109 The following subsections evaluate the use of these different microscopy methods for use in the characterisation of supramolecular amphiphile systems.This was achieved by elucidating the thermotropic liquid-crystalline (LC) behaviour towards the development of specific LC phases. The LC phases were observed through PLM with the images showing the differences in structure across samples of varying functional group composition. This work aims to highlight the importance of the spatial arrangements of functional chemical groups when designing amphiphiles with novel uses and applications.
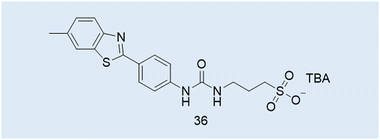
Case Study 7a. Here we highlight the potential use of this technique for the characterisation of supramolecular amphiphile systems, through the following work of Hiscock and co-workers, specifically relating to intrinsically fluorescent SSAs such as 4, 14 and 36 (Fig. 3 and 4; Fig. 12 and 14; Fig. 14, 36). The only difference between these structures being the length of the alkyl spacer between the urea and sulfonate functionalities (4 = methyl, 14 = ethyl, 36 = propyl).5
Due to the intrinsic fluorescence properties of 4, resulting from the incorporation of the benzothiazole moiety within the anionic component of this amphiphilic salt, systems incorporating 4 were studied through the use of fluorescence spectroscopy.117 Here noticeable changes in excitation and emission properties were observed as the self-assembled structures present altered upon changes in temperature. Due to the intrinsic fluorescence properties demonstrated by this sub-class of benzothiazole incorporated SSA, fluorescence microscopy was not only used to provide insight into the mode of therapeutic action for this class of compounds, but also to study changes in the morphology of those self-assembled structures produced in different solvent environments.2,37,117 For example, members from this benzothiazole appended sub-class of SSAs have been shown to morph from spherical aggregate to gel fibre under aqueous conditions, upon the addition of salt and a subsequent annealing process, enabling real-time observation of those structures formed.111 In addition, and as highlighted in Fig. 15, this also enabled SSA – self-associated structure property analysis. Here the changes in the morphology of those fibres formed, through a stepwise change in SSA (the addition of one CH2) could clearly be observed without the removal of solvent.5
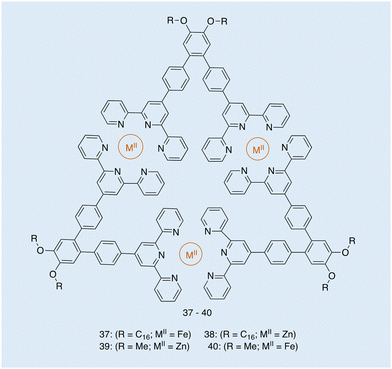 | ||
| Fig. 16 Structure of metallotriangles 37–40, synthesised by Ludlow and co-workers. Reproduced/adapted from ref. 119 with permission from Taylor and Francis Supramolecular Chemistry. | ||
From the images obtained, the authors of this work were able to evaluate the extent to which the metal type and the R groups of varying amphiphilicity affected the morphology of these metallotriangles. TEM shows the structural differences to be dependent on the amphiphilic nature of the molecule and the self-assembly around metals of different lability.119
The biggest disadvantage of SEM is that this technique only allows for observation of the surface of a molecule. This can be overcome by employing the technique of focused ion beam-SEM (FIB-SEM). The FIB removes the surface layer of the structure before another image is taken. This process is continuously repeated until a 3D image is formed.125
Case study 7b. Cano and co-workers have synthesised a series of molecules containing polar lactic acid head groups and lauric acid tails joined through a linker, Fig. 17.123 These molecules have hydrogen bond-directing groups that support molecular self-assembly, resulting in the formation of flexible fibres, that when entangled, form a 3D network, resulting in the production of a material which demonstrates viscoelastic properties. Cano and co-workers analysed the morphology of the hydrogels formed using SEM and environmental-SEM. The data obtained show entangled nanofibers that form a dense 3D network. The morphologies of these networks produced through the self-assembly of 41 and 42, were analysed and show fibrils produced from 41 are larger than those produced from 42, attributed to the aggregation of the assemblies caused by solvent evaporation.
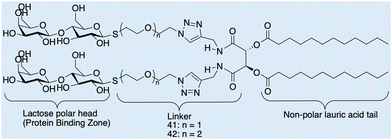 | ||
| Fig. 17 Chemical structures of lactose and lauric acid-based 41 and 42, observed by Cano and co-workers through SEM and E-SEM. Reproduced/adapted from ref. 123 with permission from RSC New Journal Of Chemistry. | ||
In SPA cryo-EM, a single 3D reconstruction is obtained by combining TEM images of the sample in different orientations. This reconstruction is normally the result of thousands of separate TEM images and 2D projections that are then re-constructed into a 3D image through Fourier inversion.127 Since its development, SPA cryo-EM has been used extensively to observe assembled amphiphiles, most commonly proteins, in a near in situ state.128–131 However in contrast, cryo-ET uses a series of images taken at different tilt angles that when combined computationally produce a 3D sample image.126 Cryo-ET with nanometre detail has been used to visualise the complex aggregation of amphiphilic copolymers.132
Summary
Similar to other methods presented in this review, each microscopy technique commonly used for the characterisation of supramolecular amphiphiles has different advantages and disadvantages, most notably different structural observations in different physical states. As such, these techniques are best used in tandem to give a full picture of any self-assembled structures present.
Limitations
AFM: Destructive technique.
PLM: Lower resolution, surface technique.
Fluorescence microscopy: Relies on the use of fluorescent tags or fluorophores within the molecule.
TEM: Destructive technique and problems of radiation damage to sample.
SEM: Disadvantages: surface structure only, 2D images and risk of radiation damage to sample.
Cryo-EM: Cannot be used for thermo-reversible samples and is a highly costly, lengthy process with lower availability compared to other microscopy techniques.
2.8 Working with supramolecular amphiphiles in a biological setting
Supramolecular amphiphiles are gaining interest for translation into a clinical setting. For example, SSAs have been shown to exhibit a “druggable” profile,3 improve the efficacy of existing drugs including anticancer agents2,3 and antimicrobials.3 Amphiphilic systems are ideal candidates for development as drug delivery systems, acting as carriers for poorly soluble therapeutic agents, in addition to offering modified release profiles for encapsulated molecules.4 However, the desired characteristics for lead candidates in drug development133 also apply to supramolecular amphiphiles. Prior to the commencement of in vitro (with cells outside a living organism) or in vivo (within a living organism) work, key factors include determining the purity, stability, and solubility of the amphiphile in question. Amphiphile purity is necessary to accurately determine if any biological activity/unwanted effects are unambiguously because of the amphiphile,133 with a desired purity ≥95% for biological testing.134 Supramolecular amphiphiles for use in a biomedical application must be water soluble, as otherwise they are incompatible with any biological system.135,136 There are structural components that can increase the water solubility of an amphiphile, such as inclusion of a carbohydrate,137 use of bola amphiphiles,1 and the addition of polyethylene glycol to the amphiphile system.138In addition, amphiphile monomers or aggregates that interact with components of biological fluid will influence the supramolecular and covalent stabilities, and thus functionality of the amphiphile.4 Stability should be assessed in simulated in vivo medias (e.g. mock serum, simulated intestinal fluid) and results used to guide structural modification, diagnose poor oral bioavailability, prioritize chemical series, and evaluate formulations for improving stability.139 Stability strategies have been discussed by Lu and co-workers,140 and stability assessments in biological media have been discussed by Feiner-Gracia and co-workers,4 with other key introductory texts referenced here.133,134,141
Other in vivo physiological factors that will influence aggregates include pH (optimum pH 7.4),144 temperature, salinity of blood/tissue fluid,117 shear flow of blood,145,146 and light (UV is commonly used but toxic to living cells).135,147
Physical factors of the aggregate that can influence the pharmacokinetics of supramolecular amphiphiles include the size and shape of the aggregate, charge distribution, the lipid solubility, and the extent of water-solubility, as these will influence circulation time and transport in vivo.148 An optimal supramolecular structure would possess an elongated shape with a size range of 12–50 nm and be neutral/not charged to achieve optimum vascular and interstitial transport and cellular uptake.148 Lipinski's ‘rule of 5’ also present structural characteristics that will affect the pharmacokinetic/dynamic profile.149
Case study 8a. As described, there are several in vivo characteristics that will interfere with amphiphiles, however, these parameters offer potential tunability to amphiphile activity. Cancer cells have a lower mitochondrial membrane potential than normal cells (−180–−220 and −120–−160 mV respectively)150 and dysfunctional mitochondria with a disrupted proton gradient and a more negatively charged membrane.151 Jeena and co-workers sought to design a positively charged lipophilic peptide amphiphile L-Mito-FFY (43Fig. 18A) that would preferentially accumulate in the mitochondrial matrix of cancer cells, due to the addition of the delocalised lipophilic cation triphenylphosphonium (TPP), and self-assemble into a fibrous structure inside the mitochondria.152 This would both address the issue of undesirable activity at healthy cells, as well as overcome potential problems with aggregate stability in the plasma.4In vitro work found 44 had a 10-fold greater accumulation in cancerous cell mitochondria than healthy cell lines, causing significantly more mitochondrial dysfunction in these diseased cells.153,154
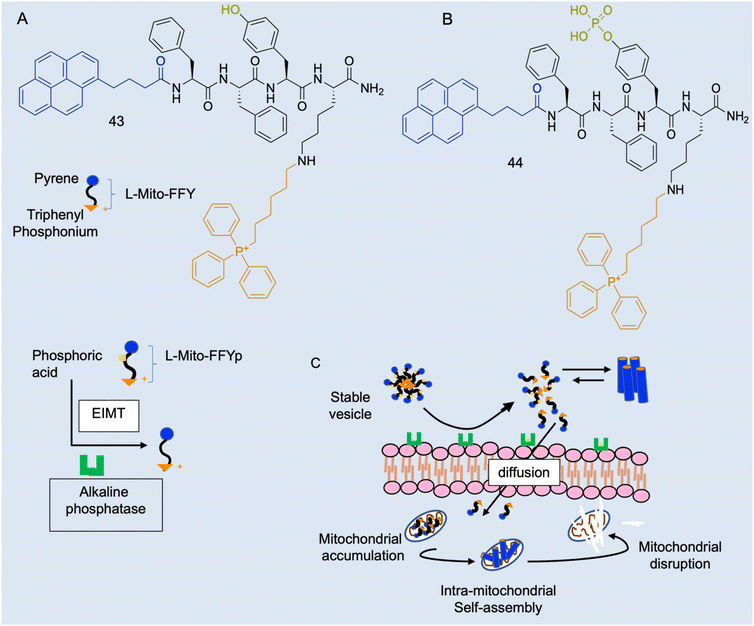 | ||
| Fig. 18 Schematic illustration of the enzyme-instructed morphology transformation (EIMT) of an ALP-responsive micelle. (A) Chemical structure L-Mito-FFY 43. (B) Chemical structure of L-Mito-FFYp 44 and schematic showing EIMT of 44 by alkaline phosphatase into 43. (C) Schematic showing in vivo alkaline phosphatase enzyme on osteosarcoma cell surface induces the transformation of 44 micelles to positively charged 43, which are attracted to the highly negative mitochondrial membrane and enter the cell via free diffusion to target the mitochondria via the TPP moiety. Inside the mitochondria, 43 passes the CAC and self-assembles into nanofibers to induce mitochondrial dysfunction leading to cell death. Reproduced/adapted with permission from RSC Chemical Biology.154 | ||
The subsequent in vivo work found that, whilst 43 was not as efficacious as in vitro, combination therapy of 43 with fluorouracil significantly reduced gastric tumour volume and increased apoptosis, more than monotherapy, resulting in these agents synergistically enhancing reactive oxygen species.153 However, a positive molecule has potential undesirable interactions with negatively charged serum molecules and serum proteins in vivo. Osteosarcoma cells overexpress alkaline phosphatase (ALP), so 43 was developed into L-Mito-FFYp (Fig. 18B, 44), which forms physiologically stable micelles with a negatively charged surface and carries ALP substrate phosphoric acid.154 When in proximity to the ALP-overexpressing cells or osteosarcoma cancer cells, these micelles disassemble in response to the excessive ALP becoming the positively charged 43 peptide monomer, and subsequently diffuse through negatively charged cell membranes and self-assemble as shown in Fig. 18C.
Summary
Supramolecular amphiphiles enable targeted “smart” drug design. However, any resultant aggregated structures produced must still exhibit a desirable selectivity profile, permeability, stability, and biological potency in order to be considered “druggable” agents. Consequently, this case study illustrates how to work with and adapt supramolecular amphiphiles in a biological setting to achieve this.
Limitations
The unique behavior of supramolecular amphiphiles offers promising avenues for targeted drug design and novel therapeutics, but there are limitations to consider. If CAC is high, upon dilution in the blood, aggregates can release their drug cargo early,155 however, low CAC may also correlate with toxicity of the amphiphile.156 Aggregates can have limited loading capacity (<5% w/w) with pharmaceutically acceptable excipients limiting potential use as drug delivery systems.157 Whilst supramolecular amphiphiles offer the means for targeted drug design, these systems are not broadly applicable across multiple diseases, and it is difficult to predict and control the molecular assembly dictated.158 Unless multi-component amphiphile systems are used, the structures they form are homotypic and thus have limited functional complexity and tunability once aggregated.159
2.9 Free online in silico tools for molecular physicochemical and ADME predictions
Drug discovery and material scientists use in silico (experimentation conducted by computer modelling or simulation) programs to predict the physicochemical and ADME (absorption, distribution, metabolism, and excretion) properties of molecular targets, to influence design and enhance properties relevant for specific applications, thus reducing synthetic liabilities, and improving safety profiles. This is particularly important for those with limited physical resources.160Free online in silico physicochemical and ADME prediction tools are valuable resources for drug design and material development, for several reasons: cost-effective – no need for expensive software; accessible to a wide range of researchers with a user-friendly interface and no need for pharmacokinetic expertise; rapid screening – efficient evaluation of multiple compounds, saving time; predictive accuracy – these established computational models and databases use experimental data validation – aiding selection of drug and material candidates; and in silico optimisation – this allows for prediction of potential issues of drugs and materials at various stages of development and earlier improvement. However, there are limitations to this technique: confidentiality of data is not guaranteed; no servers will cover all the parameters you need; calculation methods can change – this will need to be evaluated with usage; and variability between free tools due to differences in algorithms, models, or data sources and limited data on the applicability of certain types of amphiphiles. Due to these limitations, the use of these tools should only aid investigations into the viability and development of a potential drug or material, whilst supporting the experimental evaluation.
Several comprehensive reviews have been published, detailing free online pharmacochemical and ADME servers, as well as directory links for those tools and databases.161–165 The free software programs predict a variety of properties: log![[thin space (1/6-em)]](https://www.rsc.org/images/entities/char_2009.gif) S (aqueous solubility), log
S (aqueous solubility), log![[thin space (1/6-em)]](https://www.rsc.org/images/entities/char_2009.gif) P (octanol–water coefficient), log
P (octanol–water coefficient), log![[thin space (1/6-em)]](https://www.rsc.org/images/entities/char_2009.gif) D (octanol–water distribution coefficient), TPSA (total polar surface area), HIA (human intestinal absorption), Caco-2 (human colon adenocarcinoma cell line; to understand the permeation of membranes), PPB (plasma protein binding), BBB (blood brain barrier penetration), Vd (volume of distribution; the ability of a drug to diffuse to several tissues from the blood flow), metabolism, CL (clearance), toxicity, P-gP (P-glycoprotein) and pKa (acidity coefficient). Currently, there are three ADME software programs that include drug-likeness data: SwissADME,166 ADMETlab167/ADMETlab2.0,168 and FAF-Drugs4169 using e.g., Lipinski, Veber, Egan, Ghose, Muegge, Oprea, Varma, GSK's 4/400, and Pfizer's 3/75 rules.161–165
D (octanol–water distribution coefficient), TPSA (total polar surface area), HIA (human intestinal absorption), Caco-2 (human colon adenocarcinoma cell line; to understand the permeation of membranes), PPB (plasma protein binding), BBB (blood brain barrier penetration), Vd (volume of distribution; the ability of a drug to diffuse to several tissues from the blood flow), metabolism, CL (clearance), toxicity, P-gP (P-glycoprotein) and pKa (acidity coefficient). Currently, there are three ADME software programs that include drug-likeness data: SwissADME,166 ADMETlab167/ADMETlab2.0,168 and FAF-Drugs4169 using e.g., Lipinski, Veber, Egan, Ghose, Muegge, Oprea, Varma, GSK's 4/400, and Pfizer's 3/75 rules.161–165
Case study 9a. Scognamiglio and co-workers illustrated the self-assembly of the thyminyl L-tryptophanamide (TrpT) construct (Fig. 19A) into supramolecular networks and detailed its potential as a drug delivery nanosystem.170 The nanoaggregates formed in aqueous solution (Fig. 19B and C), are characterised using some techniques discussed in this tutorial review: DLS, CD, fluorescence or UV-Vis spectroscopic measurements, and SEM.
 | ||
| Fig. 19 (A) TrpT, 45. (B) and (C) Morphology of TrpT self-assembly in aqueous media (SEM analysis). D) Curcumin encapsulated (green) by TrpT nanovesicles (confocal microscopy analysis). Reproduced/adapted from ref. 170 with the permission of Creative Comms Attribution 4.0 International License (https://creativecommons.org/licenses/by/4.0/). | ||
The researchers demonstrated that the TrpT nanostructure encapsulated the physicochemical suboptimal curcumin (Fig. 19D).
Inputting the structure of TrpT into the SwissADME server, generated a unique simplified molecular input line entry system (SMILES), which is a fingerprint code for a particular chemical structure. The SMILES string enabled the predicted physicochemical and ADME data of 45 – Fig. 20 is the SwissADME pictorial layout of the predicted data.
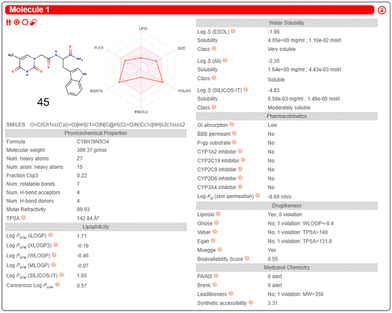 | ||
| Fig. 20 SwissADME free online server generation of physicochemical and ADME properties of 45. This diagram illustrates an example presentation of the SwissADME data layout after input of a molecular structure or SMILES string. Reproduced/adapted from ref. 166 with the permission of Creative Comms Attribution 4.0 International License (https://creativecommons.org/licenses/by/4.0/). | ||
The authors hypothesised that the Trp-T-curcumin adduct increased the polarity of curcumin to become more drug-like, supported by the idea that the optimum drug-like range for good cell permeability is 0 < log![[thin space (1/6-em)]](https://www.rsc.org/images/entities/char_2009.gif) P < 3. The predicted ADMETlab log
P < 3. The predicted ADMETlab log![[thin space (1/6-em)]](https://www.rsc.org/images/entities/char_2009.gif) P of free curcumin is 3.4, while the predicted ADMETlab log
P of free curcumin is 3.4, while the predicted ADMETlab log![[thin space (1/6-em)]](https://www.rsc.org/images/entities/char_2009.gif) P of the Trp-T-curcumin adduct is 3.1, potentially making the Trp-T-curcumin adduct more bioavailable than the free curcumin.
P of the Trp-T-curcumin adduct is 3.1, potentially making the Trp-T-curcumin adduct more bioavailable than the free curcumin.
Case study 9b. Hiscock and co-workers determined the druggable potential of selective antimicrobial SSAs through in vitro and in vivo DMPK (drug, metabolism, and pharmacokinetic) studies.3 Based on the experimental DMPK data, SSA 5 (Fig. 3 and Fig. 21A) was determined as the lead compound suitable for further therapeutic drug development.
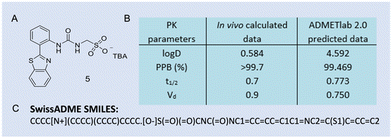 | ||
Fig. 21 (A) The structure of 5, TBA = tetrabutylammonium. B) Table of in vivo data (mouse blood PK studies, n = 3, intravenous route, and dose of 1 mg kg−1) versus in silico generated data for 5. log![[thin space (1/6-em)]](https://www.rsc.org/images/entities/char_2009.gif) D = log D = log![[thin space (1/6-em)]](https://www.rsc.org/images/entities/char_2009.gif) P at physiological pH, PPB (%), t1/2 (h) = elimination half-life = the time required for plasma concentration of a drug to decrease by 50%, and Vd (L kg−1) = apparent volume of distribution = total amount of drug in the body/drug concentration in plasma. 3C) SwissADME SMILES string of 5 and is reproduced from ref. 166 with the permission of Creative Comms Attribution 4.0 International License (https://creativecommons.org/licenses/by/4.0/). P at physiological pH, PPB (%), t1/2 (h) = elimination half-life = the time required for plasma concentration of a drug to decrease by 50%, and Vd (L kg−1) = apparent volume of distribution = total amount of drug in the body/drug concentration in plasma. 3C) SwissADME SMILES string of 5 and is reproduced from ref. 166 with the permission of Creative Comms Attribution 4.0 International License (https://creativecommons.org/licenses/by/4.0/). | ||
To validate the comparative accuracy of different parameters of the in silico data versus the in vivo data, and for the purpose of this review, the SwissADME SMILES string for 5 is shown in Fig. 21C, and this enabled the generation of the ADMETlab 2.0, log![[thin space (1/6-em)]](https://www.rsc.org/images/entities/char_2009.gif) D, PPB, t1/2, and Vd data. The results show that, whilst in vivo log
D, PPB, t1/2, and Vd data. The results show that, whilst in vivo log![[thin space (1/6-em)]](https://www.rsc.org/images/entities/char_2009.gif) D versus ADMETlab 2.0 log
D versus ADMETlab 2.0 log![[thin space (1/6-em)]](https://www.rsc.org/images/entities/char_2009.gif) D is different, in silico PPB, t1/2 and Vd are a good indication of how SSA 5 behaved in vivo.
D is different, in silico PPB, t1/2 and Vd are a good indication of how SSA 5 behaved in vivo.
Both case studies highlight the limitations of using SMILES to generate physicochemical and ADME data using the free software. The use of SMILES strings does not consider the non-covalent interactions of these supramolecular amphiphiles, therefore, researchers potentially need to use the closest predicted structures using covalent bonds to support hypotheses.
Encouragingly, steps are in progress to overcome these SMILES limitations for the in silico prediction of supramolecular drug-like compounds. Recently, Olsen and co-workers published BigSMILES, an annotation method that is an extension of, and compatible with SMILES, which shows potential to understand non-covalent bonds in supramolecular assemblies.171 Each type of interaction in supramolecular assemblies have their own annotation (Fig. 22); this has the capability to add non-covalent bonds to even smaller molecules than exemplified within this work. Additionally, this software has the potential for use in other computational programs to determine physicochemical and ADME properties of supramolecular molecules, including supramolecular amphiphiles.
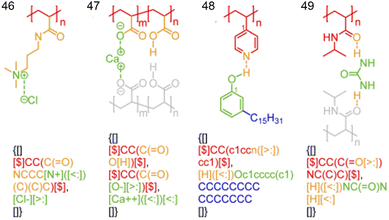 | ||
| Fig. 22 Chemical structures of 46–49 showing non-covalent bond annotation in typical polyelectrolytes and hydrogen bonding polymers. The colours of the bonds and atoms in the diagram correspond to the identical colour of the BigSMILES string (faded grey components not included). Reproduced/adapted from ref. 171 with the permission of the RSC Chemical Science. | ||
Summary
SwissADME and ADMETlabs are useful in silico tools that generate physicochemical and ADME predictions for supramolecular amphiphiles. They are accessible, cost-effective and enable rapid screening of multiple molecules in a time efficient manner. This allows for some predictive accuracy and in silico optimisation of lead compounds to help mitigate problems arising in development of molecular targets.
Limitations
There is a variation between parameters for free online physicochemical and ADME predictive tools, and calculation methods may change over time for each program. There is variability between each program, in terms of how the data is generated, and confidentiality of data is not always guaranteed. The biggest limitation for supramolecular amphiphiles is that current online in silico predictions are not capable of incorporating non-covalent interactions in their calculations. Free online in silico generated data should be used cautiously to aid molecular design, and in conjunction with experimental data to help optimise drug-like or material leads.
2.10 Quantitative structural activity relationship (QSAR) and other computational techniques
QSAR methods are a growing and developing field that was initiated in the 1960s,172 and are used to predict a target property using structural chemical features,173 such as SwissADME descriptors. The model adjusts the weighting of the features to accurately predict the target values from the dataset. The models are trained on a high percentage (often ≈ 80%) of the data, known as the training set, here the model fits to the data and the model's weights are set. To validate the model's accuracy, a small subset of the data (≈20%) is withheld when the model is trained. The model takes in the features of this unseen subset of data and scores the model for accuracy based on the differences between the predicted and the actual target values.QSAR methods are only as good as the data they are trained on; the datasets used within many computational predictive studies for amphiphilic compounds. For example, CAC has been shown as a relevant property for MIC (minimum inhibitory concentrations (MIC) is defined as the lowest concentration of an antimicrobial that will inhibit the visible in vitro growth of a bacteria when compared to a control) prediction via computational method models and the obvious relevance to real-world applications in drug discovery.34 CAC predictions are usually small (<100 molecules) to ensure data can be validated. These datasets often focus on subsets of amphiphiles with similar structures.34,174,175 Features are specifically chosen to model each type of amphiphile resulting in QSAR models that are specific to the subset of amphiphiles the model is trained on.
Features for the QSAR models can either be generated computationally, or experimentally derived. Experimentally derived descriptors are less widely used in modelling due to the time taken to synthesise the molecule, run physicochemical experiments, and grow bacteria or cells (if the experiment is an assay). This makes these descriptors – which in some cases are the target of the model – very condition/run dependent with high experimental error. On the other hand, computationally derived descriptors have the advantage of being easily generated from widely available software libraries and packages such as RDKit176 or SwissADME.166 This allows the models to be used to predict the desired properties before the lead molecules are synthesised, aiding in the decision process, as shown in Fig. 23. The molecular representations are generated from the SMILES containing information about molecule connectivity, charge, and atom coordinates/properties. From this file, an image of the molecule can be generated, and molecular descriptors are calculated.
 | ||
| Fig. 23 The generation of molecular descriptors from a SMILES string using the RDKit library.176 The figure depicts the anionic group from 3. | ||
Multi-linear regression (MLR) is the most widely applied QSAR model throughout literature for modelling CAC values due to its simplicity and effectiveness on small datasets.172,174,175 This model works by finding coefficients-feature pairs that best predict the target data which, in this case, is CAC. This is shown in eqn (1), where Y is the target data for the model to predict, X1 to Xn are the features used in the model, β1 to βn are the coefficients associated with each feature, and β0 is the correction factor.
| Y = β0 + β1X1 + β2X2 + … + βnXn | (1) |
ANN-MLPs can perform complex mathematical transformations on data using layered combinations of weights and biases. When this is used in combination with activation functions at each neuron, gives ANN-MLPs the ability to pick up non-linear trends within data. Despite their advantages, ANN-MLPs can be a difficult type of model to apply to QSAR modelling due to limitations in the size of the datasets available, as these models are data greedy.
Case study 10a. Rahal and co-workers applied three models: MLR, partial least square, and MLP-ANN, to a small dataset of 50 anionic surfactants, which have diversity in counter cation and anionic groups, variation in branching, and length of hydrophobic chain.172 This dataset was taken from three sources within literature, and all were recorded as being measured at 25 °C in purified H2O only. Finally −log10CAC was calculated to a normalised data spread and constant error over the entire data range.
The authors calculated 11![[thin space (1/6-em)]](https://www.rsc.org/images/entities/char_2009.gif) 145 computational descriptors from the SMILES and from these, seven descriptors were selected. Several models were trained using 2 to 7 of these descriptors and statistical parameters were used to compare the accuracy of the model as the number of features was increased from 2 to 7. Four descriptors was the point at which adding additional descriptors no longer significantly improved the model's prediction. The selected descriptors were ATSC7v, ATSC5e, nAtomLAC and ETA_Epsilon_3 which, though calculated based on the structure of the molecule, are not as explainable as descriptors shown in case study 10b. The data they used fits within their chemical applicability domain- the structures and mechanisms of action that the QSAR models can reliably predict- of anionic surfactants and outlines the risks of extrapolating beyond the data used to train the model.
145 computational descriptors from the SMILES and from these, seven descriptors were selected. Several models were trained using 2 to 7 of these descriptors and statistical parameters were used to compare the accuracy of the model as the number of features was increased from 2 to 7. Four descriptors was the point at which adding additional descriptors no longer significantly improved the model's prediction. The selected descriptors were ATSC7v, ATSC5e, nAtomLAC and ETA_Epsilon_3 which, though calculated based on the structure of the molecule, are not as explainable as descriptors shown in case study 10b. The data they used fits within their chemical applicability domain- the structures and mechanisms of action that the QSAR models can reliably predict- of anionic surfactants and outlines the risks of extrapolating beyond the data used to train the model.
The authors evaluated modelling from six other research papers highlighting only one of these examples included a test set for external validation of the models. This may be due to the small dataset sizes used for these projects where the selection of the test/training subsets can impact model performance. However, a lack of external validation can lead to overfitting of the models not being picked up, making them potentially not generalisable even within their applicability domain. It was concluded that the descriptors used for the model encompassed information about the hydrophobic chain length and electronegativity of the molecules, which were linked to the process of micelle formation. Of the three models, the MLP-ANN was concluded to be the most effective with the highest-scoring statistical parameters.
Case study 10b. It is important to note that physical properties of supramolecular amphiphiles can also be predicted using molecular dynamics (MD) simulations and density functional theory,177 however, when compared to small QSAR models, these methods are expensive in computational cost. Unlike traditional predictive models, MD does not rely on well-curated, validated and understood datasets.
The two methods can be used together as shown by Van Lommel and co-workers.178 MD simulations were used to generate four descriptors to encapsulate information about the nanostructure: hydrogen bonding percentage (HB%), relative end-to-end distance, and relative solvent accessible surface area (rSASA). HB% is defined as the percentage of donor and acceptor atoms with a distance between them of <3 Å averaged over the course of the simulation. These descriptors have direct chemical relevance, making models trained using them more interpretable.
Simulation time frames of 1 μs were tested to calculate the rSASA descriptor. The error on the average rSASA value across all time steps after 50 ns had an error of 13% when compared to the true value after 1 μs. Therefore, the simulation time used to generate all descriptors chosen by the authors was 50 ns as a trade-off between the accuracy of the generated descriptor, and computational resources.
The researchers used these descriptors to train QSAR models including an ANN and a decision tree model (that predicts its target using a flowchart-like algorithm) to predict whether a molecule would dissolve, precipitate, or form a gel in six different solvents on a dataset of 11 molecules, 1 test and 10 training. These models outperformed those using random descriptors, and the ANN had entropy R2 = 0.82 for the training set and R2 = 0.93 for the test set (where an ideal R2 = 1).
Summary
Applying QSAR methods to predict the properties of supramolecular amphiphiles is a growing and promising field. QSAR methods have the capability to predict properties before molecules are synthesised, and thus aid in the understanding of how to modify molecules to enhance specific properties. Using traditional QSAR modelling in conjunction with MD-generated descriptors allows the QSAR models to be trained on descriptors generated on the larger nanostructures of supramolecular amphiphiles, which increases the amount of information provided to the models for the supramolecular applicability domain as well as making the models more explainable.
Limitations
Caution must be taken in understanding the generalisability of models and accurately evaluating their performance and limitations, as well as the selection of models themselves. It is computationally expensive to generate descriptors using MD directly relevant to larger nanostructures. Models trained are often only effective within their applicability domain. The real limitation of QSAR modelling is data access and validity, due to the lack of consistency of assay/experimental data across groups due to experiments being carried out for different purposes. A large, curated repository of supramolecular experiments and data could allow for significant gains in understanding the physical properties and mechanisms behind the activity of supramolecular amphiphiles.
3. Conclusions
This review emphasises that within the field of supramolecular chemistry, there is no common standard or single tool for the comprehensive characterisation of supramolecular amphiphiles. When faced with this challenge, Hiscock and co-workers developed an effective multicomponent experimental approach for characterising these complex systems as outlined in Fig. 24.11,15,34,36,37,41,47,48,181,182 This extensive systematic approach combines multiple complimentary characterisation techniques in the solution- and solid-state, as well as in the gas-phase. Using this approach enables a comprehensive data set to be collected describing both the physiological and physicochemical properties of supramolecular amphiphiles. Many of the techniques that are detailed throughout this review are incorporated within the flow chart in Fig. 25, including NMR spectroscopy (Section 1); HRMS (Section 2); SC-XRD (Section 4); CAC (Section 6); microscopy (Section 7); biological analysis (Section 8); and in silico modelling (Section 9).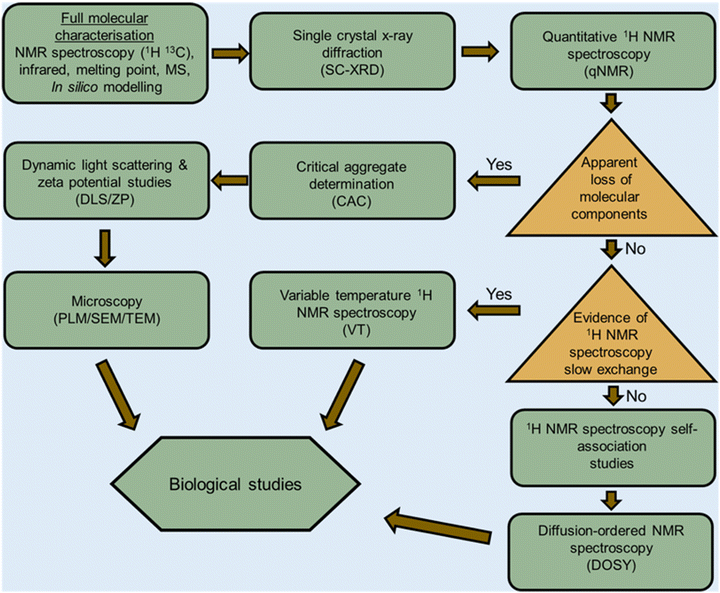 | ||
| Fig. 25 Systematic method for the characterisation of SSAs.11,15,34,36,37,41,47,48,181,182 Rectangle/hexagon = action; triangle = decision. Reproduced/adapted from ref.15 with permission from MDPI Molecules. | ||
This review has provided a substantial synopsis of identification, characterisation, and interactions of supramolecular amphiphiles using the most relevant techniques. An authoritative account of advantages and limitations of each method were discussed, and this detailed information was then supported by relevant case studies where suitable. The characterisation methods overviewed in this document are continually evolving, enabling improved analysis for these systems.
Each of these methods have their limitations which include, but are not limited to, physical state, sample size, and readily available information (software/knowledge). However, each independent method is a crucial piece of the puzzle towards the structural understanding of intra- or intermolecular interaction information, necessary for the characterisation of supramolecular amphiphilic systems. As such, each technique is best served as a key fragment used in conjunction with other techniques to give a full and comprehensive characterisation data set. It is our hope that this review both facilitates and inspires the analysis of supramolecular amphiphiles, and unlocks the limitless potential this sub-field of supramolecular chemistry has to offer to the wider scientific community.
Author contributions
TA, DEB, MKC, KLFH, OBK, RJL, CM, AO, PIAP, LRT, LJW: investigation; validation; writing – original draft, review & editing, CKH: reviewing; editing & supervision. JRH: conceptualization; funding acquisition; project administration; supervision; writing – original draft, review & editing.Conflicts of interest
There are no conflicts to declare.Acknowledgements
The authors would like to thank Mariam Yacoub for her contribution towards making this review visually inclusive. TA would like to thank Prof. Jeremy Frey (University of Southampton), Prof. J. Mark Sutton (UKHSA) for PhD funding and supervisory support. RJL would like to thank Prof. Claire Peppiatt-Wildman (University of Kent) for supervisory support. CM, PIAP, OBK and LRT would like to thank Prof. Michelle Garrett (University of Kent) for supervisory support. DB, KLFH, PIAP, AO, RJL, LRT and JRH would like to thank the University of Kent for funding. CM would like to thank the Jane Irons Scholarship for funding. OBK would like to thank the SoCoBio DTP for funding. LRT would like to thank the Daphne Jackson Trust, BBSRC, AstraZeneca, UKHSA and Cancer Research Horizons for funding and support. LJW and JRH would like to thank the UKRI (MR/T020415/1) for funding.References
- D. Lombardo, M. A. Kiselev, S. Magazù and P. Calandra, Adv. Condens. Matter Phys., 2015, 2015, 1–22 CrossRef.
- N. O. Dora, E. Blackburn, J. E. Boles, G. T. Williams, L. J. White, S. E. G. Turner, J. D. Hothersall, T. Askwith, J. A. Doolan, D. P. Mulvihill, M. D. Garrett and J. R. Hiscock, RSC Adv., 2021, 11, 14213–14217 RSC.
- J. E. Boles, C. Bennett, J. Baker, K. L. F. Hilton, H. A. Kotak, E. R. Clark, Y. Long, L. J. White, H. Y. Lai, C. K. Hind, J. M. Sutton, M. D. Garrett, A. Cheasty, J. L. Ortega-Roldan, M. Charles, C. J. E. Haynes and J. R. Hiscock, Chem. Sci., 2022, 13, 9761–9773 RSC.
- N. Feiner-Gracia, M. Buzhor, E. Fuentes, S. Pujals, R. J. Amir and L. Albertazzi, J. Am. Chem. Soc., 2017, 139, 16677–16687 CrossRef CAS PubMed.
- K. L. F. Hilton, A. A. Karamalegkos, N. Allen, L. Gwynne, B. Streather, L. J. White, K. B. Baker, S. A. Henry, G. T. Williams, H. J. Shepherd, M. Shepherd, C. K. Hind, M. J. Sutton, T. A. Jenkins, D. P. Mulvihill, J. M. A. Tullet, M. Ezcurra and J. R. Hiscock, J. Mater. Chem. B, 2023, 11, 3958–3968 RSC.
- S. Song, A. Song and J. Hao, RSC Adv., 2014, 4, 41864–41875 RSC.
- T. Guitton-Spassky, F. Junge, A. K. Singh, B. Schade, K. Achazi, M. Maglione, S. Sigrist, R. Rashmi and R. Haag, Nanoscale, 2023, 15, 7781–7791 RSC.
- L. Li, Z. Li, T. Balle, G. Liu and Z. Guo, Food Hydrocolloids, 2023, 139, 108574 CrossRef CAS.
- D. Schwiertz, R. Holm and M. Barz, Polym. J., 2020, 52, 119–132 CrossRef CAS.
- P. Groves, Polym. Chem., 2017, 8, 6700–6708 RSC.
- L. J. White, N. J. Wells, L. R. Blackholly, H. J. Shepherd, B. Wilson, G. P. Bustone, T. J. Runacres and J. R. Hiscock, Chem. Sci., 2017, 8, 7620–7630 RSC.
- K. Hussain, A. Jabbar, K. Ali Hasan, M. Ali, Z. Ul-Haq, M. R. Shah, S. Ahmad Khan, M. A. Rashid, M. Kazi and M. N. Abbas, Drug Delivery, 2023, 30, 2174205 CrossRef PubMed.
- T. Guitton-Spassky, F. Junge, A. K. Singh, B. Schade, K. Achazi, M. Maglione, S. Sigrist, R. Rashmi and R. Haag, Nanoscale, 2023, 15, 7781–7791 RSC.
- P. Singh, P. Sharma, N. Sharma and S. Kaur, J. Mater. Chem. B, 2021, 10, 107–119 RSC.
- L. J. White, J. E. Boles, K. L. F. Hilton, R. J. Ellaby and J. R. Hiscock, Molecules, 2020, 25, 4126 CrossRef CAS PubMed.
- A. M. Peterson, Z. Tan, E. M. Kimbrough and J. M. Heemstra, Anal. Methods, 2015, 7, 6877–6882 RSC.
- J. W. Steed, D. R. Turner and K. J. Wallace, Core Concepts in Supramolecular Chemistry and Nanochemistry, John Wiley & Sons, Hoboken, 1st edn, 2007 Search PubMed.
- J.-M. Lehn, Chem. Soc. Rev., 2007, 36, 151–160 RSC.
- X. Zhang and C. Wang, Chem. Soc. Rev., 2011, 40, 94–101 RSC.
- J. Liu, M. Morikawa and N. Kimizuka, J. Am. Chem. Soc., 2011, 133, 17370–17374 CrossRef CAS PubMed.
- G. Schwarz, Y. Bodenthin, Z. Tomkowicz, W. Haase, T. Geue, J. Kohlbrecher, U. Pietsch and D. G. Kurth, J. Am. Chem. Soc., 2011, 133, 547–558 CrossRef CAS PubMed.
- B. Reif, S. E. Ashbrook, L. Emsley and M. Hong, Nat. Rev. Methods Primers, 2021, 1, 2 CrossRef CAS PubMed.
- R. W. Hooper, D. Sarkar and V. K. Michaelis, Curr. Opin. Colloid Interface Sci., 2022, 62, 101631 CrossRef CAS.
- W. P. Power, Annu. Rep. NMR Spectrosc., 2011, 72, 111–156 CrossRef CAS.
- M. Pellecchia, Chem. Biol., 2005, 12, 961–971 CrossRef CAS PubMed.
- M. Monduzzi and B. Lindman, Curr. Opin. Colloid Interface Sci., 2019, 44, 14–22 CrossRef CAS.
- M. P. Foster, C. A. McElroy and C. D. Amero, Biochemistry, 2007, 46, 331–340 CrossRef CAS PubMed.
- X. Liu, Q. Yu, A. Song, S. Dong and J. Hao, Curr. Opin. Colloid Interface Sci., 2020, 45, 14–27 CrossRef CAS.
- E. Bednarek, W. Bocian and K. Michalska, J. Pharm. Biomed. Anal., 2019, 169, 170–180 CrossRef CAS PubMed.
- A. Che, C. O. Zellman, D. Sarkar, S. Trudel-Lachance, J. Espejo, V. K. Michaelis, V. E. Williams and C.-C. Ling, J. Mater. Chem. C, 2023, 11, 4153–4163 RSC.
- T. Polenova, R. Gupta and A. Goldbourt, Anal. Chem., 2015, 87, 5458–5469 CrossRef CAS PubMed.
- P. C. A. van der Wel, Emerging Top. Life Sci., 2018, 2, 57–67 CrossRef CAS PubMed.
- M. Auger, Curr. Issues Mol. Biol., 2000, 2, 119–124 CAS.
- N. Allen, L. J. White, J. E. Boles, G. T. Williams, D. F. Chu, R. J. Ellaby, H. J. Shepherd, K. K. L. Ng, L. R. Blackholly, B. Wilson, D. P. Mulvihill and J. R. Hiscock, ChemMedChem, 2020, 15, 2193–2205 CrossRef CAS PubMed.
- J. Wang, X. Ding and X. Guo, Adv. Colloid Interface Sci., 2019, 269, 187–202 CrossRef CAS PubMed.
- A. Rutkauskaite, L. J. White, J. E. Boles, K. L. F. Hilton, M. Clifford, B. Patenall, B. R. Streather, D. P. Mulvihill, S. A. Henry, M. Shepherd, J. M. Sutton, C. K. Hind and J. R. Hiscock, Supramol. Chem., 2021, 33, 677–686 CrossRef CAS.
- J. E. Boles, G. T. Williams, N. Allen, L. J. White, K. L. F. Hilton, P. I. A. Popoola, D. P. Mulvihill and J. R. Hiscock, Adv. Ther., 2022, 5, 2200024 CrossRef CAS.
- P. Thordarson, Chem. Soc. Rev., 2011, 40, 1305–1323 RSC.
- L. K. S. von Krbek, C. A. Schalley and P. Thordarson, Chem. Soc. Rev., 2017, 46, 2622–2637 RSC.
- Supramolecular.org - Binding Constant Calculators | Supramolecular, https://app.supramolecular.org/bindfit/, [accessed 1 May 2023].
- L. R. Blackholly, H. J. Shepherd and J. R. Hiscock, CrystEngComm, 2016, 18, 7021–7028 RSC.
- R. B. Martin, Chem. Rev., 1996, 96, 3043–3064 CrossRef CAS PubMed.
- P. R. Stoesser and S. J. Gill, J. Phys. Chem., 1967, 71, 564–567 CrossRef CAS PubMed.
- N. Busschaert, C. Caltagirone, W. Van Rossom and P. A. Gale, Chem. Rev., 2015, 115, 8038–8155 CrossRef CAS PubMed.
- P. A. Gale and C. Caltagirone, Chem. Soc. Rev., 2015, 44, 4212–4227 RSC.
- C. M. C. Faustino, A. R. T. Calado and L. Garcia-Rio, J. Phys. Chem. B, 2009, 113, 977–982 CrossRef CAS PubMed.
- J. E. Boles, R. J. Ellaby, H. J. Shepherd and J. R. Hiscock, RSC Adv., 2021, 11, 9550–9556 RSC.
- L. J. White, S. N. Tyuleva, B. Wilson, H. J. Shepherd, K. K. L. Ng, S. J. Holder, E. R. Clark and J. R. Hiscock, Chem. – Eur. J., 2018, 24, 7761–7773 CrossRef CAS PubMed.
- M. A. Geer Wallace and J. P. McCord, Breathborne Biomarkers Hum, Elsevier, Volatilome, 2nd edn, 2020, pp. 253–270 Search PubMed.
- E. Geddes da Filicaia, R. P. Evershed and D. A. Peggie, Anal. Chim. Acta, 2023, 1246, 340575 CrossRef CAS PubMed.
- A. G. Cheetham, Y. Lin, R. Lin and H. Cui, Acta Pharmacol. Sin., 2017, 38, 874–884 CrossRef CAS PubMed.
- V. Burilov, D. Mironova, E. Sultanova, R. Garipova, V. Evtugyn, S. Solovieva and I. Antipin, Molecules, 2021, 26, 6864 CrossRef CAS PubMed.
- L. Polewski, A. Springer, K. Pagel and C. A. Schalley, Acc. Chem. Res., 2021, 54, 2445–2456 CrossRef CAS PubMed.
- H. Wang, C. Guo and X. Li, CCS Chem., 2022, 4, 785–808 CrossRef CAS.
- A. El-Aneed, A. Cohen and J. Banoub, Appl. Spectrosc. Rev., 2009, 44, 210–230 CrossRef CAS.
- E. A. Andreyko, P. L. Padnya and I. I. Stoikov, Colloids Surf., A, 2014, 454, 74–83 CrossRef CAS.
- Y. Shao, J. Chen, X.-K. Ren, X. Zhang, G.-Z. Yin, X. Li, J. Wang, C. Wesdemiotis, W.-B. Zhang, S. Yang, B. Sun and M. Zhu, Molecules, 2019, 24, 2114 CrossRef CAS PubMed.
- J. Mei, Y. Hong, J. W. Y. Lam, A. Qin, Y. Tang and B. Z. Tang, Adv. Mater., 2014, 26, 5429–5479 CrossRef CAS PubMed.
- S. Tencé-Girault, S. Lebreton, O. Bunau, P. Dang and F. Bargain, Crystals, 2019, 9, 271 CrossRef.
- J. Crawshaw, W. Bras, G. R. Mant and R. E. Cameron, J. Appl. Polym. Sci., 2002, 83, 1209–1218 CrossRef CAS.
- M. K. Pradhan, D. Gupta, K. R. Namdev, N. Anjali, C. Miglani, A. Pal and A. Srivastava, Nanoscale, 2022, 14, 15079–15090 RSC.
- D. A. Mannock, M. D. Collins, M. Kreichbaum, P. E. Harper, S. M. Gruner and R. N. McElhaney, Chem. Phys. Lipids, 2007, 148, 26–50 CrossRef CAS PubMed.
- M. C. Lin, C. H. Hsu, H. J. Sun, C. L. Wang, W. B. Zhang, Y. Li, H. L. Chen and S. Z. D. Cheng, Polymer, 2014, 55, 4514–4520 CrossRef CAS.
- H. J. Sun, Y. Tu, C. L. Wang, R. M. Van Horn, C. C. Tsai, M. J. Graham, B. Sun, B. Lotz, W. Bin Zhang and S. Z. D. Cheng, J. Mater. Chem., 2011, 21, 14240–14247 RSC.
- Y. Alqaheem and A. A. Alomair, Membranes, 2020, 10, 33 CrossRef CAS PubMed.
- B. Bhat, S. Pahari, S. Liu, Y. T. Lin, J. S. I. Kwon and M. Akbulut, Colloids Surf., A, 2022, 654, 130067 CrossRef CAS.
- A. S. Weingarten, R. V. Kazantsev, L. C. Palmer, D. J. Fairfield, A. R. Koltonow and S. I. Stupp, J. Am. Chem. Soc., 2015, 137, 15241–15246 CrossRef CAS PubMed.
- K. Hasegawa, Rigaku J., 2012, 28, 14–18 CAS.
- B. Dittrich, J. Lübben, S. Mebs, A. Wagner, P. Luger and R. Flaig, Chem. – Eur. J., 2017, 23, 4605–4614 CrossRef CAS PubMed.
- D. Ishii, T. Yamada, M. Nakagawa, T. Iyoda and H. Yoshida, J. Therm. Anal. Calorim., 2006, 86, 681–685 CrossRef CAS.
- T. W. Martin and Z. S. Derewenda, Nat. Struct. Mol. Biol., 1999, 6, 403–406 CrossRef CAS PubMed.
- A. Manikandan, M. Dhanalakshmi, L. Guganathan, T. Kokila, M. Santhamoorthy, R. Markkandan, S. C. Kim and C. Balakrishnan, J. Mol. Struct., 2022, 1254, 132395 CrossRef CAS.
- B. A. Nogueira, C. Castiglioni and R. Fausto, Commun. Chem., 2020, 3, 34 CrossRef PubMed.
- M. Pitak, Exploring the advantages of single-crystal X-ray diffraction in pharma, https://www.chemistryworld.com/sponsored-content/exploring-the-advantages-of-single-crystal-X-ray-diffraction-in-pharma/4012282.article, [accessed 23 May 2023].
- Y. Zhao, Y. Lu, A. Liu, Z. Y. Zhang, C. Li and A. C. H. Sue, Molecules, 2023, 28, 2537 CrossRef CAS PubMed.
- M. Douzapau, S. Roy Chowdhury, S. Singh, O. J. Ibukun and D. Haldar, Chemistry, 2023, 5, 691–702 CrossRef CAS.
- C. Po, A. Y. Y. Tam, K. M. C. Wong and V. W. W. Yam, J. Am. Chem. Soc., 2011, 133, 12136–12143 CrossRef CAS PubMed.
- N. Liu, B. Wang, W. Liu and W. Bu, J. Mater. Chem. C, 2013, 1, 1130–1136 RSC.
- B. Song, G. Wu, Z. Wang, X. Zhang, M. Smet and W. Dehaen, Langmuir, 2009, 25, 13306–13310 CrossRef CAS PubMed.
- F. Wang, M. Lan, W. P. To, K. Li, C. N. Lok, P. Wang and C. M. Che, Chem. Commun., 2016, 52, 13273–13276 RSC.
- F. Tosi, M. C. A. Stuart, S. J. Wezenberg and B. L. Feringa, Angew. Chem., 2019, 58, 14935–14939 CrossRef CAS PubMed.
- P. Schuck, Biophys. J., 2000, 78, 1606–1619 CrossRef CAS PubMed.
- J. Lebowitz, M. S. Lewis and P. Schuck, Protein Sci., 2009, 11, 2067–2079 CrossRef PubMed.
- M. Raşa and U. S. Schubert, Soft Matter, 2006, 2, 561–572 RSC.
- B. G. G. Lohmeijer and U. S. Schubert, Angew. Chem., 2002, 41, 3825–3829 CrossRef CAS.
- J. F. Gohy, B. G. G. Lohmeijer and U. S. Schubert, Macromolecules, 2002, 35, 4560–4563 CrossRef CAS.
- J. F. Gohy, B. G. G. Lohmeijer, B. Décamps, E. Leroy, S. Boileau, J. A. van den Broek, D. Schubert, W. Haase and U. S. Schubert, Polym. Int., 2003, 52, 1611–1618 CrossRef CAS.
- O. Regev, J. F. Gohy, B. G. G. Lohmeijer, S. K. Varshney, D. H. W. Hubert, P. M. Frederik and U. S. Schubert, Colloid Polym. Sci., 2004, 282, 407–411 CrossRef CAS.
- V. Vogel, J. F. Gohy, B. G. G. Lohmeijer, J. A. Van Den Broek, W. Haase, U. S. Schubert and D. Schubert, J. Polym. Sci., Part A: Polym. Chem., 2003, 41, 3159–3168 CrossRef CAS.
- G. Mayer, V. Vogel, B. G. G. Lohmeijer, J. F. Gohy, J. A. Van Den Broek, W. Haase, U. S. Schubert and D. Schubert, J. Polym. Sci., Part A: Polym. Chem., 2004, 42, 4458–4465 CrossRef CAS.
- S. S. Andrews and J. Tretton, J. Chem. Educ., 2020, 97, 4370–4376 CrossRef CAS.
- A. J. Miles and B. A. Wallace, Chem. Soc. Rev., 2016, 45, 4859–4872 RSC.
- S. Bayindir, K. S. Lee, N. Saracoglu and J. R. Parquette, Dalton Trans., 2020, 49, 13685–13692 RSC.
- V. Mittal, A. Völkel and H. Cölfen, Macromol. Biosci., 2010, 10, 754–762 CrossRef CAS PubMed.
- M. J. Rosen and J. T. Kunjappu, Surfactants and Interfacial Phenomena, John Wiley & Sons, Hoboken, 4th edn, 2012, vol. 4 Search PubMed.
- B. E. Rapp, Microfluidics: Modelling, Mechanics and Mathematics, Elsevier, Amsterdam, 2017, pp. 453–465 Search PubMed.
- H. J. Butt, K. Graf and M. Kappl, Physics and Chemistry of Interfaces, John Wiley & Sons, Hoboken, 1st edn, 2003 Search PubMed.
- J. D. Berry, M. J. Neeson, R. R. Dagastine, D. Y. C. Chan and R. F. Tabor, J. Colloid Interface Sci., 2015, 454, 226–237 CrossRef CAS PubMed.
- E. Mohajeri and G. Dehghan, Eur. J. Chem., 2012, 9, 2268–2274 CAS.
- A. Patist, S. S. Bhagwat, K. W. Penfield, P. Aikens and D. O. Shah, J. Surfactants Deterg., 2000, 3, 53–58 CrossRef CAS.
- C. S. Buettner, A. Cognigni, C. Schröder and K. Bica-Schröder, J. Mol. Liq., 2022, 347, 118160 CrossRef CAS.
- K. P. Ananthapadmanabhan, E. D. Goddard, N. J. Turro and P. L. Kuos, Langmuir, 1985, 1, 352–355 CrossRef PubMed.
- G. Nizri and S. Magdassi, J. Colloid Interface Sci., 2005, 291, 169–174 CrossRef CAS PubMed.
- I. N. Kurniasih, H. Liang, P. C. Mohr, G. Khot, J. P. Rabe and A. Mohr, Langmuir, 2015, 31, 2639–2648 CrossRef CAS PubMed.
- M. G. Cottingham, C. D. Bain and D. J. T. Vaux, Lab. Invest., 2004, 84, 523–529 CrossRef CAS PubMed.
- L. Cai and M. Gochin, SLAS Discovery, 2007, 12, 966–971 CrossRef CAS PubMed.
- L. Cai, M. Gochin and K. Liu, Chem. Commun., 2011, 47, 5527–5529 RSC.
- A. Rutkauskaite, L. J. White, K. L. F. Hilton, G. Picci, L. Croucher, C. Caltagirone and J. R. Hiscock, Org. Biomol. Chem., 2022, 20, 5999–6006 RSC.
- R. A. Al-Juboori and T. Yusaf, Desalination, 2012, 302, 1–23 CrossRef CAS.
- G. Pompeo, M. Girasole, A. Cricenti, F. Cattaruzza, A. Flamini, T. Prosperi, J. Generosi and A. Congiu Castellano, Biochim. Biophys. Acta, Biomembr., 2005, 1712, 29–36 CrossRef CAS PubMed.
- Q. Rao, H. Wang, X. Fan and Y. Zhou, Rare Met. Mater. Eng., 2003, 32, 420–423 Search PubMed.
- M. Aliofkhazraei and N. Ali, in Comprehensive Materials Processing, ed. S. Hashmi, G. F. Batalha, C. J. Van Tyne and B. Yilbas, Elsevier, Amsterdam, 2014, vol. 7, pp. 191–241 Search PubMed.
- S. Han, W. Xu, C. Meiwen, W. Jiqian, D. Xia, H. Xu, X. Zhao and J. R. Lu, Soft Matter, 2012, 8, 645–652 RSC.
- G. C. Feast, O. E. Hutt, X. Mulet, C. E. Conn, C. J. Drummond and G. P. Savage, Chem. – Eur. J., 2014, 20, 2783–2792 CrossRef CAS PubMed.
- G. C. Feast, T. Lepitre, X. Mulet, C. E. Conn, O. E. Hutt, G. P. Savage and C. J. Drummond, Beilstein J. Org. Chem., 2014, 10, 1578–1588 CrossRef PubMed.
- J. W. Lichtman and J. A. Conchello, Nat. Methods, 2005, 2, 910–919 CrossRef CAS PubMed.
- L. J. White, J. E. Boles, N. Allen, L. S. Alesbrook, J. M. Sutton, C. K. Hind, K. L. F. Hilton, L. R. Blackholly, R. J. Ellaby, G. T. Williams, D. P. Mulvihill and J. R. Hiscock, J. Mater. Chem. B, 2020, 8, 4694–4700 RSC.
- S. J. Pennycook, Encyclopedia of Condensed Matter Physics, Elsevier, Amsterdam, 2005, pp. 240–247 Search PubMed.
- J. M. Ludlow, M. J. Saunders, M. Huang, Z. Guo, C. N. Moorefield, S. Z. D. Cheng, C. Wesdemiotis and G. R. Newkome, Supramol. Chem., 2017, 29, 69–79 CrossRef CAS.
- J. Huang, P. Wu, S. Dong and B. Gao, Emerging Contaminants in Soil and Groundwater Systems, Elsevier, Amsterdam, 2022, pp. 253–299 Search PubMed.
- L. Latxague, A. Gaubert and P. Barthélémy, Molecules, 2018, 23, 89 CrossRef PubMed.
- C. Yang, Z. Song, J. Zhao, Z. Hu, Y. Zhang and Q. Jiang, Colloids Surf., A, 2017, 523, 62–70 CrossRef CAS.
- M. E. Cano, P. H. Di Chenna, D. Lesur, A. Wolosiuk, J. Kovensky and M. L. Uhrig, New J. Chem., 2017, 41, 14754–14765 RSC.
- O. P. Choudhary and P. Choudhary, Int. J. Curr. Microbiol. Appl. Sci., 2017, 6, 1877–1882 CrossRef CAS.
- B. R. Denzer, R. J. Kulchar, R. B. Huang and J. Patterson, Gels, 2021, 7, 158 CrossRef CAS PubMed.
- J. L. S. Milne, M. J. Borgnia, A. Bartesaghi, E. E. H. Tran, L. A. Earl, D. M. Schauder, J. Lengyel, J. Pierson, A. Patwardhan and S. Subramaniam, FEBS J., 2013, 280, 28–45 CrossRef CAS PubMed.
- Z. Kochovski, G. Chen, J. Yuan and Y. Lu, Colloid Polym. Sci., 2020, 298, 707–717 CrossRef CAS.
- H. Cui, T. K. Hodgdon, E. W. Kaler, L. Abezgauz, D. Danino, M. Lubovsky, Y. Talmon and D. J. Pochan, Soft Matter, 2007, 3, 945 RSC.
- M. R. Leung and T. Zeev-Ben-Mordehai, J. Neurochem., 2021, 158, 1236–1243 CrossRef CAS PubMed.
- A. J. Higgins, A. J. Flynn, A. Marconnet, L. J. Musgrove, V. L. G. Postis, J. D. Lippiat, C. Chung, T. Ceska, M. Zoonens, F. Sobott and S. P. Muench, Commun. Biol., 2021, 4, 1337 CrossRef CAS PubMed.
- K. Mio and C. Sato, Biophys. Rev., 2018, 10, 307–316 CrossRef CAS PubMed.
- A. L. Parry, P. H. H. Bomans, S. J. Holder, N. A. J. M. Sommerdijk and S. C. G. Biagini, Angew. Chem., 2008, 47, 8859–8862 CrossRef CAS PubMed.
- P. Workman and I. Collins, Chem. Biol., 2010, 17, 561–577 CrossRef CAS PubMed.
- M. Bin Samad, K. Maddeboina, N. Rodrigues de Almeida and M. Conda-Sheridan, J. Visualized Exp., 2018, e57908 Search PubMed.
- S. Chen, R. Costil, F. K. Leung and B. L. Feringa, Angew. Chem., 2021, 60, 11604–11627 CrossRef CAS PubMed.
- P. Saraf, X. Li, L. Wrischnik and B. Jasti, Pharm. Res., 2015, 32, 3087–3101 CrossRef CAS PubMed.
- A. Brito, S. Kassem, R. L. Reis, R. V. Ulijn, R. A. Pires and I. Pashkuleva, Chem., 2021, 7, 2943–2964 CAS.
- B. Parshad, S. Prasad, S. Bhatia, A. Mittal, Y. Pan, P. K. Mishra, S. K. Sharma and L. Fruk, RSC Adv., 2020, 10, 42098–42115 RSC.
- L. Di and E. Kerns, Chem. Biodiversity, 2009, 6, 1875–1886 CrossRef CAS PubMed.
- Y. Lu, E. Zhang, J. Yang and Z. Cao, Nano Res., 2018, 11, 4985–4998 CrossRef PubMed.
- M. Haikola, J. Hirvonen, O. Penate Medina, I. Simpura, K. Kairemo and L. Peltonen, J. Drug Delivery Sci. Technol., 2011, 21, 183–188 CrossRef CAS.
- P. Xing and Y. Zhao, Adv. Mater., 2016, 28, 7304–7339 CrossRef CAS PubMed.
- Y. S. Lee, Self-Assembly and Nanotechnology, Wiley, 2008 Search PubMed.
- K. Morigaki and P. Walde, Curr. Opin. Colloid Interface Sci., 2007, 12, 75–80 CrossRef CAS.
- M. Bergmeier, M. Gradzielski, H. Hoffmann and K. Mortensen, J. Phys. Chem. B, 1998, 102, 2837–2840 CrossRef CAS.
- J.-F. Berret, D. C. Roux and G. Porte, J. Phys. II, 1994, 4, 1261–1279 CrossRef CAS.
- P. Brown, C. P. Butts and J. Eastoe, Soft Matter, 2013, 9, 2365 RSC.
- T. Stylianopoulos and R. K. Jain, Nanomedicine, 2015, 11, 1893–1907 CrossRef CAS PubMed.
- C. A. Lipinski, F. Lombardo, B. W. Dominy and P. J. Feeney, Adv. Drug Delivery Rev., 2001, 46, 3–26 CrossRef CAS PubMed.
- M. Yang and W. J. Brackenbury, Front. Physiol., 2013, 4, 1–10 Search PubMed.
- M. C. Frantz and P. Wipf, Environ. Mol. Mutagen., 2010, 51, 462–475 CrossRef CAS PubMed.
- M. T. Jeena, L. Palanikumar, E. M. Go, I. Kim, M. G. Kang, S. Lee, S. Park, H. Choi, C. Kim, S. M. Jin, S. C. Bae, H. W. Rhee, E. Lee, S. K. Kwak and J. H. Ryu, Nat. Commun., 2017, 8, 26 CrossRef CAS PubMed.
- D. J. Kim, M. T. Jeena, O. H. Kim, H. E. Hong, H. Seo, J. H. Ryu and S. J. Kim, Int. J. Mol. Sci., 2020, 21, 6126 CrossRef CAS PubMed.
- M. T. Jeena, S. Jin, B. Jana and J. H. Ryu, RSC Chem. Biol., 2022, 3, 1416–1421 RSC.
- Y. Lu, Z. Yue, J. Xie, W. Wang, H. Zhu, E. Zhang and Z. Cao, Nat. Biomed. Eng., 2018, 2, 318–325 CrossRef CAS PubMed.
- H. Su, F. Wang, W. Ran, W. Zhang, W. Dai, H. Wang, C. F. Anderson, Z. Wang, C. Zheng, P. Zhang, Y. Li and H. Cui, Proc. Natl. Acad. Sci. U. S. A., 2020, 117, 4518–4526 CrossRef CAS PubMed.
- D. K. Ho, R. Christmann, X. Murgia, C. De Rossi, S. Frisch, M. Koch, U. F. Schaefer, B. Loretz, D. Desmaele, P. Couvreur and C. M. Lehr, Front. Chem., 2020, 8, 584242 CrossRef CAS PubMed.
- L. Li, R. Sun and R. Zheng, Mater. Des., 2021, 197, 109209 CrossRef CAS.
- B. O. Okesola, Y. Wu, B. Derkus, S. Gani, D. Wu, D. Knani, D. K. Smith, D. J. Adams and A. Mata, Chem. Mater., 2019, 31, 7883–7897 CrossRef CAS PubMed.
- V. V. Acuna, R. M. Hopper and R. J. Yoder, J. Chem. Educ., 2020, 97, 760–763 CrossRef CAS.
- C. Y. Jia, J. Y. Li, G. F. Hao and G. F. Yang, Drug Discovery Today, 2020, 25, 248–258 CrossRef CAS PubMed.
- F. Wu, Y. Zhou, L. Li, X. Shen, G. Chen, X. Wang, X. Liang, M. Tan and Z. Huang, Front. Chem., 2020, 8, 1–32 CrossRef CAS PubMed.
- N. Pillai, A. Dasgupta, S. Sudsakorn, J. Fretland and P. D. Mavroudis, Drug Discovery Today, 2022, 27, 2209–2215 CrossRef CAS PubMed.
- S. Q. Pantaleão, P. O. Fernandes, J. E. Gonçalves, V. G. Maltarollo and K. M. Honorio, ChemMedChem, 2022, 17, e202100542 CrossRef PubMed.
- J. Dulsat, B. López-Nieto, R. Estrada-Tejedor and J. I. Borrell, Molecules, 2023, 28, 776 CrossRef CAS PubMed.
- A. Daina, O. Michielin and V. Zoete, Sci. Rep., 2017, 7, 42717 CrossRef PubMed.
- J. Dong, N.-N. Wang, Z.-J. Yao, L. Zhang, Y. Cheng, D. Ouyang, A.-P. Lu and D.-S. Cao, J. Cheminf., 2018, 10, 29 Search PubMed.
- G. Xiong, Z. Wu, J. Yi, L. Fu, Z. Yang, C. Hsieh, M. Yin, X. Zeng, C. Wu, A. Lu, X. Chen, T. Hou and D. Cao, Nucleic Acids Res., 2021, 49, W5–W14 CrossRef CAS PubMed.
- D. Lagorce, L. Bouslama, J. Becot, M. A. Miteva and B. O. Villoutreix, Bioinformatics, 2017, 33, 3658–3660 CrossRef CAS PubMed.
- P. L. Scognamiglio, C. Riccardi, R. Palumbo, T. F. Gale, D. Musumeci and G. N. Roviello, J. Nanostruct. Chem., 2023, 1–19 Search PubMed.
- W. Zou, A. Martell Monterroza, Y. Yao, S. C. Millik, M. M. Cencer, N. J. Rebello, H. K. Beech, M. A. Morris, T.-S. Lin, C. S. Castano, J. A. Kalow, S. L. Craig, A. Nelson, J. S. Moore and B. D. Olsen, Chem. Sci., 2022, 13, 12045–12055 RSC.
- S. Rahal, N. Hadidi and M. Hamadache, Arabian J. Sci. Eng., 2020, 45, 7445–7454 CrossRef CAS.
- E. N. Muratov, J. Bajorath, R. P. Sheridan, I. V. Tetko, D. Filimonov, V. Poroikov, T. I. Oprea, I. I. Baskin, A. Varnek, A. Roitberg, O. Isayev, S. Curtalolo, D. Fourches, Y. Cohen, A. Aspuru-Guzik, D. A. Winkler, D. Agrafiotis, A. Cherkasov and A. Tropsha, Chem. Soc. Rev., 2020, 49, 3525–3564 RSC.
- A. Mozrzymas, J. Solution Chem., 2013, 42, 2187–2199 CrossRef CAS PubMed.
- M. Jalali-Heravi and E. Konouz, J. Surfactants Deterg., 2003, 6, 25–30 CrossRef CAS.
- RDKit: Open-source cheminformatics, https://www.rdkit.org. [accessed 3 May 2023].
- M. Turchi, A. P. Karcz and M. P. Andersson, J. Colloid Interface Sci., 2022, 606, 618–627 CrossRef CAS PubMed.
- R. Van Lommel, J. Zhao, W. M. De Borggraeve, F. De Proft and M. Alonso, Chem. Sci., 2020, 11, 4226–4238 RSC.
- P. Mukerjee and K. J. Mysels, Critical Micelle Concentrations of Aqueous Surfactant Systems, US government printing office, 1971, 36 Search PubMed.
- J. Thomas, M. Navre, A. Rubio and A. Coukell, ACS Infect. Dis., 2018, 4, 1536–1539 CrossRef CAS PubMed.
- L. J. White, J. E. Boles, M. Clifford, B. L. Patenall, K. H. L. F. Hilton, K. K. L. Ng, R. J. Ellaby, C. K. Hind, D. P. Mulvihill and J. R. Hiscock, Chem. Commun., 2021, 57, 11839–11842 RSC.
- S. N. Tyuleva, N. Allen, L. J. White, A. Pépés, H. J. Shepherd, P. J. Saines, R. J. Ellaby, D. P. Mulvihill and J. R. Hiscock, Chem. Commun., 2019, 55, 95–98 RSC.
| This journal is © The Royal Society of Chemistry 2023 |


