 Open Access Article
Creative Commons Attribution 3.0 Unported Licence
Lithium ion transport in solid polymer electrolyte filled with alumina nanoparticles†
Jiaqi
Wang
,
Linhao
Fan
 ,
Qing
Du
* and
Kui
Jiao
 *
*
State Key Laboratory of Engines, Tianjin University, 135 Yaguan Road, Tianjin 300350, China. E-mail: duqing@tju.edu.cn; kjiao@tju.edu.cn
First published on 15th March 2022
Abstract
Using a solid polymer electrolyte (SPE) is a promising approach for improving lithium battery durability by suppressing the growth of lithium dendrites. However, the low conductivity at room temperature significantly limits its commercial application. In this work, Al2O3 nanoparticles are used as a filler in a SPE with polyethylene oxide (PEO) and lithium bis(trifluoromethanesulfonyl)imide (LiTFSI) salt to improve its conductivity, and the resulting structure and transport properties are analyzed in detail using molecular dynamics simulations. The results show that the addition of Al2O3 nanoparticles decreases the crystallinity and increases the degree of order of the PEO chains and makes it easier for Li+ to combine with the PEO chains, thereby significantly enhancing Li+ transport along the PEO chains. Moreover, the addition of Al2O3 provides an additional Li+ transport path, which is the interface between the Al2O3 and PEO chains. Therefore, after adding Al2O3 nanoparticles, the conductivity is increased by 192.25% and 248.94% at 333 and 300 K, respectively, for the SPE with shorter PEO chains and by 225.2% and 285% at 333 and 300 K, respectively, for the SPE with longer PEO chains. Moreover, the enhancement effects of Al2O3 nanoparticles on conductivity are more significant for SPEs with longer PEO chains at lower temperatures.
1. Introduction
Environmental pollution and global energy consumption have led to electric vehicles emerging as the main mode of future transportation.1,2 Lithium batteries are the main candidates for electric vehicles and hybrid vehicles, and the usage of lithium metal as the anode provides the highest theoretical energy density for secondary lithium batteries.3 However, lithium metal anodes and liquid electrolytes can easily generate lithium dendrites during charge and discharge processes, which cause internal short circuits in the lithium battery.4 Meanwhile, liquid electrolytes have many disadvantages, such as easy leakage of the liquid and flammable reaction products.5,6 In contrast, solid-state batteries using solid polymer electrolytes (SPEs) have the advantages of high ionic conductivity, high specific energy, solvent-free conditions, a wide electrochemical stability window, light weight, and easy processing.7 As an SPE, polyethylene oxide (PEO) membranes doped with lithium salts have attracted great attention in recent years.8–10 The PEO-based film is a flexible solid electrolyte with a low glass transition temperature (Tg), high dielectric constant, and certain mechanical strength, which can be used for special electronic devices.11,12The conductivity in the PEO-based SPE greatly depends on the dynamic properties of the PEO chains. The properties of PEO-based structures depend strongly on the chain length. Shorter chains tend to be more flexible and enable larger ionic diffusion coefficients, while longer chains have higher mechanical stability.13 The PEO chain contains ether coordination sites and can dissociate lithium salts.14 Traditional lithium salts have been found to accumulate in SPEs. With increasing salt concentration and temperature, the degree of anion aggregation increases, which is related to the size of the anions.15 Lithium bis(trifluoromethanesulfonyl)imide (LiTFSI) is a lithium salt with high chemical stability that is commonly used in SPE. Many studies have found that LiTFSI is largely dissociated in PEO matrices.16 PEO has a flexible macromolecular chain, which benefits Li+ transport.17 Several Li+ transport pathways have been observed in simulation studies, such as Li+ moving along the PEO chains, Li+ complexing and decomplexing with anions, and Li+ occasionally hopping between the adjacent PEO chains.18–20 Borodin et al.15 showed that Li cations moving along the PEO chains generally show stronger mobility than those that jump between the PEO chains, suggesting that enhancing the movement along the PEO chains can significantly promote Li+ diffusion.
However, the low conductivity of PEO/LiTFSI electrolytes at room temperature limits their application.21 Generally, adding nanoparticle fillers is the best way to improve the conductivity by decreasing the crystallinity of the PEO chains and increasing the conductive area of Li+. Moreover, the addition of nanoparticles can improve the interface stability and the mechanical strength of the SPEs.22 According to previous studies, nanoparticle fillers for SPEs include passive fillers such as SiO2,23,24 Al2O3,25,26 ZnO,27 and BaTiO328 and active fillers such as LLZO (Li7La3Zr2O12).29 It is difficult for active fillers to tune surface interaction against the polymer matrix and the synthesis process is complex. However, the passive fillers are tunable, easily prepared, and inexpensive.30 B. Scrosati and his collaborators31 used TiO2 functionalized with silane organic groups to improve the PEO electrolyte properties, which improved the conductivity. The nanoparticles interact with the PEO chains, resulting in a decrease in the crystallinity of the PEO chains. And Al2O3 as a high-stability and easily prepared passive filler can improve the conductivity and the mechanical strength of the SPEs.32
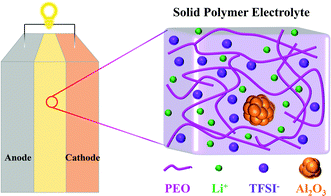
Molecular dynamics (MD) simulation is a powerful tool that can obtain insights into transport phenomena at the molecular level.33 V. Ponce et al.34 theoretically analyzed the charging process of a nanobattery with LiCoO2 as the cathode, Li7P2S8I as the solid electrolyte, and lithium metal as the anode by MD simulations. J. Brooks and coworkers13 investigated the structure and diffusion properties of PEO/LiTFSI electrolytes, indicating that Li cations mostly diffuse along the polymer chains instead of jumping between different polymer chains. Li et al.35 elucidated the effects of the size and shape of nanoparticles on the ionic conductivity of PEO/LiClO4 electrolyte through MD simulations, but the concentrations of nanoparticles were ignored. However, to the best of our knowledge, studies on the effect mechanism of nanoparticle fillers on the conductivity of SPEs are absent. In this work, MD simulations are carried out to investigate the conductivity of PEO/LiTFSI electrolytes filled with Al2O3 nanoparticles. The structures of the solid-state battery and SPE filled with Al2O3 are shown in Fig. 1. Meanwhile, the effects of PEO chain length and temperature are also studied.
2. Models and methods
2.1. Molecular models
A periodic boundary condition is applied in all three dimensions. The bulk electrolyte is based on PEO chains and LiTFSI salt. In this work, the interatomic interactions are described by the OPLS all-atom (OPLSAA) force field, which was developed for polymers and organic materials.36 The potential energy for PEO molecules, Li+, TFSI−, and Al2O3 nanoparticles is expressed as: | (1) |
 | (2) |
 | (3) |
 | (4) |
 | (5) |
 | (6) |
To study the effects of Al2O3 nanoparticles on the properties of SPEs with different chain lengths, two types of PEO chains with different lengths are constructed in this work, a short-chain PEO molecular (SC) system and a long-chain PEO molecular (LC) system, as listed in Table 1. The SC system is composed of 40 Li cations, 40 TFSI anions, and 40 PEO chains including methyl end groups as well as 20 EO units, while the LC system is composed of 100 Li cations, 100 TFSI anions, and 20 PEO chains including methyl end groups as well as 100 EO units, which are commonly used to study the performance of SPEs.33,35,38 The PEO chains including methyl end groups have better ionic conductivity.14 Plasticizers are absent in this work, considering that the main function of plasticizers is to reduce the crystallinity of PEO chains and their exclusion will not affect the conclusions of this work.
| System | [EO]/chain | N chain | Mw (g mol−1) | N LiTFSI | EO![[thin space (1/6-em)]](https://www.rsc.org/images/entities/char_2009.gif) : :![[thin space (1/6-em)]](https://www.rsc.org/images/entities/char_2009.gif) Li Li |
|---|---|---|---|---|---|
| SC, 300 K | 20 | 40 | 926 | 40 | 20![[thin space (1/6-em)]](https://www.rsc.org/images/entities/char_2009.gif) : :![[thin space (1/6-em)]](https://www.rsc.org/images/entities/char_2009.gif) 1 1 |
| SC, 333 K | 20 | 40 | 926 | 40 | 20![[thin space (1/6-em)]](https://www.rsc.org/images/entities/char_2009.gif) : :![[thin space (1/6-em)]](https://www.rsc.org/images/entities/char_2009.gif) 1 1 |
| LC, 300 K | 100 | 20 | 4446 | 100 | 20![[thin space (1/6-em)]](https://www.rsc.org/images/entities/char_2009.gif) : :![[thin space (1/6-em)]](https://www.rsc.org/images/entities/char_2009.gif) 1 1 |
| LC, 333 K | 100 | 20 | 4446 | 100 | 20![[thin space (1/6-em)]](https://www.rsc.org/images/entities/char_2009.gif) : :![[thin space (1/6-em)]](https://www.rsc.org/images/entities/char_2009.gif) 1 1 |
2.2. Alumina structure
The crystal structure of Al2O3 nanoparticles is a trigonal crystal system. In the simulation system, the Al2O3 nanoparticle contains 30 atoms, including 12 Al atoms and 18 O atoms (a = 5.178 Å−1, b = 5.178 Å−1, c = 5.178 Å−1, α = 55.290°, β = 55.290°, γ = 55.290°).39 Since this study mainly explores the effect of the concentration of nanoparticles on the SPE, the size and shape of the nanoparticles are fixed, and the interaction within the nanoparticles is ignored in the simulation process. The size of the Al2O3 nanoparticles is approximately 1.3 nm, which was selected because smaller nanoparticles are known to have a better enhancement effect.The L-J potential parameters for O and Al atoms in the Al2O3 nanoparticles are σ0 = 0.28 nm, ε0 = 0.155 kcal mol−1 and σAl = 0.22 nm, εAl = 0.155 kcal mol−1, respectively, while the atomic charges of O and Al atoms are −0.9450 e and +1.4175 e,40 respectively. For the same temperature and PEO chain length, the concentrations of Al2O3 are determined by the number of Al2O3 nanoparticles, meaning that the concentrations of Al2O3 are a little different in different systems. Previous experiments showed that the addition of nanoparticles also has an important effect on the electrode–electrolyte interface, wherein the nanoparticles stabilize the electrode–electrolyte interface and reduce the interface impedance.41,42 However, the electrode–electrolyte interface is not studied in this paper. More MD simulations will be carried out to study the effect of Al2O3 nanoparticles on the properties of the electrode–electrolyte interface in the future.
2.3. Simulation procedures
The initial temperature of all simulations is 300 K, while the initial pressure of all simulations is 100 atm using a timestep of 1 fs. The temperature was raised to 500 K, and the pressure was dropped to 1 atm during a 1 ns NPT (constant number of atoms, constant pressure, and constant temperature) simulation. Then, the systems were run at 500 K for 2 ns under an NVT (constant number of atoms, constant volume, and constant temperature) ensemble. The system temperature is varied between 300 K and 500 K four times to eliminate the initial bias and relax the original configuration. After that, the system temperature is adjusted to the required temperature (300 K and 333 K) by a 2 ns NPT simulation, and another 2 ns NPT simulation at the corresponding temperature is carried out to balance the configuration. When the total energy does not change over time, the systems are considered to have reached the equilibrium state. The data are collected during the last 10 ns with an interval of 2 ps.2.4. Diffusion coefficient
The self-diffusion coefficient (Di) of the SPE is calculated through mean squared diffusion (MSD): | (7) |
In MD simulations, the conductivity (σ) can be calculated by the Nernst–Einstein relation:
 | (8) |
2.5. Radial distribution function (RDF)
The radial distribution function is the probability of finding particle B at radius r from particle A. The RDF is an important function to describe the structure of molecular systems, which can be expressed as: | (9) |
2.6. Glass transition temperatures
The glass transition temperature (Tg) refers to the temperature corresponding to the transition from the glass state to the high elastic state. In terms of molecular structure, Tg is a relaxation phenomenon in which the amorphous part of the polymer changes from the frozen state to the thawed state. To compare the Tg, we used a quasi-equilibrium release method to cool the SPE from a high temperature, which is 50 K higher than the Tg predicted by Flory-Fox.43 Specifically, the temperature is reduced with a step of 10 K.44 Then, a 1 ns NPT simulation is carried out to balance the system and another 1 ns NPT simulation is carried out to obtain the system density, which is equivalent to a 0.5 × 10¹⁰ K s−1 cooling rate. The temperature where the slope of dρ/dK has the largest deviation is defined as Tg.3. Results and discussion
3.1. Model validation
The conductivities simulated by MD simulations at different temperatures are compared with previous experimental results to validate the molecular models used in this work. As shown in Fig. 2(a), the simulated conductivity increases as the temperature increases, which is consistent with the experimental results.45 As the temperature increases, the polymer electrolyte easily expands to create a larger free space, resulting in an increase in conductivity. Moreover, the linear relationship between log![[thin space (1/6-em)]](https://www.rsc.org/images/entities/char_2009.gif) σ and T−1 shown in Fig. 2(a) suggests that the conductivity follows the Arrhenius theory and Vogel–Tamman–Fulcher (VTF) equation. The Li+ and TFSI− diffusion coefficients of PEO-LiTFSI electrolytes with different PEO molecular weights at 363 K are also computed, as shown in Fig. 2(b), which agrees well with the previous works.46 The samples in MD simulations cannot be as large as the ones in experiments, which leads to the differences between the simulated and experimental results.
σ and T−1 shown in Fig. 2(a) suggests that the conductivity follows the Arrhenius theory and Vogel–Tamman–Fulcher (VTF) equation. The Li+ and TFSI− diffusion coefficients of PEO-LiTFSI electrolytes with different PEO molecular weights at 363 K are also computed, as shown in Fig. 2(b), which agrees well with the previous works.46 The samples in MD simulations cannot be as large as the ones in experiments, which leads to the differences between the simulated and experimental results.
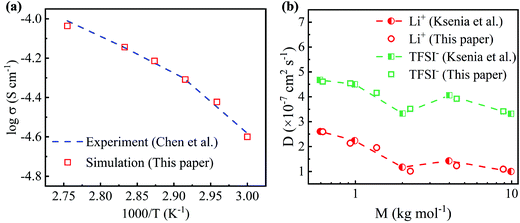 | ||
| Fig. 2 (a) Simulated conductivity and (b) diffusion coefficients of PEO-LiTFSI electrolytes and comparison with the previous experimental and simulated results.45,46 | ||
3.2. Transport properties
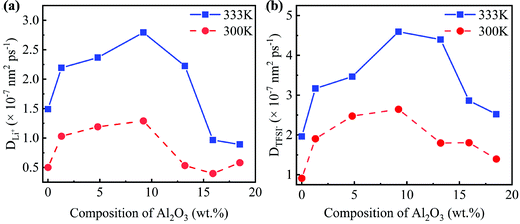
Due to the different numbers of Al2O3 nanoparticles, the concentrations of Al2O3 in the SC system are 1.3, 4.8, 9.2, 13.2, 15.9, and 18.5 wt%, while those in the LC system are 1.3, 4.5, 8.1, 11.9, 15.0, and 18.3 wt%.25 The MSD as shown in Fig. S1 and S2 (ESI†) is obtained to compute the diffusivity following eqn (7). The diffusivities of Li+ and TFSI− in the SC system and LC system are computed and shown in Fig. 3 and Fig. S3 (ESI†), respectively.Fig. 3 shows that the addition of Al2O3 nanoparticles has a significant impact on the diffusivities of Li+ and TFSI−. Both the diffusivities of Li+ and TFSI− increase first and then decrease with increasing Al2O3 mass fraction. The diffusivities of Li+ and TFSI− in the SPE filled with 9.2 wt% and 8.1 wt% Al2O3 are highest for the SC and LC systems, respectively, which means that the Al2O3 nanoparticles enhance Li+ and TFSI− transport. In addition, high temperatures make ions move faster, so both the diffusivities of Li+ and TFSI− at 333 K are higher than those at 300 K. Generally, TFSI− shows a higher diffusivity, which is consistent with the simulation results.33
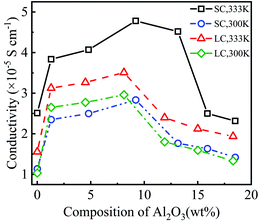
Fig. 4 shows the conductivity of PEO-LiTFSI with different mass fractions of Al2O3 nanoparticles. As shown in Fig. 4, the conductivity first increases and then decreases with increasing Al2O3 mass fraction, showing the highest values at Al2O3 mass fractions of 9.2 wt% and 8.2 wt% for the SC and LC systems, respectively. Moreover, the conductivity at the Al2O3 mass fraction of 9.2 wt% is increased by 192.25% and 248.94% at 333 K and 300 K for the SC system, respectively, compared to that without Al2O3. The conductivity at the Al2O3 mass fraction of 8.2 wt% is increased by 225.2% and 285% at 333 K and 300 K for the LC system, respectively, compared to that without Al2O3. B. Scrosati et al.31 found that the addition of TiO2 can improve the conductivity of PEO-LiCF3SO3 electrolyte to ∼10−5 S cm−1 at 333 K, while Y. Matsuo et al.24 found that the SiO2 fillers can improve the conductivity to 4.4 × 10⁻⁵ S cm−1 at 303 K, both of which are similar to our results. At a lower Al2O3 mass fraction, the increasing Al2O3 nanoparticles lead to the interconnection of highly conductive areas near the Al2O3, thereby improving the conductivity. However, at a higher Al2O3 mass fraction, the Al2O3 nanoparticles that are too close to each other increase the polymerization degree of PEO chains, thereby decreasing the conductivity.
Additionally, the conductivity at 333 K is higher than that at 300 K, as shown in Fig. 4, which is consistent with the experimental data.25 The enhancement effect of Al2O3 on the conductivity is stronger at lower temperatures. Furthermore, the conductivity is lower for the SPE with longer PEO chains due to their higher polymerization degree. The addition of Al2O3 nanoparticles more highly reduces the polymerization degree of longer PEO chains. Consequently, the increase in the conductivity of the SPE with longer PEO chains is more obvious when adding Al2O3, as shown in Fig. 4.
3.3. Structural properties
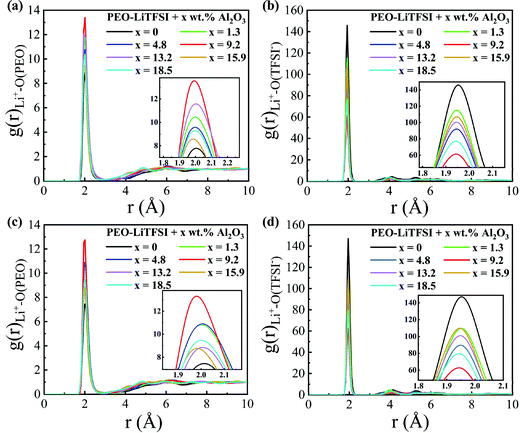
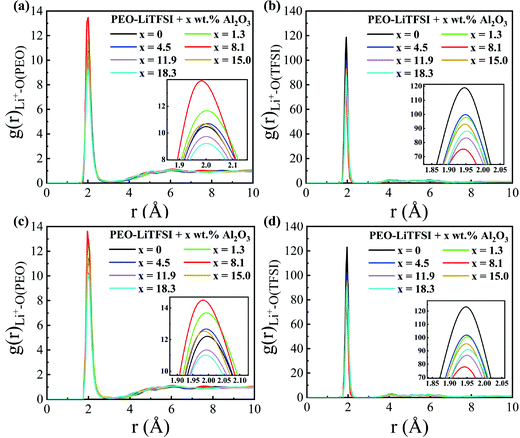
The RDFs are calculated to explore the structural characteristics of SPEs with Al2O3 nanoparticles. Fig. 5 shows the RDFs between Li+ and O atoms in PEO (Li+–O (PEO)) and between Li+ and O atoms in TFSI− (Li+–O (TFSI)) in the SC system. As shown in Fig. 5(a and c), the RDFs of Li+–O (PEO) show a sharp peak at the same position of 1.95 Å, which is consistent with previous studies.13,33 When the mass fraction of Al2O3 is 9.2 wt%, the peak height of the RDF of Li+–O (PEO) is highest, while that of the RDF of Li+–O (TFSI) is lowest. This means that the lithium ions are closer to the PEO chains and farther away from TFSI− when adding Al2O3, and thus, the transport of Li+ along the PEO chains is enhanced, thereby resulting in an increase in conductivity, as shown in Fig. 4. The coordination numbers (CNs) of Li+–O (PEO) and Li+–O (TFSI) are calculated and shown in Fig. S4 (ESI†). The CN of Li+–O (PEO) increases up to approximately 3, and the CN of Li+–O (TFSI) drops to 2.5 when the mass fraction of Al2O3 is 9.2 wt%, which also illustrates that the combination of Li and PEO chains is strengthened by the addition of Al2O3. The CN of Li+–O (PEO) slightly increases, meaning that the addition of Al2O3 slightly enhances the Li+ transport along the PEO chains, which is agreeable with the previous works.35 However, the CN of Li+–O (TFSI) was found to greatly decrease when the Al2O3 amount increases, which means that more Li+ can freely migrate at the interface, thereby significantly increasing the conductivity. However, excess Al2O3 nanoparticles will aggregate together and suppress the combination of Li+ and PEO chains, reducing the conductivity, as shown in Fig. 4. In addition, the peak height of the RDF of Li+–O (PEO) is higher at higher temperatures, meaning that more Li+ combines with the PEO chains at higher temperatures; thus, the conductivity is higher, as shown in Fig. 4. Furthermore, the larger increase in the peak height of the RDF of Li+–O (PEO) also explains the larger increase in the conductivity of SPE at 300 K than that at 333 K.The RDFs and the CNs of the LC system are shown in Fig. 6 and Fig. S5 (ESI†), respectively. The peak height of the RDF of Li+–O (PEO) is highest, while that of the RDF of Li+–O (TFSI) is lowest at the Al2O3 mass fraction of 8.2 wt%; thus, the conductivity is highest, as shown in Fig. 4. Different from the SC system, the peak value of the RDF of Li+–O(PEO) at a higher Al2O3 mass fraction is even lower than that without Al2O3. When the concentration of Al2O3 is too large, the suppression effect of Al2O3 on the combination of Li+ and PEO chains is more obvious in the LC system than in the SC system.
3.4. Glass transition temperatures (Tg)
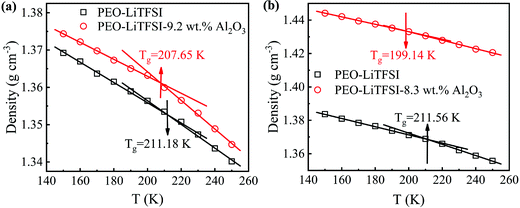
The densities of the SPE with 0 and 9.2 wt% Al2O3 for the SC system and the SPE with 0 and 8.3 wt% Al2O3 for the LC system at different temperatures are calculated. As shown in Fig. 7, the Tg drops from 211.18 K to 207.65 K in the SC system, while it drops from 211.56 K to 199.14 K in the LC system. The results show that the addition of Al2O3 reduces the Tg of SPE due to the increase in the amorphous region of PEO. Furthermore, the increasing amorphous region will make the PEO chains more flexible, thereby resulting in Li+ more easily migrating in the amorphous region. Furthermore, the Tg for the LC system is lower than that of the SC system after adding Al2O3, which is the main reason that the addition of Al2O3 has a stronger enhancement effect on the conductivity of the LC system.3.5. Transport mechanism
Fig. 8 shows the structural changes of PEO chains and the Li+ transport paths after adding Al2O3 nanoparticles. Generally, the PEO chains have higher crystallinity, and thus, lithium ions have difficulty combining with and moving along the PEO chains, as shown in the left image in Fig. 8. Therefore, the conductivity of SPE is low, significantly limiting its commercial applications. The addition of Al2O3 nanoparticles alters the structure of the PEO chains. Specifically, the crystallinity of the PEO chains decreases, and their degree of order increases, as shown in the right image in Fig. 8. Meanwhile, more lithium ions can combine with the PEO chains and move freely along the PEO chains (Path 1). It is noteworthy that the main transport path of Li+ is along the PEO chains.13 Moreover, the simulation results show that a number of lithium ions transport at the interface between Al2O3 and the PEO chains, indicating that the addition of Al2O3 provides an additional path for Li+ transport (Path 2). Therefore, the conductivity of SPE is significantly increased by the Al2O3 nanoparticles. However, at high mass fractions, excess Al2O3 nanoparticles will aggregate together and block the transport of Li+.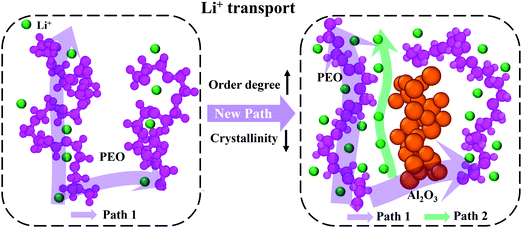 | ||
| Fig. 8 Structural changes of the PEO chains and Li+ transport paths after adding Al2O3 nanoparticles. | ||
4. Conclusions
The structure and transport properties of SPEs filled with Al2O3 nanoparticles are explored by all-atom MD simulations. The MD model is verified by comparing the conductivity with the experimental results. The effects of Al2O3 nanoparticles on the conductivity of SPEs with different PEO chain lengths at different temperatures are studied. The simulation results show that the conductivity is increased by 192.25% and 248.94% at 333 and 300 K, respectively, for the shorter PEO chains and increased by 225.2% and 285% at 333 and 300 K, respectively, for the longer PEO chains. This suggests that the effects of Al2O3 nanoparticles on the conductivity are more significant for longer PEO chains at lower temperatures. The increase in conductivity is attributed to the structural changes that occur in the SPE upon addition of Al2O3 nanoparticles. The addition of Al2O3 makes Li+ more easily combine with PEO chains and reduces combination with TFSI−, which is beneficial to Li+ transport along the PEO chains. Moreover, the crystallinity is studied by computing the Tg of SPE. The results show that the crystallinity of the PEO chains decreases and the degree of order increases when adding Al2O3 nanoparticles, which also benefits Li+ transport along the PEO chains. On the other hand, the addition of Al2O3 provides an additional Li+ transport path, which is the interface between the Al2O3 and PEO chains. Therefore, the conductivity of the PEO chains is increased significantly by Al2O3 nanoparticles. These findings are highly valuable for insights into the structure and transport characteristics of SPEs and the fundamental understanding of Al2O3's effects in SPEs.Conflicts of interest
The authors declare that they have no known competing financial interests or personal relationships that could have appeared to influence the work reported in this paper.Acknowledgements
This research is supported by the National Natural Science Foundation of China (Grant No. 51921004), and the Natural Science Foundation of Tianjin (China) for Distinguished Young Scholars (Grant No. 18JCJQJC46700).References
- K. Jiao, J. Xuan, Q. Du, Z. Bao, B. Xie, B. Wang, Y. Zhao, L. Fan, H. Wang, Z. Hou, S. Huo, N. P. Brandon, Y. Yin and M. D. Guiver, Nature, 2021, 595, 361–369 CrossRef CAS PubMed
.
- D. Jin and K. Jiao, Joule, 2020, 4, 1634–1636 CrossRef
.
-
A. Perner and J. Vetter, in Advances in Battery Technologies for Electric Vehicles, ed. B. Scrosati, J. Garche and W. Tillmetz, Woodhead Publishing, 2015, 173–190 Search PubMed
.
- D. Cao, X. Sun, Q. Li, A. Natan, P. Xiang and H. Zhu, Matter, 2020, 3, 57–94 CrossRef
.
- Y. Lin, J. Li, K. Liu, Y. Liu, J. Liu and X. Wang, Green Chem., 2016, 18, 3796–3803 RSC
.
- M. Forsyth, L. Porcarelli, X. Wang, N. Goujon and D. Mecerreyes, Acc. Chem. Res., 2019, 52, 686–694 CrossRef CAS PubMed
.
- L.-Z. Fan, X.-L. Wang and F. Long, J. Power Sources, 2009, 189, 775–778 CrossRef CAS
.
- G. Wang, X. Zhu, A. Rashid, Z. Hu, P. Sun, Q. Zhang and L. Zhang, J. Mater. Chem. A, 2020, 8, 13351–13363 RSC
.
- C. H. Wang, Y. F. Yang, X. J. Liu, H. Zhong, H. Xu, Z. B. Xu, H. X. Shao and F. Ding, ACS Appl. Mater. Interfaces, 2017, 9, 13694–13702 CrossRef CAS PubMed
.
- M. Wetjen, M. A. Navarra, S. Panero, S. Passerini, B. Scrosati and J. Hassoun, ChemSusChem, 2013, 6, 1037–1043 CrossRef CAS PubMed
.
- E. Quartarone and P. Mustarelli, Chem. Soc. Rev., 2011, 40, 2525–2540 RSC
.
- V. R. Sunitha and S. Radhakrishnan, Field enhanced Li ion conduction in nanoferroelectric modified polymer electrolyte systems, Ionics, 2014, 21, 949–954 CrossRef
.
- D. J. Brooks, B. V. Merinov, W. A. Goddard, B. Kozinsky and J. Mailoa, Macromolecules, 2018, 51, 8987–8995 CrossRef CAS
.
- D. Devaux, R. Bouchet, D. Glé and R. Denoyel, Solid State Ionics, 2012, 227, 119–127 CrossRef CAS
.
- O. Borodin and G. D. Smith, Macromolecules, 2006, 39, 1620–1629 CrossRef CAS
.
- H.-S. Liu, K.-Y. Chen, C.-E. Fang and C.-C. Chiu, Electrochim. Acta, 2021, 375, 137915 CrossRef CAS
.
- J. Yu, M. Lee, Y. Kim, H.-K. Lim, J. Chae, G. S. Hwang and S. Lee, J. Power Sources, 2021, 505, 229917 CrossRef CAS
.
- Q. Liu, B. Peng, M. Shen, B. Hu and Q. Chen, Solid State Ionics, 2014, 255, 74–79 CrossRef CAS
.
- O. Borodin and G. D. Smith, J. Solution Chem., 2007, 36, 803–813 CrossRef CAS
.
- C. Deng, M. A. Webb, P. Bennington, D. Sharon, P. F. Nealey, S. N. Patel and J. J. de Pablo, Macromolecules, 2021, 54, 2266–2276 CrossRef CAS
.
- S. Li, S. Q. Zhang, L. Shen, Q. Liu, J. B. Ma, W. Lv, Y. B. He and Q. H. Yang, Adv. Sci., 2020, 7, 1903088 CrossRef CAS PubMed
.
- Y. J. Lim, H. W. Kim, S. S. Lee, H. J. Kim, J. K. Kim, Y. G. Jung and Y. Kim, ChemPlusChem, 2015, 80, 1100–1103 CrossRef CAS PubMed
.
- S. Ketabi and K. Lian, Electrochim. Acta, 2013, 103, 174–178 CrossRef CAS
.
- Y. Matsuo and J. Kuwano, Solid State Ionics, 1995, 79, 295–299 CrossRef CAS
.
- M. R. Johan, O. H. Shy, S. Ibrahim, S. M. Mohd Yassin and T. Y. Hui, Solid State Ionics, 2011, 196, 41–47 CrossRef CAS
.
- B. W. Zewde, S. Admassie, J. Zimmermann, C. S. Isfort, B. Scrosati and J. Hassoun, ChemSusChem, 2013, 6, 1400–1405 CrossRef CAS PubMed
.
- H.-M. Xiong, Z.-D. Wang, D.-P. Xie, L. Cheng and Y.-Y. Xia, J. Mater. Chem., 2006, 16, 1345–1349 RSC
.
- Y. Zhang, X. Wang, W. Feng, Y. Zhen, P. Zhao, Z. Cai and L. Li, Ionics, 2018, 25, 1471–1480 CrossRef
.
- S. R. Yeandel, B. J. Chapman, P. R. Slater and P. Goddard, J. Phys. Chem. C, 2018, 122, 27811–27819 CrossRef CAS
.
- Y. Zheng, Y. Yao, J. Ou, M. Li, D. Luo, H. Dou, Z. Li, K. Amine, A. Yu and Z. Chen, Chem. Soc. Rev., 2020, 49, 8790–8839 RSC
.
- B. W. Zewde, G. A. Elia, S. Admassie, J. Zimmermann, M. Hagemann, C. S. Isfort, B. Scrosati and J. Hassoun, Solid State Ionics, 2014, 268, 174–178 CrossRef CAS
.
- N. Boaretto, I. Garbayo, S. Valiyaveettil-SobhanRaj, A. Quintela, C. M. Li, M. Casas-Cabanas and F. Aguesse, J. Power Sources, 2021, 502, 229919 CrossRef CAS
.
- M. Ebadi, L. T. Costa, C. M. Araujo and D. Brandell, Electrochim. Acta, 2017, 234, 43–51 CrossRef CAS
.
- V. Ponce, D. E. Galvez-Aranda and J. M. Seminario, Phys. Chem. Chem. Phys., 2021, 23, 597–606 RSC
.
- Q. Li and H. Ardebili, Solid State Ionics, 2014, 268, 156–161 CrossRef CAS
.
- W. L. Jorgensen, D. S. Maxwell and J. Tirado-Rives, J. Am. Chem. Soc., 1996, 118, 11225–11236 CrossRef CAS
.
- S. Plimpton, J. Comput. Phys., 1995, 117, 1–19 CrossRef CAS
.
- F. Croce, S. Sacchetti and B. Scrosati, J. Power Sources, 2006, 162, 685–689 CrossRef CAS
.
-
K. Persson, Materials Data on Al2O3 (SG:167) by Materials Project, 2014 Search PubMed
.
- R. Khodabandeh, F. Mohammadpour, A. R. Zolghadr and A. Klein, New J. Chem., 2020, 44, 16602–16612 RSC
.
- Q. Li, H. Y. Sun, Y. Takeda, N. Imanishi, J. Yang and O. Yamamoto, J. Power Sources, 2001, 94, 201–205 CrossRef CAS
.
- M. A. K. L. Dissanayake, P. A. R. D. Jayathilaka, R. S. P. Bokalawala, I. Albinsson and B. E. Mellander, J. Power Sources, 2003, 119, 409–414 CrossRef
.
- T. P. Lodge and T. C. B. McLeish, Macromolecules, 2000, 33, 5278–5284 CrossRef CAS
.
- S. Mogurampelly and V. Ganesan, Macromolecules, 2018, 51, 9471–9483 CrossRef CAS
.
- H. Chen, D. Adekoya, L. Hencz, J. Ma, S. Chen, C. Yan, H. Zhao, G. Cui and S. Zhang, Adv. Energy Mater., 2020, 10, 2000049 CrossRef CAS
.
- K. Timachova, H. Watanabe and N. P. Balsara, Macromolecules, 2015, 48, 7882–7888 CrossRef CAS
.
Footnote |
| † Electronic supplementary information (ESI) available: Additional analysis and data (the mean square displacement in different systems, the diffusivities in the LC system, and the coordination number in different systems) are provided in the supplementary material. See DOI: 10.1039/d2ya00025c |
| This journal is © The Royal Society of Chemistry 2022 |

