 Open Access Article
Creative Commons Attribution 3.0 Unported Licence
Zinc germanium nitrides and oxide nitrides: the influence of oxygen on electronic and structural properties†
Joachim
Breternitz
 *a and
Susan
Schorr
 *ab
*ab
aHelmholtz-Zentrum Berlin für Materialien und Energie GmbH, Structure and Dynamics of Energy Materials, Hahn-Meitner-Platz 1, 14109 Berlin, Germany. E-mail: joachim.breternitz@helmholtz-berlin.de; susan.schorr@helmholtz-berlin.de
bDepartment Geosciences, Freie Universität Berlin, Malteserstraße 74-100, 12249 Berlin, Germany
First published on 25th March 2022
Abstract
Zinc containing ternary nitrides, in particular ZnSnN2 and ZnGeN2, have great potential as earth-abundant and low toxicity light-absorbing materials. The incorporation of oxygen in this system – may it be intentional or unintentional – affects the crystal structure of the materials as well as their optical band gaps. Herein, we explore the origins of structural changes between the wurtzite type and its hettotype, the β-NaFeO2 type, and highlight the effect of oxygen. Furthermore, we study the electronic structure and bonding in order to understand the reason for the narrower band gap of zinc germanium oxide nitrides as opposed to pure zinc germanium nitride.
Introduction
Solar cells are the most direct way to transform the energy from the sun, our largest energy reservoir, into immediately useable electrical energy. The development of solar cells has made big steps and solar energy is currently the cheapest form of energy available,1 mostly relying on Si wafer-based solar cells. However, silicon has some drawbacks, most prominently its indirect band gap. This affords the use of relatively thick layers of Si to achieve a good absorption of light and, hence, makes Si solar cell devices inflexible and heavy. While this is not a major problem for landside or domestic installations, other applications, such as mobile devices and aviation, need a highly efficient power supply that is also lightweight and thin. For this, alternative technologies have emerged, with CdTe having reached the commercialisation phase.2 However, many of these alternative photovoltaic absorber materials like CdTe,2–7 (In, Ga)Pn (Pn = N, P, As),8–17 Cu(In, Ga)S2![[thin space (1/6-em)]](https://www.rsc.org/images/entities/char_2009.gif) 18–21 or lead halide perovskites22–25 suffer from the inclusion of extremely scarce or toxic elements. Te (0.001 ppm), Cd (0.13 ppm), In (0.25 ppm – all by weight)26 are some of the very scarce elements that would prevent a global scale application of such materials.18 Moreover, Cd and Pb are very toxic elements, the use of which is banned in the European Union and many other countries.27
18–21 or lead halide perovskites22–25 suffer from the inclusion of extremely scarce or toxic elements. Te (0.001 ppm), Cd (0.13 ppm), In (0.25 ppm – all by weight)26 are some of the very scarce elements that would prevent a global scale application of such materials.18 Moreover, Cd and Pb are very toxic elements, the use of which is banned in the European Union and many other countries.27
Given these limitations, there is a strong drive to develop truly sustainable solar cell materials that combine the advantages of thin film solar cells with the use of non-toxic and earth abundant materials, therefore allowing for cheap and efficient solar cell devices. A viable strategy in the past has been the replacement of problematic elements by less toxic and more abundant alternatives, like the development of lead-free halide perovskite solar cells based on Sn2+.28–30 The downside of this approach is, however, that the choice of alternative elements is severely reduced as they need to show chemical and structural similarity – i.e. to replace Pb2+, one needs an element that readily forms divalent cations and has a similar coordination environment as otherwise a different phase with completely different properties may be preferable. CH3NH3NiI3 containing Ni2+, for instance, is reported to crystallise in a non-perovskite phase.31
To enlarge the window for replacing problematic elements, substituting ions with more than one species is possible. Replacing Pb2+ with equimolar amounts of Ag+ and In3+, for instance, has led us to the experimental discovery of Cs2AgInBr6.32 Applying the same concept to In3+ in InN would lead to the use of equimolar divalent and tetravalent cations, such as Zn2+ and Sn4+.33–36 This approach has been shown to work and ZnSnN2 was identified as a potential photovoltaic absorber material with reported experimental band gaps anywhere between 1–2.4 eV.36 While there have been some proof-of-concept reports for photovoltaic devices using ZnSnN2,35,37,38 the range of reported optical band gaps for nominally the same material may sound surprising at first. However, two main explanations have been discussed for this behaviour: (a) the inclusion of oxygen in the material39,40 and (b) a cation order–disorder mechanism that tunes the band gap.41,42 Both effects often occur intertwined and it is therefore necessary to briefly discuss the second one in the next section in order to understand the first. While the work on ZnSnN2 has largely relied on computational results, many more experimental studies have been performed on the lighter analogue ZnGeN2. The latter has a distinctly larger band gap in the range of 3.2 eV,43 but it has the advantage that its stability is larger due to a more negative formation energy.44 Therefore, the study of this material as a model system that is easier to study allows us to understand the phenomena in these ternary nitride compounds. Before moving to the focus on photovoltaics, ZnGeN2 and the oxide nitride materials Zn1+vGeN2Ov have been studied extensively as photocatalysts for water splitting reactions.45–50 From a chemical point-of-view, these oxide nitride materials have been rationalised as the intermixing of ZnGeN2 and ZnO.45,51,52 We have shown recently in a systematic study that the overall ammonolysis reaction of Zn2GeO4 – commonly the synthesis route for these compounds – indeed proceeds in this way.51 It needs to be emphasised, however, that this does not mean that ZnGeN2 and ZnO are mixed on a macroscopic level or form domains in some way. Instead, this is not more than a mathematical decomposition of the oxide nitride composition. Instead of the above-mentioned formula Zn1+vGeN2Ov, we will use Zn1+xGe1−x(N1−xOx)2 – a simple transformation, which emphasises on an equal number of cations and anions and retains the overall ratio of cations and anions throughout the series.51,53 Oxide nitrides have been reported to exhibit a smaller optical band gap of ≈2.7 eV as compared to that of pure ZnGeN2, but recent studies have suggested that this is particularly true for oxygen rich oxide nitrides, while oxygen poor compounds tend to have an optical band gap much closer to the 3.2 eV of pure ZnGeN2.51 This reduction has been explained as an effect of p–d orbital repulsion between the Zn(3d) and the N(2p) and O(2p) states at the valence band maximum.45,54 While p–d repulsion should, in principle, exist for pure nitrides and oxide nitrides, we aim to understand the contribution of oxygen in these oxide nitrides more thoroughly and to understand the bonding that causes the band gap decrease in the oxide nitride system Zn1+xGe1−x(N1−xOx)2.
Crystal structures of Zn1+xGe1−x(N1−xOx)2
Two principal crystal structures have been reported for oxide nitride materials: the hexagonal wurtzite type, which was observed in oxygen rich compounds55 and the orthorhombic β-NaFeO2 type, which was observed in the oxygen poor cases.53 This appears reasonable from a chemical point of view: ZnO crystallises in the wurtzite type structure, while ZnGeN2 crystallises in the β-NaFeO2 type structure.56 Assuming those phases to be extreme cases in the system, it is only logical that there should be a transition from one crystal structure to the other. The reality is, however, more complex than this. There have also been experimental reports of nominally ZnGeN2 in the wurtzite type crystal structure, which is a consequence of fully disordered cations in the system.57 To understand this, it is important to briefly emphasise the relation of these two crystal structure types.The hexagonal wurtzite type crystal structure in the space group P63mc only has one crystallographic position for cations and one for anions (both on Wyckoff site 2b). This means that this structure type does not allow for any ordering of cations or anions and they are necessarily randomly distributed. This also means that the average bonding environment in the wurtzite type structure is equal, although Zn2+ (0.55 Å) and Ge4+ (0.39 Å) have considerably different ionic radii.58 The β-NaFeO2 type structure, on the other hand, is a hettotype of the wurtzite-type structure and crystallises in the orthorhombic subgroup Pna21.59 The link is made through loss of symmetry elements, which in turns increases the degrees of freedom for the crystallographic sites and allows for the splitting of crystallographic positions. Instead of one distinct crystallographic site each for cations and anions, the β-NaFeO2 type has two cation positions and two anion positions (all on the general 4a Wyckoff site). This means that, in principle, a compound with a 1![[thin space (1/6-em)]](https://www.rsc.org/images/entities/char_2009.gif) :
:![[thin space (1/6-em)]](https://www.rsc.org/images/entities/char_2009.gif) 1 cation stoichiometry could attain fully ordered cations. In addition, these two crystallographic sites have the structural flexibility to accommodate different cation–anion bond lengths in the crystal structure.
1 cation stoichiometry could attain fully ordered cations. In addition, these two crystallographic sites have the structural flexibility to accommodate different cation–anion bond lengths in the crystal structure.
From an experimental point-of-view, the transition from the wurtzite-type to the β-NaFeO2 type can be observed in the appearance of supplementary reflections and the splitting of some peaks, which is due to the fact that the lattice constants no longer experience restrictions rendering them equal.‡ While the supplementary reflections are weak in X-ray diffraction and can easily be overlooked, the peak splitting is normally a much stronger hint for the β-NaFeO2 type (Fig. 1). It needs noting, however, that this is only a necessary prerequisite in that a and b in the orthorhombic system can differ but do not have to. Therefore, very small deviations from the ideal hexagonal lattice will still be orthorhombic but may be so subtle that they cannot be detected with the experimental resolution. Therefore, when we speak of oxide nitrides as being of the wurtzite-type, this essentially means that we have no contradicting evidence for a hettotype structure. Nonetheless, our experimental data (Fig. 1) underlines the aforementioned trend that oxygen rich oxide nitrides crystallise in the wurtzite-type and the β-NaFeO2 type is preferred for lower oxygen containing materials.
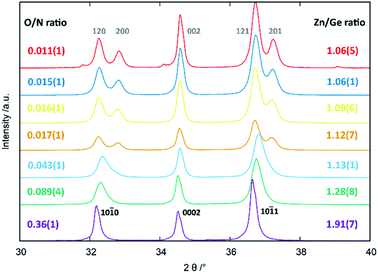 | ||
| Fig. 1 Peak splitting in the region of 30–40° 2θ as a function of Zn/Ge and O/N ratios. The hkil indices according to the hexagonal wurtzite-type structure (black, bottom) and the hkl indices according to the orthorhombic β-NaFeO2-type structure (grey, top) are given in the figure. Reprinted from ref. 51 with permission from the Royal Society of Chemistry. The original publication was published under the Creative Commons license CC BY 3.0.60 | ||
At this point, however, the complexity of ternary materials comes into play. With two crystallographic sites, order can occur, but this is not necessarily the case. While the fully ordered case (i.e. one distinct site for Zn2+ and one for Ge4+ exclusively) is energetically favoured, the energetic barrier against disorder is not large and it has been calculated that disorder affects the band gap strongly, with a decrease for disordered ZnGeN2.41,61–63 A fully disordered ZnGeN2, however, would have a random cation distribution throughout the structure, indicative of the wurtzite-type. In between cation order and full disorder, different degrees of cation disorder are possible.53 We have to distinguish between cation disorder caused by the off-stoichiometric composition of the material due to the oxygen content (Zn/Ge > 1), for which we use the term extrinsic disorder, and intrinsic disorder.53 The latter is defined by Ge on Zn and Zn on Ge anti sites in equal amounts ( ). Both disorder types can coexist in Zn1+xGe1−x(N1−xOx)2 and it is necessary to distinguish between them. Taking into account that the Zn on Ge anti sites (ZnGe) are caused by both extrinsic and intrinsic disorder, the difference
  would give a measure of the extrinsic disorder.
We recently uncovered that both disorder types exist simultaneously in zinc germanium oxide nitride, but both modes of disorder are independent of each other.53 The way intrinsic disorder affects the band gap has been thoroughly discussed, but the question remains how oxygen incorporation in the crystal structure affects the bonding and the band gap.
Sampled crystal structures in this study
We combine crystal structures experimentally obtained from Rietveld refinements of both neutron and X-ray data with DFT calculations. We have chosen three model structures for the DFT calculations in order to restrain the complexity of the system. Since our aim is to uncover the effect of oxygen incorporation, we have not introduced intrinsic disorder in the computational models. Fully ordered ZnGeN2 is hence a rather straightforward choice to evaluate the fully ordered case. We chose not to use larger supercells for the modelling of oxygen induced disorder, but restricted ourselves to the 16-atom unit cell in the β-NaFeO2 type in order to keep the positional restraints similar to those of the fully ordered case. Therefore, the composition Zn1.25Ge0.75(N0.75O0.25)2 was chosen and two different cases with the same composition but different arrangements were selected (Fig. 2). Case (a) consists of oxygen atoms that are as far away from each other as possible and with a coordination of 2 Zn atoms and 2 Ge atoms for one O atom and 3 Zn and 1 Ge for the other O atom – in line with the overall composition of the compound. Case (b), on the other hand, maximises the Zn–O bonding, as we determined earlier that crystal structures with a greater amount of Zn–O bonds tend to be more stable.51 Both O atoms are surrounded by 3 Zn and 1 Ge. In addition, we compare these cases with three samples we studied experimentally using neutron diffraction to determine the levels of extrinsic and intrinsic disorder.53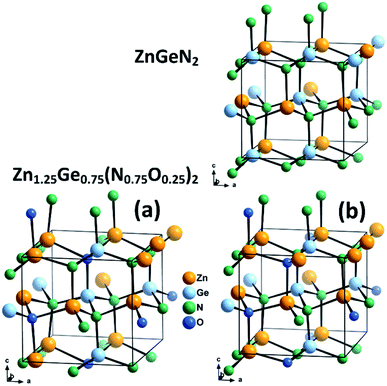 | ||
| Fig. 2 Optimised crystal structures of ZnGeN2 (top) and the two models of Zn1.25Ge0.75(N0.75O0.25)2 (bottom). | ||
The optimised crystal structures are slightly larger than the experimental ones, as expected for calculations using the PBE functional, but with volume deviations below 3% (Table 1). The deviation of the crystal structures from the ideal hexagonal setting, however, as expressed by α, is comparable to the highly ordered cases and significantly larger than for Zn1.29(1)Ge0.71(1)(N0.71(1)O0.29(1))2, which contains both a large degree of intrinsic and extrinsic disorder. Furthermore, the oxygen rich oxide nitrides show a larger unit cell, which is consistent in computations and experiments. This hints that the volume increase is mainly caused by greater amounts of Zn and O, while the lattice parameter deviation is caused by disorder (intrinsic and extrinsic).
 is indicative of intrinsic disorder in the sample and the difference
  corresponds to the extrinsic disorder in the sample
| Composition | A/Å | B/Å | C/Å | V/Å3 | A/% | |||
|---|---|---|---|---|---|---|---|---|
| Zn1.04(1)Ge0.96(1)(N0.94(1)O0.06(1))2 | Exp. | 5.464(1) | 6.443(1) | 5.188(1) | 182.62(1) | 1.87(9) | 0.01(2) | 0.04(1) |
| Zn1.05(1)Ge0.95(1)(N0.95(1)O0.05(1))2 | 5.487(1) | 6.422(1) | 5.192(1) | 182.96(1) | 1.21(9) | 0.23(8) | 0.05(1) | |
| Zn1.29(1)Ge0.71(1)(N0.71(1)O0.29(1))2 | 5.549(1) | 6.427(1) | 5.197(1) | 185.35(1) | 0.27(9) | 0.24(6) | 0.29(1) | |
| ZnGeN2 | Calc. | 5.50252 | 6.48303 | 5.24209 | 187.001 | 1.79 | 0 | 0 |
| Zn1.25Ge0.75(N0.75O0.25)2 (A) | 5.56905 | 6.54043 | 5.26973 | 191.945 | 1.51 | 0 | 0.25 | |
| Zn1.25Ge0.75(N0.75O0.25)2 (B) | 5.54968 | 6.51646 | 5.26688 | 190.473 | 1.49 | 0 | 0.25 |
Bond valence analysis of Zn1+xGe1−x(N1−xOx)2
Zn1.25Ge0.75(N0.75O0.25)2 in configuration (b) is slightly more stable, with an energy difference of 122.6 meV/f.u. This is in line with our prior findings that Zn–O bonding appears to be preferred.51 We will, however discuss both cases further, since the bonding situation is slightly different and can give some insight into the chemical nature of the bonding.The bond valence concept mainly developed by Brown and O’Keeffe64–67 solely uses atomic distances to determine the properties of chemical bonds and defines expected distances for atomic pairs in the defined chemical environment. This can be simply achieved by partitioning the valence (i.e. the charge) of the cations on the four bonds to the cations it is surrounded by. The expected values for the Zn–N and Zn–O distances are consistently longer than those for the Ge–N and Ge–O distances (Fig. 3). Taking the PBE related elongations into account, the Zn–N and Ge–N distances in the optimised structures are very consistent with the expected values from the bond valence model, but scatter relatively strongly (Fig. 4 and 5). The Zn–O and Ge–O distances, however, are consistently longer than the expected values.
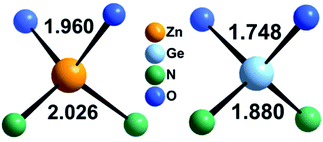 | ||
| Fig. 3 Expected values for the bond lengths of Zn2+ and Ge4+ in tetrahedral coordination as derived from bond valence sums.66 | ||
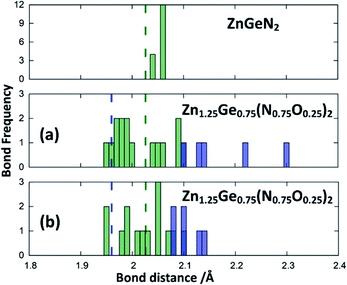 | ||
| Fig. 4 Zn–N (green) and Zn–O (blue) distances from the structure optimisations of the crystal structures for ZnGeN2 (top) and the two configurations of Zn1.25Ge0.75(N0.75O0.25)2, as depicted in Fig. 2. The expected distances from the bond valences are given as dashed lines. | ||
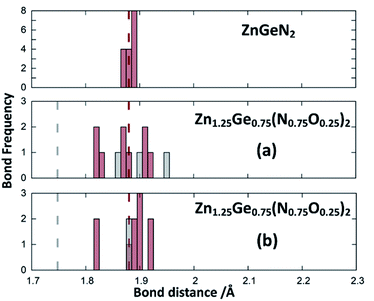 | ||
| Fig. 5 Ge–N (red) and Ge–O (grey) distances from the structure optimisations of the crystal structures for ZnGeN2 (top) and the two configurations of Zn1.25Ge0.75(N0.75O0.25)2 as depicted in Fig. 2. The expected distances from bond valences are given as dashed lines. | ||
This can be interpreted in a way that the energetic contribution of those bonds is lower than those of the Ge–N and Zn–N bonds. The same analysis is not directly possible for the experimentally derived crystal structures as the disorder for cations and anions restricts the distances to be the same. In those structures with strong cation ordering, however, the distances between the Zn site and its surrounding anions (1.99(2) Å < dZn–X < 2.07(2) Å) and the Ge site and its surrounding anions (1.85(1) Å < dGe–X < 1.93(1) Å) are distinctly different from each other and lie very much in the range of Zn–N and Ge–N bonds. The anisotropy between the different bond lengths is smaller for highly disordered experimental samples, in line with the decreasing lattice deviation in those samples. Although the oxide nitrides are generally more stable than pure nitrides, the comparably longer Zn–O and Ge–O bonds do not appear to stabilise zinc germanium oxide nitride.
Band gap and density of states
While the GGA treatment with the PBE functional along with Gaussian smearing to obtain the DOS leads to a serious underestimation of the absolute band gap size, its general trends are more reliable. The band gap energies extracted from the DOS are 1.5 eV for ZnGeN2 and 0.4 eV for Zn1.25Ge0.75(N0.75O0.25)2. We note that this is very in line with the general trend of a decreasing band gap with increasing oxygen content.43,51 Our calculations can therefore give an important hint as to how the introduction of oxygen in the system shifts the band gap levels. The conduction band minimum (CBM) is approximately equally contributed between the constituent elements, signifying that the contributing electronic states are probably largely degenerated. Furthermore, the shapes of the conduction band are largely similar for the pure nitride and the oxide nitrides, suggesting that the change of composition has little influence on it.In a comprehensive theory by Wei and Zunger first derived for II–V semiconductor materials,54 the reduction in the band gap energy is explained through p–d repulsion, i.e. an orbital overlap between the hybridised cation 4p states and anion 2p states with the cation 3d states, which leads to a further energy splitting and raises the antibonding orbitals that are situated at the top of the valence band. We have calculated the density of states (DOS) and projected DOS (pDOS) to verify which states form the valence band maximum (VBM). Indeed, the contributions at the VBM in the oxide nitride system are dominated by the Zn(3d), O(2p) and N(2p) contributions and a little Zn(3p) contribution (Fig. 6 and ESI†).
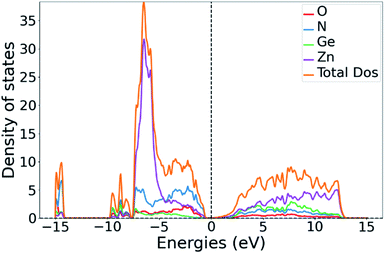 | ||
| Fig. 6 Total DOS of Zn1.25Ge0.75(N0.75O0.25)2 (b) with the partial DOS contributions for the constituent elements. | ||
The same is true for ZnGeN2, but with a general downwards shift of the states with respect to the Fermi level. This alone does, however, not allow a definitive answer as to whether the VBM increases or the conduction band minimum decreases. In order to gain a hint of this, we investigate the energy difference between the N(2s) and N(2p) band onsets on a specific N atom in the different structures. This can be done assuming that the N(2s) states are largely unaffected by any p–d repulsion and are not strongly influenced by the chemical environment as their contribution to bonding is small (Fig. 7). The energy difference between the band onsets, i.e., the highest energy levels between N(2s) and N(2p) are ΔE(ZnGeN2) = 13.26 eV versus ΔE(Zn1.25Ge0.75(N0.75O0.25)2) = 13.52 eV for (a) and 13.62 eV for (b). This is a clear indication of the fact that the VBM is shifted to higher energies, explaining the reduction of the band gap energy in the oxide nitride materials. It is noteworthy that the oxygen 2p levels lie in the same range and also contribute to the upper valence band, while the O(2s) levels lie significantly lower than the respective N(2s) levels. The energetic levels of the Zn(3d) states show a narrow distribution and are close to the N(2p) and O(2p) states. This is a prerequisite for the orbital overlap that leads to p–d repulsion. We note that the Ge(3d) states are significantly lower – at −25 eV relative to the band gap – and hence are even lower than the N(2s) and O(2s) states. This prevents orbital overlap including these Ge(3d) states and p–d-repulsion is therefore exclusive to Zn containing bonding. However, one would expect p–d repulsion both for nitrides and oxide nitrides and it is hence important to look at the individual bonding contributions to understand why the upwards shift of the VBM in the latter is stronger than for pure ZnGeN2.
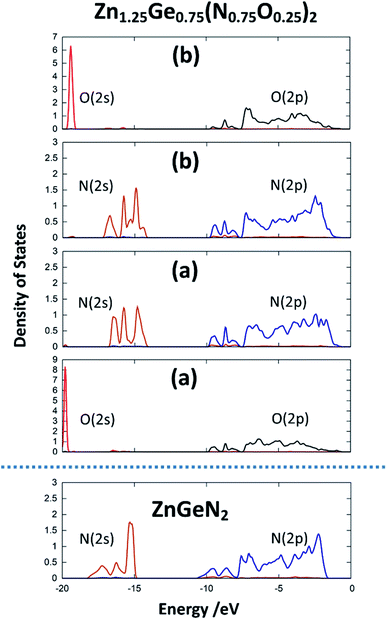 | ||
| Fig. 7 pDOS for the 2s and 2p orbitals for one selected nitrogen and oxygen atom in the crystal structures for ZnGeN2 and the two configurations of Zn1.25Ge0.75(N0.75O0.25)2, as depicted in Fig. 2. | ||
Bonding situation analysis
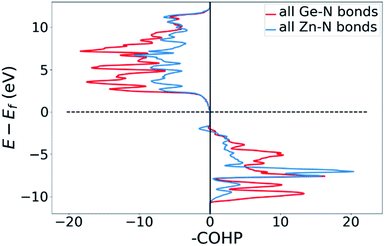
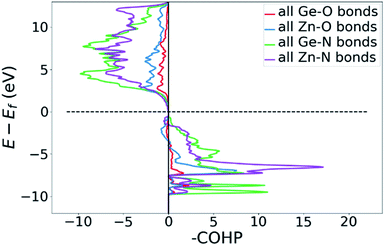
DOS and pDOS allow a detailed discussion of the atomic distribution to energy states around the band gap, but they contain little information on the nature of the chemical bonds between atoms. For this, we employ crystal orbital overlap Hamilton population (COHP)68,69 analysis to rationalise the energetic contribution of the chemical bonds and reveal the character of the contributions as bonding or antibonding. Projecting the COHP on individual bonds (pCOHP) allows us to draw direct conclusions for individual bonds. By convention, we plot −COHP with antibonding states on the left and bonding states on the right-hand side of the plot.The populated energy levels of the Ge–N bonds in ZnGeN2 all have a bonding character stabilising the crystal structure (Fig. 8). This is in line with the fact that those bonds are formed by the Ge(4p) orbitals and the N(2p) orbitals and hence would not be prone to p–d-repulsion. In contrast, the COHP of the Zn–N interactions clearly shows antibonding behaviour at the VBM, in line with the p–d repulsion model. The trend in the oxygen containing crystal structures is similar (Fig. 9), with Ge–N bonds still being bonding throughout the valence band. The antibonding contribution of the Zn–N bonds is accompanied by antibonding contributions from the Zn–O and Ge–O bonds. It is, however, noteworthy that the Zn–O antibonding states lie energetically below the antibonding Zn–N states, which suggests that the orbital splitting caused by p–d repulsion is smaller, since the positions of the O(2p) and N(2p) orbitals are otherwise very similar (Fig. 7). Therefore, oxygen does not directly cause the upshift of the valence band maximum but has an indirect effect. Given that Zn–O bond lengths are shorter than Zn–N bond lengths, the geometry of the coordination environment around Zn that contains both anion types is strongly distorted from an ideal tetrahedron, causing non-ideal bonding distances and angles. This, in turn, can affect the energy levels of the Zn–N bonds, causing an upwards shift of the energy levels involved.
Materials and methods
The experimental data was extracted from previous work. Details of the synthesis and characterisation can be found elsewhere.51,53,55 The “universal” bond valence parameters derived by Brese and O’Keeffe were used for the calculations herein.66DFT calculations were performed using Quantum Espresso v6.570–72 with the projector augmented wave (PAW) method73,74 using GGA functionals with scalar-relativistic PBE-type exchange–correlation functionals with non-linear core correction.75,76 The pseudopotentials were retrieved from pslibrary77 and produced using atomic.78 The wavefunction cutoff was chosen to be 50 Ry and the charge density cutoff was chosen to be 325 Ry. Structural optimisations were performed using a 3 × 3 × 3 k-point grid and a BFGS algorithm. The unit cell was constrained during optimisation to remain orthonormal.
SCF calculations for DOS and COHP calculations were performed on a 12 × 12 × 12 k-point grid and an energy convergence threshold of 10−9. In order to permit the density partitioning, 104 bands were converged during the SCF calculation, reflecting the 104 orbitals used for portioning (8 × N/O(2s2pxpypz) + 8 × Zn/Ge(4s4pxpypz3dxydxzdyzdz2dx2−y2)).
DOS and COHP calculations were performed using LOBSTER 4.1.0 (ref. 79 and 80) with a Gaussian smearing width of 0.1 eV with the pbeVaspFit2015 basis set.79 COHP and DOS plots were obtained using pymatgen.81
Conclusions
The incorporation of oxygen in the crystal structure of zinc germanium oxide nitrides leads to a narrowing of the band gap. We have explored the structural consequences of the introduction of oxygen in this system to uncover which effects it has and this can be decorrelated from the intrinsic disorder. While experimental samples with high oxygen content also show a high degree of intrinsic disorder, oxygen incorporation alone was studied using DFT calculations. The latter still shows significant deviation of the lattice constants from the hexagonal wurtzite type, while experimental compounds with a similar compositions show unit cell parameters much closer to the hexagonal lattice constants. Therefore, it is concluded that the interplay of intrinsic and extrinsic disorder causes this behaviour, rather than one mechanism alone. Using DOS and COHP analyses, we have further shown that the narrowing of the band gap in oxide nitride materials is caused by increasing the p–d repulsion effect as a consequence of deviating from the coordination environments of Zn.Author contributions
J. B. designed the study, conducted the calculations and did the initial data treatment. Su. S. and J. B. discussed the results and J. B. wrote the manuscript with input from Su. S.Conflicts of interest
There are no conflicts to declare.Acknowledgements
The authors acknowledge Zhenyu Wang for the synthesis and analysis of the experimental data.Notes and references
- Solar is now ‘cheapest electricity in history’, confirms IEA, https://www.carbonbrief.org/solar-is-now-cheapest-electricity-in-history-confirms-iea, accessed February 6, 2022 Search PubMed.
- R. M. Geisthardt, M. Topic and J. R. Sites, IEEE J. Photovolt., 2015, 5, 1217–1221 Search PubMed.
- M. Gloeckler, I. Sankin and Z. Zhao, IEEE J. Photovolt., 2013, 3, 1389–1393 Search PubMed.
- C. S. Ferekides, D. Marinskiy, V. Viswanathan, B. Tetali, V. Palekis, P. Selvaraj and D. L. Morel, Thin Solid Films, 2000, 361–362, 520–526 CrossRef CAS.
- A. Romeo, M. Terheggen, D. Abou-Ras, D. L. Bätzner, F.-J. Haug, M. Kälin, D. Rudmann and A. N. Tiwari, Prog. Photovoltaics Res. Appl., 2004, 12, 93–111 CrossRef CAS.
- V. D. Novruzov, N. M. Fathi, O. Gorur, M. Tomakin, A. I. Bayramov, S. Schorr and N. Mamedov, Phys. Status Solidi A, 2010, 207, 730–733 CrossRef CAS.
- L. Kranz, S. Buecheler and A. N. Tiwari, Sol. Energy Mater. Sol. Cells, 2013, 119, 278–280 CrossRef CAS.
- X. Cai, S. Zeng and B. Zhang, Appl. Phys. Lett., 2009, 95, 173504 CrossRef.
- R. Dahal, B. Pantha, J. Li, J. Y. Lin and H. X. Jiang, Appl. Phys. Lett., 2009, 94, 063505 CrossRef.
- R.-H. Horng, S.-T. Lin, Y.-L. Tsai, M.-T. Chu, W.-Y. Liao, M.-H. Wu, R.-M. Lin and Y.-C. Lu, IEEE Electron Device Lett., 2009, 30, 724–726 CAS.
- O. Jani, I. Ferguson, C. Honsberg and S. Kurtz, Appl. Phys. Lett., 2007, 91, 132117 CrossRef.
- T. Takamoto, E. Ikeda, H. Kurita and M. Ohmori, Appl. Phys. Lett., 1997, 70, 381–383 CrossRef CAS.
- T. Takamoto, E. Ikeda, H. Kurita and M. Ohmori, in Proceedings of 1994 IEEE 1st World Conference on Photovoltaic Energy Conversion – WCPEC (A Joint Conference of PVSC, PVSEC and PSEC), 1994, vol. 2, pp. 1729–1732 Search PubMed.
- T. Takamoto, M. Kaneiwa, M. Imaizumi and M. Yamaguchi, Prog. Photovoltaics Res. Appl., 2005, 13, 495–511 CrossRef CAS.
- N. J. Ekins-Daukes, K. W. J. Barnham, J. P. Connolly, J. S. Roberts, J. C. Clark, G. Hill and M. Mazzer, Appl. Phys. Lett., 1999, 75, 4195–4197 CrossRef CAS.
- N. Dharmarasu, M. Yamaguchi, A. Khan, T. Yamada, T. Tanabe, S. Takagishi, T. Takamoto, T. Ohshima, H. Itoh, M. Imaizumi and S. Matsuda, Appl. Phys. Lett., 2001, 79, 2399–2401 CrossRef CAS.
- J. M. Zahler, K. Tanabe, C. Ladous, T. Pinnington, F. D. Newman and H. A. Atwater, Appl. Phys. Lett., 2007, 91, 012108 CrossRef.
- C. Candelise, M. Winskel and R. Gross, Prog. Photovoltaics Res. Appl., 2012, 20, 816–831 CrossRef.
- Y.-C. Wang, T.-T. Wu and Y.-L. Chueh, Mater. Chem. Phys., 2019, 234, 329–344 CrossRef CAS.
- Y. Zhao, S. Yuan, D. Kou, Z. Zhou, X. Wang, H. Xiao, Y. Deng, C. Cui, Q. Chang and S. Wu, ACS Appl. Mater. Interfaces, 2020, 12, 12717–12726 CrossRef CAS PubMed.
- M. Theelen and F. Daume, Sol. Energy, 2016, 133, 586–627 CrossRef CAS.
- G. Hodes, Science, 2013, 342, 317–318 CrossRef CAS PubMed.
- M. A. Green, A. Ho-Baillie and H. J. Snaith, Nat. Photonics, 2014, 8, 506–514 CrossRef CAS.
- A.-F. Castro-Méndez, J. Hidalgo and J.-P. Correa-Baena, Adv. Energy Mater., 2019, 9, 1901489 CrossRef.
- G. Hodes and D. Cahen, Nat. Photonics, 2014, 8, 87–88 CrossRef CAS.
- A. A. Yaroshevsky, Geochem. Int., 2006, 44, 48–55 CrossRef.
- Directive 2011/65/EU of the European Parliament and of the Council of 8 June 2011 on the restriction of the use of certain hazardous substances in electrical and electronic equipment Text with EEA relevance, 2011, vol. 174 Search PubMed.
- F. Giustino and H. J. Snaith, ACS Energy Lett., 2016, 1, 1233–1240 CrossRef CAS.
- A. Abate, Joule, 2017, 1, 659–664 CrossRef CAS.
- L. Liang and P. Gao, Adv. Sci., 2018, 5, 1700331 CrossRef PubMed.
- D. Ramirez, F. Jaramillo, S. Pérez-Walton and J. M. Osorio-Guillén, J. Chem. Phys., 2018, 148, 244703 CrossRef PubMed.
- J. Breternitz, S. Levcenko, H. Hempel, G. Gurieva, A. Franz, A. Hoser and S. Schorr, JPhys Energy, 2019, 1, 025003 CrossRef CAS.
- N. Feldberg, B. Keen, J. D. Aldous, D. O. Scanlon, P. A. Stampe, R. J. Kennedy, R. J. Reeves, T. D. Veal and S. M. Durbin, in 2012 38th IEEE Photovoltaic Specialists Conference, IEEE, 2012 Search PubMed.
- S. Nakatsuka, N. Yuzawa, J. Chantana, T. Minemoto and Y. Nose, Phys. Status Solidi A, 2017, 214, 1600650 CrossRef.
- K. Javaid, J. Yu, W. Wu, J. Wang, H. Zhang, J. Gao, F. Zhuge, L. Liang and H. Cao, Phys. Status Solidi RRL, 2018, 12, 1700332 CrossRef.
- I. S. Khan, K. N. Heinselman and A. Zakutayev, J. Phys. Energy, 2020, 2, 032007 CrossRef CAS.
- K. Javaid, W. Wu, J. Wang, J. Fang, H. Zhang, J. Gao, F. Zhuge, L. Liang and H. Cao, ACS Photonics, 2018, 5, 2094–2099 CrossRef CAS.
- R. Qin, H. Cao, L. Liang, Y. Xie, F. Zhuge, H. Zhang, J. Gao, K. Javaid, C. Liu and W. Sun, Appl. Phys. Lett., 2016, 108, 142104 CrossRef.
- X. Cao, F. Kawamura, Y. Ninomiya, T. Taniguchi and N. Yamada, Sci. Rep., 2017, 7, 14987 CrossRef PubMed.
- X. Cao, F. Kawamura, T. Taniguchi and N. Yamada, BMC Mater., 2020, 2, 4 CrossRef.
- M. S. Haseman, M. R. Karim, D. Ramdin, B. A. Noesges, E. Feinberg, B. H. D. Jayatunga, W. R. L. Lambrecht, M. Zhu, J. Hwang, K. Kash, H. Zhao and L. J. Brillson, J. Appl. Phys., 2020, 127, 135703 CrossRef CAS.
- A. L. Greenaway, C. L. Melamed, M. B. Tellekamp, R. Woods-Robinson, E. S. Toberer, J. R. Neilson and A. C. Tamboli, Annu. Rev. Mater. Res., 2021, 51, 591–618 CrossRef CAS.
- C. L. Melamed, M. B. Tellekamp, J. S. Mangum, J. D. Perkins, P. Dippo, E. S. Toberer and A. C. Tamboli, Phys. Rev. Mater., 2019, 3, 051602 CrossRef CAS.
- W. Sun, C. J. Bartel, E. Arca, S. R. Bauers, B. Matthews, B. Orvañanos, B.-R. Chen, M. F. Toney, L. T. Schelhas, W. Tumas, J. Tate, A. Zakutayev, S. Lany, A. M. Holder and G. Ceder, Nat. Mater., 2019, 18, 732–739 CrossRef CAS PubMed.
- Y. Lee, H. Terashima, Y. Shimodaira, K. Teramura, M. Hara, H. Kobayashi, K. Domen and M. Yashima, J. Phys. Chem. C, 2007, 111, 1042–1048 CrossRef CAS.
- K. Maeda and K. Domen, MRS Bull., 2011, 36, 25–31 CrossRef CAS.
- Y. Lee, K. Teramura, M. Hara and K. Domen, Chem. Mater., 2007, 19, 2120–2127 CrossRef CAS.
- K. Takanabe, T. Uzawa, X. Wang, K. Maeda, M. Katayama, J. Kubota, A. Kudo and K. Domen, Dalton Trans., 2009, 10055–10062 RSC.
- F. Tessier, P. Maillard, Y. Lee, C. Bleugat and K. Domen, J. Phys. Chem. C, 2009, 113, 8526–8531 CrossRef CAS.
- X. Wang, K. Maeda, Y. Lee and K. Domen, Chem. Phys. Lett., 2008, 457, 134–136 CrossRef CAS.
- Z. Y. Wang, D. Fritsch, S. Berendts, M. Lerch, J. Breternitz and S. Schorr, Chem. Sci., 2021, 12, 8493–8500 RSC.
- P. Bacher, G. Roult, M. Ghers, O. Merdrignac, J. Guyader and Y. Laurent, Mater. Chem. Phys., 1989, 21, 223–235 CrossRef CAS.
- J. Breternitz, Z. Y. Wang, A. Franz, S. Savvin, D. M. Többens and S. Schorr, in preparation.
- S.-H. Wei and A. Zunger, Phys. Rev. B: Condens. Matter Mater. Phys., 1988, 37, 8958–8981 CrossRef CAS PubMed; S.-H. Wei and A. Zunger, J. Appl. Phys., 1995, 78, 3846–3856 CrossRef.
- J. Breternitz, Z. Y. Wang, A. Glibo, A. Franz, M. Tovar, S. Berendts, M. Lerch and S. Schorr, Phys. Status Solidi A, 2019, 216, 1800885 CrossRef.
- M. Wintenberger, M. Maunaye and Y. Laurent, Mater. Res. Bull., 1973, 8, 1049–1053 CrossRef CAS.
- W. L. Larson, H. P. Maruska and D. A. Stevenson, J. Electrochem. Soc., 1974, 121, 1673 CrossRef CAS.
- R. D. Shannon, Acta Crystallogr., Sect. A, 1976, 32, 751–767 CrossRef.
- J. Breternitz and S. Schorr, Acta Crystallogr., Sect. A, 2021, 77, 208–216 CrossRef CAS PubMed.
- Creative Commons — Attribution 3.0 Unported — CC BY 3.0, https://creativecommons.org/licenses/by/3.0/, accessed February 4, 2022.
- J. J. Cordell, J. Pan, A. C. Tamboli, G. J. Tucker and S. Lany, Phys. Rev. Mater., 2021, 5, 024604 CrossRef CAS.
- D. Skachkov, P. C. Quayle, K. Kash and W. R. L. Lambrecht, Phys. Rev. B, 2016, 94, 205201 CrossRef.
- C. L. Melamed, J. Pan, A. Mis, K. Heinselman, R. R. Schnepf, R. Woods-Robinson, J. J. Cordell, S. Lany, E. S. Toberer and A. C. Tamboli, J. Mater. Chem. C, 2020, 8, 8736–8746 RSC.
- I. D. Brown, Acta Crystallogr., Sect. B: Struct. Crystallogr. Cryst. Chem., 1977, 33, 1305–1310 CrossRef.
- M. O’Keefe and N. E. Brese, J. Am. Chem. Soc., 1991, 113, 3226–3229 CrossRef.
- N. E. Brese and M. O’Keeffe, Acta Crystallogr., Sect. B: Struct. Crystallogr. Cryst. Chem., 1991, 47, 192–197 CrossRef.
- I. D. Brown, Chem. Rev., 2009, 109, 6858–6919 CrossRef CAS PubMed.
- R. Dronskowski and P. E. Bloechl, J. Phys. Chem., 1993, 97, 8617–8624 CrossRef CAS.
- V. L. Deringer, A. L. Tchougréeff and R. Dronskowski, J. Phys. Chem. A, 2011, 115, 5461–5466 CrossRef CAS PubMed.
- S. Scandolo, P. Giannozzi, C. Cavazzoni, S. de Gironcoli, A. Pasquarello and S. Baroni, Z. Kristallogr. – Cryst. Mater., 2005, 220, 574–579 CrossRef CAS.
- P. Giannozzi, S. Baroni, N. Bonini, M. Calandra, R. Car, C. Cavazzoni, D. Ceresoli, G. L. Chiarotti, M. Cococcioni, I. Dabo, A. D. Corso, S. de Gironcoli, S. Fabris, G. Fratesi, R. Gebauer, U. Gerstmann, C. Gougoussis, A. Kokalj, M. Lazzeri, L. Martin-Samos, N. Marzari, F. Mauri, R. Mazzarello, S. Paolini, A. Pasquarello, L. Paulatto, C. Sbraccia, S. Scandolo, G. Sclauzero, A. P. Seitsonen, A. Smogunov, P. Umari and R. M. Wentzcovitch, J. Phys.: Condens. Matter, 2009, 21, 395502 CrossRef PubMed.
- P. Giannozzi, O. Andreussi, T. Brumme, O. Bunau, M. B. Nardelli, M. Calandra, R. Car, C. Cavazzoni, D. Ceresoli, M. Cococcioni, N. Colonna, I. Carnimeo, A. D. Corso, S. de Gironcoli, P. Delugas, R. A. DiStasio, A. Ferretti, A. Floris, G. Fratesi, G. Fugallo, R. Gebauer, U. Gerstmann, F. Giustino, T. Gorni, J. Jia, M. Kawamura, H.-Y. Ko, A. Kokalj, E. Küçükbenli, M. Lazzeri, M. Marsili, N. Marzari, F. Mauri, N. L. Nguyen, H.-V. Nguyen, A. Otero-de-la-Roza, L. Paulatto, S. Poncé, D. Rocca, R. Sabatini, B. Santra, M. Schlipf, A. P. Seitsonen, A. Smogunov, I. Timrov, T. Thonhauser, P. Umari, N. Vast, X. Wu and S. Baroni, J. Phys.: Condens. Matter, 2017, 29, 465901 CrossRef CAS PubMed.
- P. E. Blöchl, Phys. Rev. B: Condens. Matter Mater. Phys., 1994, 50, 17953–17979 CrossRef PubMed.
- G. Kresse and D. Joubert, Phys. Rev. B: Condens. Matter Mater. Phys., 1999, 59, 1758–1775 CrossRef CAS.
- J. P. Perdew, K. Burke and M. Ernzerhof, Phys. Rev. Lett., 1996, 77, 3865–3868 CrossRef CAS PubMed.
- J. P. Perdew, K. Burke and M. Ernzerhof, Phys. Rev. Lett., 1997, 78, 1396 CrossRef CAS.
- Pseudo search results – QUANTUMESPRESSO, http://pseudopotentials.quantum-espresso.org/legacy_tables/ps-library/zn, accessed February 6, 2022 Search PubMed.
- A. Dal Corso, Comput. Mater. Sci., 2014, 95, 337–350 CrossRef CAS.
- S. Maintz, V. L. Deringer, A. L. Tchougréeff and R. Dronskowski, J. Comput. Chem., 2016, 37, 1030–1035 CrossRef CAS PubMed.
- R. Nelson, C. Ertural, J. George, V. L. Deringer, G. Hautier and R. Dronskowski, J. Comput. Chem., 2020, 41, 1931–1940 CrossRef CAS PubMed.
- S. P. Ong, W. D. Richards, A. Jain, G. Hautier, M. Kocher, S. Cholia, D. Gunter, V. L. Chevrier, K. A. Persson and G. Ceder, Comput. Mater. Sci., 2013, 68, 314–319 CrossRef CAS.
Footnotes |
| † Electronic supplementary information (ESI) available: Supplementary DOS and COHP plots. Input files for the calculations are available via Zenodo DOI: 10.5281/zenodo.6066232. See DOI: 10.1039/d2fd00041e |
| ‡ In fact, the lattice constants a and b in the orthorhombic β-NaFeO2 type are not equal to each other in the case of total overlap, but rather have a ratio of a/b = 2/√3. This is due to the change of the crystal system from hexagonal to orthorhombic. We have discussed the crystallographic bases in more detail elsewhere.59 |
| This journal is © The Royal Society of Chemistry 2022 |


