 Open Access Article
Nanoscopic insights into the surface conformation of neurotoxic amyloid β oligomers†
Martina Banchellia,
Roberta Cascella b,
Cristiano D'Andrea
 a,
Leszek Cabajc,
Iacopo Osticiolia,
Daniele Ciofinia,
Mai Suan Li
 de,
Krzysztof Skupieńc,
Marella de Angelisa,
Salvatore Sianoa,
Cristina Cecchi
 b,
Roberto Pinia,
Giovanni La Penna
 f,
Fabrizio Chiti
 *b and
Paolo Matteini
 *a
*a
aInstitute of Applied Physics “Nello Carrara”, National Research Council, Via Madonna Del Piano 10, I-50019 Sesto Fiorentino, Italy. E-mail: p.matteini@ifac.cnr.it
bDepartment of Experimental and Clinical Biomedical Sciences, University of Florence, Viale Morgagni 50, I-50134 Firenze, Italy. E-mail: fabrizio.chiti@unifi.it
c3D-Nano, 30-702 Kraków, Poland
dInstitute of Physics, Polish Academy of Sciences, Al.Lotnikow 32/46, 02-668 Warsaw, Poland
eInstitute for Computational Science and Technology, SBI Building, Quang Trung Software City, Tan Chanh Hiep Ward, District 12, Ho Chi Minh City, Vietnam
fInstitute of Chemistry of Organometallic Compounds, National Research Council, Via Madonna Del Piano 10, I-50019 Sesto Fiorentino, Italy
First published on 8th June 2020
Abstract
Raman spectroscopy assisted by localized plasmon resonances generating effective hot spots at the gaps between intertwined silver nanowires is herein adopted to unravel characteristic molecular motifs on the surface of Aβ42 misfolded oligomers that are critical in driving intermolecular interactions in neurodegeneration.
Introduction
The progressive accumulation of aberrant amyloid protein aggregates ultimately forming insoluble deposits and brain plaques and containing large amounts of amyloid β-peptide (Aβ) is one of the pathological hallmarks of Alzheimer's disease (AD). The complex pathways of amyloid protein aggregation involve a large variety of polymorphic prefibrillar Aβ42 assemblies, which can be transient or equilibrated in their biological environment.1,2 In recent years, research has extensively remarked upon the association between small soluble oligomeric forms of misfolded Aβ42 and the synaptic dysfunction occurring at the stage of the first symptoms of cognitive impairment, arising some years before the appearance of brain plaques.3 Key determinants of the neurotoxicity of Aβ42 linked to the development of AD appear to be envisaged in the complex interplay between these oligomeric forms and neuronal membranes, as demonstrated by various authors.4,5Oligomer size has been a very important determinant of oligomer toxicity: an increase in size, in the absence of other physicochemical changes, has been well documented to reduce oligomer cytotoxicity.6,7 This reduction is attributable to the decrease in the surface to volume ratio of the aggregates, and to a lower diffusibility of the oligomers, which limit their interaction with the cellular membrane. Solvent-exposed hydrophobicity is another well-recognized key determinant of oligomer cytotoxicity, with hydrophobic oligomers found to be more toxic.8–12 This higher cellular toxicity can be explained by their higher affinity for cell membranes induced by the increase of solvent-exposed hydrophobicity on the surface of the oligomers.
However, the lack of identification of other factors and of a precise understanding of the structure of Aβ42 oligomers in relation to their cytotoxicity represents a main bottleneck toward unravelling the exact membrane-associated mechanisms of toxicity. Ultimately, revealing aberrant structures and conformational states adopted by Aβ42 in these oligomers appears essential for the development of novel diagnostic and therapeutic strategies of AD.
Raman scattering spectroscopy and related plasmon-enhanced techniques represent a powerful tool to gain insights into the chemistry and structure of a molecular species complementing or overcoming conventional techniques such as NMR spectroscopy and X-ray crystallography.13,14 In particular, plasmon-enhanced Raman techniques such as surface-enhanced Raman spectroscopy (SERS) and tip-enhanced Raman spectroscopy (TERS) are gaining popularity in the analysis of biomolecules by enabling both their label-free detection with spectral fingerprint information and an in-depth structural characterization.15,16 Raman investigations proposed so far in the context of Aβ42 characterization have been mainly focused on the analysis of the variations in the molecular structure of model systems of short and long amyloid fibrils, showing that the latter contain markedly more β-sheet structures than the former.17,18 Attempts to detect the Aβ40 isoform (another major form of Aβ) in different conformational states were made through a SERS nanofluidic device.19 We have recently addressed the issue of a discrimination between toxic and non-toxic forms of misfolded HypF-N protein (a model system of Aβ) oligomers by TERS, pointing out to a significant higher content of hydrophobic aromatic amino acid residues at the surface of the toxic form respect to the non-toxic one.20
In this work we capitalized on SERS coupled with a intertwined silver nanowires (AgNWs)-based platform for sensitive inspection from the most superficial layers of Aβ species to identify structural motifs that are characteristic of the toxic forms finally providing potential diagnostic fingerprints and drug targets for AD.
Results and discussion
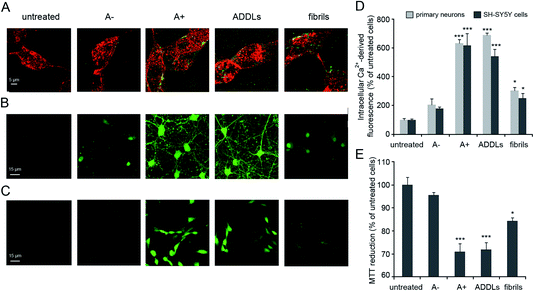
Our analysis focused on synthetic Aβ42 oligomers that can be obtained at micromolar concentration according to simple procedures and in forms able to express neurotoxic effects in vitro as well as in vivo environments in a way matching the behaviour of real species.9 A couple of cytotoxic/non-cytotoxic forms of Aβ42 oligomers (here termed as A+ and A−, respectively) and fibrils as obtained by incubation of solubilized Aβ42 monomer over increasing times in PBS under different conditions10 as well as amyloid-beta derived diffusible ligands (ADDLs) oligomers resembling those found in the brain of AD patients21 were considered in our experiments.The identities of Aβ42 oligomers were confirmed10,21 by immunoblot analysis (Fig. S1A and S1B, ESI†) while AFM revealed that these oligomers share an average ∼4 nm size and a globular shape (Fig. S1C, ESI†). The ability of the different Aβ42 conformers to interact with the cellular membrane and to be internalized into the cytosol of differentiated SH-SY5Y cells was analysed by STED microscopy (Fig. 1A). Cells treated with A+ oligomers and ADDLs showed high levels of oligomer internalization, with respect to cells treated with A− oligomers or Aβ42 fibrils that appeared variably bound to cellular membranes. We then analysed the effects of the different Aβ42 species on the disruption of cytosolic Ca2+ homeostasis (Fig. 1B–D), an early event in the cascade of biochemical changes thought to underlie the cytotoxicity induced by misfolded proteinaceous aggregates.22 We found that A+ oligomers and ADDLs caused an extensive influx of Ca2+ ions into both primary neurons and differentiated neuroblastoma cells, whereas A− oligomers appeared harmless. Aβ42 fibrils showed a significant influx of Ca2+ ions, albeit to a lesser extent with respect to the oligomeric species. Similar results were obtained from the analysis of cell viability by MTT reduction inhibition assay (Fig. 1E). Overall, these initial experiments ruled out a possible relationship between morphology and cytotoxicity within the group of oligomers. In fact, despite similar size and morphology, these were characterized by different toxicity profiles.
The evidence described above highlights a peculiar and remarkable reactivity of certain Aβ42 species (ADDLs, A+) as compared to others (A−, fibrils), which can be explained by the presence of unique surface molecular motifs driving their interaction dynamics with cells. In order to describe the structural determinants at the basis of the toxicity of the oligomeric forms of Aβ42, we exploited the potential of SERS in providing an informative description of the biomolecular functionalities.23–25 From a preliminary Raman spectroscopy inspection of the peptide backbone conformation, similar architectures with limited organization can be observed (Fig. S2, ESI†), in line with previous literature.10 Only mature fibrils manifested clear β-sheet peaks indicating the onset of a cross-β-peptide architecture.26 Hence, differences in reactivity among Aβ42 assemblies cannot be attributed to different secondary structures in these species.
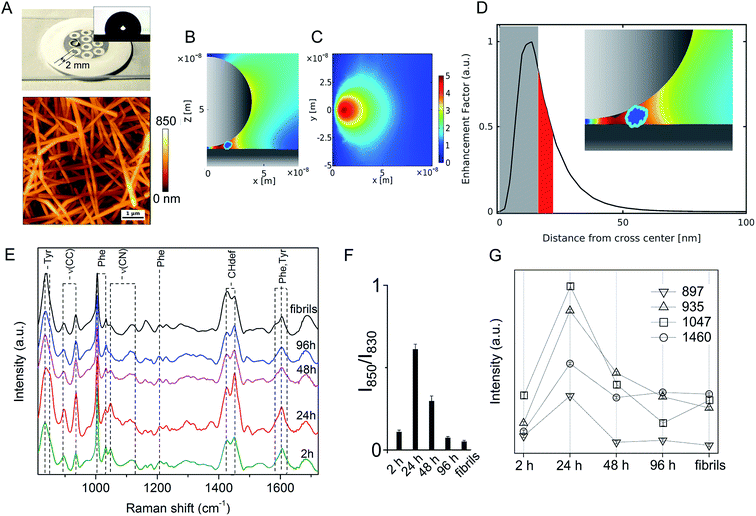
On the other hand, significant differences among spectral profiles were observed by SERS analysis revealing a variable vibrational intensity of bonds pertaining to side chain residues (Fig. 2 and 3). An overview of our SERS assay is supplied in Fig. 2A. The benefits in simple handling and worthy plasmonic properties of AgNWs27–29 (Fig. S3, ESI†) are here exploited to design a silver-spotted PTFE substrate (see Fig. S4, ESI† for details in the preparation and ref. 30 for a basic characterization of PTFE-supported AgNWs) providing ∼10 μm−2 SERS hotspots formed at the gaps between intertwined AgNWs (Fig. 2B, C and S5, ESI†). PTFE is selected to avoid any significant background Raman signal and to act as hydrophobic barrier against a microliter aqueous drop of Aβ42 sample deposited on the top of the spots in such a way that typical >100° contact angles are established (Fig. 2A inset). During drying, the drop content is therein confined and concentrated to produce effective SERS signals albeit micromolar concentrations of Aβ42 initially added. The abrupt E-field magnitude decay with distance from the hotspot under a near-infrared laser illumination originates a preferred amplification of the first few nm of an adsorbed Aβ42 oligomer or fibril (Fig. 2D and S5, ESI†). The above features depict the adopted analytical assay as functional for sensitive inspection of exposed moieties of the Aβ species.
A set of SERS spectra of Aβ42 in the initial monomeric state, of oligomeric forms including A+ species (formed after 24 h) and A− species (formed after 96 h), and of mature fibrils are displayed in Fig. 2E. Main bands are assigned to the aromatic tyrosine (Tyr) and phenylalanine (Phe) (830, 850, 1003, 1032, 1205, 1583, 1604, 1617 cm−1) residues, CN stretching modes of amino-terminated amino acids (1047–1130 cm−1), CH2/CH3 deformations of side chains of hydrophobic amino acids (1420–1460 cm−1) (Table S1, ESI†). From a first inspection, the SERS analysis indicates that major changes occur in the oligomers during the first 24 h of incubation, concomitantly with type A+ oligomer formation, whereas after 48 h the oligomers show similar spectral features that are maintained almost unaltered after fibril formation. The contribution of the different peptide modes to the SERS signals was estimated by means of a multipeak fitting procedure (Fig. S6, ESI†).
A considerable variation in the Fermi doublet ratio of Tyr, calculated as the I850/I830 intensity ratio, is apparent in correspondence of the Aβ42 form at 24 h, mainly due to an abrupt increase in the 850 cm−1 mode intensity (Fig. 2F). An increase of this ratio can be associated with a phenol ring that is less involved in hydrophobic type interactions such as π-stacking while on the contrary is more exposed to the aqueous solvent.31 This consideration is further sustained by the enhanced 1604 cm−1 in plane ring stretching mode also ascribed to Tyr.32 This evidence indicates the formation of a transient Aβ42 form at 24 h in which the Tyr residue (viz. Tyr10) of each Aβ42 chain points towards the external surface of the oligomer, thus being more available for interaction with the SERS-active silver surface (and consequently more affected by electromagnetic amplification), as compared to more buried Tyr residues of the other Aβ42 species. Further remarkable features of the Aβ42 oligomer at 24 h are (Fig. 2G) enhanced signals33–37 of (i) CC stretching vibrations at 897 cm−1 and 935 cm−1; (ii) the 1047 cm−1 band assigned to CN stretching; and (iii) the 1460 cm−1 band within the CH2/CH3-deformation region. First, the above results allow inferring a solvent exposure of residues containing amino-terminated groups. Among them, Lys and Arg residues are main favoured candidates due to their SERS signals at the low end of the 1047–1130 cm−1 region of CN stretching.38,39 A higher SERS intensity of the 1047 cm−1 mode can be the consequence of a direct interaction with the metal of available nitrogen atoms that protrude from the surface of the oligomer, which is favoured due to the well-known nitrogen affinity for silver.40 Furthermore the observation of enhanced CC and CH modes is well in agreement with a close proximity of long hydrocarbon moieties of amino acid residues including Lys and Arg residues with the metal. The type A− oligomer SERS profile appears considerably different from that of the type A+ while resembling that of fibrils. SERS spectra of oligomers formed after 48 hours of incubation show a less pronounced exposure of Tyr and amino-terminated residues. A nice matching between SERS spectra of A− and fibril species can suggest that in spite of well distinct morphologies and discrepant secondary structure (Fig. S1 and S2, ESI†), their surface molecular conformation is unfit to trigger strong interactions with the silver surface.
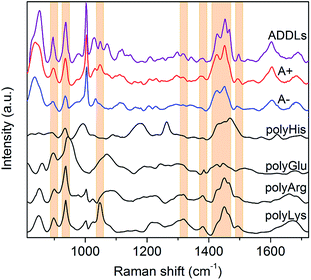
In light of these findings, ADDLs were subjected to SERS analysis aimed at assessing possible similarities with the model A+ species. Fig. 3 compares the SERS spectra collected from type A+/A− oligomers with ADDLs examined under identical conditions. As immediate feedback, a substantial matching between ADDLs and type A+ oligomer spectral profiles emerges, while differences with respect to those of the type A− (and fibrils, Fig. 2E) are apparent. Contextually, the enhancement of CC, carboxyl, Tyr, CN vibrations as well as hydrocarbon chain vibrations in ADDLs spectrum reveals a straight correlation between ADDLs and A+ oligomer profiles.
To gain insight into the specific contribution of side groups mainly responsible for SERS signals characterizing the toxic type A+ and ADDLs forms, we compared them with those of polyLys, polyArg, polyHis and polyGlu, taken here as representative models on a peptide scale of SERS profiles of Lys, Arg, His and Glu side residues of Aβ42. The latter were the subject of further investigation to confirm or discard crucial signal assignments. In fact, Lys and Arg are here hypothesized to contribute to the spectral features at 1047 cm−1, which mainly distinguish the toxic A+ and ADDLs forms from the others (see above); His was included in the analysis because of some increase in the 1317 cm−1 and 1494 cm−1 signals (being Raman markers of this residue41) as noted in A+ and ADDLs spectra and in light of previous reports proving its involvement in neuronal membrane interactions of toxic amyloid forms;20,42 Glu is abundantly present in the Aβ42 chain and possibly responsible of a slightly enhanced 1380 cm−1 mode33 as again observed in the A+ and ADDLs spectra. The spectral profiles of polyHis and polyGlu showed a scarce overlap with those of A+ and ADDLS, which make us discard His and Glu from having an exposed position in the external shell of Aβ42 toxic oligomers. Conversely, considerable matching between a number of SERS bands of A+ and ADDLs was found with those of polyLys and partly with those of polyArg. These include modes at 897 and 935 cm−1, the band group peaked at 1460 cm−1 as well as the above-pending peaks at 1317 cm−1, 1380 cm−1 and 1494 cm−1 for both polyLys and polyArg while the sharp feature at 1047 cm−1 assigned to CN stretching appears a hallmark of polyLys. On the basis of the above findings, we can infer that Lys and Arg residues as well as Tyr (contributing as intense bands at 830, 850 and 1604 cm−1) may play a leading role in the characteristic ‘toxic’ molecular fingerprint of type A+ oligomers and ADDLs.
MD simulations of Aβ42 oligomers at room conditions43 were analysed to assess the solvent-exposure of Tyr, Lys and Arg in toxic species as revealed by SERS. Starting from Aβ42 monomer and dimer structures simulated in aqueous solution, a few number of oligomer assemblies (n = 4) were selected (displayed in Fig. 4 and S7, ESI†). MD calculations allowed further restriction (see ESI† for details) of the focus of our results on Tyr10 and Lys28 residues of the Aβ42 peptide, which showed high-predicted values of solvent accessibility in the oligomers and a reduced accessibility in the transition from oligomeric to fibrillar forms of Aβ42. A scheme reporting the surface characteristics of toxic and nontoxic Aβ42 oligomers as found in this study and in accordance with previous findings is reported in Fig. 5.
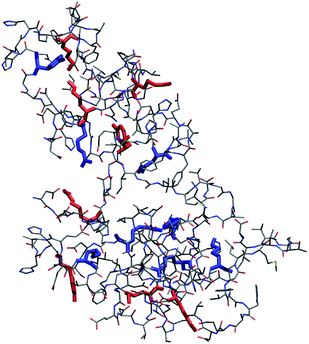 | ||
| Fig. 4 Representative structure of compact (R < 0.9, see ESI† for definition) Aβ42 oligomer (remaining structures showing a minimal root-mean square deviation between their backbone structures in the 1–2 nm range are shown in Fig. S7, ESI†). Tyr, Lys and Arg side chains are emphasized in boldface. Side chains of Tyr10, Lys16, Lys28 and Arg5 with relative accessibility to water rSASA >0.3 (see ESI†) are in red, while those with rSASA <0.3 are in blue. SASA is the average value for each side chain within the pool of structures belonging to each cluster. Bond radii are arbitrary. | ||
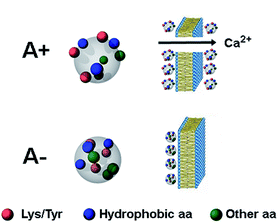 | ||
| Fig. 5 Schematic picture of the A+ and A− oligomers of Aβ42. Toxic A+ oligomers are characterized by exposure of hydrophobic clusters (blue), as found previously for this and related protein systems,9–11 as well as of Tyr and Lys residues (red), which is the major finding of the present study. Toxic A+ species are able to penetrate the cell membrane causing an influx of Ca2+ ions from the extracellular space to the cytosol. | ||
The question arises as to how the exposure of Tyr and Lys residues may contribute to the toxicity of the toxic oligomers explored here. Tyr residues are hydrophobic groups that may facilitate the association of biological membranes with misfolded oligomers when they are exposed on the oligomer surface, as a clear correlation exists between oligomer hydrophobicity and oligomer toxicity.10–12,44 Concerning Lys, it has been hypothesized that exposed Lys residues may promote the interaction with membrane proteins, but such interaction has so far remained elusive.45 Since oligomer toxicity requires the presence of the ganglioside GM1 on the membrane, in particular its negatively charged sialic acid,46,47 it is tempting to speculate that positively changed Lys residues on the oligomer surface may promote the interaction with the negatively charged ganglioside, with further insertion of the hydrophobic oligomer within the membrane bilayer. Another possibility is that solvent-exposed Lys residues play a role as gatekeepers for the recognition of chaperones,48 which have been shown to recognize regions enriched with hydrophobic residues flanked by Lys residues.49 Finally, a role can also be played by post-translational modifications, such as activated glycation end-product (AGE) formation and SUMOylation, both occurring on Lys residues of the Aβ peptide.50
Conclusions
In summary, in this work we provide a correlation between specific side groups of toxic Aβ42 oligomers with their surface chemistry. To this purpose, the characteristics of our SERS assay in genuinely probing surface functionalities of Aβ42 assemblies were exploited with effective advantages in terms of high sensitivity and intrinsic specificity, without any need to modify the primary sequence of Aβ42 potentially altering oligomer self-assembly. Our findings add a fundamental piece to the complex knowledge of the mechanism of cytotoxicity of the Aβ42 peptide. We expect that these results will be of concrete support to future diagnostic and therapeutic applications of AD, as such remarked fingerprints may themselves become effective biomarkers or drug targets of AD.Conflicts of interest
There are no conflicts to declare.Acknowledgements
M. B., C. D'A., K. S., L. C., M. de A., R. P. and P. M. thank the European Community, the Italian Ministry of Education University and Research and the Polish National Centre For Research And Development within the EuroNanoMed3 ERANET cofund SPEEDY project (14/EuroNanoMed/2018 and ID 221). M. B., C. D'A., M. de A., R. P. and P. M. acknowledge financial support from the Tuscany Region in the framework of the POR-FESR 2014–2020 program Action 1.1.5.a3 SENSOGM project and from the the Ministry of Foreign Affairs and International Cooperation of Italy (MAECI) through the DESWEAT project (n_KR19GR08) funded within the frame of the Executive Programme of Scientific and Technological Cooperation between the Italian Republic and the Korean Republic 2019-2021. M. S. L. thanks the National Science Centre, Poland, under Grant No. 2015/19/B/ST4/02721. R. C., F. C. and C. C. acknowledge financial support from the Ministry of Education, Universities and Research of Italy (Progetto Dipartimento di Eccellenza “Gender Medicine”).References
- B. Barz, Q. Liao and B. Strodel, J. Am. Chem. Soc., 2018, 140, 319–327 CrossRef CAS PubMed.
- T. P. J. Knowles, M. Vendruscolo and C. M. Dobson, Nat. Rev. Mol. Cell Biol., 2014, 15, 384–396 CrossRef CAS PubMed.
- F. Chiti and C. M. Dobson, Annu. Rev. Biochem., 2017, 86, 27–68 CrossRef CAS PubMed.
- M. Stefani, Prog. Neurobiol., 2012, 99, 226–245 CrossRef CAS PubMed.
- S. A. Kotler, P. Walsh, J. R. Brender and A. Ramamoorthy, Chem. Soc. Rev., 2014, 43, 6692–6700 RSC.
- B. Mannini, R. Cascella, M. Zampagni, M. van Waarde-Verhagen, S. Meehan, C. Roodveldt, S. Campioni, M. Boninsegna, A. Penco, A. Relini, H. H. Kampinga, C. M. Dobson, M. R. Wilson, C. Cecchi and F. Chiti, Proc. Natl. Acad. Sci. U. S. A., 2012, 109, 12479–12484 CrossRef CAS PubMed.
- J. Ojha, G. Masilamoni, D. Dunlap, R. A. Udoff and A. G. Cashikar, Mol. Cell. Biol., 2011, 31, 3146–3157 CrossRef CAS PubMed.
- P. Picotti, G. De Franceschi, E. Frare, B. Spolaore, M. Zambonin, F. Chiti, P. P. de Laureto and A. Fontana, J. Mol. Biol., 2007, 367, 1237–1245 CrossRef CAS PubMed.
- B. Bolognesi, J. R. Kumita, T. P. Barros, E. K. Esbjorner, L. M. Luheshi, D. C. Crowther, M. R. Wilson, C. M. Dobson, G. Favrin and J. J. Yerbury, ACS Chem. Biol., 2010, 5, 735–740 CrossRef CAS PubMed.
- A. R. A. Ladiwala, J. Litt, R. S. Kane, D. S. Aucoin, S. O. Smith, S. Ranjan, J. Davis, W. E. Van Nostrand and P. M. Tessier, J. Biol. Chem., 2012, 287, 24765–24773 CrossRef CAS PubMed.
- S. Campioni, B. Mannini, M. Zampagni, A. Pensalfini, C. Parrini, E. Evangelisti, A. Relini, M. Stefani, C. M. Dobson, C. Cecchi and F. Chiti, Nat. Chem. Biol., 2010, 6, 140–147 CrossRef CAS PubMed.
- C. Capitini, J. R. Patel, A. Natalello, C. D'Andrea, A. Relini, J. A. Jarvis, L. Birolo, A. Peduzzo, M. Vendruscolo, P. Matteini, C. M. Dobson, A. De Simone and F. Chiti, Chem. Commun., 2018, 54, 8637–8640 RSC.
- M. L. de la Chapelle and N. Felidj, Plasmonics in chemistry and biology, Jenny Stanford Publishing, 2019 Search PubMed.
- M. Ghomi, Applications of Raman spectroscopy to biology: from basic studies to disease diagnosis, IOS Press, 2012 Search PubMed.
- I. Bruzas, W. Lum, Z. Gorunmez and L. Sagle, Analyst, 2018, 143, 3990–4008 RSC.
- D. Cialla-May, X. S. Zheng, K. Weber and J. Popp, Chem. Soc. Rev., 2017, 46, 3945–3961 RSC.
- C. C. VandenAkker, M. Schleeger, A. L. Bruinen, T. Deckert-Gaudig, K. P. Velikov, R. M. A. Heeren, V. Deckert, M. Bonn and G. H. Koenderink, J. Phys. Chem. B, 2016, 120, 8809–8817 CrossRef CAS PubMed.
- D. Kurouski, R. P. Van Duyne and I. K. Lednev, Analyst, 2015, 140, 4967–4980 RSC.
- I. H. Chou, M. Benford, H. T. Beier, G. L. Cote, M. Wang, N. Jing, J. Kameoka and T. A. Good, Nano Lett., 2008, 8, 1729–1735 CrossRef PubMed.
- C. D'Andrea, A. Foti, M. Cottat, M. Banchelli, C. Capitini, F. Barreca, C. Canale, M. de Angelis, A. Relini, O. M. Maragò, R. Pini, F. Chiti, P. G. Gucciardi and P. Matteini, Small, 2018, 14, 1800890 CrossRef PubMed.
- M. P. Lambert, A. K. Barlow, B. A. Chromy, C. Edwards, R. Freed, M. Liosatos, T. E. Morgan, I. Rozovsky, B. Trommer, K. L. Viola, P. Wals, C. Zhang, C. E. Finch, G. A. Krafft and W. L. Klein, Proc. Natl. Acad. Sci. U. S. A., 1998, 95, 6448–6453 CrossRef CAS PubMed.
- S. Orrenius, B. Zhivotovsky and P. Nicotera, Nat. Rev. Mol. Cell Biol., 2003, 4, 552–565 CrossRef CAS PubMed.
- P. Matteini, M. Cottat, F. Tavanti, E. Panfilova, M. Scuderi, G. Nicotra, M. C. Menziani, N. Khlebtsov, M. de Angelis and R. Pini, ACS Nano, 2017, 11, 918–926 CrossRef CAS PubMed.
- M. Banchelli, M. de Angelis, C. D’Andrea, R. Pini and P. Matteini, Sci. Rep., 2018, 8, 1033 CrossRef PubMed.
- R. Ahijado-Guzman, P. Gomez-Puertas, R. A. Alvarez-Puebla, G. Rivas and L. M. Liz-Marzan, ACS Nano, 2012, 6, 7514–7520 CrossRef CAS PubMed.
- N. Candelise, M. Schmitz, F. Llorens, A. Villar-Pique, M. Cramm, T. Thom, S. M. D. Correia, J. E. G. da Cunha, W. Mobius, T. F. Outeiro, V. G. Alvarez, M. Banchelli, C. D'Andrea, M. de Angelis, S. Zafar, A. Rabano, P. Matteini and I. Zerr, Ann. Neurol., 2019, 85, 691–703 CrossRef CAS PubMed.
- E. H. Koh, C. Mun, C. Kim, S. G. Park, E. J. Choi, S. H. Kim, J. Dang, J. Choo, J. W. Oh, D. H. Kim and H. S. Jung, ACS Appl. Mater. Interfaces, 2018, 10, 10388–10397 CrossRef CAS PubMed.
- M. Becucci, M. Bracciali, G. Ghini, C. Lofrumento, G. Pietraperzia, M. Ricci, L. Tognaccini, S. Trigari, C. Gellini and A. Feis, Nanoscale, 2018, 10, 9329–9337 RSC.
- W. Wei, Y. Du, L. Zhang, Y. Yang and Y. Gao, J. Mater. Chem. C, 2018, 6, 8793–8803 RSC.
- M. Banchelli, C. Amicucci, E. Ruggiero, C. D'Andrea, M. Cottat, D. Ciofini, I. Osticioli, G. Ghini, S. Siano, R. Pini, M. de Angelis and P. Matteini, ChemNanoMat, 2019, 5, 1036–1043 CrossRef CAS.
- B. Hernandez, Y. M. Coic, F. Pfluger, S. G. Kruglik and M. Ghomi, J. Raman Spectrosc., 2016, 47, 210–220 CrossRef CAS.
- W. B. Fischer and H. H. Eysel, Spectrochim. Acta A, 1992, 48, 725–732 CrossRef.
- E. Podstawka, Y. Ozaki and L. M. Proniewicz, Appl. Spectrosc., 2004, 58, 1147–1156 CrossRef CAS PubMed.
- S. Stewart and P. M. Fredericks, Spectrochim. Acta A, 1999, 55, 1615–1640 CrossRef.
- Z. Movasaghi, S. Rehman and I. U. Rehman, Appl. Spectrosc. Rev., 2007, 42, 493–541 CrossRef CAS.
- S. Siddhanta, D. Karthigeyan, P. P. Kundu, T. K. Kundu and C. Narayana, RSC Adv., 2013, 3, 4221–4230 RSC.
- B. Della Ventura, M. Banchelli, R. Funari, A. Illiano, M. De Angelis, P. Taroni, A. Amoresano, P. Matteini and R. Velotta, Analyst, 2019, 144, 6871–6880 RSC.
- E. Podstawka and Y. Ozaki, Biopolymers, 2008, 89, 807–819 CrossRef CAS PubMed.
- L. Marsich, A. Bonifacio, S. Mandal, S. Krol, C. Beleites and V. Sergo, Langmuir, 2012, 28, 13166–13171 CrossRef CAS PubMed.
- F. Tavanti, A. Pedone, P. Matteini and M. C. Menziani, J. Phys. Chem. B, 2017, 121, 9532–9540 CrossRef CAS PubMed.
- F. Madzharova, Z. Heiner and J. Kneipp, J. Phys. Chem. C, 2017, 121, 1235–1242 CrossRef CAS.
- C. Wallin, S. B. Sholts, N. Osterlund, J. H. Luo, J. Jarvet, P. M. Roos, L. Ilag, A. Graslund and S. Warmlander, Sci. Rep., 2017, 7, 14 CrossRef PubMed.
- G. La Penna and M. S. Li, Phys. Chem. Chem. Phys., 2019, 21, 8774–8784 RSC.
- M. V. Vega, R. Cascella, S. W. Chen, G. Fusco, A. De Simone, C. M. Dobson, C. Cecchi and F. Chiti, ACS Chem. Biol., 2019, 14, 1593–1600 CrossRef PubMed.
- S. Sinha, D. H. J. Lopes and G. Bitan, ACS Chem. Neurosci., 2012, 3, 473–481 CrossRef CAS PubMed.
- E. Evangelisti, C. Cecchi, R. Cascella, C. Sgromo, M. Becatti, C. M. Dobson, F. Chiti and M. Stefani, J. Cell Sci., 2012, 125, 2416–2427 CrossRef CAS PubMed.
- R. Cascella, E. Evangelisti, A. Bigi, M. Becatti, C. Fiorillo, M. Stefani, F. Chiti and C. Cecchi, J. Alzheim. Dis., 2017, 60, 923–938 CAS.
- F. Rousseau, L. Serrano and J. W. H. Schymkowitz, J. Mol. Biol., 2006, 355, 1037–1047 CrossRef CAS PubMed.
- S. Rudiger, L. Germeroth, J. SchneiderMergener and B. Bukau, EMBO J., 1997, 16, 1501–1507 CrossRef CAS PubMed.
- J. Ng, H. Kaur, T. Collier, K. Chang, A. E. S. Brooks, J. R. Allison, M. A. Brimble, A. Hickey and N. P. Birch, J. Biol. Chem., 2019, 294, 8806–8818 CrossRef PubMed.
Footnote |
| † Electronic supplementary information (ESI) available. See DOI: 10.1039/d0ra03799k |
| This journal is © The Royal Society of Chemistry 2020 |

![[thin space (1/6-em)]](https://www.rsc.org/images/entities/char_2009.gif) 000–200
000–200