Characterization of regulatory T cell expansion for manufacturing cellular immunotherapies†
David A.
McBride
 abc,
Matthew D.
Kerr
abc,
Shinya L.
Wai
a,
Yvonne Y.
Yee
ab,
Dora A.
Ogbonna
ab and
Nisarg J.
Shah
abc,
Matthew D.
Kerr
abc,
Shinya L.
Wai
a,
Yvonne Y.
Yee
ab,
Dora A.
Ogbonna
ab and
Nisarg J.
Shah
 *abcde
aDepartment of Nanoengineering, University of California, San Diego, La Jolla, CA 92093, USA. E-mail: nshah@ucsd.edu
bChemical Engineering Program, University of California, San Diego, La Jolla, CA 92093, USA
cCenter for Nano-Immuno Engineering, University of California, San Diego, La Jolla, CA 92093, USA
dProgram in Immunology, University of California, San Diego, La Jolla, CA 92093, USA
eSan Diego Center for Precision Immunotherapy, Moores Cancer Center, University of California, San Diego, La Jolla, CA 92093, USA
First published on 22nd May 2020
Abstract
Regulatory T cells (Tregs) are critical mediators of peripheral immune tolerance. Tregs suppress immune activation against self-antigens and are the focus of cell-based therapies for autoimmune diseases. However, Tregs circulate at a very low frequency in blood, limiting the number of cells that can be isolated by leukapheresis. To effectively expand Tregsex vivo for cell therapy, we report the metabolic modulation of T cells using mono-(6-amino-6-deoxy)-β-cyclodextrin (βCD-NH2) encapsulated rapamycin (Rapa). Encapsulating Rapa in β-cyclodextrin increased its aqueous solubility ∼154-fold and maintained bioactivity for at least 30 days. βCD-NH2-Rapa complexes (CRCs) enriched the fraction of CD4+CD25+FoxP3+ mouse T (mT) cells and human T (hT) cells up to 6-fold and up to 2-fold respectively and suppressed the overall expansion of effector T cells by 5-fold in both species. Combining CRCs and transforming growth factor beta-1 (TGF-β1) synergistically promoted the expansion of CD4+CD25+FoxP3+ T cells. CRCs significantly reduced the fraction of pro-inflammatory interferon-gamma (IFN-γ) expressing CD4+ T cells, suppressing this Th1-associated cytokine while enhancing the fraction of IFN-γ− tumor necrosis factor-alpha (TNF-α) expressing CD4+ T cells. We developed a model using kinetic rate equations to describe the influence of the initial fraction of naïve T cells on the enrichment of Tregsin vitro. The model related the differences in the expansion kinetics of mT and hT cells to their susceptibility for immunophenotypic modulation. CRCs may be an effective and potent means for phenotypic modulation of T cells and the enrichment of Tregsin vitro. Our findings contribute to the development of experimental and analytical techniques for manufacturing Treg based immunotherapies.
Introduction
Regulatory T cells (Tregs) are T cell subset that suppress aberrant activation of self-reactive effector lymphocytes and are widely regarded as the primary mediators of peripheral tolerance.1 Cell-based therapy using Tregs effectively treats autoimmune diseases such as arthritis and type 1 diabetes in animal models and at least one clinical trial (NCT02772679) is underway to evaluate efficacy in humans.2–5 However, sourcing Tregs from leukapheresis is inefficient as they circulate at a low frequency (3–5%) in the blood and therefore ex vivo expansion is required to enhance their numbers. Current expansion methods, which use natural or artificial antigen-presenting cells and interleukin-2 (IL-2), induce the activation of not only Tregs but also conventional T cells.6,7 Because Tregs divide more slowly than effector T cells, the latter may significantly outgrow Tregs.8 Therefore, Tregs must be highly purified and sorted to avoid transfusion of T effector cells, which can be challenging.9 Furthermore, Treg-mediated suppression could diminish after repetitive stimulation.10 These requirements for expanding and isolating Tregsex vivo limit their use for cell therapy.One method to efficiently enhance Tregs is by expanding T cells in medium containing rapamycin (Rapa), a carboxylic lactone–lactam triene macrolide with antifungal, antitumor and anti-inflammatory properties.11 Rapa is administered orally or intravenously for systemic immunosuppression to prevent organ transplant rejection.12,13 Rapa inhibits the serine/threonine protein kinase called mammalian target of rapamycin (mTOR), which is involved in a broad range of physiological processes linked to the control of cell cycle.14 Consistent with this mechanism, Rapa locks T cell-cycle progression from G1 to S phase after activation, enhances Treg number and maintains their function by preferentially reducing proliferation of effector T cells, while minimally affecting the regulatory T cell subset.15–18 Rapa induces operational tolerance and suppresses the proliferation of effector T cells and decreases the production of proinflammatory cytokines by T cells in vivo and in vitro.19–22 However, the poor aqueous solubility of Rapa, low stability in serum and short half-life (∼10 hours at 37 °C) limits bioavailability and uptake by T cells.23,24
Cyclodextrin monomers are well characterized cyclic oligosaccharides that form complexes with drug molecules via secondary hydrophobic interactions.25 The formation of inclusion complexes with small molecule drugs delays the rate of drug release beyond that of diffusion alone.26 The most common pharmaceutical applications of beta-cyclodextrin (βCD) derivatives are as excipients in clinical drug formulations to enhance the aqueous solubility of the complexed species, to improve the aqueous stability, photostability, and bioavailability of complexed drugs.27In vivo, βCDs have been shown to enhance drug absorption and oral bioavailability as well as facilitate drug transport across physiologic barriers and biological membranes. Complexes of Rapa with βCD derivatives improve solubility and stability of Rapa, while preserving bioactivity.28,29 Prior experiments have quantified a Kd between Rapa and βCD derivatives in the micromolar range.30 The high supramolecular affinity prolongs its bioavailability and therefore is an attractive choice for formulations to promote enhancements of the half-life of Rapa in vitro. The extended half-life of Rapa could synergize with other potent inducers of regulatory T cells, including transforming growth factor-beta (TGF-β1), which mediates the transition of naïve T cells toward a regulatory phenotype with potent immunosuppressive potential.31
To promote the enrichment of Tregsin vitro, we encapsulated and characterized the function of Rapa encapsulated in mono-(6-amino-6-deoxy)-β-cyclodextrin (βCD-NH2) forming cyclodextrin-Rapa complexes (CRCs). CRCs enhanced the solubility of Rapa in water 154-fold and maintained bioactivity of Rapa for at least 30 days in solution. CRCs enriched the fraction by 5-fold of Tregsin vitro from both PBMC-isolated human T (hT) cells and splenocyte-isolated mouse T (mT) cells. CRCs synergize with TGF-β1 to enhance the enrichment of murine Tregs. The combination also enhanced the fraction of human Tregs over single factor treatments. CRCs reduced interferon-gamma (IFN-γ) expression by T cells and increased the fraction of T cells that expressed tumor necrosis factor-α (TNF-α) without IFN-γ. In hT cells, combining CRC and TGF-β1 further enhanced the enrichment of IFN-γ− TNF-α+ T cells, while in mT cells the addition of TGF-β1 increased the fraction of IFN-γ+ T cells, both alone and in combination with CRCs.
We developed a computational model to describe the expansion kinetics of Treg enrichment. The model recapitulated key features associated with CRCs and TGF-β1 individually and in combination on Treg expansion. A sensitivity analysis demonstrated that the initial fraction of naïve T cells is critical for ensuring a high fraction of Tregs. CRCs are a potent delivery system for Rapa to enhance the preferential expansion of Tregs and inhibiting inflammatory T cells, and the model may serve to guide Treg expansion for manufacturing cellular immunotherapies.
Materials and methods
Materials
Basal T cell culture media was prepared from RPMI medium 1640 powder (Gibco) supplemented with 10% HI-FBS, 1% penicillin–streptomycin, 1 mM sodium pyruvate, 50 μM β-mercaptoethanol and 0.1 mM non-essential amino acids. Primary mT and hT cell media used for expansion was further supplemented with 50 IU mL−1 murine recombinant IL-2 (Peprotech) and 50 IU mL−1 human recombinant IL-2 (Biolegend), respectively. Rapa was purchased from LC Laboratories. Mono-(6-amino-6-deoxy)-β-cyclodextrin, with an upper solubility limit of 4.2 wt% in water, was purchased from Cavcon (CAS#: 29390-67-8). Dimethylsulfoxide (DMSO) was purchased from Sigma-Aldrich.Generation and characterization of CRCs
CRCs were prepared by first creating 0%, 1%, 2%, 3%, and 4% (wt/v) solutions of βCD-NH2 in DI water. 500 μL of each solution was added to 1 mg of Rapa and vortexed at 3200 rpm for 5 minutes, and then agitation was maintained at 1500 rpm until sampling. The inclusion complexes were equilibrated over 7 days as previously reported. Subsequently, the solution was spun down (21![[thin space (1/6-em)]](https://www.rsc.org/images/entities/char_2009.gif) 000 rcf, 5 min) and the supernatant was collected and analyzed on day 7. The amount of Rapa in the supernatant was analyzed using UV-vis spectrophotometry (λ = 278 nm) (Fig. S1a†).
000 rcf, 5 min) and the supernatant was collected and analyzed on day 7. The amount of Rapa in the supernatant was analyzed using UV-vis spectrophotometry (λ = 278 nm) (Fig. S1a†).
Primary T cell isolation
All animal procedures were approved by the Institutional Animal Care and Use Committee at UC San Diego. Primary murine T cells were freshly isolated from C57BL/6J mice. A single cell suspension of splenocytes was created and T cells were isolated via magnetic depletion using CD4+ or pan-T cell isolation kits (Miltenyi Biotec) according to the manufacturer's recommendations. Murine T cells were not cryopreserved as the cells were found to be sensitive to DMSO at concentrations greater than 1%(v/v) and reconstituted murine T cells expanded less than freshly isolated cells (data not shown).Primary hT cells were isolated from anonymous donor blood concentrate enriched in the buffy coat (Stanford Blood Bank and San Diego Blood Bank). PBMCs were enriched from buffy coat within 24 hours of collection using density separation in a Ficoll gradient (Lymphopure). PBMCs were then transferred to serum-free cell freezing media (Bambanker) and frozen overnight at −80 °C. Aliquots were then stored in liquid nitrogen and used within 6 months. Pan T cells were isolated from thawed PBMC aliquots using magnetic depletion (Dynabeads Untouched Human T cells, Invitrogen) according to the manufacturer's recommendations.
In vitro T cell expansion assays
Primary mT and hT cells were isolated as described above and resuspended in T cell culture media without IL-2. Mouse or human αCD3/αCD28 activator Dynabeads (Invitrogen) were added to mT and hT cells, respectively, according to manufacturer recommendations and cells were plated in 96 well plates. After one day of culture, recombinant murine or human IL-2 was added to cultures at a concentration of 50 IU mL−1 along with any factors being tested. On the seventh day of culture, cells were enumerated with cell counting using a hemocytometer and analyzed with flow cytometry. In cultures testing the suppressive effects of DMSO- or βCD-NH2-solubilized Rapa, Rapa was added at concentrations of 10, 100 or 1000 nM and TGF-β1 was used at 5 ng mL−1. DMSO concentration was maintained across groups at a concentration of 0.1% (v/v). For CFSE analysis, cells were stained prior to activation with Dynabeads with CFSE (CFSE Cell Division Tracker Kit, Biolegend) according to manufacturer's instructions. Cells stained with CFSE were analyzed after 72 hours with flow cytometry.Cytokine assay
Primary mT and hT cells were cultured as previously detailed. 5 days post activation with Dynabeads, the cells were restimulated with PMA and ionomycin and blocked with Brefeldin A (Cell Activation Kit with Brefeldin A, Biolegend) for 5 hours according to manufacturer's instructions. Cells were then washed, stained, and analyzed with flow cytometry.Flow cytometry
Antibodies for anti-mouse CD25 (PC61), CD8α (53-6.7), CD4 (GK1.5), CD45 (30-F11), TNF-α (MP6-XT22), IFN-γ (XMG1.2), and anti-human CD8α (RPA-T8), CD4 (SK3), CD25 (M-A251), CD45 (HI30), TNF-α (Mab11), and IFN-γ (B27) were purchased from Biolegend. Antibodies for anti-mouse FoxP3 (FJK-16s) and anti-human FoxP3 (236A/E7), were purchased from eBioscience. Samples analyzed for FoxP3 expression were fixed and permeabilized using the FoxP3/Transcription Factor Staining Buffer Set (eBioscience) according to manufacturer supplies protocols. Samples analyzed for TNF-α and IFN-γ expression but not FoxP3 were fixed using the IC Fixation Buffer (eBioscience) and permeabilized using Permeabilization Buffer (eBioscience) according to manufacturer supplied protocols. All cells were gated based on forward and side scatter characteristics to limit debris. Gating for surface markers, cytokines, and FoxP3 were determined using fluorescence-minus-one controls.Computational modeling and parameter analysis
To calculate the parameter values in the model we used data sets from our experiments. To determine the sensitivity of the model outputs to initial model regulatory T cell (Tr) fraction the model was initialized with 1%, 2%, and 3% Tr with a fixed model effector T cell (Te) (36.5%) fraction and variable model naïve T cell (Tn) (62.5%, 61.5% and 60.5%. The range of initial Tr values examined, as well as the starting Te and Tn values, were informed by analysis of T cell isolations and naïve T cell staining for CD62L and CD44. To determine the sensitivity of the model to initial Te fraction the model was initialized with 18.2%, 36.5% and 54.7% Te, with a fixed Tr (2%) and variable Tn (79.8%, 61.5%, 43.3%). An Excel sheet detailing parameter calculation and all code used to generate the model may be found at https://github.com/Shah-Lab-UCSD/Treg_Enrichement_Model_In_Vitro. All code was written to be compatible with Python 3.7.6.Results
Mono-(6-amino-6-deoxy)-beta-cyclodextrin increases aqueous solubility of Rapa
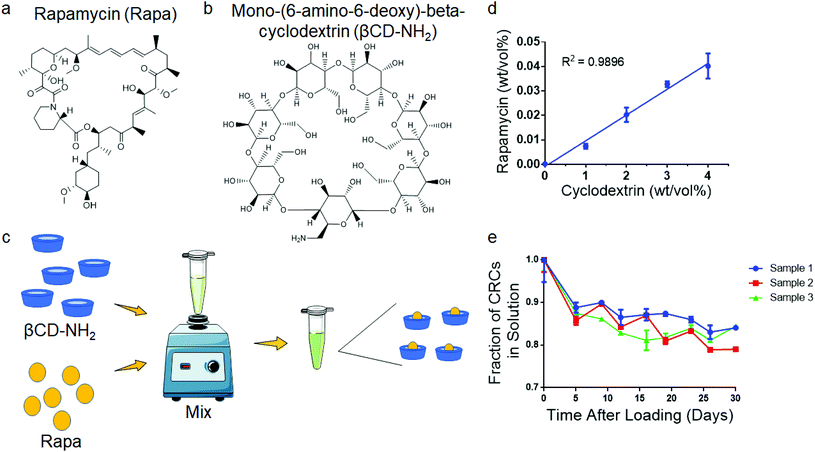
To test the encapsulation of Rapa and improve the aqueous solubility, we used the βCD mono-(6-amino-6-deoxy)-beta-cyclodextrin (βCD-NH2), forming βCD-NH2-Rapa inclusion complexes (Fig. 1a and b). We first measured loading of Rapa in 0–4% (w/v) βCD-NH2s in deionized water (Fig. 1c). The loading of Rapa in the inclusion complexes was quantified using a standard curve (Fig. S1a†). The amount of Rapa in solution was proportional to the βCD-NH2 concentration and achieved a maximum loading of 4.02 ± 0.52 mg mL−1 in a 4 wt% solution of βCD-NH2 on day 7 (Fig. 1d). The supernatant of the solution prepared without βCD-NH2 did not have a detectable amount of Rapa. To test the stability of the inclusion complex, CRC containing supernatant was transferred to new tubes that were incubated at room temperature over 30 days. In all samples, the amount of Rapa initially decreased and equilibrated after 7 days at 82.5% ± 1.7% of the initial concentration (Fig. 1e).Rapa preferentially expands Tregs
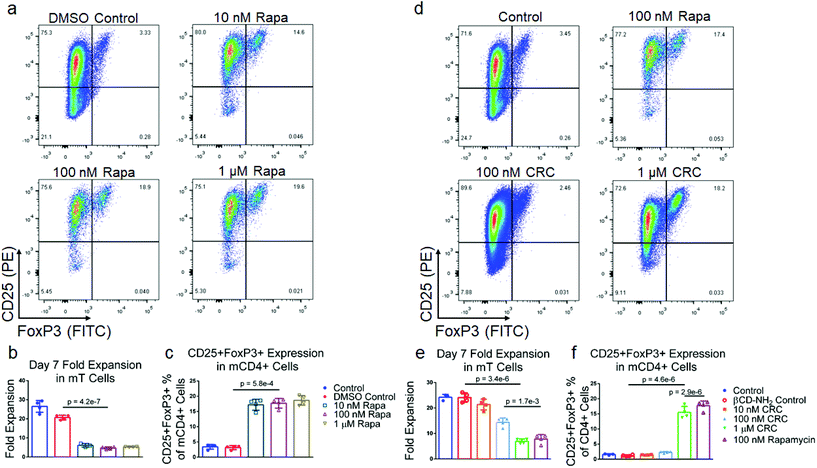
To test the suppressive activity of Rapa on T cell proliferation and enriching regulatory T cells (Tregs), we measured its dose-dependent effect in vitro. mT cells were isolated from splenocytes using magnetic bead-based depletion. Approximately 90% of the cells were either CD4+ or CD8+ T cells post-enrichment (Fig. S1b†). We tested a broad range of Rapa concentrations (1 μM, 100 nM, 10 nM) (Fig. 2a) and measured fold-expansion and the frequency of CD4+CD25+FoxP3+ T cells relative to the total number of CD4+ T cells seven days post-activation. T cell expansion in 1 μM Rapa (5.26 ± 0.15) was comparable to 10 nM (6.13 ± 0.96) and 100 nM concentration (4.65 ± 0.63-fold expansion) (Fig. 2b), and were significantly lower compared to the Dynabead-only (25.8 ± 1.2) and DMSO controls (20.7 ± 1.2-fold expansion). The fraction of CD4+ T cells that were also CD25+FoxP3+ was similar at 10 nM (10.3% ± 1.3%), 100 nM (10.3% ± 1.6%), and 1 μM (12.2% ± 0.7%) and significantly higher compared with the Dynabead-only (2.96% ± 1.51%) and DMSO controls (1.54% ± 0.78%) (Fig. 2c). To examine the effects of DMSO-solubilized Rapa on expansion of CD25hi and CD25lo CD4+ T cell subsets, we conducted a proliferation assay using carboxyfluorescein succinimidyl ester (CFSE). In the absence of Rapa, CD25lo T cells proliferated more than CD25hi T cells. When 100 nM Rapa was added, both CD25hi and CD25lo T cells proliferated a similar amount, with both groups expanding less than controls (Fig. S2a†).Cyclodextrin-Rapa complexes potently suppress T cell proliferation
To test the bioactivity of Rapa encapsulated in CRCs, we compared the phenotypic modulation of murine T cells mediated by CRCs and Rapa solubilized in a DMSO carrier (Fig. 2d). In contrast to DMSO-solubilized Rapa, T cell expansion was strongly dependent on the concentration of CRCs, but unaffected by βCD-NH2 alone (Fig. 2e). 10 nM CRCs did not substantially affect T cell expansion (21.4 ± 2.1-fold) compared to the Dynabead-only control (24.2 ± 1.2-fold). T cell expansion with 100 nM CRCs (14.4 ± 1.7-fold) and 1μM CRCs (6.93 ± 0.91-fold) was significantly lower than the Dynabead-only and βCD-NH2 (24.1 ± 1.6-fold) controls. In addition, the suppression of T cell expansion mediated by 1μM CRCs was comparable to 100 nM DMSO-solubilized Rapa (7.81 ± 1.75-fold expansion). Similarly, the enrichment of CD4+CD25+FoxP3+ murine T cells was comparable between the 10 nM CRC (1.46% ± 0.10%), Dynabead-only control (1.57% ± 0.25%), and βCD-NH2 control (1.21% ± 0.21%) (Fig. 2f). These cells were significantly enriched with 100 nM CRC (2.29% ± 0.26%) and 1 μM CRC (5.86% ± 0.28%).TGF-β1 and CRCs promote Treg enrichment through distinct mechanisms
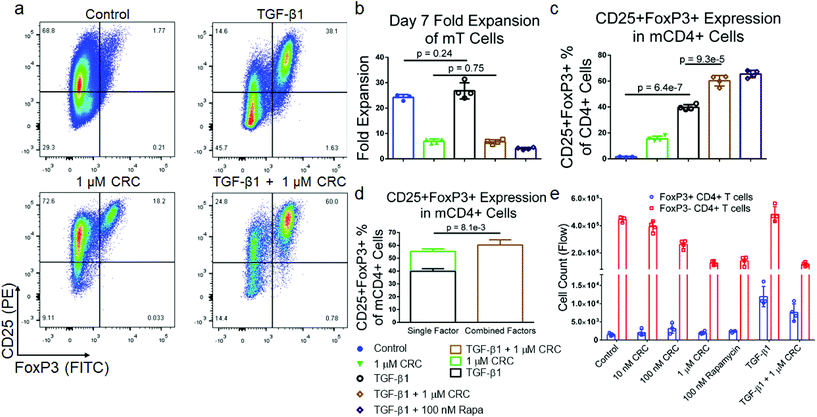
To test if combinations of immunomodulatory factors might further enrich CD4+CD25+FoxP3+ Tregs, we tested transforming growth factor-beta (TGF-β1) in combination with Rapa. Murine T cells were cultured in media containing either 5 ng mL−1 TGF-β1, 1 μM CRCs or both factors and quantified the expansion of T cells as well as the fraction of CD25+FoxP3+CD4+ T cells (Fig. 3a). TGF-β1 alone did not suppress the expansion of T cells (26.8 ± 3.2-fold) relative to the Dynabead-only control (24.2 ± 1.2-fold). However, TGF-β1 in combination with 1 μM CRCs suppressed T cell expansion (6.73 ± 0.82-fold expansion) which was comparable to 1 μM CRCs alone (6.93 ± 0.91-fold expansion) (Fig. 3b). TGF-β1 in combination with 1 μM CRCs (21.1% ± 0.46%) increased the fraction of Tregs more than TGF-β1 (10.8% ± 0.46%) or 1 μM CRCs (5.86% ± 0.28%) alone (Fig. 3c). Strikingly, this enrichment was greater than the sum of the enhancement mediated by either CRCs or TGF-β1 alone (Fig. 3d). We compared CD4+FoxP3+ Treg and the CD4+FoxP3− T cell counts between the test groups (Fig. 3e). 100 nM and 1 μM CRCs reduced the number of total CD4+FoxP3− cells compared with the Dynabead-only control but did not affect the number of Treg. In contrast, TGF-β1 increased the number of Treg relative to control but did not significantly affect proliferation of CD4+FoxP3− T cells. In combination, TGF-β1 and 1 μM CRC increased Treg and decreased CD4+FoxP3− T cells.CRCs and TGF-β1 have opposing effects on IFNγ expression in murine T cells
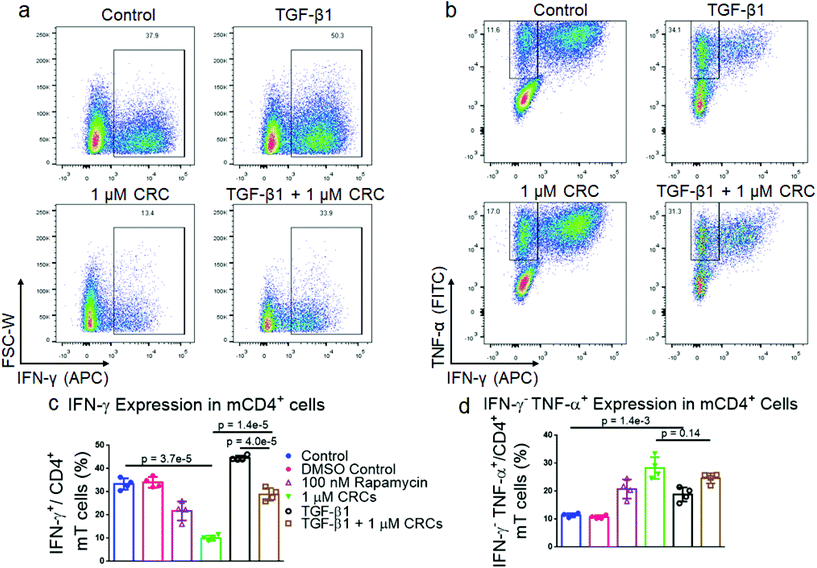
As the immunophenotype of T cells is associated with its cytokine profile, we next measured the difference in production of pro-inflammatory cytokines in mT cells with combination of single factor CRCs and TGF-β1 (Fig. 4a and b). The fraction of CD4+ IFN-γ+ T cells was significantly depleted in CRC-treated cells (10.0% ± 0.6%) relative to Dynabead-only control (30.6% ± 2.9%). CD4+ IFN-γ+ T cells were enriched in the presence of TGF-β1 alone (44.6% ± 1.0%) (Fig. 4c). The combination of CRCs and TGF-β1 (28.9% ± 2.7%) was lower than TGF-β1 alone, but similar to the Dynabead-only and DMSO controls.CRCs preferentially enrich CD4+CD25+FoxP3+ primary human T cells
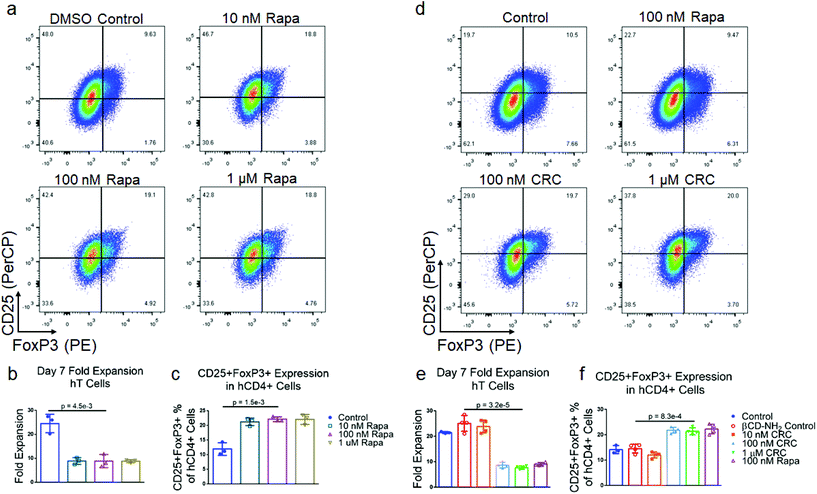
We next tested the Rapa concentration-dependent enrichment of CD4+CD25+FoxP3+ human Treg with DMSO-solubilized Rapa. T cells were enriched from donor derived PBMCs using magnetic depletion to a purity of approximately 85% CD8+ and CD4+ T cells (Fig. S1c†) and subsequently activated using Dynabeads. The suppression in hT cell expansion was similar at 1 μM (8.84 ± 0.62-fold), 100 nM (8.88 ± 2.72-fold), and 10 nM (8.92 ± 1.41-fold) DMSO-solubilized Rapa, relative to the Dynabead-only control (24.5 ± 3.8-fold) (Fig. 5a and b). The enrichment in CD4+CD25+FoxP3+ human Treg at 1 μM (22.1% ± 1.7%), 100 nM (22.2% ± 0.81%), and 10 nM Rapa (21.3% ± 1.3%) was similar and greater than the Dynabead-only control (12.0% ± 2.2%) (Fig. 5c).To test the bioactivity of CRCs with hT cells, we measured CRC-mediated suppression on hT cell expansion with 1 μM, 100 nM, and 10 nM CRCs (Fig. 5d). At 10 nM, T cell expansion was comparable to the Dynabead-only control (23.8 ± 2.5-fold expansion) as well as the βCD-NH2 control (25.0 ± 2.7-fold expansion). However, at 100 nM (8.7 ± 1.2-fold) and 1 μM CRC (7.7 ± 0.6-fold), suppression in T cell expansion was comparable to DMSO-solubilized 100 nM Rapa (9.0 ± 0.6-fold) (Fig. 5e). Similarly, the enrichment of CD4+CD25+FoxP3+ Tregs at 10 nM CRCs (12.0% ± 1.2%) was comparable to the Dynabead-control (14.1% ± 1.6%) and βCD-NH2 control (14.5% ± 1.5%). Enrichment at 100 nM (21.8% ± 1.2%) and 1 μM (21.4% ± 1.4%) CRCs was higher than the Dynabead-control and comparable to 100 nM DMSO-solubilized Rapa (22.3% ± 1.9%) (Fig. 5f).
Expansion with TGF-β1 and CRCs results in high fraction of CD4+CD25+FoxP3+ hT cells
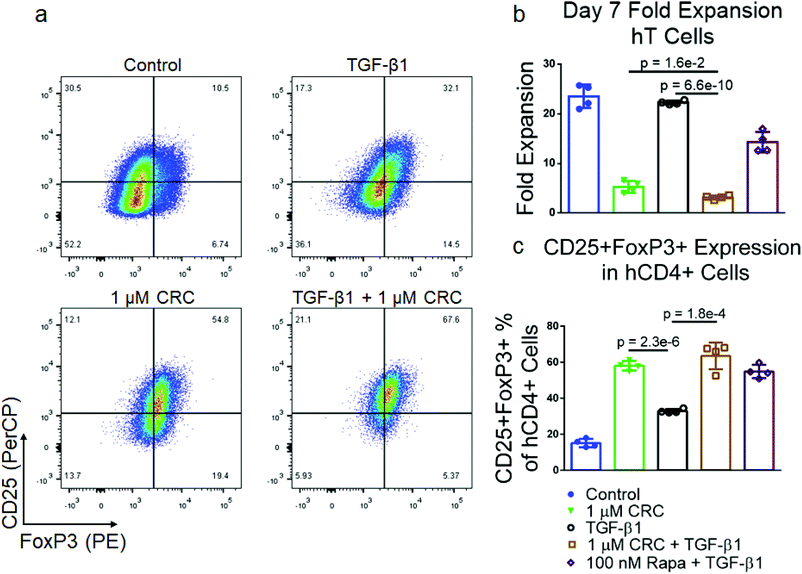
To test the effect of TGF-β1 in combination with CRCs on Treg enrichment we cultured PBMC-derived hT cells with the same single-factor and combination treatments previously described for murine T cells (Fig. 6a). CRCs in combination with TGF-β1 (3.2 ± 0.4-fold expansion) suppressed hT cell proliferation more than CRCs (5.3 ± 1.2-fold expansion) or TGF-β1 (22.3 ± 0.4-fold expansion) alone (Fig. 6b). The fraction of CD25+FoxP3+ T cells among CD4+ T cells was highest in the combination group (63.5% ± 7.4%), though the enrichment was not greater than the single treatment CRCs (58.1% ± 2.7%) and TGF-β1 (32.9% ± 0.6%) combined (Fig. 6c).TGF-β1 and CRCs reduce IFNγ expression, enrich IFNγ−TNFα+ human T cells
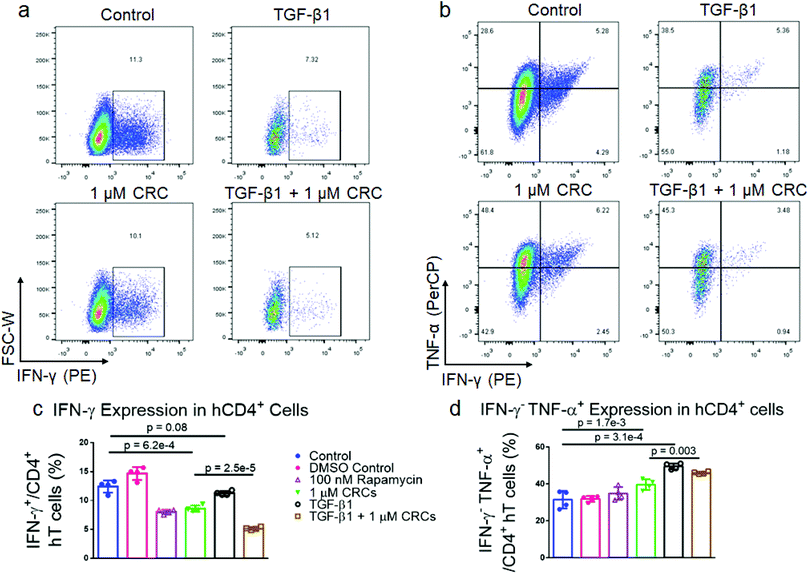
To characterize the effect of CRCs on cytokine expression in hT cells alone and in combination with TGF-β1, we expanded T cells as previously described. After 7 days of expansion, the cells were re-stimulated with phorbol 12-myristate 13-acetate (PMA) and ionomycin and analyzed for interferon-γ (IFNγ) and tumor necrosis factor-α (TNFα) expression (Fig. 7a and b). DMSO-solubilized 100 nM Rapa (8.1% ± 0.4%) and 1 μM CRCs (8.6% ± 0.5%) reduced IFNγ expression of CD4+ hT cells relative to a DMSO-treated control (14.7% ± 1.1%) and untreated control (12.4% ± 1.1%) (Fig. 7c). TGF-β1 alone (11.3% ± 0.4%) did not reduce IFNγ relative to controls. However, TGF-β1 in combination with 1 μM CRCs (5.2% ± 0.3%) decreased IFNγ more than TGF-β1 or 1 μM CRCs alone. TGF-β1 (49.5% ± 1.6%) increased the fraction of IFNγ−TNFα+ more than the combination of 1 μM CRCs and TGF-β1 (46.0% ± 0.7%) relative to untreated control (31.5% ± 4.8%) (Fig. 7d). DMSO-solubilized 100 nM Rapa (34.6% ± 4.3%) did not increase the IFNγ−TNFα+ fraction relative to DMSO containing controls (31.9% ± 1.5%), while 1 μM CRCs (39.6% ± 2.9%) enhanced the fraction relative to control.Computational model characterizes the dependence of Treg enrichment to initial cell population
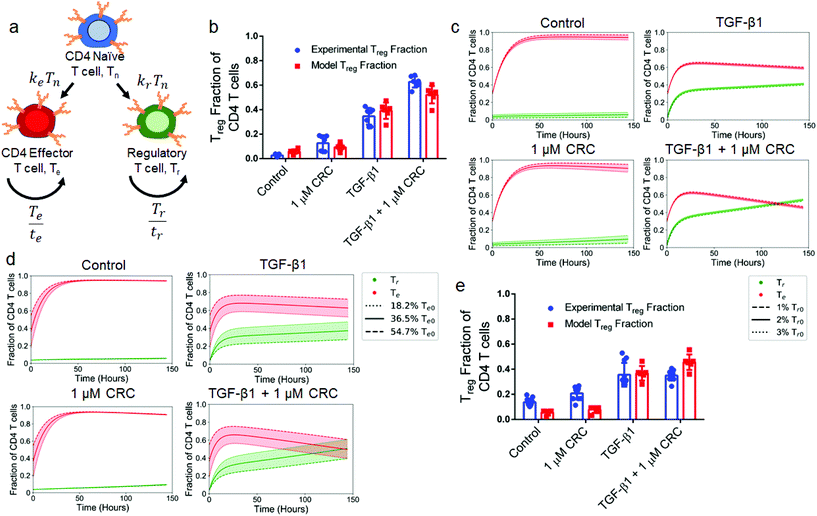
To explain how culture conditions and starting cell populations contribute to experimental outcomes and variance, we developed and optimized a model describing the kinetics of differentiation and expansion of model naïve (Tn), regulatory (Tr) and effector (Te) CD4+ T cells (Fig. 8a). Details of the model and parameter fitting may be found in the ESI.† First, we looked at the sensitivity to the initial Tr population over a range of commonly reported Treg splenocyte fractions. We initialized the model with 1%, 2%, and 3% Tr with a fixed Te (36.5%) fraction and variable Tn (62.5%, 61.5% and 60.5%) fraction that correspond to the averages of values from isolated murine splenocytes analyzed via flow cytometry (Fig. S1d†). This revealed that the post-expansion Tr fraction was most sensitive to the initial Tr fraction in the 1 μM CRC condition with a range of 4.9%–13.8%, while outcomes for control (3.0%–8.7%), TGF-β1 (39.7%–42.2%), and combination (53.1%–55.6%) conditions are tightly grouped and independent of the initial Tr fraction (Fig. 8b). The results from the model were consistent with experimental data for control (5.80% ± 1.66% vs. 2.61% ± 1.03%), 1 μM CRC (9.38% ± 2.58% vs. 12.6% ± 5.9%), and TGF-β1 (39.1% ± 6.1% vs. 34.6% ± 6.3%), and slightly underestimated Tr enrichment by the combination of CRC/TGF-β1 (52.2% ± 6.5% vs. 62.7% ± 4.2%), but still demonstrated a synergistic effect (Fig. 8c). Due to the high variability in naïve T cell fraction in human peripheral blood samples, we next analyzed the sensitivity of final Tr fraction to the initial naïve-to-effector T cell ratio. We quantified the effect of changing the initial Te fraction between 18.2%, 36.5% and 54.7% while fixing the Tr fraction at 2%. The range of values for the initial Te fraction was chosen to cover the range of observed fractions of effector T cells seen in human and mouse samples. The impact of variance in initial Te fraction on the final Tr fraction was significantly higher with TGF-β1 (27.4%–47.3%) and combination of CRC/TGF-β1 (39.4%–60.5%), and minimal in the control (5.5%–6.1%) and with CRCs only (9.0%–9.7%) (Fig. 8d). Finally, to characterize the role that the delay in hT cell expansion kinetics relative to mT cells plays in abrogating the synergistic effect of combination CRC/TGF-β1, a modified model was used in which expansion did not begin until 48 hours after differentiation. Results from the modified model revealed that the additive Treg enrichment observed with 1 μM CRCs (7.86% ± 2.35%) or TGF-β1 (36.8% ± 5.3%) alone was not significantly different than the combination of both factors (45.6% ± 5.6%) (Fig. 8e).Discussion
Here we demonstrate Tregs are enriched up to 5-fold in vitro in which β-cyclodextrin encapsulated Rapa complex (CRC) plays a key role in the differential modulation of proliferating T cell subsets. The encapsulation of Rapa in the CRC enhanced its activity in vitro and delivery to T cells, synergizing with TGF-β1 to efficiently produce mouse and human Tregs. Encapsulation of Rapa in the CRC by equilibrium mixing was directly proportional to the concentration of the βCD-NH2 concentration, up to the limit of solubility of βCD-NH2. The CRC complex significantly improved the aqueous solubility of Rapa by over 2 orders of magnitude and was stable in solution for at least one month. The addition of CRCs in T cell growth medium selectively suppressed the expansion of CD4+FoxP3− T cells in a dose-dependent manner and enhanced the fraction of CD4+FoxP3+ Tregs with both mT and hT cells. The coadministration of the T cell modulating factor TGF-β1 and CRC enriched mouse and human Tregs through the expansion of CD4+FoxP3+ Tregs and suppression of CD4+FoxP3− T cells respectively, with evidence of synergism in mouse Treg expansion. The findings are consistent with the observations of CRC-mediated reduction in the expression of the inflammatory mediator, IFN-γ, in both mT and hT cells.Mono-(6-amino-6-deoxy)-beta-cyclodextrin enhances the aqueous solubility of Rapa over 100-fold and is a stable carrier for Rapa. Mono-(6-amino-6-deoxy)-beta-cyclodextrin was chosen as it has significantly enhanced solubility compared to unmodified beta-cyclodextrin and previous reports found that hydroxypropyl-beta-cyclodextrin minimally improved Rapa solubility.32 The ∼1![[thin space (1/6-em)]](https://www.rsc.org/images/entities/char_2009.gif) :
:![[thin space (1/6-em)]](https://www.rsc.org/images/entities/char_2009.gif) 100 ratio of solubilized Rapa to βCD-NH2s is comparable to Rapa encapsulation with other βCD molecules. After an initial decrease in concentration βCD-NH2-Rapa complexes maintained a stable concentration in solution and retained their bioactivity for up to one month (Fig. S3†). The initial drop in concentration is likely due to the small fraction that dissociates to establish equilibrium.
100 ratio of solubilized Rapa to βCD-NH2s is comparable to Rapa encapsulation with other βCD molecules. After an initial decrease in concentration βCD-NH2-Rapa complexes maintained a stable concentration in solution and retained their bioactivity for up to one month (Fig. S3†). The initial drop in concentration is likely due to the small fraction that dissociates to establish equilibrium.
The CRCs potently modulated both mT and hT cells, supporting the relevance of this delivery strategy for Rapa in generating Tregsin vitro. In prior work, particle systems composed of poly(lactide-co-glycolide) (PLGA), poly(D,L-lactide) (PDLLA), poly(ε-caprolactone) (PCL), and poly(alkyl cyanoacrylates) (PACs) have been used to improve the bioavailability of Rapa in vivo and improved its delivery to target tissues before release.12,33,34 However, in contrast to in vivo delivery, particle-based Rapa delivery systems are unsuitable for in vitro expansion as their uptake by activated T cells is highly inefficient. Moreover, the high concentration of degradable synthetic polymers in vitro would likely be cytotoxic. The introduction of synthetic polymers would also increase the complexity of manufacturing in vitro generated Tregs.
The apparent effect of Rapa in the CRC was diminished by approximately 100-fold in mT cells and 10-fold in hT cells compared to DMSO-solubilized Rapa. In contrast to cyclodextrins, DMSO is a cell membrane permeabilizing agent that directly inserts and disrupts the cell membrane and thereby facilitates intracellular drug delivery. However, the use of DMSO for intracellular delivery is not a scalable strategy for T cell manufacturing in vitro. Consistent with prior results, we observe that CD4+ T cells are highly sensitive to the concentration of DMSO and even low doses potently suppresses their expansion.35 Moreover, DMSO are potentially toxic at the high concentrations that are often used to manufacture cells, which complicates direct use in patients, and its removal is a complex processes associated with a detrimental osmotic shock to the cells.36 In contrast, and consistent with prior reports, we observe that T cell growth, function and phenotype is not affected by βCD-NH2 alone.
The difference in the intracellular concentration of Rapa may have a considerable effect on the enrichment of Tregs because of the concentration-dependent effect on mTOR complex formation (mTORC1 and mTORC2). We observed that the suppression in mT cell expansion was dose dependent for 10 nm, 100 nm, and 1 μM CRC, while enrichment in Treg was observed for 1 μM CRC. These findings are consistent with previous reports, which have established that mTORC1 is more sensitive to Rapa-mediated inhibition than mTORC2.37 Inhibition of mTORC1 prevents the differentiation of T helper (Th) 1 CD4+ T cells, consistent with the reduction of IFN-γ expression of T cells expanded with CRCs, and is an important step for enriching Treg![[thin space (1/6-em)]](https://www.rsc.org/images/entities/char_2009.gif) 38 On the other hand, the inhibition of mTORC2 enhances the suppressive capacity of Treg.39 Robust mTORC2 inhibition requires sustained exposure to higher concentrations of Rapa, and therefore CRCs are preferred over DMSO as they are an inert carrier and preserve bioactivity of Rapa, and thereby sustain presentation to T cells.40
38 On the other hand, the inhibition of mTORC2 enhances the suppressive capacity of Treg.39 Robust mTORC2 inhibition requires sustained exposure to higher concentrations of Rapa, and therefore CRCs are preferred over DMSO as they are an inert carrier and preserve bioactivity of Rapa, and thereby sustain presentation to T cells.40
The enhancement in murine Tregs with CRCs together with TGF-β1 was greater than the sum of Tregs when either factor was applied individually. CRCs increased the fraction Tregs primarily via suppression of CD4+CD25+FoxP3− T cell expansion whereas TGF-β1 increased the fraction of Tregs by increasing the absolute number of CD4+CD25+FoxP3+ T cells. This observation is supported by prior observations of the synergistic effect of Rapa and TGF-β1 for the in vitro induction of Tregs from naïve CD4+ T cells. The in vitro enhancement of human Tregs from naïve T cells by TGF-β1 alone is consistent with prior reports. However, in contrast to splenocyte-isolated mT cells, naïve CD4+ T cells must be isolated from human blood and only make up 1–10% of leukocytes, with significant variation between donors. This variability supports the combined use of both Rapa and TGF-β1 to generate human Treg. Here, we confirmed that the immunomodulation by Rapa and TGF-β1 extends to polyclonal T cells, consisting of both mature and naïve T cells (Fig. S1d†). The enhancement of the Treg from heterogenous T cell subsets is clinically relevant as PBMC-isolated T cells are often a combination of memory T cells and recently activated naïve T cells.
The reduction in IFNγ expression and enrichment of IFNγ−TNFα+ mediated by CRCs was consistently observed in both mT and hT cells. In mT cells, TGF-β1 enhanced the expression of both IFNγ and TNFα. This is consistent with prior reports characterizing the inhibition of naïve murine T cell activation and enhancement of Th1 cells in a mixed T cell population by TGF-β1.41 Because the initially isolated T cells contained a mixed population of T cell subsets, the TGF-β1 likely enhanced activation of pre-existing Th1 T cells. In contrast, with hT cells, the combination of TGF-β1 and CRCs decreased the fraction of IFNγ+ T cells more than either factor individually. The difference in cytokine expression between mT and hT cells suggests that the source of T cells for Treg enrichment is important. Furthermore, TGF-β1 did not enhance IFN-γ expression in hT cells and supports the translation of this approach for Treg expansion in the clinic, where it will likely be difficult to enrich high numbers of naïve autologous T cells. CRCs enhanced the fraction of IFN-γ−TNF-α+ T cells. This observation is consistent with prior reports that have demonstrated that Treg priming via the TNFRII receptor enhances Treg function and TNFRII marks a highly immunosuppressive Tregs subset.42
The kinetic growth model describing Treg expansion and differentiation supported the role of CRCs in mediating Treg enrichment primarily through suppression of effector T cell expansion, and that of TGF-β1 through the differentiation of naïve T cells into Tregs. Strikingly, the model accurately recapitulates the synergistic effect of CRCs and TGF-β1 in murine T cells, and the incorporation of a delay in T cell expansion abrogates this effect, providing a possible explanation for why synergism is not observed under the same conditions with hT cells. However, the model under-represents the fraction of Tregs in the murine combination condition, and in human control and CRC only conditions. CRCs inhibit IFN-γ, a key driver of Th1 differentiation. Thus, in the combination conditions the rate of differentiation into effector CD4 T cells is likely lower than predicted by the model, and a larger fraction differentiates into Tregs. The model is also useful for evaluating the distribution of final T cell subsets based on the initial fractions and suggests that a high naïve-to-effector ratio improves the enrichment of Treg, confirming the importance of pre-sorting for naïve T cells before expansion and phenotypic modulation in clinical applications.43 As quality control guidelines for ACT based Treg therapies are established, this model may serve as the basis for a tool to determine product sensitivity to key input parameters and apply process controls to minimize variance in Treg manufacturing, a necessary step in developing good manufacturing practice protocols.44
Conclusions
Our findings collectively suggest that the βCD-NH2 encapsulated Rapa enhances Tregin vitro. CRCs increase the bioavailability of Rapa due to strong hydrophobic interactions with βCD-NH2, and the stability of the inclusion complex was confirmed via spectrophotometry. Compared with DMSO, the CRCs (i) improve the solubility of Rapa without inducing T cell toxicity, (ii) shield Rapa from degradation, thereby increasing half-life and uptake by T cells, (iii) synergize with TGF-β1 to enhance preferential expansion of Treg. Additionally, CRCs significantly decrease the production of IFN-γ by effector T cells and thereby reduces naïve T cells differentiation into a Th1 phenotype. The enhancement in TNF-α expression may act to prime the Tregs and enhance functionality. The kinetic model recapitulates the synergism between the CRCs and TGF-β1 in modulating the kinetics of Treg expansion in vitro and evaluates parameters for scalable manufacturing methods for immune cell therapies with Treg.While the current study investigated enhancement of polyclonal Tregin vitro, further development of CRCs in combination with TGF-β1 for in vivo local delivery could enable the enhancement of Treg for a number of local and systemic autoimmune diseases. Given that Rapa and TGF-β1 are clinically used therapies, their application for immune cell manufacturing could enable safer administration of Treg as a means to treat autoimmune disease either alone or in combination with therapeutics currently utilized in the clinic. It may be a means of abrogating the significant side effects that limit clinical application of these pleiotropic drugs by restricting their potent immunomodulatory effects to T cells.
Author contributions
D. A. M., M. D. K. and N. J. S., conceived the ideas, designed the experiments, analyzed and interpreted the data and wrote the manuscript. D. A. M., M. D. K., S. L. W., Y. Y. Y., and D. A. O., conducted the experiments. All authors discussed the results and provided input in writing the manuscript.Conflicts of interest
The authors have no relevant competing financial interests or relationships that could have influenced the work reported in this paper.Acknowledgements
The work was supported in part by a grant from the National Psoriasis Foundation, the American Cancer Society (IRG-15-172-45-IRG) and the Microenvironment in Arthritis Resource Center (MARC) at UC San Diego, supported by the NIH/NIAMS (P30 AR073761). D. A. M. and M. D. K. were supported by the NIH through grants T32 AR064194 and T32 CA153915 respectively. The UC San Diego Academic Enrichment Program supported Y. Y. Y. through a McNair Scholarship. D. A. O. was supported through a California Louis Stokes Alliance for Minority Participation Scholarship and the UC San Diego Initiative for Maximizing Student Development (IMSD) program supported through a grant from the NIH/NIGMS R25 GM083275. The authors acknowledge helpful discussions with Cheryl Kim at the Flow Cytometry Core in the La Jolla Institute for Immunology. The La Jolla Institute of Immunology's FACSAria II cell sorter was acquired through the NIH Shared Instrumentation Grant Program S10 RR027366.References
- S. Sakaguchi, R. Setoguchi, H. Yagi and T. Nomura, Curr. Top. Microbiol. Immunol., 2006, 305, 51–66 CAS.
- J. A. Bluestone and Q. Tang, Science, 2018, 362, 154–155 CrossRef CAS PubMed.
- N. Marek-Trzonkowska, M. Mysliwiec, A. Dobyszuk, M. Grabowska, I. Derkowska, J. Juscinska, R. Owczuk, A. Szadkowska, P. Witkowski, W. Mlynarski, P. Jarosz-Chobot, A. Bossowski, J. Siebert and P. Trzonkowski, Clin. Immunol., 2014, 153, 23–30 CrossRef CAS PubMed.
- G. P. Wright, C. A. Notley, S. A. Xue, G. M. Bendle, A. Holler, T. N. Schumacher, M. R. Ehrenstein and H. J. Stauss, Proc. Natl. Acad. Sci. U. S. A., 2009, 106, 19078–19083 CrossRef CAS PubMed.
- N. J. Shah, A. S. Mao, T. Y. Shih, M. D. Kerr, A. Sharda, T. M. Raimondo, J. C. Weaver, V. D. Vrbanac, M. Deruaz, A. M. Tager, D. J. Mooney and D. T. Scadden, Nat. Biotechnol., 2019, 37, 293–302 CrossRef CAS PubMed.
- B. R. Olden, C. R. Perez, A. L. Wilson, I. I. Cardle, Y. S. Lin, B. Kaehr, J. A. Gustafson, M. C. Jensen and S. H. Pun, Adv. Healthcare Mater., 2019, 8, e1801188 Search PubMed.
- C. S. Verbeke, S. Gordo, D. A. Schubert, S. A. Lewin, R. M. Desai, J. Dobbins, K. W. Wucherpfennig and D. J. Mooney, Adv. Healthcare Mater., 2017, 6, 1600773 CrossRef PubMed.
- Q. Tang, K. J. Henriksen, M. Bi, E. B. Finger, G. Szot, J. Ye, E. L. Masteller, H. McDevitt, M. Bonyhadi and J. A. Bluestone, J. Exp. Med., 2004, 199, 1455–1465 CrossRef CAS PubMed.
- A. L. Putnam, T. M. Brusko, M. R. Lee, W. Liu, G. L. Szot, T. Ghosh, M. A. Atkinson and J. A. Bluestone, Diabetes, 2009, 58, 652–662 CrossRef CAS PubMed.
- S. Sakaguchi, K. Wing, Y. Onishi, P. Prieto-Martin and T. Yamaguchi, Int. Immunol., 2009, 21, 1105–1111 CrossRef CAS PubMed.
- J. Li, S. G. Kim and J. Blenis, Cell Metab., 2014, 19, 373–379 CrossRef CAS PubMed.
- A. Haeri, M. Osouli, F. Bayat, S. Alavi and S. Dadashzadeh, Artif. Cells, Nanomed., Biotechnol., 2018, 46, 1–14 CrossRef CAS PubMed.
- N. Saber-Moghaddam, H. Nomani, A. Sahebkar, T. P. Johnston and A. H. Mohammadpour, Int. Immunopharmacol., 2019, 69, 150–158 CrossRef CAS PubMed.
- Y. Dobashi, Y. Watanabe, C. Miwa, S. Suzuki and S. Koyama, Int. J. Clin. Exp. Pathol., 2011, 4, 476 CAS.
- M. Battaglia, A. Stabilini, B. Migliavacca, J. Horejs-Hoeck, T. Kaupper and M. G. Roncarolo, J. Immunol., 2006, 177, 8338–8347 CrossRef CAS PubMed.
- P. Monti, M. Scirpoli, P. Maffi, L. Piemonti, A. Secchi, E. Bonifacio, M. G. Roncarolo and M. Battaglia, Diabetes, 2008, 57, 2341–2347 CrossRef CAS PubMed.
- H. Q. Niu, Z. H. Li, W. P. Zhao, X. C. Zhao, C. Zhang, J. Luo, X. C. Lu, C. Gao, C. H. Wang and X. F. Li, Clin. Exp. Rheumatol., 2019, 38, 58–66 Search PubMed.
- A. Schmidt, M. Eriksson, M. M. Shang, H. Weyd and J. Tegner, PLoS One, 2016, 11, e0148474 CrossRef PubMed.
- M. Esposito, F. Ruffini, M. Bellone, N. Gagliani, M. Battaglia, G. Martino and R. Furlan, J. Neuroimmunol., 2010, 220, 52–63 CrossRef CAS PubMed.
- H.-J. Shin, J. Baker, D. B. Leveson-Gower, A. T. Smith, E. I. Sega and R. S. Negrin, Blood, 2011, 118, 2342–2350 CrossRef CAS PubMed.
- K. Wieder, W. Hancock, G. Schmidbauer, C. Corpier, I. Wieder, L. Kobzik, T. Strom and J. Kupiec-Weglinski, J. Immunol., 1993, 151, 1158–1166 CAS.
- R. Setoguchi, Y. Matsui and K. Mouri, Eur. J. Immunol., 2015, 45, 893–902 CrossRef CAS PubMed.
- K. Mahalati and B. D. Kahan, Clin. Pharmacokinet., 2001, 40, 573–585 CrossRef CAS PubMed.
- P. Simamora, J. M. Alvarez and S. H. Yalkowsky, Int. J. Pharm., 2001, 213, 25–29 CrossRef CAS PubMed.
- M. E. Davis and M. E. Brewster, Nat. Rev. Drug Discovery, 2004, 3, 1023 CrossRef CAS PubMed.
- F. Hirayama and K. Uekama, Adv. Drug Delivery Rev., 1999, 36, 125–141 CrossRef CAS PubMed.
- V. J. Stella and Q. He, Toxicol. Pathol., 2008, 36, 30–42 CrossRef CAS PubMed.
- M. A. Rouf, I. Vural, E. Bilensoy, A. Hincal and D. D. Erol, J. Inclusion Phenom. Macrocyclic Chem., 2011, 70, 167–175 CrossRef.
- Y. Dou, J. W. Guo, Y. Chen, S. L. Han, X. Q. Xu, Q. Shi, Y. Jia, Y. Liu, Y. C. Deng, R. B. Wang, X. H. Li and J. X. Zhang, J. Controlled Release, 2016, 235, 48–62 CrossRef CAS PubMed.
- N. A. Rohner, S. J. Schomisch, J. M. Marks and H. A. von Recum, Mol. Pharmaceutics, 2019, 16, 1766–1774 CrossRef CAS PubMed.
- S. Yamagiwa, J. D. Gray, S. Hashimoto and D. A. Horwitz, J. Immunol., 2001, 166, 7282–7289 CrossRef CAS PubMed.
- M.-S. Kim, J.-S. Kim, H. J. Park, W. K. Cho, K.-H. Cha and S.-J. Hwang, Int. J. Nanomed., 2011, 6, 2997 CAS.
- J. Zhao, Z. Mo, F. Guo, D. Shi, Q. Q. Han and Q. Liu, J. Biomed. Mater. Res., Part B, 2018, 106, 88–95 CrossRef CAS PubMed.
- S. Jhunjhunwala, S. C. Balmert, G. Raimondi, E. Dons, E. E. Nichols, A. W. Thomson and S. R. Little, J. Controlled Release, 2012, 159, 78–84 CrossRef CAS PubMed.
- L. Holthaus, D. Lamp, A. Gavrisan, V. Sharma, A.-G. Ziegler, M. Jastroch and E. Bonifacio, J. Immunol. Methods, 2018, 463, 54–60 CrossRef CAS PubMed.
- S. Thirumala, W. S. Goebel and E. J. Woods, Organogenesis, 2009, 5, 143–154 CrossRef PubMed.
- A. Toschi, E. Lee, L. Xu, A. Garcia, N. Gadir and D. A. Foster, Mol. Cell. Biol., 2009, 29, 1411–1420 CrossRef CAS PubMed.
- G. M. Delgoffe, K. N. Pollizzi, A. T. Waickman, E. Heikamp, D. J. Meyers, M. R. Horton, B. Xiao, P. F. Worley and J. D. Powell, Nat. Immunol., 2011, 12, 295–303 CrossRef CAS PubMed.
- L. M. Charbonnier, Y. Cui, E. Stephen-Victor, H. Harb, D. Lopez, J. J. Bleesing, M. I. Garcia-Lloret, K. Chen, A. Ozen, P. Carmeliet, M. O. Li, M. Pellegrini and T. A. Chatila, Nat. Immunol., 2019, 20, 1208–1219 CrossRef CAS PubMed.
- D. D. Sarbassov, S. M. Ali, S. Sengupta, J. H. Sheen, P. P. Hsu, A. F. Bagley, A. L. Markhard and D. M. Sabatini, Mol. Cell, 2006, 22, 159–168 CrossRef CAS PubMed.
- D. J. Huss, R. C. Winger, H. Peng, Y. Yang, M. K. Racke and A. E. Lovett-Racke, J. Immunol., 2010, 184, 5628–5636 CrossRef CAS PubMed.
- X. Chen, J. J. Subleski, H. Kopf, O. Z. Howard, D. N. Männel and J. J. Oppenheim, J. Immunol., 2008, 180, 6467–6471 CrossRef CAS PubMed.
- J. M. Marin Morales, N. Munch, K. Peter, D. Freund, U. Oelschlagel, K. Holig, T. Bohm, A. C. Flach, J. Kessler, E. Bonifacio, M. Bornhauser and A. Fuchs, Front. Immunol., 2019, 10, 38 CrossRef PubMed.
- S. Eaker, M. Armant, H. Brandwein, S. Burger, A. Campbell, C. Carpenito, D. Clarke, T. Fong, O. Karnieli, K. Niss, W. Van't Hof and R. Wagey, Stem Cells Transl. Med., 2013, 2, 871–883 CrossRef CAS PubMed.
Footnote |
| † Electronic supplementary information (ESI) available. See DOI: 10.1039/d0bm00622j |
| This journal is © The Royal Society of Chemistry 2020 |

