 Open Access Article
Creative Commons Attribution 3.0 Unported Licence
Generation of maghemite nanocrystals from iron–sulfur centres†
Samya
Banerjee
 a,
Andreas
Omlor
 b,
Juliusz A.
Wolny
 b,
Yisong
Han
 c,
Frederik
Lermyte
 ad,
Amy E.
Godfrey
 a,
Peter B.
O'Connor
 a,
Volker
Schünemann
 b,
Mohsen
Danaie
 *e and
Peter J.
Sadler
 *a
*a
aDepartment of Chemistry, University of Warwick, Gibbet Hill Road, Coventry CV4 7AL, UK. E-mail: P.J.Sadler@warwick.ac.uk
bDepartment of Physics, Technische Universität Kaiserslautern, Erwin-Schrödinger-Straße 46, 67663 Kaiserslautern, Germany
cDepartment of Physics, University of Warwick, Gibbet Hill Road, Coventry CV4 7Al, UK
dSchool of Engineering, University of Warwick, Gibbet Hill Road, Coventry CV4 7Al, UK
eDiamond Light Source Ltd, electron Physical Science Imaging Centre (ePSIC), Harwell Science & Innovation Campus, Didcot, Oxfordshire OX11 0DE, UK. E-mail: mohsen.danaie@diamond.ac.uk
First published on 5th April 2019
Abstract
Iron oxide nano-crystals 0.1–1.1 μm in diameter were generated on sulfur-doped amorphous carbon surfaces by electron beam irradiation of the novel 13e− high-spin complex [Fe(4-methyl-1,2-benzenedithiolate)2][NHEt3] encapsulated in a triblock copolymer. Possible relevance to iron nano-mineralization from Fe–S ferredoxin proteins and iron dysregulation in neurological disorders is discussed.
Iron is an essential element for mammals and, amongst many other functions, plays an important role in the human brain.1 Recent research has indicated a strong association between iron dysregulation and Alzheimer's disease (AD), although it is unknown how the chemical and magnetic state of iron is linked to AD pathogenesis.2–4 Reports from Collingwood et al., and Dobson et al., for example, have shown the presence of iron oxide as the mixed oxidation state mineral, magnetite (Fe3O4) in AD tissue, a possible source of redox-active iron, but it remains unclear how this kind of iron mineral forms in the tissue.5,6 These unsolved and important questions have led us to consider how atomic resolution microscopy might provide new insight into nanoscale iron mineralization.
Recently we reported methodology for studies of the nano-mineralisation of osmium, gold, ruthenium and iridium from their respective 1,2-dicarba-closo-dodecarborane-1,2-dithiolate complexes encapsulated in polymer micelles upon electron beam irradiation.7–9 Here we report the synthesis and characterization of the novel 13e− iron(III) complex [Fe(4-methyl-1,2-benzenedithiolate)2][NHEt3] (1), containing Fe–S bonds analogous to those in the ubiquitous iron–sulfur ferredoxin proteins. Importantly, recent research has indicated a strong relationship between neurodegenerative disorders and defective Fe–S clusters.10,11 We have characterized complex 1 using Mössbauer, Raman and far-infra red spectroscopy, and investigated the generation of iron nanocrystals from 1 encapsulated in a poly(ethylene glycol)-block-poly(propylene glycol)-block-poly(ethylene glycol) polymer (Scheme 1) by electron beam irradiation, and used electron energy-loss spectra (EELS) to identify the oxidation state of iron and its coordination environment in the nanocrystals.
 | ||
| Scheme 1 Self-assembly of block copolymer (P123) micelles (FeMs) containing encapsulated 13e Fe(III) complex [Fe(4-methyl-1,2-benzenedithiolate)2][NHEt3] (1). | ||
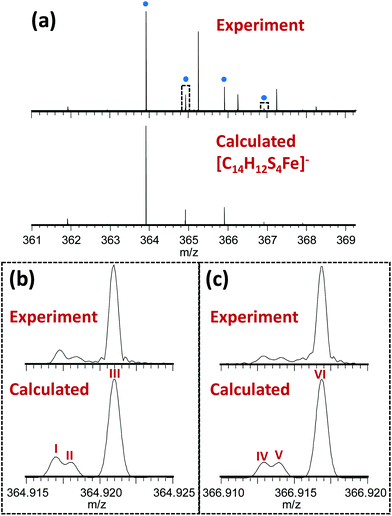
The novel 13-electron Fe(III) complex 1 was synthesized by reacting FeCl3 (0.2 mmol) with toluene-3,4-dithiol (0.4 mmol), in the presence of 2 mol equiv. of the base trimethylamine (Et3N; 0.8 mmol). The complex was characterized by elemental analysis, mass spectrometry, IR, Raman and Mössbauer spectroscopy. The Fourier-transform ion cyclotron resonance mass spectrometry (FTICR-MS) analysis of the complex showed a good match between the theoretical and observed isotopic fine structure for the negative ion [Fe(4-methyl-1,2-benzenedithiolate)2]−, [C14H12S4Fe]− (Fig. 1, S1, Table S1, ESI†).
 | ||
| Fig. 1 (a) Observed mass spectrum of [Fe(4-methyl-1,2-benzenedithiolate)2]− (peaks labelled with blue dots) and comparison with the calculated isotope distribution. Unlabelled peaks are due to a contaminant present in the solvent (MeOH), (see Fig. S1, Table S2, ESI†). Panels (b) and (c) show zoomed-in views (10 mDa wide) of the peaks near 364.92 and 366.92 m/z (indicated by dotted rectangles in Panel A) illustrating a good match between the theoretical and observed isotopic fine structure indicating high confidence in the assigned elemental compositions. These fine structure peaks were assigned as follows: I – [12C141H1232S333S56Fe]−; II – [12C141H1232S457Fe]−; III – [12C1313C1H1232S456Fe]−; IV – [12C141H1232S233S34S56Fe]−; V – [12C141H1232S334S57Fe]−; VI – [12C1313C1H1232S334S56Fe]−. Note that the spectra in panels (b) and (c) are effectively expanded 400-fold compared to panel (a), explaining why the additional fine structure peaks are not visible in the top spectrum. | ||
The Mössbauer spectrum of 1 contains a doublet with isomer shift δ varying from 0.48 mm s−1 at 77 K to 0.33 mm s−1 at ambient temperature (Fig. 2(a)), while the quadrupole splitting ΔEQ changes from 0.77 to 0.73 mm s−1, respectively, suggesting that iron is in the +3 oxidation state.12 The Raman spectrum (Fig. 2(b)) shows three intense bands in the 600–900 cm−1 region, at 864, 683 and 637 cm−1 and a number of bands in the region of 300–550 cm−1. The Raman bands at 370, 330, 303 cm−1 are in good agreement with literature reports for Fe–S bonds and are associated with the Fe–S stretching motions, confirming their formation in complex 1.13,14 The IR spectrum in the far infrared region shows bands at 68, 97, 171, 463, 472 and 553 cm−1 (Fig. 2(c), S2, ESI†). The bands at 68, 97, 171 cm−1 are assignable to S–Fe–S, and Fe–S–C bending motions.14 On the basis of these spectral results it is difficult to assign an exact geometry to the complex. DFT calculations suggest that a high-spin tetrahedral configuration is likely to be more stable than a square-planar configuration (see ESI, Table S3, Fig. S3†).
 | ||
| Fig. 2 (a) Mössbauer spectrum of complex 1 at 77 K. (b) Raman spectrum, and (c) IR spectrum of complex 1 at ambient temperature. | ||
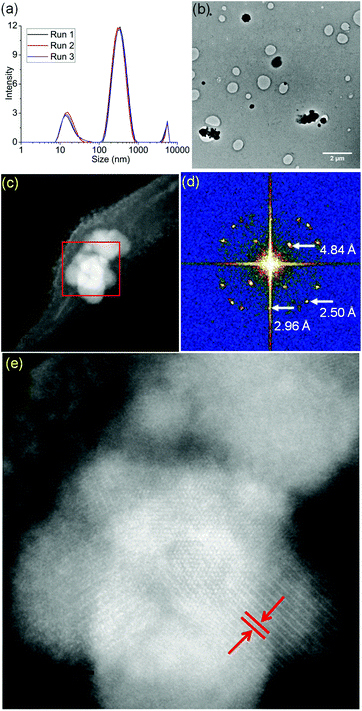
Micelles containing encapsulated complex 1 (FeMs) were synthesized by encapsulation of 1 in the triblock copolymer Pluronic P123 by mixing a tetrahydrofuran (THF) solution of 1 with an aqueous solution of P123 (THF–pure water (18.2 MΩ): 1/10 v/v; [1] = 5 mg mL−1), at ambient temperature for 4 h. The solution was then dialyzed against 18.2 MΩ pure water to remove the THF (MWCO = 1000 Da), for 54 h, and freeze-dried to give FeMs (Scheme 1). On encapsulation of the Fe(III) complex, the colour of the micelles changed from transparent to grey, indicating the presence of the 13-electron complex in the micelles. Dynamic light scattering (DLS) data (Fig. 3(a)) clearly indicate that the polymer P123 and 1 self-assemble in solution to give micelles with a very low-dispersity parameter (ca. 0.2). Encapsulation resulted in an increase of micellar size (hydrodynamic diameter) of P123 from 19.6 ± 1.8 nm to 315.1 ± 24.7 nm with dispersity of 0.18, consistent with reports that micellar size usually increases after encapsulation of organic molecules, and suggests that solvent molecules might also be incorporated into the micelles.15,16 A small (<0.02%) second population of FeMs particles was found with a hydrodynamic diameter ca. 5500 nm, and a strong intensity in DLS arising from the aggregation of some particles.
FeMs micelles were dispersible in water and as the P123 polymer can form stable Langmuir films at ambient temperature, were also deformable on surfaces.17 Hence, we deposited aqueous droplets containing micelles ([FeMs] = 1 mg ml−1) onto lacey carbon-coated TEM grids to generate an unsupported film over the grid holes for examination by aberration-corrected scanning transmission electron microscopy (STEM). With the advent of probe spherical aberration correction and sub-Å resolution, annular dark-field imaging in STEM offers direct imaging of single atoms.18 Structural changes to the micelles were triggered by electron beam exposure with a large stationary beam for 5 min, as described in the ESI.† We acquired high-angle annular dark-field (HAADF) images in parallel to electron energy-loss spectra (EELS, Gatan Quantum GIF detector) and energy-dispersive X-ray (EDX) spectra (more experimental details provided in the ESI†). We observed the generation of many iron clusters varying in size from 100 nm–1.2 μm upon electron beam exposure (Fig. 3(b) and (c)). As shown in Fig. 3(d) and (e), the interplanar distance of ca. 4.84 Å, are similar to literature values for the {111} planes of both magnetite Fe3O4 and maghemite γ-Fe2O3 (Fig. S4, ESI†).19 Considering all the potential mechanisms for electron beam-induced damage,20 the most likely damage mechanism in this case is radiolysis through inelastic scattering of the electron beam. In organic solids, this scattering can cause excitation in the covalent bonds, especially the C–H bonds, resulting in structural change and mass loss (loss of H).21 Importantly, the STEM analysis was carried out in vacuo, so under these conditions, the oxygen in the mineral is likely to arise from encapsulated solvent H2O, and ether or terminal hydroxyl groups of the polymer.
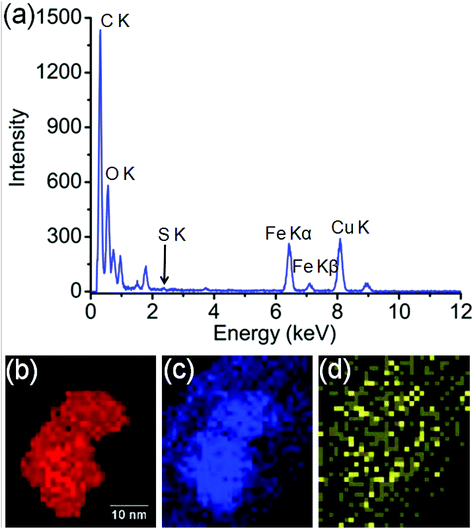
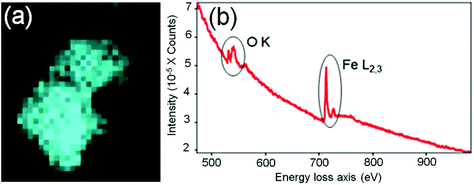
In order to identify better the type of the iron oxide observed, the composition of the nanoclusters was further investigated by electron energy-loss spectroscopy (EELS) and energy-dispersive X-ray spectroscopy (EDX). As shown in the Fig. 4(a–d), EDX analysis of K characteristic signals indicated the co-localisation of Fe, O and S. EDX quantification for the particles (shown with details in the ESI section, Fig. S5, ESI†) yields oxygen values larger than expected for any stoichiometric iron oxide. This can be due to overlapping species rich in oxygen within this region. The experimental EELS spectra (Fig. 5) match well with the reference EELS spectrum of Fe2O3 (Fig. S6†). Using the HyperSpy package,22 we fitted a powerlaw background and the Fe L3,2 and O–K edges to the experimental data. The ratio of Fe L3 to L2 peaks in the model was ∼1.43 which is close to that measured for the Fe2O3 reference spectrum (1.96). This observation along with the STEM data suggested the formation of iron–oxide nanoclusters on a sulphur-doped amorphous carbon surface (generated in the electron beam).
 | ||
| Fig. 4 (a) EDX spectroscopy analysis of the Fe-nanoclusters at 80 keV. (b) EDX iron K map, (c) EDX oxygen K map, (d) EDX sulfur K map. | ||
In summary, we have synthesised and characterised a novel 13-electron high-spin Fe(III) complex containing four Fe-(thiolate)S bonds, similar to the iron centres in ferredoxin Fe–S proteins, including Fe(III)–rubredoxin. Encapsulation of this complex within a triblock copolymer (P123) gave micelles of hydrodynamic diameter ca. 315 nm. Electron-beam irradiation of these micelles spread across the holes in lacey carbon TEM grids, rapidly generated Fe nanoclusters of 100 nm–1.1 μm diameter on sulfur-doped amorphous carbon surfaces. EELS and EDX data suggested that the iron oxide nanocrystals are similar to γ-Fe2O3. Superparamagnetic γ-Fe2O3 nanoparticles are reported to be efficient reusable catalysts for the glycolysis of polyethylene terephthalate (PET).23
The conversion of Fe(III)S4 centres into iron oxide mineral deposits observed here under reducing conditions is interesting in relation to the proposed involvement of such deposits in the etiology of Alzheimer's and other neurological conditions.2–6 Such reactions appear to involve a complicated mixture of iron, sulfur and oxygen redox chemistry, probably driven by the high thermodynamic stability of Fe–O(H) bonds and Fe–O–Fe bridges, and lattice energies in the nanocrystalline deposits. It seems likely that the initial formation of single Fe atoms leads to formation of O/OH-bridged Fe clusters, which then aggregate into nanocrystals. If studies such as those reported here at the single iron atom level could be extended to conditions of closer relevance to biological tissues, then new insight into the transformation of iron centres in proteins into iron oxide nanocrystals might be obtained. This knowledge might lead to a better understanding of how such iron deposits arise in AD and lead to new treatments.
Experimental
FTICR-MS analysis
Ultrahigh resolution mass spectrometry was performed on a 12 T solariX quadrupole/FTICR instrument (Bruker Daltonik GmbH, Bremen, Germany) equipped with an infinity cell. Resolving power in the m/z range of interest was ca. 400![[thin space (1/6-em)]](https://www.rsc.org/images/entities/char_2009.gif) 000, which was sufficient to partially resolve isotopic fine structure. Complex 1 was dissolved in MeOH, and ions were introduced using nano-ESI in negative ion mode. Data analysis was performed using Bruker Compass Data Analysis 4.1, and external calibration with Agilent Tuning Mix (Part # G1969-85000).
000, which was sufficient to partially resolve isotopic fine structure. Complex 1 was dissolved in MeOH, and ions were introduced using nano-ESI in negative ion mode. Data analysis was performed using Bruker Compass Data Analysis 4.1, and external calibration with Agilent Tuning Mix (Part # G1969-85000).
Mössbauer, Raman and IR spectroscopy
Raman spectra were recorded on a Senterra Raman Microscope with a laser wavelength of 785 nm, and IR spectra on a Vertex 70 spectrometer, using polyethylene pellets. 57Fe Mössbauer spectra were obtained in transmission geometry using a constant acceleration spectrometer operated in conjunction with a 512-channel analyzer in the time-scale mode (WissEl GmbH). The source contained 57Co diffused in Rh with an activity of 1.4 GBq. The spectrometer was calibrated against α-iron at ambient temperature. A continuous flow cryostat (OptistatDN, Oxford Instruments) was utilized for variable temperature measurements. For further analysis, spectral data were transferred from the multi-channel analyzer to a PC employing the public domain program Vinda running on an Excel 2003® platform.24 The spectra were analyzed by least-squares fits using Lorentzian line shapes. In addition to the Mössbauer parameters isomer shift δ and quadrupole splitting ΔEQ, the line width at half maximum Γ was determined.Dynamic light scattering (DLS)
The hydrodynamic diameter (Dh) of FeMs was obtained by DLS. An aqueous solution of FeMs (1 mg ml−1) was studied on a Malvern Zetasizer NanoS instrument with a 4 mW He–Ne 633 nm laser module at 298 K. Measurements were made at 173° detector angle. Data were analyzed by Malvern DTS 6.20 software. Dh was calculated by fitting the apparent diffusion coefficient in the equation Dh = kT/(3πηDapp), where k = the Boltzmann constant, T = temperature, and η = viscosity of the water.Conflicts of interest
There are no conflicts to declare.Acknowledgements
We thank the EPSRC (grants EP/P030572/1 and EP/F034210/1 for P. J. S., EP/N033191/1 for P. J. S. and P. B. O'C), The Royal Society for a Newton-Bhahba International Fellowship NF151429 for S. B., the Diamond Light Source for access and support in use of the electron Physical Science Imaging Centre (Instrument E01 proposal EM19373) that contributed to the results presented here, and Daniel Lester for assistance with Dynamic Light Scattering (DLS). V. S. acknowledges financial support from the research initiative NANOKAT and SPIN+X SFB/TRR 173.References
- D. J. R. Lane, S. Ayton and A. I. Bush, J. Alzheimer's Dis., 2018, 64, S379–S395 CAS.
- S. Sheykhansari, K. Kozielski, J. Bill, M. Sitti, D. Gemmati, P. Zamboni and A. V. Singh, Cell Death Dis., 2018, 9, 348, DOI:10.1038/s41419-018-0379-2.
- S. Ayton, S. A. James and A. I. Bush, Cell Chem. Biol., 2017, 24, 1192–1194 CrossRef CAS PubMed.
- S. Ayton, N. G. Faux and A. I. Bush, Nat. Commun., 2015, 6, 6760 CrossRef CAS PubMed.
- (a) J. F. Collingwood, R. K. K. Chong, T. Kasama, L. Cervera-Gontard, R. E. Dunin-Borkowski, G. Perry, M. Posfai, S. L. Siedlak, E. T. Simpson, M. A. Smith and J. Dobson, J. Alzheimer's Dis., 2008, 14, 235–245 CAS; (b) J. Everett, J. F. Collingwood, V. Tjendana-Tjhin, J. Brooks, F. Lermyte, G. Plascencia-Villa, I. Hands-Portman, J. Dobson, G. Perry and N. D. Telling, Nanoscale, 2018, 10, 11782–11796 RSC.
- J. Dobson, FEBS Lett., 2001, 496, 1–5 CrossRef CAS PubMed.
- N. P. E. Barry, A. Pitto-Barry, A. M. Sanchez, A. P. Dove, R. J. Procter, J. J. Soldevila-Barreda, N. Kirby, I. Hands-Portman, C. J. Smith, R. K. O'Reilly, R. Beanland and P. J. Sadler, Nat. Commun., 2014, 5, 3851 CrossRef CAS PubMed.
- A. Pitto-Barry, P. J. Sadler and N. P. E. Barry, Chem. Commun., 2016, 52, 3895–3898 RSC.
- N. P. E. Barry, A. Pitto-Barry, J. Tran, S. E. F. Spencer, A. M. Johansen, A. M. Sanchez, A. P. Dove, R. K. O'Reilly, R. J. Deeth, R. Beanland and P. J. Sadler, Chem. Mater., 2015, 27, 5100–5105 CrossRef CAS PubMed.
- J. Gurgel-Giannetti, D. S. Lynch, A. R. B. de Paiva, L. T. Lucato, G. Yamamoto, C. Thomsen, S. Basu, F. Freua, A. V. Giannetti, B. D. R. de Assis, M. D. O. Ribeiro, I. Barcelos, K. S. Souza, F. Monti, U. S. Melo, S. Amorim, L. G. L. Silva, L. I. Macedo-Souza, A. M. Vianna-Morgante, M. Hirano, M. S. V. der Knaap, R. Lill, M. Vainzof, A. Oldfors, H. Houlden and F. Kok, Brain, 2018, 141, 2289–2298 CrossRef PubMed.
- Y. Peng, D. N. Shinde, C. A. Valencia, J.-S. Mo, J. Rosenfeld, M. T. Cho, A. Chamberlin, Z. Li, J. Liu, B. Gui, R. Brockhage, A. Basinger, B. Alvarez-Leon, P. Heydemann, P. L. Magoulas, A. M. Lewis, F. Scaglia, S. Gril, S. C. Chong, M. Bower, K. G. Monaghan, R. Willaert, M.-R. Plona, R. Dineen, F. Milan, G. Hoganson, Z. Powis, K. L. Helbig, J. Keller-Ramey, B. Harris, L. C. Anderson, T. Green, S. J. S. Rizzo, J. Kaylor, J. Chen, M.-X. Guan, E. Sellars, S. P. Sparagana, J. B. Gibson, L. G. Reinholdt, S. Tang and T. Huang, Hum. Mol. Genet., 2017, 26, 4937–4950 CrossRef CAS PubMed.
- R. W. Lane, J. A. Ibers, R. B. Frankel and R. H. Holm, Proc. Natl. Acad. Sci. U. S. A., 1975, 72, 2868–2872 CrossRef CAS.
- S. Todorovic and M. Teixeira, J. Biol. Inorg. Chem., 2018, 23, 647–661 CrossRef CAS PubMed.
- Y. Guo, H. Wang, Y. Xiao, S. Vogt, R. K. Thauer, S. Shima, P. I. Volkers, T. B. Rauchfuss, V. Pelmentschikov, D. A. Case, E. E. Alp, W. Sturhahn, Y. Yoda and S. P. Cramer, Inorg. Chem., 2008, 47, 3969–3977 CrossRef CAS PubMed.
- X. Yang, Z. Li, N. Wang, L. Li, L. Song, T. He, L. Sun, Z. Wang, Q. Wu, N. Luo, C. Yi and C. Gong, Sci. Rep., 2015, 5, 10322 CrossRef CAS PubMed.
- A. Parmar, V. K. Aswal and P. Bahadur, Spectrochim. Acta, Part A, 2012, 97, 137–143 CrossRef CAS PubMed.
- É. Kiss, T. Keszthelyi, G. Kormány and O. Hakkel, Macromolecules, 2006, 39, 9375–9384 CrossRef.
- P. E. Batson, N. Dellby and O. L. Krivanek, Nature, 2002, 418, 617–620 CrossRef CAS PubMed.
- J. Cheon, N.-J. Kang, S.-M. Lee, J.-H. Lee, J.-H. Yoon and S. J. Oh, J. Am. Chem. Soc., 2004, 126, 1950–1951 CrossRef CAS PubMed.
- R. F. Egerton, P. Li and M. Malac, Micron, 2004, 35, 399–409 CrossRef CAS PubMed.
- S. T. Skowron, T. W. Chamberlain, J. Biskupek, U. Kaiser, E. Besley and A. N. Khlobystov, Acc. Chem. Res., 2017, 50, 1797–1807 CrossRef CAS PubMed.
- F. de la Peña, et al., hyperspy/hyperspy v1.4.1 (Version v1.4.1), Zenodo, 2018. DOI:10.5281/zenodo.1469364.
- L. Bartolome, M. Imran, K. G. Lee, A. Sangalang, J. K. Ahn and D. H. Kim, Green Chem., 2014, 16, 279–286 RSC.
- H. P. Gunnlaugsson, Hyperfine Interact., 2016, 237, 79 CrossRef.
Footnote |
| † Electronic supplementary information (ESI) available: Materials and methods, synthesis of complex 1, DFT calculations, microscopy experimental, supporting Tables (S1–S3) and Fig. (S1–S6). See DOI: 10.1039/c9dt00514e |
| This journal is © The Royal Society of Chemistry 2019 |


