 Open Access Article
Synthesis, characterization, surface properties and energy device characterstics of 2D borocarbonitrides, (BN)xC1−x, covalently cross-linked with sheets of other 2D materials
Navin Kumar Singh,
K. Pramoda,
K. Gopalakrishnan and
C. N. R. Rao *
*
New Chemistry Unit, Chemistry and Physics of Materials Unit, Sheikh Saqr Laboratory, International Centre for Materials Science, Jawaharlal Nehru Centre for Advanced Scientific Research (JNCASR), Jakkur P. O., Bangalore 560064, India. E-mail: cnrrao@jncasr.ac.in
First published on 11th May 2018
Abstract
Covalent cross-linking of 2D structures such as graphene, MoS2 and C3N4 using coupling reactions affords the generation of novel materials with new or improved properties. These covalently cross-linked structures provide the counter point to the van der Waals heterostructures, with an entirely different set of features and potential applications. In this article, we describe the materials obtained by bonding borocarbonitride (BCN) layers with BCN layers as well as with other layered structures such as MoS2 and C3N4. While cross-linking BCN layers with other 2D sheets, we have exploited the existence of different surface functional groups on the graphene (COOH) and BN(NH2) domains of the borocarbonitrides as quantitatively determined by FLOSS. Hence, we have thus obtained two different BCN–BCN assemblies differing in the location of the cross-linking and these are designated as GG/BCN–BCN and GBN/BCN–BCN, depending on which domains of the BCN are involved in cross-linking. In this study, we have determined the surface areas and CO2 and H2 adsorption properties of the cross-linked structures of two borocarbonitride compositions, (BN)0.75C0.25 and (BN)0.3C0.7. We have also studied their supercapacitor characteristics and photochemical catalytic activity for hydrogen generation. The study reveals that the covalently cross-linked BCN–BCN and BCN–MoS2 assemblies exhibit increased surface areas and superior supercapacitor performance. The BCN composite with MoS2 also shows high photochemical HER activity besides electrochemical HER activity comparable to Pt. This observation is significant since MoS2 in the nanocomposite is in the 2H form. The present study demonstrates the novelty of this new class of materials generated by cross-linking of 2D sheets of inorganic graphene analogues and their potential applications.
1. Introduction
Two-dimensional (2D) materials have emerged as an important area of research in the last few years.1–3 In particular, van der Waals heterostructures wherein a layer of one material is deposited on the layer of another material has specially attracted considerable attention.4–7 These heterostructures exhibit interesting phenomena and properties. As a corollary to this heterostructures, studies have been made recently on heterostructures wherein layers of two different materials are chemically bonded.8–10 Such covalent cross-linking has been proposed as a strategy to generate novel materials with new or improved properties.8 We were interested to examine the specific properties of covalently cross-linked layered structures with the purpose of finding out how such bonding modifies the properties of the layered materials. With this view we have studied covalently cross-linked layered materials based on borocarbonitrides, (BN)0.75C0.25 and (BN)0.3C0.7. An interesting feature of BCN is that they contain domains of both boron nitride (BN) and graphene besides some new features such as BCN rings.11 It should therefore be possible to link BN domains (or) graphene domains with the other layered structures. This is because BCN and other inorganic layered materials contain various surface functional groups. Thus, BCN would contain carboxyl and other related groups on the graphene domains and amine groups on the BN domains.3 In the first stance, two BCN sheets can be linked in two different ways, by linking graphene domains of one with the graphene domains of another sheet or graphene domains with BN domains. We were interested to find out surface and gas adsorption properties of such covalently cross-linked structures. In addition, we have examined the characteristics of supercapacitors formed by such cross-linked layers, since they depend strongly on the surface properties. Layers of carbonitride, C3N4, contain amino groups. Such functional groups are not present in the case of molybdenum disulfide (MoS2), but we can generate functional groups on MoS2 by chemical functionalization.12 In the presentation that follows, we have designated BCN assemblies obtained by cross-linking graphene domains of one sheet with the graphene domains of another as GG/BCN–BCN. Product of cross-linking of graphene and BN domains is designated as GBN/BCN–BCN. The present study highlights the beneficial effects of cross-linking sheets of different 2D materials to generate materials with new or improved properties. The nano assemblies obtained by the cross-linking strategy exhibit better supercapacitor characteristics as well as good HER activity.2. Results and discussion
2.1 Cross-linking BCN layers
BCN of two different compositions, (BN)0.75C0.25 and (BN)0.3C0.7, were synthesized by varying the ratio of urea, boric acid and activated charcoal and heating the resultant mixture at 900 °C in a N2 atmosphere. Thermogravimetric analysis (TGA) of the BCN samples was carried out in an oxygen atmosphere to determine the compositions (Fig. 1). The BN content of the samples can be determined from the residual weight remaining in the 500–700 °C temperature range. The residual weight for (BN)0.75C0.25 and (BN)0.3C0.7 are 75 and 30% respectively, which match with the stated compositions. Schematic representation of the surface functional groups of the borocarbonitrides is shown in Fig. 2. Since the borocarbonitrides comprise domains of both graphene and BN, they would contain surface functional groups common to both.13 The surface of the graphene domains assembly contains carboxyl and other oxygen functionalities while that of the BN domains would contain surface amino groups.13 Making use of the presence of different surface functionalities in the graphene and BN domains, we have cross-linked the borocarbonitride layers with specific bonding occurs between graphene and the graphene domains or with the BN domains.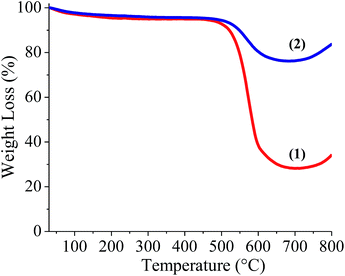 | ||
| Fig. 1 Thermogravimetric analysis of (1) Carbon rich BCN, (BN)0.3C0.7, (2) BN rich BCN, (BN)0.75C0.25. | ||
 | ||
| Fig. 2 Schematic representation of surface functional groups of borocarbonitride. (a) Carboxyl and hydroxyl groups on graphene domains, (b) amine groups on boron nitride domains. | ||
Scheme 1 shows the schematic of the synthetic strategy to prepare BCN assemblies by cross-linking the graphene and domains in different sheets (GG/BCN–BCN) and as well as by cross-linking graphene and BN domains (GBN/BCN–BCN). The GG/BCN–BCN assemblies were prepared by cross-linking carboxyl functional groups of the graphene domain with the hydroxyl groups of another graphene domain by employing esterification reaction (see Experimental section for details).15,16 On the other hand, GBN/BCN–BCN was synthesized by reacting carboxyl functional groups of the graphene domain with the amine groups of the BN domain by using EDC reagent.15
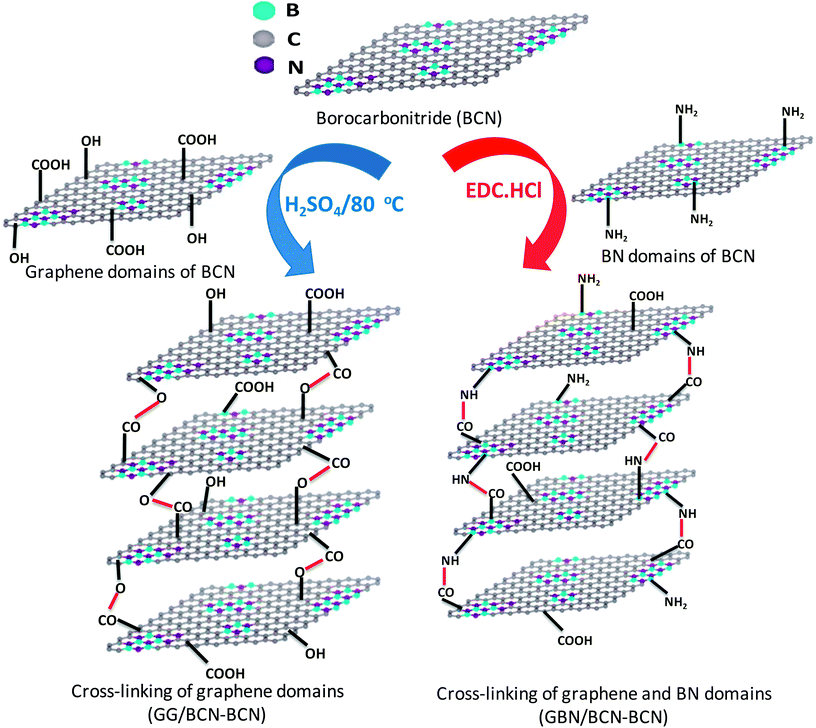 | ||
| Scheme 1 Synthetic strategy for BCN with cross-linking of graphene domains (GG/BCN–BCN) and graphene and BN domains (GBN/BCN–BCN) assemblies. | ||
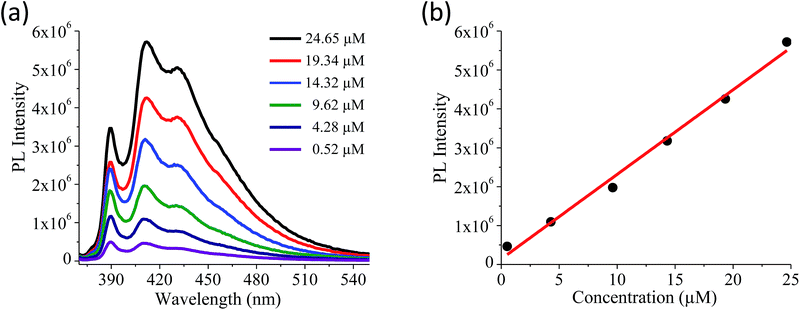
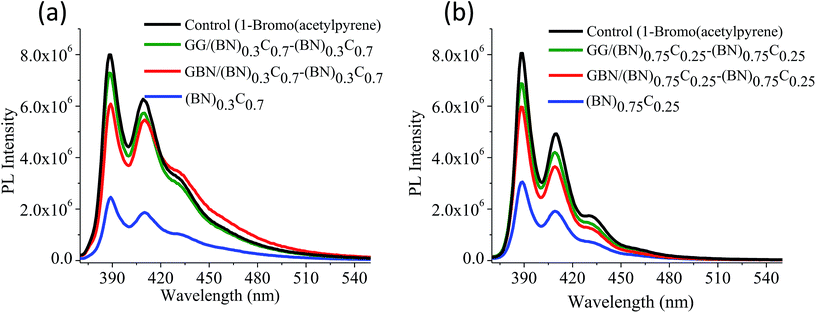
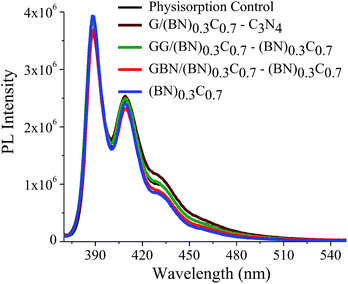
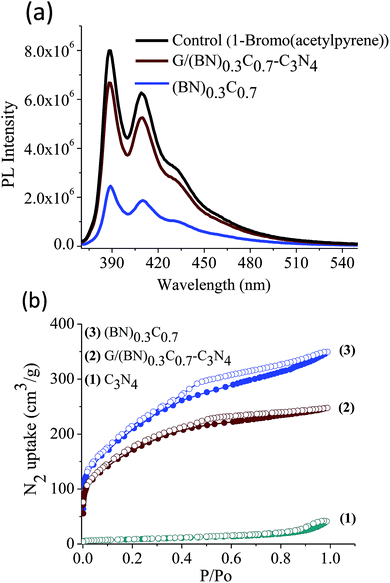
Quantitative estimation of the surface carboxyl functionalities of (BN)0.75C0.25 and (BN)0.3C0.7 was made by fluorescence labelling of surface species (FLOSS), employing 1-(bromoacetyl)pyrene dye as the probe.13,14 The number of carboxyl groups present on the BCN surface was estimated by the calibration graph shown in Fig. 3a and b. The (BN)0.75C0.25 and (BN)0.3C0.7 layers showed the surface concentrations of the carboxylic groups to be 2.89 × 10¹⁴ and 8.50 × 10¹⁵ groups per cm2 respectively. FLOSS measurements of GG/(BN)0.75C0.25–(BN)0.75C0.25 and GG/(BN)0.3C0.7–(BN)0.3C0.7 assemblies showed a reduced number of carboxylic groups compared to the parent BCN layers (Fig. 4a and b, Table 1) due to cross-linking of graphene with other graphene domains by the ester bond. Similarly, GBN/(BN)0.75C0.25–(BN)0.75C0.25 and GBN/(BN)0.3C0.7–(BN)0.3C0.7 assemblies show a reduced number of carboxylic groups compared to the starting (BN)0.3C0.7 due to cross-linking of graphene and BN domains by the amide bond (Fig. 4a and b, Table 1). In Table 1, we list the number of carboxylic groups obtained by FLOSS for all the cross-linked assemblies. In order to rule out the possibility of physisorption on the sheets of BCN and their nanocomposites, control experiments without reagent (K2CO3 and KI) were performed and appreciable quenching of fluorescence was not observed. This implies that the quenching in fluorescence is due to covalent cross-linking (Fig. 5).
| Compound | Surface area (m2 g−1) | Number of carboxylic groups per unit surface area (cm2) | CO2 uptake (wt%, 195 K, 1 atm) | CO2 uptake (wt%, 298 K, 1 atm) | H2 uptake (wt%, 77 K, 1 atm) |
|---|---|---|---|---|---|
| (BN)0.75C0.25 | 207 | 2.89 × 10¹⁴ | 14.5 | 4.1 | 0.33 |
| GG/(BN)0.75C0.25–(BN)0.75C0.25 | 434 | 5.16 × 10¹² | 30.4 | 7.6 | 0.45 |
| GBN/(BN)0.75C0.25–(BN)0.75C0.25 | 414 | 8.75 × 10¹³ | 24.3 | 5.8 | 0.38 |
| (BN)0.3C0.7 | 860 | 8.50 × 10¹⁵ | 56.0 | 7.6 | 1.36 |
| GG/(BN)0.3C0.7–(BN)0.3C0.7 | 1052 | 3.45 × 10¹² | 97.6 | 21.6 | 1.71 |
| GBN/(BN)0.3C0.7–(BN)0.3C0.7 | 980 | 2.38 × 10¹³ | 71.4 | 17.0 | 1.58 |
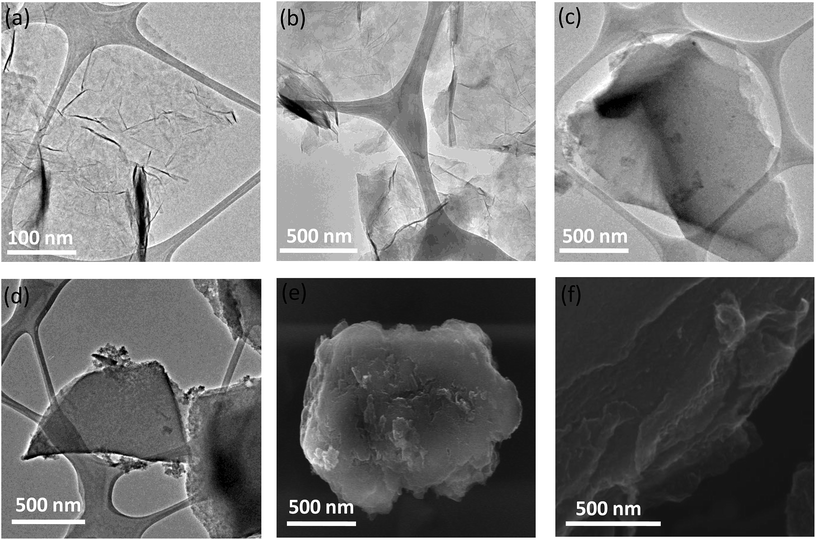
We have examined the cross-linked assemblies using electron microscopy. Scanning electron microscope (SEM) and transmission electron microscope (TEM) images of the GG/(BN)0.3C0.7–(BN)0.3C0.7 showed evidence for layer-by-layer assembly of sheet structure on cross-linking of the constituent (BN)0.3C0.7 layers (Fig. 6). Such layer-by-layer arrangement is facilitated by the formation of ester bond between the carboxylic groups of the graphene domains with the hydroxyl groups of the other graphene domain. In contrast, the starting BCN layers show only thin-layer features as evident in the TEM images (Fig. 6a and b). Similarly, GBN/(BN)0.3C0.7–(BN)0.3C0.7 also shows the formation 2–5 μm sized monoliths, revealing layer-by-layer stacking of (BN)0.3C0.7 sheets due to cross-linking of graphene and BN domains by the amide bond (Fig. 6f).
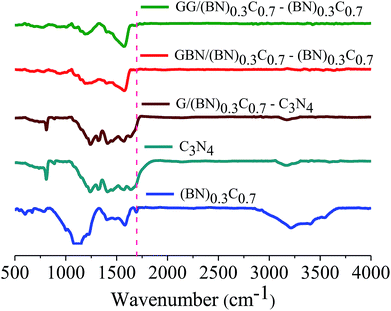
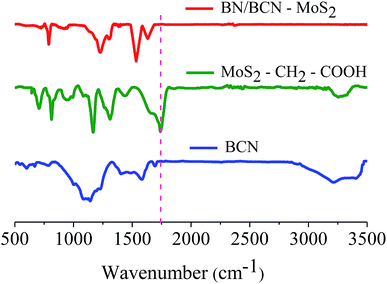
Formation of covalent cross-linked assemblies was investigated using Fourier-transform infrared spectroscopy (FTIR). The infrared spectrum of BCN exhibits a characteristic strong band at 1580 cm−1 and a weak band around 1715 cm−1 due to C![[double bond, length as m-dash]](https://www.rsc.org/images/entities/char_e001.gif) C and C
C and C![[double bond, length as m-dash]](https://www.rsc.org/images/entities/char_e001.gif) O respectively along with a broad band in the 3050–3600 cm−1 region corresponding to the residual amine and hydroxyl groups. The broad band around 1000–1200 cm−1 is due to C–O stretching and O–H bending vibrations. The GG/(BN)0.3C0.7–(BN)0.3C0.7 and GBN/(BN)0.3C0.7–(BN)0.3C0.7 nanocomposites show a carbonyl stretching band at ∼1630 cm−1, confirming cross-linking of the (BN)0.3C0.7 and (BN)0.3C0.7 layers by the amide bond (Fig. 7).
O respectively along with a broad band in the 3050–3600 cm−1 region corresponding to the residual amine and hydroxyl groups. The broad band around 1000–1200 cm−1 is due to C–O stretching and O–H bending vibrations. The GG/(BN)0.3C0.7–(BN)0.3C0.7 and GBN/(BN)0.3C0.7–(BN)0.3C0.7 nanocomposites show a carbonyl stretching band at ∼1630 cm−1, confirming cross-linking of the (BN)0.3C0.7 and (BN)0.3C0.7 layers by the amide bond (Fig. 7).
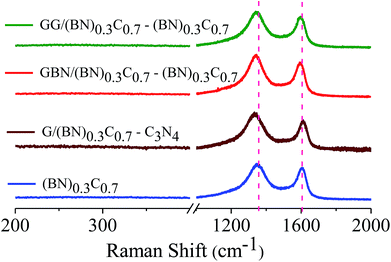
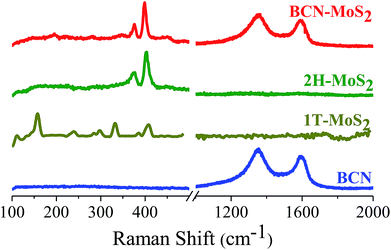
Formation of covalent cross-linked assemblies was also confirmed by using Raman spectroscopy. Raman spectra of (BN)0.3C0.7 show characteristic bands at 1350 and 1608 cm−1 respectively. The GG/(BN)0.3C0.7–(BN)0.3C0.7 and GBN/(BN)0.3C0.7–(BN)0.3C0.7 nanocomposites show shift in the spectrum in comparison to the (BN)0.3C0.7 as shown in the Fig. 8 which confirms the covalent cross-linking in the nanocomposites.
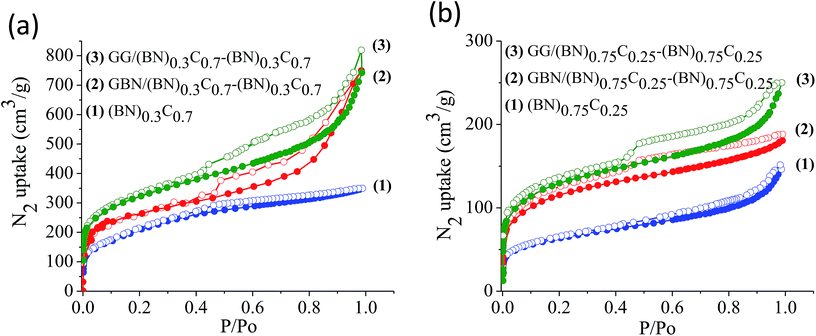
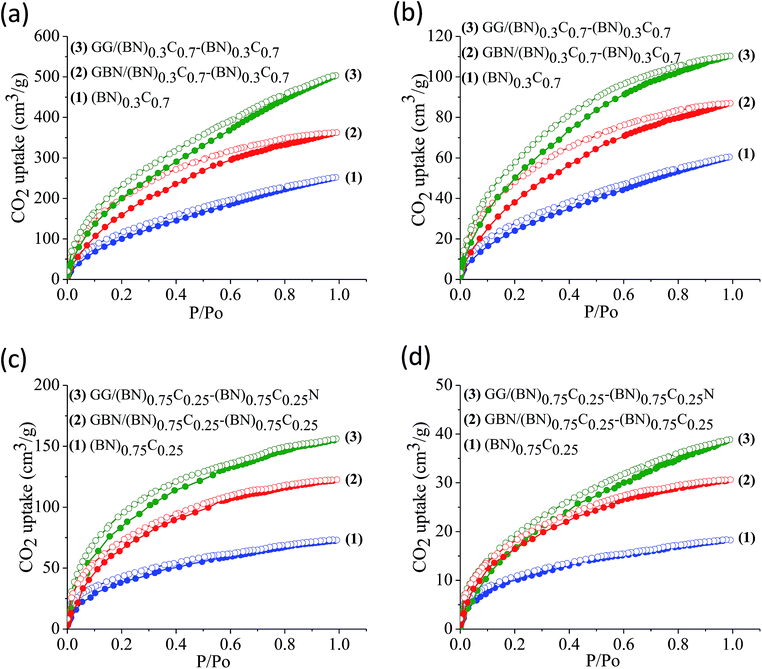
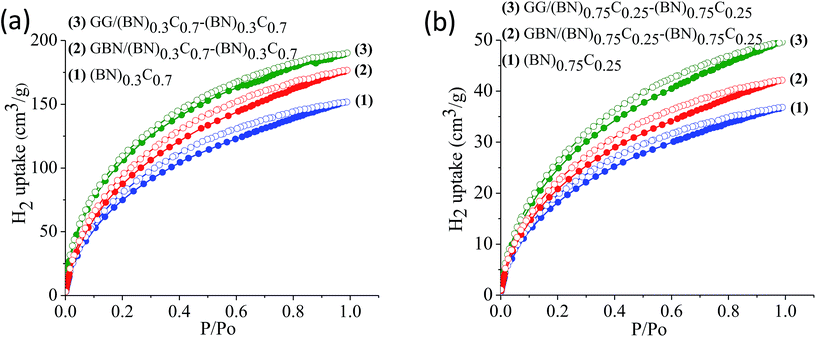
The surface areas of GG/BCN–BCN and GBN/BCN–BCN assemblies obtained from N2 adsorption–desorption isotherms at 77 K show type-I characteristics in the low pressure region along with a type-II hysteresis loop in the high pressure region, according to IUPAC nomenclature (Fig. 9).18 The steep uptake in the low-pressure region up to P/Po ∼ 0.1 arises due to adsorption in the micropores while the hysteresis in the high pressure region due to the slit-shaped pores created on cross-linking the BCN layers. The Brunauer–Emmett–Teller (BET) surface areas of GG/BCN–BCN and GBN/BCN–BCN assemblies with varying carbon content are given in Table 1. The carbon rich GG/(BN)0.3C0.7–(BN)0.3C0.7 and GBN/(BN)0.3C0.7–(BN)0.3C0.7 show large surface areas of 1052 and 980 m2 g−1 respectively while the starting (BN)0.3C0.7 layers shows only 860 m2 g−1. A similar behaviour in surface area enhancement observed in the case of the BN rich GG/(BN)0.75C0.25–(BN)0.75C0.25 and GBN/(BN)0.75C0.25–(BN)0.75C0.25 assemblies relative to the (BN)0.3C0.7 layers. The enhanced surface area of the covalently bonded assemblies is clearly due to the cross-linking of BCN sheets and the pores generated thereby. CO2 adsorption data of GG/BCN–BCN and GBN/BCN–BCN assemblies show typical type-I profiles (Fig. 10). The carbon rich GG/(BN)0.3C0.7–(BN)0.3C0.7 and GBN/(BN)0.3C0.7–(BN)0.3C0.7 show CO2 uptakes of 97.6 and 71.4 wt%, respectively at 195 K (1 atm) and 21.6 and 17.0 wt% at 298 K (1 atm) (Fig. 10a and b, Table 1). These values are comparable to those exhibited by porous graphene frameworks (PGFs)8,19 and to high surface area metal organic frameworks (MOFs).20–22 GBN/BCN–BCN assemblies were also examined for the CO2 uptake under ambient conditions (298 K and 1 atm), GG/(BN)0.75C0.25–(BN)0.75C0.25 and GBN/(BN)0.75C0.25–(BN)0.75C0.25 assemblies show nearly 7.6 and 5.8 wt%, respectively at 298 K (Fig. 10c and d, Table 1). We have studied the capacity of the BCN–BCN assemblies for H2 storage (Fig. 11a and b, Table 1). The GG/(BN)0.3C0.7–(BN)0.3C0.7 and GBN/(BN)0.3C0.7–(BN)0.3C0.7 absorb 1.71 and 1.58 wt% of H2, respectively, at 1 atm and 77 K, comparable to those for MOFs.23,24 The corresponding H2 uptake values for GG/(BN)0.75C0.25–(BN)0.75C0.25 and GBN/(BN)0.75C0.25–(BN)0.75C0.25 are 0.45 and 0.38 wt%, respectively.
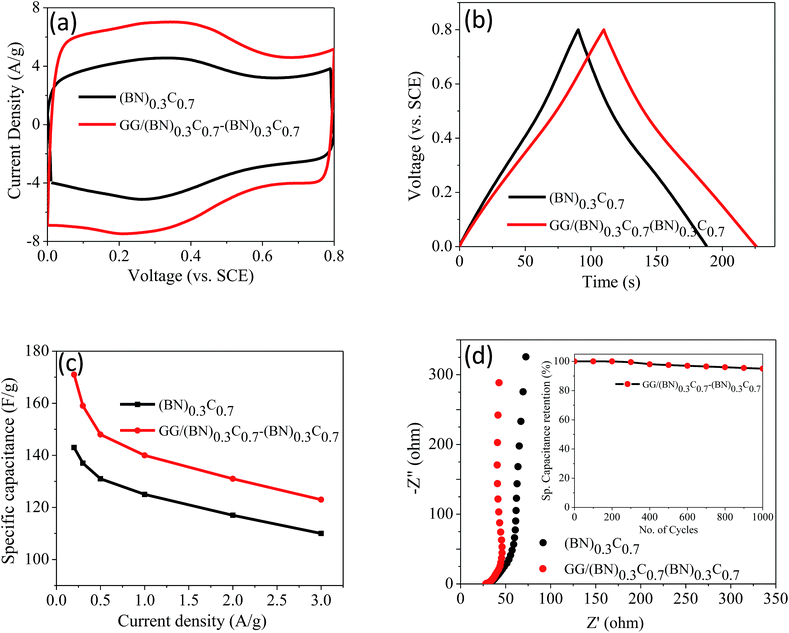
Supercapacitor performance of the covalently bonded BCN assemblies was investigated by means of cyclic voltammetry (CV), galvanostatic charge–discharge curves (GCD) and electrochemical impedance spectroscopy (EIS) using 1 M H2SO4 electrolyte. Fig. 12a and b show the CV and GCD curves of (BN)0.3C0.7 and GG/(BN)0.3C0.7–(BN)0.3C0.7 measured at 50 mV s−1. The calculated specific capacitance values of (BN)0.3C0.7 and GG/(BN)0.3C0.7–(BN)0.3C0.7 are 152 and 261 F g−1, respectively at 5 mV s−1 (Table 2). Specific capacitance (Csp) versus current density curve of (BN)0.3C0.7 and GG/(BN)0.3C0.7–(BN)0.3C0.7 is shown in Fig. 12c. The Csp values of GG/(BN)0.3C0.7–(BN)0.3C0.7 ranges from 123–171 F g−1 at different current densities. The enhancement in capacitance in case of assemblies compared to the starting BCN layers is attributed to the increased surface area due to generated pores on cross-linking the individual layers. EIS studies were also performed to investigate the electrochemical behavior of cross-linked structures (Fig. 12d). The equivalent series resistance values for (BN)0.3C0.7 and GG/(BN)0.3C0.7–(BN)0.3C0.7 are 26.34 and 28.27 Ω, respectively, suggesting lower charge-transfer resistance in case of cross-linked assemblies. The inset of Fig. 12d shows the cyclic stability curve of the GG/(BN)0.3C0.7–(BN)0.3C0.7 measured at 2 A g−1. The cross-linked assemblies retain almost 95% of the initial capacitance after 1000 cycles.
2.2 BCN–C3N4 assemblies
Scheme 2 shows the schematic of the synthetic strategy to prepare covalently bonded G/BCN–C3N4 nanocomposites by the carbodiimide reaction. Carboxylic functional groups on the graphene domains of BCN react with amine-functionalized C3N4 in the presence of 1-ethyl-3-(3-(dimethylamino)propyl)carbodiimide (EDC) to yield the G/BCN–C3N4 nanocomposites.16,17 IR and Raman evidence for cross-linking is shown in Fig. 7 and 8. FLOSS measurements of the G/BCN–C3N4 assemblies clearly show decreased number of carboxylic groups as compared to parent BCN as revealed by Fig. 13a. The number of surface carboxylic groups in BCN determined by FLOSS method is found to be 8.50 × 10¹⁵ groups per cm2. On cross-linking with C3N4, surface concentrations of BCN carboxylic groups reduced to 1.15 × 10¹⁰ groups per cm2, suggesting formation of the amide bond between BCN and C3N4 layers. Surface area of BCN–C3N4 composite was obtained by N2 adsorption measurements at 77 K. The covalently bonded assemblies show microporous type-1 adsorption behaviour at low pressures along with a type-H4 hysteresis loop in the high pressure region attributed to narrow slit-shaped pores (Fig. 13b). Brunauer–Emmett–Teller (BET) surface area of cross-linked BCN–C3N4 is 151 m2 g−1 while starting C3N4 layers show a low surface area of 29 m2 g−1 due to nonporous nature.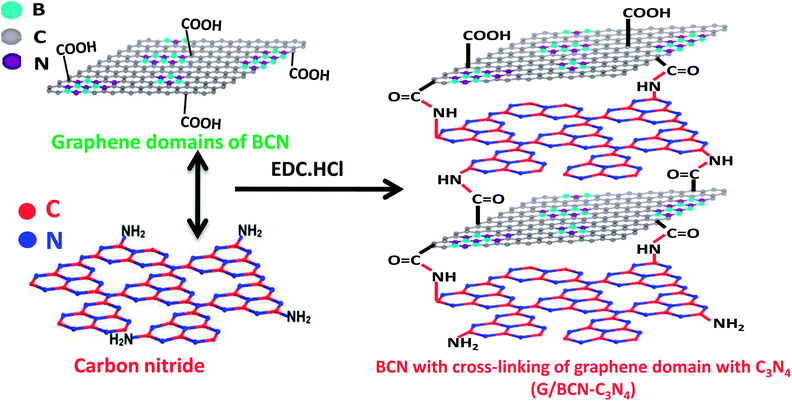 | ||
| Scheme 2 Synthetic strategy for graphene domain cross-linked BCN–C3N4 composites (G/BCN–C3N4) assemblies. | ||
2.3 BCN–MoS2 assemblies
In Scheme 3, we show the synthetic strategy to prepare covalently cross-linked G/BCN–MoS2 composites where the graphene domains of BCN are bonded to MoS2, and BN/BCN–MoS2 composites where the BN domains of BCN were bonded to MoS2.25 G/BCN–MoS2 nanocomposite was prepared by reacting carboxyl functional groups of BCN with amine functionalized MoS2 (MoS2–C6H4NH2), prepared by the reaction of 1T-MoS2 with 4-iodoaniline,26 in the presence of EDC coupling reagent. Similarly, amine functional groups of BCN was reacted with carboxylate-functionalized MoS2 (MoS2–CH2COOH), obtained by the reaction of metallic 1T-MoS2 with bromoacetic acid,12 in the presence of EDC to obtain the BN/BCN–MoS2 composites.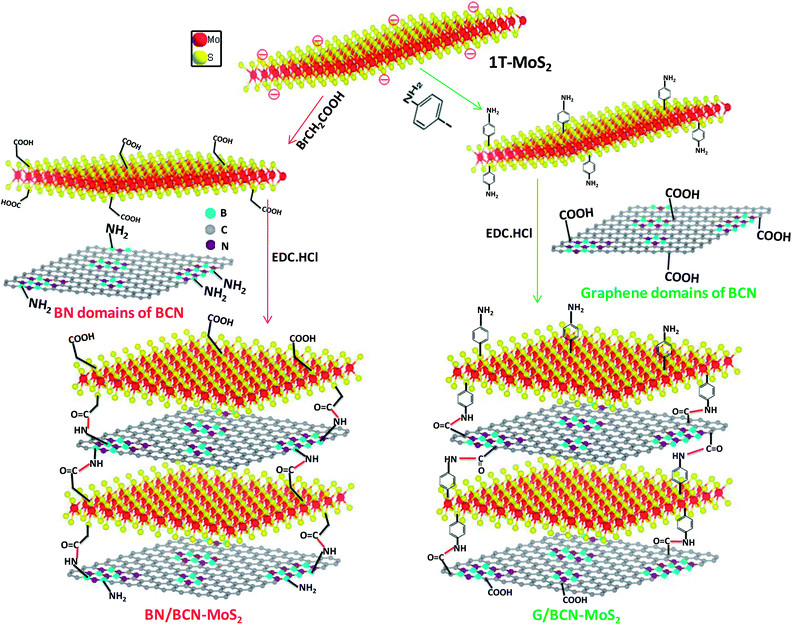 | ||
| Scheme 3 Synthetic strategy for covalently cross-linked BN/BCN–MoS2 and G/BCN–MoS2 nanocomposites (EDC = 1-ethyl-3-(3 dimethylaminopropyl)carbodiimide). | ||
In Fig. 14 we present the FESEM images of BN/BCN–MoS2 nanocomposite, illustrating the formation of the 3D assemblies by layer-by-layer cross-linking. The layer-by-layer assembly of BCN and MoS2 is facilitated by the formation of amide bond between the surface carboxyl groups of BCN with the amine groups of MoS2 sheets. Elemental mapping images of BN/BCN–MoS2 composites using the energy dispersive X-ray spectroscopy (EDS) show homogeneous distribution of B, C, N, Mo, and S substantiating the uniform nature of the cross-linked assemblies (Fig. 14).
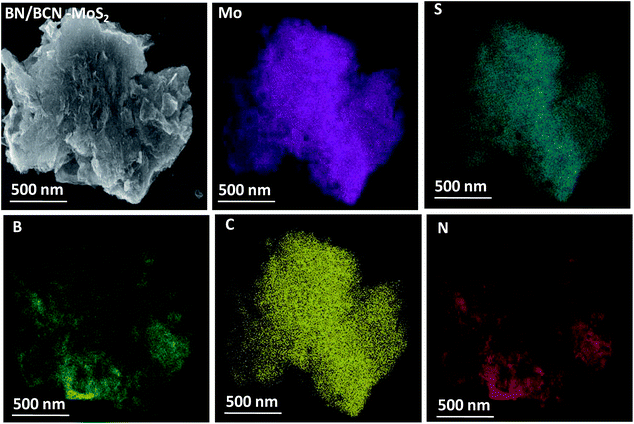 | ||
| Fig. 14 Elemental mapping images of BN/BCN–MoS2 nanocomposites (Mo, magenta; S, dark cyan; B, green; C, yellow; N, red) and FESEM image is given in top left corner. | ||
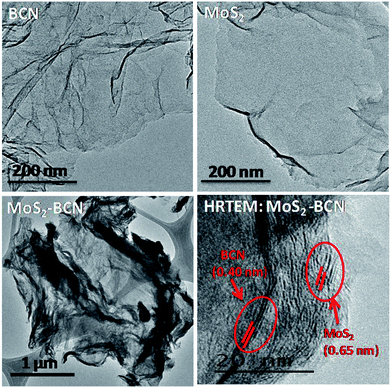
Transmission electron microscope (TEM) images of MoS2–BCN showed the presence of layer-by-layer assembly structure obtained due to cross-linking of the constituent layers. The HRTEM image of the MoS2–BCN shows interlayer spacings (002 peaks) correspond to both BCN (0.40 nm) and MoS2 (0.65 nm) layers, suggesting successful assembly between the heterolayers (Fig. 15).25
MoS2–CH2COOH exhibits bands at 1740 and 3273 cm−1 assigned to –C![[double bond, length as m-dash]](https://www.rsc.org/images/entities/char_e001.gif) O and –OH stretching modes of carboxylic groups along with a C–S stretching band at 709 cm−1 arising from covalent functionalization. The BN/BCN–MoS2 nanocomposite shows a carbonyl stretching band at ∼1640 cm−1, confirming cross-linking of the BCN and MoS2 layers by the amide bond (Fig. 16).
O and –OH stretching modes of carboxylic groups along with a C–S stretching band at 709 cm−1 arising from covalent functionalization. The BN/BCN–MoS2 nanocomposite shows a carbonyl stretching band at ∼1640 cm−1, confirming cross-linking of the BCN and MoS2 layers by the amide bond (Fig. 16).
Raman spectra of the BCN–MoS2 nanocomposites show characteristic D and G bands of BCN at 1351 and 1593 cm−1, respectively, along with the E12g and A1g bands due to the trigonal (2H) polytype MoS2 at 376.5 and 400 cm−1, respectively. Raman spectra clearly show MoS2 in the composite to be in 2H form (Fig. 17).
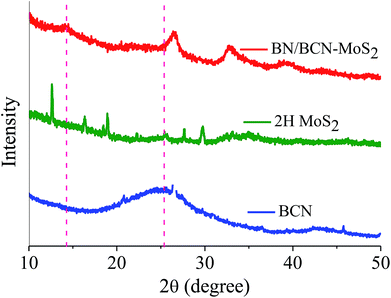
Formation of covalent cross-linked assemblies was also investigated using powder X-ray diffraction (PXRD) patterns of BCN–MoS2 assembly showed the appearance of a new reflection at 2θ = 14.26° (d = 0.60 nm) corresponding to the interlayer spacing between BCN and MoS2 (Fig. 18).
Surface area and porosity of BCN–MoS2 assemblies obtained from N2 adsorption isotherms at 77 K display microporous type-I features at low pressure along with a type-H4 hysteresis loop associated with narrow slit-shaped pores in the high pressure region (Fig. 19). The Brunauer–Emmett–Teller (BET) surface areas of BN/BCN–MoS2 and G/BCN–MoS2 (1![[thin space (1/6-em)]](https://www.rsc.org/images/entities/char_2009.gif) :
:![[thin space (1/6-em)]](https://www.rsc.org/images/entities/char_2009.gif) 2) assemblies are 540 and 512 m2 g−1, respectively while that of the physical mixture of same composition has a much lower surface area of 78 m2 g−1.
2) assemblies are 540 and 512 m2 g−1, respectively while that of the physical mixture of same composition has a much lower surface area of 78 m2 g−1.
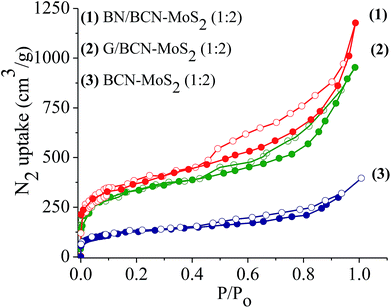 | ||
Fig. 19 Nitrogen sorption profiles of (1) BN/BCN–MoS2 (1![[thin space (1/6-em)]](https://www.rsc.org/images/entities/char_2009.gif) : :![[thin space (1/6-em)]](https://www.rsc.org/images/entities/char_2009.gif) 2), (2) G/BCN–MoS2 (1 2), (2) G/BCN–MoS2 (1![[thin space (1/6-em)]](https://www.rsc.org/images/entities/char_2009.gif) : :![[thin space (1/6-em)]](https://www.rsc.org/images/entities/char_2009.gif) 2) and (3) BCN–MoS2 (1 2) and (3) BCN–MoS2 (1![[thin space (1/6-em)]](https://www.rsc.org/images/entities/char_2009.gif) : :![[thin space (1/6-em)]](https://www.rsc.org/images/entities/char_2009.gif) 2) mixture. 2) mixture. | ||
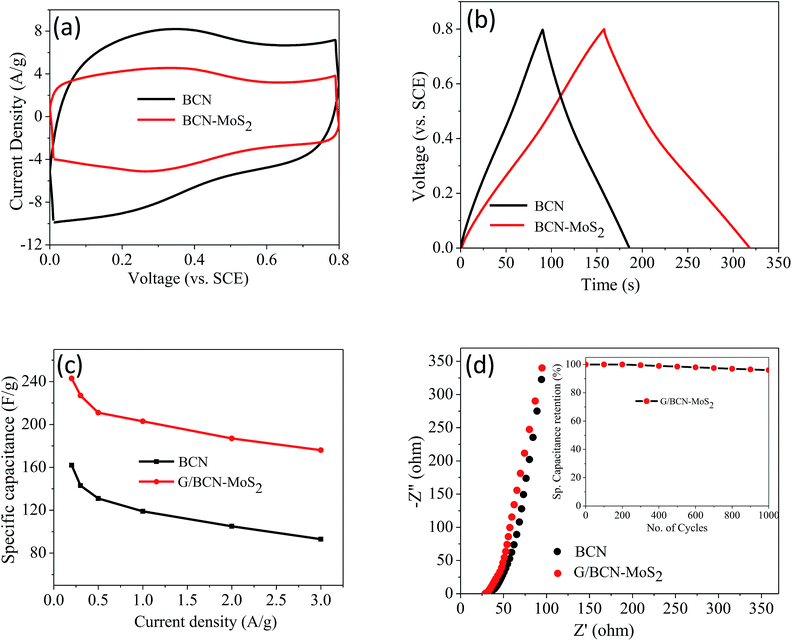
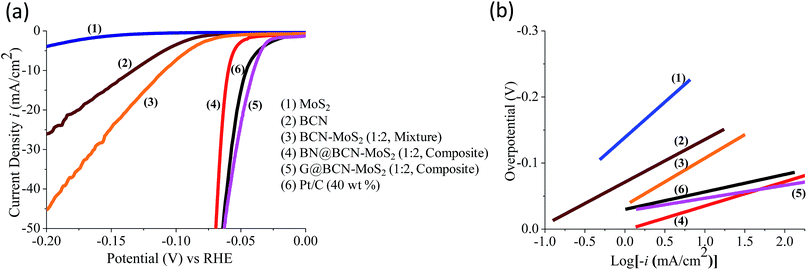
The supercapacitor performance of the G/BCN–MoS2 composite was investigated. The CV curves of BCN and the G/BCN–MoS2 composite measured at 50 mV s−1 is shown in Fig. 20a. The Csp value of G/BCN–MoS2 composite is 243 F g−1 whereas that for BCN is 162 F g−1 at 5 mV s−1. Fig. 20b shows the GCD curves of G/BCN–MoS2 composite measured at 1 A g−1. The GCD curves of BCN and the composite are almost symmetrical resembling an ideal capacitor with an increase in discharge time in case of composite. Fig. 20c shows the Csp versus current density curves of composite where the capacitance decreases with the increase in current density. The Csp values of BCN–MoS2 composite ranges from 176–243 F g−1 at different current densities. EIS studies were also performed to further investigate the electrochemical behaviour of cross-linked structures (Fig. 20d). The equivalent series resistance values for BCN and BCN–MoS2 are 27.34 and 31.43 Ω, respectively, suggesting lower charge-transfer resistance in case of cross-linked assemblies. Inset of Fig. 20d shows the cyclic stability of the composite measured at a current density of 2 A g−1 for 1000 cycles. The capacitance remains almost same for the first 300 cycles, and decreases by about 4.0% of the initial capacitance after 1000 cycles, demonstrating good cycling stability of the composites material. These results illustrate that the BCN–MoS2 composite have excellent supercapacitor properties and the enhancement in capacitance can be attributed to the increase in surface area as well the redox property of the MoS2. Electrocatalytic H2 evolution activity of covalently bonded BCN–MoS2 assemblies was investigated in N2 saturated 0.5 M H2SO4 solution using a conventional three-electrode cell. Polarization curves of G/BCN–MoS2 and BN/BCN–MoS2 assemblies along with that of physical mixture of BCN and MoS2 are shown in Fig. 21a. The relatively lower onset potential (η), the measure of extra energy needed to attain a faradic process of H2 generation, value is obtained for the cross-linked nanocomposites compared to the physical mixture, implying better catalytic nature of the former. Initial BCN and MoS2 display η values of −0.08 and −0.18 V, respectively. Cross-linked BN/BCN–MoS2 (1![[thin space (1/6-em)]](https://www.rsc.org/images/entities/char_2009.gif) :
:![[thin space (1/6-em)]](https://www.rsc.org/images/entities/char_2009.gif) 2) and G/BCN–MoS2 (1
2) and G/BCN–MoS2 (1![[thin space (1/6-em)]](https://www.rsc.org/images/entities/char_2009.gif) :
:![[thin space (1/6-em)]](https://www.rsc.org/images/entities/char_2009.gif) 2) catalysts show 30 and 45 mV shifts in the onset potential (−0.05 and −0.035 V) in the positive direction compared to BCN only (−0.08 V), whereas the physical mixture of BCN and MoS2 shows only 17 mV improvement in η (−0.063 V). The enhanced HER activity in cross-linked composites can be understood in terms of increased surface area and more exposed active sites due to cross-linking. To gain further insight into the kinetics of HER on the BCN–MoS2 assemblies, Tafel slopes were investigated (Fig. 21b, Table 3). The Tafel slope values obtained from the Butler–Volmer equation3 for BCN, BN/BCN–MoS2 (2
2) catalysts show 30 and 45 mV shifts in the onset potential (−0.05 and −0.035 V) in the positive direction compared to BCN only (−0.08 V), whereas the physical mixture of BCN and MoS2 shows only 17 mV improvement in η (−0.063 V). The enhanced HER activity in cross-linked composites can be understood in terms of increased surface area and more exposed active sites due to cross-linking. To gain further insight into the kinetics of HER on the BCN–MoS2 assemblies, Tafel slopes were investigated (Fig. 21b, Table 3). The Tafel slope values obtained from the Butler–Volmer equation3 for BCN, BN/BCN–MoS2 (2![[thin space (1/6-em)]](https://www.rsc.org/images/entities/char_2009.gif) :
:![[thin space (1/6-em)]](https://www.rsc.org/images/entities/char_2009.gif) 1), (1
1), (1![[thin space (1/6-em)]](https://www.rsc.org/images/entities/char_2009.gif) :
:![[thin space (1/6-em)]](https://www.rsc.org/images/entities/char_2009.gif) 1), (1
1), (1![[thin space (1/6-em)]](https://www.rsc.org/images/entities/char_2009.gif) :
:![[thin space (1/6-em)]](https://www.rsc.org/images/entities/char_2009.gif) 2), G/BCN–MoS2 (1
2), G/BCN–MoS2 (1![[thin space (1/6-em)]](https://www.rsc.org/images/entities/char_2009.gif) :
:![[thin space (1/6-em)]](https://www.rsc.org/images/entities/char_2009.gif) 2) and Pt/C are 62, 58, 46, 36, 33 and 29 mV dec−1, respectively. Table 3 gives summary of the onset potential, overpotential of 10 mA cm−2 (η10) and Tafel slopes of all catalysts. Cross-linked BN/BCN–MoS2 and G/BCN–MoS2 (1
2) and Pt/C are 62, 58, 46, 36, 33 and 29 mV dec−1, respectively. Table 3 gives summary of the onset potential, overpotential of 10 mA cm−2 (η10) and Tafel slopes of all catalysts. Cross-linked BN/BCN–MoS2 and G/BCN–MoS2 (1![[thin space (1/6-em)]](https://www.rsc.org/images/entities/char_2009.gif) :
:![[thin space (1/6-em)]](https://www.rsc.org/images/entities/char_2009.gif) 2) catalysts show the Tafel slope value of 36 and 33 mV dec−1,respectively close to that of Pt/C (29 mV dec−1), suggesting the efficacy of covalently cross-linked sheets in fast electron transport to the active sites, exhibiting Volmer–Tafel mechanism.
2) catalysts show the Tafel slope value of 36 and 33 mV dec−1,respectively close to that of Pt/C (29 mV dec−1), suggesting the efficacy of covalently cross-linked sheets in fast electron transport to the active sites, exhibiting Volmer–Tafel mechanism.
| Sample | Onset (mV) vs. RHE | η@10 mA cm−2 (mV) vs. RHE | Tafel slope (mV dec−1) |
|---|---|---|---|
| MoS2 | −180 ± 9 | −260 ± 13 | 106 |
BCN–MoS2 (1![[thin space (1/6-em)]](https://www.rsc.org/images/entities/char_2009.gif) : :![[thin space (1/6-em)]](https://www.rsc.org/images/entities/char_2009.gif) 2, mixture) 2, mixture) |
−60 ± 3 | −110 ± 5 | 71 |
BN/BCN–MoS2 (1![[thin space (1/6-em)]](https://www.rsc.org/images/entities/char_2009.gif) : :![[thin space (1/6-em)]](https://www.rsc.org/images/entities/char_2009.gif) 2, composite) 2, composite) |
−50 ± 3 | −60 ± 3 | 36 |
G/BCN–MoS2 (1![[thin space (1/6-em)]](https://www.rsc.org/images/entities/char_2009.gif) : :![[thin space (1/6-em)]](https://www.rsc.org/images/entities/char_2009.gif) 2, composite) 2, composite) |
−30 ± 2 | −35 ± 2 | 33 |
| Pt/C (40 wt%) | −20 ± 1 | −40 ± 2 | 29 |
Photochemical HER activity of G/BCN–MoS2 and BN/BCN–MoS2 nanocomposites was investigated in aqueous solution of triethanolamine (TEOA, 20% (v/v)) as sacrificial agent under UV-vis light illumination.27 In Fig. 22, we show the yield of H2 evolved by using G/BCN–MoS2 and BN/BCN–MoS2 (1![[thin space (1/6-em)]](https://www.rsc.org/images/entities/char_2009.gif) :
:![[thin space (1/6-em)]](https://www.rsc.org/images/entities/char_2009.gif) 2) assemblies and their respective physical mixture as well as by using BCN and MoS2 layers alone. Few-layer MoS2 has an activity of 1663 μmol h−1 g−1 whereas BCN layers shows low activity of 136 μmol h−1 g−1 which implies MoS2 would be the favoured site for H2 evolution in cross-linked composite. In the case of cross-linked BN/BCN–MoS2 (1
2) assemblies and their respective physical mixture as well as by using BCN and MoS2 layers alone. Few-layer MoS2 has an activity of 1663 μmol h−1 g−1 whereas BCN layers shows low activity of 136 μmol h−1 g−1 which implies MoS2 would be the favoured site for H2 evolution in cross-linked composite. In the case of cross-linked BN/BCN–MoS2 (1![[thin space (1/6-em)]](https://www.rsc.org/images/entities/char_2009.gif) :
:![[thin space (1/6-em)]](https://www.rsc.org/images/entities/char_2009.gif) 2) and G/BCN–MoS2 (1
2) and G/BCN–MoS2 (1![[thin space (1/6-em)]](https://www.rsc.org/images/entities/char_2009.gif) :
:![[thin space (1/6-em)]](https://www.rsc.org/images/entities/char_2009.gif) 2) composites, enhancement in catalytic activity with respect to few-layer MoS2 is ∼5 times, whereas the physical mixture of BCN and MoS2 show an increase by only ∼2 times. The BN/BCN–MoS2 (1
2) composites, enhancement in catalytic activity with respect to few-layer MoS2 is ∼5 times, whereas the physical mixture of BCN and MoS2 show an increase by only ∼2 times. The BN/BCN–MoS2 (1![[thin space (1/6-em)]](https://www.rsc.org/images/entities/char_2009.gif) :
:![[thin space (1/6-em)]](https://www.rsc.org/images/entities/char_2009.gif) 2) assembly shows the highest activity of 6965 μmol h−1 g−1 among cross-linked composites. This result suggests that the cross-linking strategy enhances the catalytic activity due to greater interaction between the constituent layers as compared to physical mixture where sheets are randomly oriented.
2) assembly shows the highest activity of 6965 μmol h−1 g−1 among cross-linked composites. This result suggests that the cross-linking strategy enhances the catalytic activity due to greater interaction between the constituent layers as compared to physical mixture where sheets are randomly oriented.
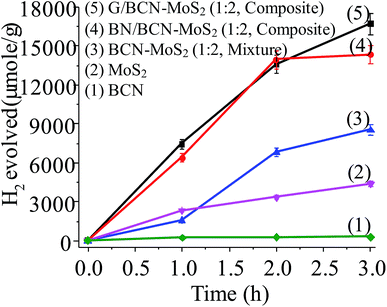 | ||
Fig. 22 Comparison of the photochemical HER activity of (1) BCN, (2) MoS2, (3) BCN–MoS2 (1![[thin space (1/6-em)]](https://www.rsc.org/images/entities/char_2009.gif) : :![[thin space (1/6-em)]](https://www.rsc.org/images/entities/char_2009.gif) 2, mixture), (4) BN/BCN–MoS2 (1 2, mixture), (4) BN/BCN–MoS2 (1![[thin space (1/6-em)]](https://www.rsc.org/images/entities/char_2009.gif) : :![[thin space (1/6-em)]](https://www.rsc.org/images/entities/char_2009.gif) 2) and (5) G/BCN–MoS2. 2) and (5) G/BCN–MoS2. | ||
We have prepared two borocarbonitride compositions, (BN)0.75C0.25 and (BN)0.3C0.7 by the reaction of boric acid, urea and activated charcoal. From X-ray photoelectron spectroscopy (XPS), composition in the BCN samples is calculated. The exact composition of (BN)0.75C0.25 and (BN)0.3C0.7 obtained by XPS are BC3N and BC7N, respectively. EDAX and CHN elemental analysis results are in agreement with the compositions obtained from XPS (Fig. 23 and 24).
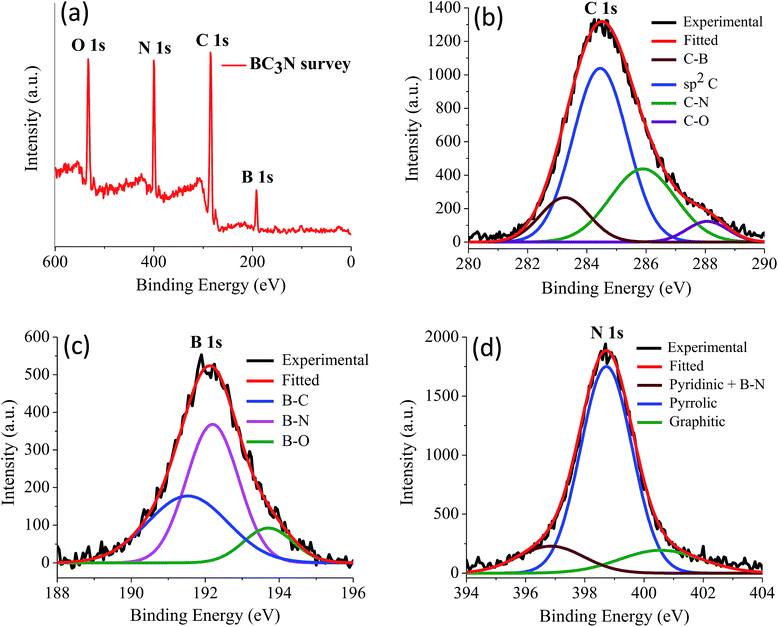 | ||
| Fig. 23 (a) X-ray photoelectron spectrum of BC3N, (b) to (d) showing the core level spectrum of C, B and N respectively. | ||
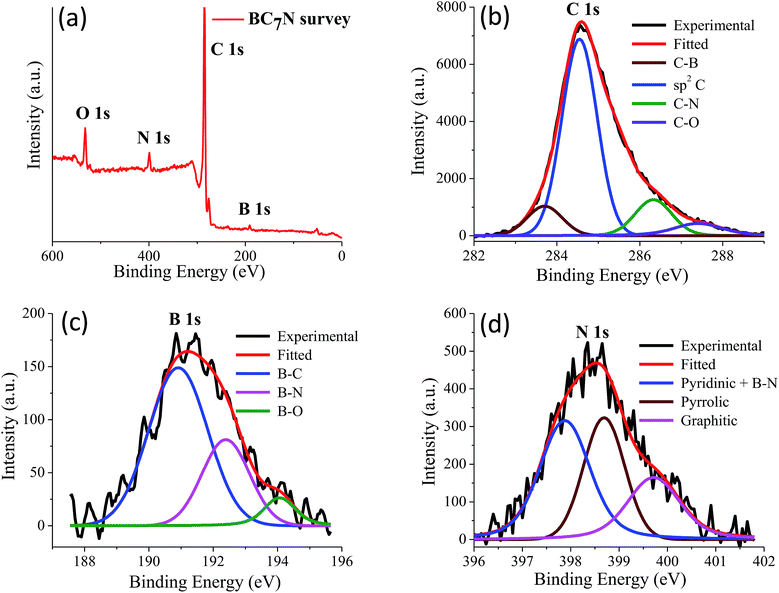 | ||
| Fig. 24 (a) X-ray photoelectron spectrum of BC7N, (b) to (d) showing the core level spectrum of C, B and N respectively. | ||
3. Experimental
Borocarbonitrides, (BN)xC1−x, were synthesized by the urea method reported earlier.3 Boric acid, urea and activated charcoal were mixed in different proportions and heated in a tubular furnace at 900 °C for 10 h under N2 atmosphere. The obtained product was treated with NH3 at 900 °C for 4 h. Two different compositions (BN)0.75C0.25 and (BN)0.3C0.7 were obtained by varying the ratio of boric acid and activated charcoal used as precursors.Chemical tagging of the carboxyl groups on the surfaces of BCN and cross-linked BCN assemblies was carried out by using 1-(bromoacetyl)pyrene following the procedure. To a 2 mg sample, 2 mL of 1.35 mM solution of 1-(bromoacetyl)pyrene in DMF, K2CO3 (540 μL of 7.24 mM) and KI (450 μL of 6.02 mM) were added and stirred in dark at 50 °C for 12 h.13,14 After the reaction, the resulting solution was centrifuged and the supernatant was transferred to a flask for photoluminescence studies.
To synthesize GG/BCN–BCN, (BN)xC1−x (40 mg) was dispersed in de-ionized water by ultrasonication. To this 500 μL conc. H2SO4 was added drop wise and stirred at 80 °C for 24 h. The obtained product was washed repeatedly with water, ethanol and dried at 60 °C under vaccum.15,16
To prepare GBN/BCN–BCN, (BN)xC1−x (40 mg) was dispersed in dry DMF (3 mL) in a Schlenck flask through ultrasonication. To the above dispersion N-(3-(dimethylamino)propyl)-N′-ethylcarbodiimide hydrochloride (EDC·HCl, 20 mg) and 1-hydroxybenzotriazole (HOBt, 20 mg) were added along with the N,N-diisopropylethylamine (DIPEA, 300 μL) under N2 atmosphere and stirred at room temperature for 48 h.17 The solid product was collected by centrifugation and washed with copious amount of DMF, water, ethanol respectively and dried at 60 °C.
To prepare BCN–C3N4composites, BCN (20 mg) and C3N4 (20 mg) were mixed and dispersed in a solution of DMF (3 mL) under ultrasonication for 2 h to obtain homogeneous dispersion. The above mentioned EDC coupling procedure for GG/BCN–BCN was repeated.
3.1 Characterization
FTIR spectra were recorded using attenuated-total-reflectance accessories in a Bruker FT-IR spectrometer. Morphological studies of cross-linked assemblies were recorded using Nova Nano SEM 600, FEI Company. XRD patterns were recorded with a Bruker Diffractometer with Cu Kα radiation (D8 Advance X-ray diffractometer, Cu Kα, λ = 1.5406 Å, 40 kV, and 30 mA). Raman spectra were recorded with a Jobin Yvon LabRam HR spectrometer with 632 nm Ar laser. Transmission Electron Microscope (TEM) images were recorded using the FEI Tecnai with an accelerating voltage of 200 kV. Thermogravimetric analysis (TGA) of BCN samples was recorded using Mettler Toledo TGA 850 instrument in an oxygen atmosphere with a heating rate of 3 °C min−1. XPS was recorded with an Omicron spectrometer using Al Kα as the X-ray source (1486.6 eV), and elemental composition of the samples were recorded with Perkin-Elmer 2400 CHN analyzer.3.2 Gas adsorption measurements
The adsorption isotherm N2 (77 K), CO2 (195 K and 298 K) and H2 (77 K) were obtained using QUANTACHROME QUADRASORB-SI analyzer. The samples were heated at 80 °C under vacuum for about 24 h. The adsorbate was charged into the sample tube and change in pressure was monitored. The degree of adsorption was determined by monitoring the decrease in pressure at the equilibrium state. All the operations were computer controlled and automatic.3.3 Supercapacitor characteristics
Supercapacitor measurements were performed on a CHI 760E electrochemical workstation using three-electrode assembly in aqueous 1 M H2SO4 electrolyte solution. Glassy carbon electrode (GCE) coated with cross-linked samples used as the working electrode with a large-area Pt foil and saturated calomel electrode as counter and reference electrodes, respectively. The working electrode was prepared by drop casting 10 μL sample (5 mg sample in 1 mL ethanol–water mixture) on GCE along with the Nafion solution (10 μL of 0.05 wt%).Cyclic voltammetry (CV) measurements were carried out at different scan rates from 5 to 100 mV s−1. Electrochemical impedance spectroscopy (EIS) measurements were done by applying an AC voltage with 10 mV amplitude in the frequency range from 0.1 Hz to 100 kHz. A galvanostatic charge–discharge (GCD) test was also conducted at different current densities.
The specific capacitance (Csp) was calculated using the following formula from CV,
| Csp = (i+ − i−)/(m × scan rate) |
While from GCD curve, Csp is calculated from the formula,
| Csp = i(dt/dv)/(m) |
3.4 Electrochemical HER measurements
The electrochemical HER studies were performed with a typical three-electrode cell containing working electrode, reference electrode (Ag/AgCl) and counter electrode (Pt coil) using a 0.5 M H2SO4 electrolyte. Working electrode was obtained by drop-casting the catalyst-ink, dispersing the catalyst in water–isopropanol (4![[thin space (1/6-em)]](https://www.rsc.org/images/entities/char_2009.gif) :
:![[thin space (1/6-em)]](https://www.rsc.org/images/entities/char_2009.gif) 1) mixture along with Nafion solution (5 wt%); 4
1) mixture along with Nafion solution (5 wt%); 4![[thin space (1/6-em)]](https://www.rsc.org/images/entities/char_2009.gif) :
:![[thin space (1/6-em)]](https://www.rsc.org/images/entities/char_2009.gif) 1:0.5 (v/v) gives catalyst-ink, on a polished glassy carbon surface (GCE).
1:0.5 (v/v) gives catalyst-ink, on a polished glassy carbon surface (GCE).
3.5 Photochemical HER measurements
For photochemical HER studies, catalyst (3 mg) was dispersed in aqueous triethanolamine (15% v/v, 48 mL) solution in a glass vessel by sonication and Eosin Y (14 μmol) dye was added. The resultant dispersion was illuminated with halogen lamp (100 W) under steady stirring. Evolved H2 (2 mL) gas was manually collected from the headspace and analyzed using a gas chromatograph (PerkinElmer ARNL 580C) equipped with thermal conductivity detector.4. Conclusions
In conclusion, we have been able to prepare two differently cross-linked BCN assemblies with the distinctive bonding between graphene and graphene domains and with BN domains. The cross-linked assemblies show higher surface areas compared to starting BCN with the carbon rich GG/(BN)0.3C0.7–(BN)0.3C0.7 showing a CO2 uptake of 97.6 wt% at 195 K and 1 atm. In addition, we were also been able to prepare nanocomposites of BCN with C3N4 and MoS2 layers. The GG/(BN)0.3C0.7–(BN)0.3C0.7 and G/BCN–MoS2 display microporosity and satisfactory performance with high stability as supercapacitor electrode materials. It is noteworthy that the graphene domain cross-linked G/BCN–MoS2 (1![[thin space (1/6-em)]](https://www.rsc.org/images/entities/char_2009.gif) :
:![[thin space (1/6-em)]](https://www.rsc.org/images/entities/char_2009.gif) 2) assembly shows outstanding electrochemical HER activity with an onset potential of −30 mV (vs. RHE) and a Tafel slope of 33 mV dec−1 close to that of Pt (29 mV dec−1). Photochemical HER activity of the BN domain cross-linked BN/BCN–MoS2 (1
2) assembly shows outstanding electrochemical HER activity with an onset potential of −30 mV (vs. RHE) and a Tafel slope of 33 mV dec−1 close to that of Pt (29 mV dec−1). Photochemical HER activity of the BN domain cross-linked BN/BCN–MoS2 (1![[thin space (1/6-em)]](https://www.rsc.org/images/entities/char_2009.gif) :
:![[thin space (1/6-em)]](https://www.rsc.org/images/entities/char_2009.gif) 2) assemblies is superior with an activity of 6965 μmol h−1 g−1. It is noteworthy that MoS2 in 2H form becomes catalytically active due to linking with BCN. Covalent cross-linking emerges to be a useful strategy to generate novel assemblies with useful properties and applications.
2) assemblies is superior with an activity of 6965 μmol h−1 g−1. It is noteworthy that MoS2 in 2H form becomes catalytically active due to linking with BCN. Covalent cross-linking emerges to be a useful strategy to generate novel assemblies with useful properties and applications.
Conflicts of interest
There are no conflicts to declare.Acknowledgements
We acknowledge U. Gupta and M. Chhetri for the HER results mention in the text. We also acknowledge M. Barua and S. Laha, for help with gas adsorption studies.References
- K. S. Novoselov, V. I. Fal'ko, L. Colombo, P. R. Gellert, M. G. Schwab and K. Kim, Nature, 2012, 490, 192 CrossRef CAS PubMed.
- Q. H. Wang, K. Kalantar-Zadeh, A. Kis, J. N. Coleman and M. S. Strano, Nat. Nanotechnol., 2012, 7, 699 CrossRef CAS PubMed.
- M. Chhetri, S. Maitra, H. Chakraborty, U. V. Waghmare and C. N. R. Rao, Energy Environ. Sci., 2016, 9, 95 CAS.
- S. Bertolazzi, D. Krasnozhon and A. Kis, ACS Nano, 2013, 7, 3246 CrossRef CAS PubMed.
- C.-J. Shih, Q. H. Wang, Y. Son, Z. Jin, D. Blankschtein and M. S. Strano, ACS Nano, 2014, 8, 5790 CrossRef CAS PubMed.
- H. Fang, C. Battaglia, C. Carraro, S. Nemsak, B. Ozdol, J. S. Kang, H. A. Bechtel, S. B. Desai, F. Kronast, A. A. Unal, G. Conti, C. Conlon, G. K. Palsson, M. C. Martin, A. M. Minor, C. S. Fadley, E. Yablonovitch, R. Maboudian and A. Javey, Proc. Natl. Acad. Sci. U. S. A., 2014, 111, 6198 CrossRef CAS PubMed.
- L. Fu, Y. Sun, N. Wu, R. G. Mendes, L. Chen, Z. Xu, T. Zhang, M. H. Rümmeli, B. Rellinghaus, D. Pohl, L. Zhuang and L. Fu, ACS Nano, 2016, 10, 2063 CrossRef CAS PubMed.
- C. N. R. Rao, K. Pramoda and R. Kumar, Chem. Commun., 2017, 53, 10093 RSC.
- K. Pramoda, U. Gupta, I. Ahmad, R. Kumar and C. N. R. Rao, J. Mater. Chem. A, 2016, 4, 8989 CAS.
- K. Pramoda, U. Gupta, M. Chhetri, A. Bandyopadhyay, S. K. Pati and C. N. R. Rao, ACS Appl. Mater. Interfaces, 2017, 9, 10664 CAS.
- N. Kumar, K. Moses, K. Pramoda, S. N. Shirodkar, A. K. Mishra, U. V. Waghmare, A. Sundaresan and C. N. R. Rao, J. Mater. Chem. A, 2013, 1, 5806 CAS.
- D. Voiry, A. Goswami, R. Kappera, e. S. Cecilia de Carvalho Castro, D. Kaplan, T. Fujita, M. Chen, T. Asefa and M. Chhowalla, Nat. Chem., 2015, 7, 45 CrossRef CAS PubMed.
- M. Barua, M. B. Sreedhara, K. Pramoda and C. N. R. Rao, Chem. Phys. Lett., 2017, 683, 459 CrossRef CAS.
- B. Gong, B. K. Choi, J. Y. Kim, D. Shetty, Y. H. Ko, N. Selvapalam, N. K. Lee and K. Kim, J. Am. Chem. Soc., 2015, 137, 8908 CrossRef CAS PubMed.
- L. Cao, Z. Li, K. Su and B. Cheng, Sci. Rep., 2016, 6, 35184 CrossRef CAS PubMed.
- A. Laachachi, A. Vivet, G. Nouet, B. B. Doudou, C. Poilâne, J. Chen, J. Bo Bai and M. H. Ayachi, Mater. Lett., 2008, 62, 394 CrossRef CAS.
- M. S. Ahmed and Y.-B. Kim, Carbon, 2017, 111, 577 CrossRef CAS.
- K. S. W. Sing, D. H. Everett, R. A. W. Haul, L. Moscou, R. A. Pierotti, J. Rouquerol and T. Siemieniewska, Pure Appl. Chem., 1984, 57, 603 CrossRef.
- K. Pramoda, R. Kumar and C. N. R. Rao, Chem.–Asian J., 2015, 10, 2147 CrossRef CAS PubMed.
- K. Sumida, D. L. Rogow, J. A. Mason, T. M. McDonald, E. D. Bloch, Z. R. Herm, T.-H. Bae and J. R. Long, Chem. Rev., 2012, 112, 724 CrossRef CAS PubMed.
- A. Ö. Yazaydın, R. Q. Snurr, T.-H. Park, K. Koh, J. Liu, M. D. LeVan, A. I. Benin, P. Jakubczak, M. Lanuza, D. B. Galloway, J. J. Low and R. R. Willis, J. Am. Chem. Soc., 2009, 131, 18198 CrossRef PubMed.
- K. Pramoda, M. Kaur, U. Gupta and C. N. R. Rao, Dalton Trans., 2016, 45, 13810 RSC.
- K. S. Park, Z. Ni, A. P. Côté, J. Y. Choi, R. Huang, F. J. Uribe-Romo, H. K. Chae, M. O'Keeffe and O. M. Yaghi, Proc. Natl. Acad. Sci. U. S. A., 2006, 103, 10186 CrossRef CAS PubMed.
- M. Dincă, A. Dailly, Y. Liu, C. M. Brown, D. A. Neumann and J. R. Long, J. Am. Chem. Soc., 2006, 128, 16876 CrossRef PubMed.
- K. Pramoda, M. M. Ayyub, N. K. Singh, M. Chhetri, U. Gupta, A. Soni and C. N. R. Rao, J. Phys. Chem. C, 2017 DOI:10.1021/acs.jpcc.7b10782.
- K. C. Knirsch, N. C. Berner, H. C. Nerl, C. S. Cucinott, Z. Gholamvand, N. McEvoy, Z. Wang, I. Abramovic, P. Vecera, M. Halik, S. Sanvito, G. S. Duesberg, V. Nicolosi, F. Hauke, A. Hirsch, J. N. Coleman and C. Backes, ACS Nano, 2015, 9, 6018 CrossRef CAS PubMed.
- U. Gupta, B. S. Naidu, U. Maitra, A. Singh, S. N. Shirodkar, U. V. Waghmare and C. N. R. Rao, APL Mater., 2014, 2, 092802 CrossRef.
| This journal is © The Royal Society of Chemistry 2018 |

