 Open Access Article
Creative Commons Attribution 3.0 Unported Licence
CO oxidation over supported gold nanoparticles as revealed by operando grazing incidence X-ray scattering analysis†
Yaroslav
Odarchenko
 ab,
David J.
Martin‡
 ab,
Thomas
Arnold
 cd and
Andrew M.
Beale
 *ab
*ab
aDepartment of Chemistry, University College London, 20 Gordon Street, London, WC1H 0AJ, UK. E-mail: Andrew.Beale@ucl.ac.uk
bResearch Complex at Harwell (RCaH), Harwell, Didcot, Oxfordshire OX11 0FA, UK
cDiamond Light Source, Harwell Science and Innovation Campus, Chilton, Didcot OX11 0DE, UK
dEuropean Spallation Source ERIC, SE-221 00 Lund, Sweden
First published on 9th April 2018
Abstract
The mechanism of carbon monoxide oxidation over gold was explored using a model planar catalyst consisting of monodisperse gold nanoparticles periodically arranged on single crystal SiO2/Si(111) substrates using a combination of Grazing Incidence Small Angle X-ray Scattering and Grazing Incidence X-ray Diffraction (GISAXS/GIXD) under reaction conditions. It is shown that nanoparticle composition, size and shape change when the catalyst is exposed to reactive gases. During CO oxidation, the particle’s submergence depth with respect to the surface decreases due to the removal of gold oxide at the metal-support edge, meanwhile the particle ‘flattens’ to maximise the number of the reaction sites along its perimeter. The effect of the CO concentration on the catalyst structure is also discussed. Our results support the dual catalytic sites mechanism whereby CO is activated on the gold surface whereas molecular oxygen is dissociating at the gold–support interface.
Introduction
In recent decades supported gold nanoparticles (NPs) have received considerable attention in the field of heterogeneous catalysis due to their extraordinary catalytic performance.1–4 When confined at the nanoscale/atomic level and stabilised on various oxide supports, Au ceases to be inert, and instead becomes a catalyst of choice for many industrially important reactions including acetylene hydrochlorination,1 CO oxidation4,5 and selective hydrogenation.6,7 Although the initial discovery of the catalytic activity of Au by Haruta and co-workers was demonstrated for the oxidation of carbon monoxide,4 the nature of the active species, the gold oxidation state and the influence of NP size and shape are not yet well understood despite numerous studies reported in the literature.8,9It is generally agreed that catalytic performance during CO oxidation depends on the nanoparticle size, and the optimal size for the highest turnover frequency was reported to be ∼3 nm on titania10 and alumina11 supports. However it is challenging to establish a true structure–activity correlation due to the intrinsic complexity of metal-based heterogeneous catalysts consisting of dispersed Au nanoparticles affixed to oxide supports such as Al2O3, TiO2 or SiO2. One of the main reasons is that commonly used preparation methods result in NPs with large particle size distributions (standard deviation, σ ≫ 1 nm)5 or can yield secondary (and often highly active) sub-nanometer atomic species.12 Furthermore, in the above studies the catalyst’s structure was probed before and/or after the reaction, which prevents the understanding of which features are pertinent in a catalytic process.
Recently operando ‘bulk’ techniques (e.g. X-ray absorption spectroscopy, XAS, and powder X-ray diffraction, XRD) have been routinely used to monitor catalytic reactions in real time under industrially relevant conditions, e.g. appropriate pressures and temperatures.13 However, taking into account that metal loading in the sample is only several percent, the measured signal mainly originates from the bulk volume and not from the surface where the reaction is happening in the proximity of the NPs.
The importance of surface sensitive studies can be emphasised by grazing-incidence small-angle X-ray scattering (GISAXS) and grazing-incidence X-ray diffraction (GIXD), which are very powerful techniques for probing the surface of a working catalyst on the macroscopic scale.7,14 Beale and co-workers studied the hydrogenation of 1,3-butadiene over gold catalysts using operando GISAXS/GIXD and demonstrated that the composition and shape of the NPs depends very much on the chemical environment. The particles were shown to be dynamic; undergoing reversible size and shape change during catalytic reaction, highlighting a dynamism often not observed by using bulk analytical techniques.7 Laoufi et al. prepared model Au catalysts on single crystal TiO2 (110) through chemical vapour deposition and showed that a NP size of 2.1 nm yields a maximum conversion of CO to CO2.14 Despite the extreme sintering under reactive gases, the reported size is somehow smaller than the previously published 3 nm for bulk catalysts. The authors didn’t discuss the presence of the gold oxide known to form at the metal–support interface15 and its role in the reaction mechanism. Possibly due to the fact, that only GISAXS analysis was performed, hence only providing information about the particles’ shape and size. However, it is possible to utilise complementary GIXD studies to identify phase composition, crystal sizes and imperfections.
Thus, a highly controlled synthesis method together with an advanced surface sensitive X-ray analysis can offer the solution to the limitations described above that originate from either the preparation methods used for ‘real’ catalysts or conventional bulk analytical methods. By following this strategy we combine the reverse polymer micelle synthesis pioneered by Spatz and co-workers16 offering tight control over NP size and encapsulation of the free metal species to fabricate supported monodisperse Au NPs regularly patterned on flat single crystal substrates and perform operando GISAXS/GIXD analysis during CO oxidation reaction. This unique approach provides insight into the surface-related mechanism and the nature of the active species during this important catalytic process and could help to design a better nanoparticulate catalytic systems with specific NP size and shape.
Materials and method
Nanoparticle synthesis
Au nanoparticles with regular periodicity (δ) and a particle size of 9.0 ± 0.9 nm were prepared using the reverse micelle method.16 Block-copolymer PS-b-P2VP (Polymer Source Inc.) was dispersed in toluene (Riedel de Haën, 99.5%) at a concentration of 5 mg ml−1, and stirred for one week to achieve complete dissolution. Subsequently, chloroauric acid (HAuCl4·H2O, Sigma-Aldrich, 99.999%) was added to the micelle-toluene solution. The metal loading took place in a nitrogen-filled glovebox with relative humidity below 10% to avoid phase separation. This final solution was stirred for another week and then filtered through a 1 μm (Glass Fibre GF100/25) and 2 μm filter (PTFE O-20/25), both from Macherey Nagel, to remove any polymer aggregates.Catalyst preparation
Model catalysts were prepared by depositing Au NPs on the flat single crystal SiO2/Si(111) substrate. Silicon wafers (1 cm2, n-type) were cleaned and subsequently dip coated at a withdrawal rate of 10 mm min−1. The dried silicon substrates were then plasma etched using a custom built high vacuum radio frequency oxygen plasma device. An oxygen plasma was applied for 30 minutes at a power of 50 W, using a chamber pressure of 1.2 × 10⁻² mbar. The sample was simultaneously heated on the stage; 50 °C for the first 5 minutes, and then 300 °C for the remaining 25 min. These 1 cm2 flat silicon substrates with patterned arrays of Au NPs were then subsequently analysed using GISAXS/GIXD under operando conditions for carbon monoxide oxidation by oxygen.Grazing incidence small-angle X-ray scattering (GISAXS) and X-ray diffraction (GIXD)
Operando GISAXS and GIXD experiments were conducted at the I07 beamline, Diamond Light Source, with a configuration similar to that previously used by Arnold et al.17 The photon energy was 10 keV. The focused beam of ca. 0.3 × 0.3 mm2 was directed on the sample at an incident angle α of 0.2°. The sample to detector distance (SD) was calibrated using several diffraction orders of Ag behenate. The modulus of the scattering vector q was calculated as q = 4π![[thin space (1/6-em)]](https://www.rsc.org/images/entities/char_2009.gif) sin
sin![[thin space (1/6-em)]](https://www.rsc.org/images/entities/char_2009.gif) θ/λ, where θ is the Bragg angle and λ is the wavelength of the photons. GISAXS data was collected using a large area detector (Pilatus 2M, 172 × 172 μm2 pixel size, 1673 × 1475 pixels) at a distance of 2685 mm. GIXD was measured using a small swing arm area detector (Pilatus 100K, 172 × 172 μm2 pixel size, 487 × 195 pixels).
θ/λ, where θ is the Bragg angle and λ is the wavelength of the photons. GISAXS data was collected using a large area detector (Pilatus 2M, 172 × 172 μm2 pixel size, 1673 × 1475 pixels) at a distance of 2685 mm. GIXD was measured using a small swing arm area detector (Pilatus 100K, 172 × 172 μm2 pixel size, 487 × 195 pixels).
The samples were positioned inside a sealed reactor complete with low X-ray absorption mica windows equipped with a computer controlled heating stage (Fig. S1†). The reactor was connected to a purpose built gas delivery system comprising of switching valves and mass flow controllers which enabled complete control of gas mixing and flow rates. The exit of the reactor was coupled to a mass spectrometer (Pfeiffer, Quadstar 422). GISAXS/GIXD were recorded at different gas compositions and a temperature of 573 K. The order was as follows: calcination in O2 (20% in He) at 573 K at a flow rate of 100 ml min−1; He at a flow rate of 54 ml min−1; CO (10% in He) and O2 (20% in He) at a flow rate ratio of 36/18 ml min−1; CO (10% in He), O2 (20% in He) and He at a flow rate ratio of 36/9/9 ml min−1; and then a clean catalyst afterwards with He gas at 54 ml min−1. Carbon dioxide CO2 was verified as the catalytic product using online mass spectrometry (MS). At each step, the waiting time was at least 10 min before collecting the data. The data reduction was performed using the ‘DAWN Science’ software package.18 Reduced 1D-GIXD profiles were fitted using the Voigt function in the OriginPro 2016 and visualised in Igor Pro.
GISAXS data analysis
The GISAXS data were fitted using the recently developed BornAgain v1.9 software.19 Being inspired by the isGISAXS tool,20 this package gives the possibility to fit the full 2D image using the user built model.21 A model consisting of Au hemispheres supported on the flat support is a very plausible representation of the 2D catalyst that was successfully used in our previous study on the C4H6 hydrogenation.7 Although the structural changes deduced from the GISAXS analysis were confirmed by the X-ray diffraction and spectroscopy data,7 in this work we have constructed a model that should better describe our catalytic system. The new model consists of spheres with a bimodal composition submerged into a SiO2/Si(111) substrate that form the hexagonal superlattice (for details see Fig. S2†). The height H of each particle above the support limits the amount of metallic gold, whereas the depth of submergence, D = 2R − H, where R is NP radius, determines the amount of gold oxide phase in each particle. The initial input values for R and D parameters were taken from the microscopy data (Fig. S2 in ESI† from Beale and co-workers7).The scattering cross-section, σ, for the periodically arranged highly monodispersed NPs could be calculated using the decoupling approximation for which the position of the particles is independent of their size and the interference function is defined by an effective structural factor calculated for the average nanoparticle size:22
 | (1) |
To account for multiple reflection-refraction effects on the surface of the flat SiO2/Si substrate one can use the Distorted Wave Born Approximation (DWBA) framework.23 The effective form factor with the four terms associated with the different reflection scenarios of incident or scattered beam reads as follows:
 | (2) |
 ; ki and kf are the incident and outgoing wavevectors respectively; r(α) is Fresnel reflection coefficient. The refractive indices of SiO2, Au and Au2O3 were taken from the literature.24
Atomic force microscopy (AFM)
AFM measurements of Au NPs supported on Si(111) substrates were recorded under ambient conditions using a Nanoscope IV controller (Bruker Veeco) in tapping mode. Tapping mode Si probes from nanosensors were used (PPP-NCHR, resonant frequency 330 kHz, spring constant 42 N m−1). The AFM images were processed using Gwyddion software.25Catalytic testing
Complementary catalytic tests were performed in a 9 mm o.d./7 mm i.d. quartz tubular reactor, using three 5 × 10 mm2 rectangular substrates of a Au/SiO2–Si catalyst. The gas composition order was as follows: calcination in O2 (20% in He) at 573 K at a flow rate of 100 ml min−1; He at a flow rate of 123 ml min−1; CO (1% in He) and O2 (20% in He) at flow rates of 120 and 3 ml min−1, respectively; CO (1% in He), O2 (20% in He) and He at flow rates of 60, 3 and 60 ml min−1, respectively. The MS data were normalised using He. The output gases were analyzed by MS (Pfeiffer Omnistar).Results
Operando GISAXS
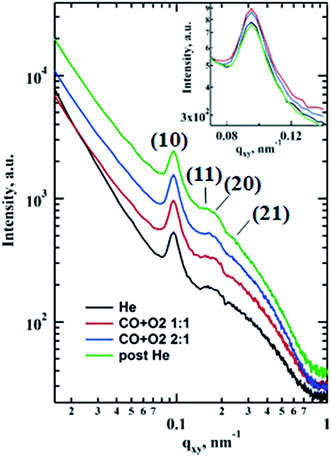
The morphological changes during CO oxidation reaction using a model planar catalyst were monitored using operando GISAXS. The 1D GISAXS patterns before, during CO oxidation at CO to O2 ratios of 1![[thin space (1/6-em)]](https://www.rsc.org/images/entities/char_2009.gif) :
:![[thin space (1/6-em)]](https://www.rsc.org/images/entities/char_2009.gif) 1 and 2
1 and 2![[thin space (1/6-em)]](https://www.rsc.org/images/entities/char_2009.gif) :
:![[thin space (1/6-em)]](https://www.rsc.org/images/entities/char_2009.gif) 1, and after the reaction are shown in Fig. 1. The in-plane experimental profiles display a number of peaks with the position ratio of 1
1, and after the reaction are shown in Fig. 1. The in-plane experimental profiles display a number of peaks with the position ratio of 1![[thin space (1/6-em)]](https://www.rsc.org/images/entities/char_2009.gif) :
:![[thin space (1/6-em)]](https://www.rsc.org/images/entities/char_2009.gif)

![[thin space (1/6-em)]](https://www.rsc.org/images/entities/char_2009.gif) :
:![[thin space (1/6-em)]](https://www.rsc.org/images/entities/char_2009.gif)

![[thin space (1/6-em)]](https://www.rsc.org/images/entities/char_2009.gif) :
:![[thin space (1/6-em)]](https://www.rsc.org/images/entities/char_2009.gif)
 corresponding to the (10), (11), (20) and (21) reflections of the 2D hexagonal superlattice formed by the Au NPs (Fig. 1). The presence of these peaks during all stages of the reaction indicates that there is no sintering or Ostwald ripening (inter-particle effects). This is also supported by the AFM data measured after the reaction and shown in Fig. S3.†
When the CO is converted to CO2 over supported gold there is an increase in intensity of (10) reflection that could be associated with the improved scattering density contrast (inset in Fig. 1). This could be due to the scattering objects (i.e. nanoparticles) becoming more identical similar to the inverse melting effect26 or removal of subsurface and metal-oxide interface gold oxide layer and migration of Au to the surface,7,15 or a combination of both. The signal also increases at larger q (‘Porod’ region) for the in-plane profiles taken under the reaction conditions that could indicate a more abrupt interface between catalyst and gas atmosphere.27
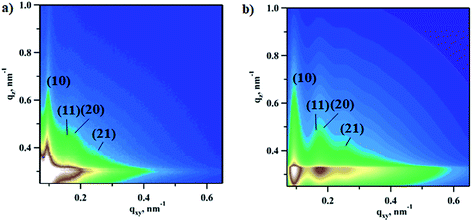
In order to extract changes in NPs’ shape and phase under reaction conditions the 2D experimental patterns were fitted using the model with bimodal spheres arranged into the planar hexagonal superlattice (Fig. S2†). Further details regarding GISAXS analysis can be found in the Experimental section. As an example, the experimental pattern collected under reaction conditions at a CO![[thin space (1/6-em)]](https://www.rsc.org/images/entities/char_2009.gif) :
:![[thin space (1/6-em)]](https://www.rsc.org/images/entities/char_2009.gif) O2 ratio of 2
O2 ratio of 2![[thin space (1/6-em)]](https://www.rsc.org/images/entities/char_2009.gif) :
:![[thin space (1/6-em)]](https://www.rsc.org/images/entities/char_2009.gif) 1 and the fitted pattern are compared in Fig. 2. The calculated pattern looks very similar to the real data and shows four interference peaks of hexagonal symmetry with a lattice constant of 73.5 ± 5.9 nm, which is in good agreement with the microscopy data (78.8 ± 9.9 nm) reported elsewhere.7
1 and the fitted pattern are compared in Fig. 2. The calculated pattern looks very similar to the real data and shows four interference peaks of hexagonal symmetry with a lattice constant of 73.5 ± 5.9 nm, which is in good agreement with the microscopy data (78.8 ± 9.9 nm) reported elsewhere.7
Particle size and depth of submergence calculated based on goodness of the fit as a function of gas atmosphere are summarised in Fig. 3. Under He flow the extracted NP radius of 4.2 ± 0.3 nm did not change much from the initial value of R = 4.5 ± 0.5 nm measured using SEM.7 This value only slightly increases during the oxidation of CO as can be seen in Fig. 3a. However the depth of submergence (Fig. S2†) is significantly decreasing from 3.8 ± 0.3 to 2.8 ± 0.2 nm, indicating that the average particle in the array is simultaneously lifted with respect to the support due to the removal of the gold oxide layer at the metal-oxide interface (Fig. 3b). Similar results have been reported for CO oxidation over Au/TiO2 and the butadiene hydrogenation over the same catalyst.7,14 Decrease of the contact perimeter along the metal–support interface due to the particle lifting is compensated by its flattening and increase in particle’s width (Fig. 3c). Such behaviour allows the number of reaction sites situated at the perimeter of the Au particles necessary for CO oxidation to be maximised. At the end of the reaction, the gas atmosphere is switched to helium, the NP’s depth value of 3.2 ± 0.3 nm suggests slow recovery to the original state (Fig. 3b).
Since gold particles of 9 nm in diameter are highly crystalline, one can complement GISAXS results with X-ray diffraction on the surface.
Operando GIXD
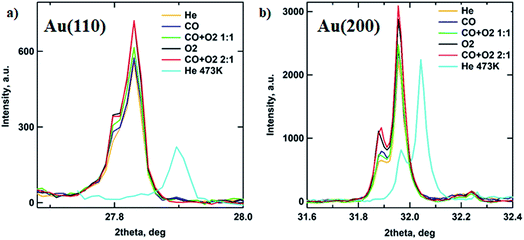
In order to follow the transformations in the crystalline structure of Au NP arrays, the GIXD data were collected under various gas atmospheres (see Experimental section for details). Fig. 4 shows the 1D GIXD profiles for (110) and (200) reflections of the Au fcc lattice.28 One can see that during exposure to the mixture of CO to O2 with a 2![[thin space (1/6-em)]](https://www.rsc.org/images/entities/char_2009.gif) :
:![[thin space (1/6-em)]](https://www.rsc.org/images/entities/char_2009.gif) 1 ratio, which corresponds to the optimal stoichiometry for this reaction, both peaks exhibit the largest area. The observed increase in the amount of metallic gold on the catalyst surface can be explained by the intense restructuring at the perimeter of the Au nanoparticle that is triggered by the exothermic reaction of CO oxidation by oxygen and will be discussed later.29 These results are supported by the GISAXS analysis above showing that the NP’s volume buried under the substrate surface is decreasing, corresponding to the removal of Au2O3 (Fig. 3b and 5).
1 ratio, which corresponds to the optimal stoichiometry for this reaction, both peaks exhibit the largest area. The observed increase in the amount of metallic gold on the catalyst surface can be explained by the intense restructuring at the perimeter of the Au nanoparticle that is triggered by the exothermic reaction of CO oxidation by oxygen and will be discussed later.29 These results are supported by the GISAXS analysis above showing that the NP’s volume buried under the substrate surface is decreasing, corresponding to the removal of Au2O3 (Fig. 3b and 5).
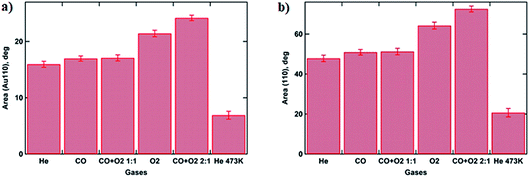 | ||
| Fig. 5 Histograms showing calculated peak areas for Au fcc (110) (a) and (200) (b) reflections under various gas atmospheres, using a Voigt function for peak fitting. | ||
Catalytic data
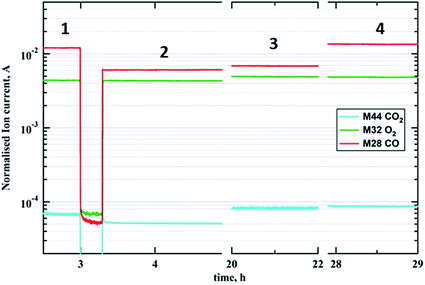
Fig. 6 captures the evolution of mass fragments corresponding to reactants and products during CO oxidation at 573 K. Steps 1 and 2 show the flow of reactants CO (m/z = 28) and O2 (m/z = 32) at ratios of 2![[thin space (1/6-em)]](https://www.rsc.org/images/entities/char_2009.gif) :
:![[thin space (1/6-em)]](https://www.rsc.org/images/entities/char_2009.gif) 1 and 1
1 and 1![[thin space (1/6-em)]](https://www.rsc.org/images/entities/char_2009.gif) :
:![[thin space (1/6-em)]](https://www.rsc.org/images/entities/char_2009.gif) 1, respectively, via the empty reactor tube. While steps 3 and 4 display reaction stages in the presence of a gold catalyst with carbon monoxide to oxygen ratios of 1
1, respectively, via the empty reactor tube. While steps 3 and 4 display reaction stages in the presence of a gold catalyst with carbon monoxide to oxygen ratios of 1![[thin space (1/6-em)]](https://www.rsc.org/images/entities/char_2009.gif) :
:![[thin space (1/6-em)]](https://www.rsc.org/images/entities/char_2009.gif) 1 and 2
1 and 2![[thin space (1/6-em)]](https://www.rsc.org/images/entities/char_2009.gif) :
:![[thin space (1/6-em)]](https://www.rsc.org/images/entities/char_2009.gif) 1, respectively. The increase in CO2 concentration (m/z = 44) during steps 3 and 4 is rather small due to the fact that the total mass of the catalyst was in the order of picograms. However the highest CO2 production rate is achieved at the optimal stoichiometry of carbon monoxide to oxygen, which is 2
1, respectively. The increase in CO2 concentration (m/z = 44) during steps 3 and 4 is rather small due to the fact that the total mass of the catalyst was in the order of picograms. However the highest CO2 production rate is achieved at the optimal stoichiometry of carbon monoxide to oxygen, which is 2![[thin space (1/6-em)]](https://www.rsc.org/images/entities/char_2009.gif) :
:![[thin space (1/6-em)]](https://www.rsc.org/images/entities/char_2009.gif) 1. Note this gas composition corresponds to the highest degree of gold reduction according to the GISAXS/GIXD data above.
1. Note this gas composition corresponds to the highest degree of gold reduction according to the GISAXS/GIXD data above.
Discussion
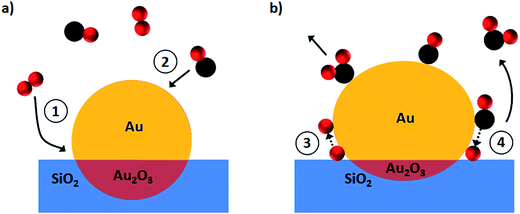
The observed structural changes and the proposed reaction mechanism are schematically depicted in Fig. 7. Initially O2 from the gas phase is anchored at the perimeter sites (process 1 in Fig. 7a) whereas CO is captured preferentially at the gold surface (process 2) as has been shown for Au on a SiO2 catalyst at room temperature.30 O–O bond scission (process 3) is a next critical step before the CO oxidation reaction. To the best of our knowledge the detailed mechanisms for process 3 (Fig. 7b) were reported only for Au/TiO2 systems.9,31 Thus oxygen dissociation could be activated by CO–O2 complex formation at the metal–support interface as observed by Green et al.9 or by Au–OOH species formed near the particle perimeter as shown more recently in the work of Saavedra et al.31 who stressed a critical role of support OH groups due to the presence of water. Based on our findings it is reasonable to assume that oxygen is dissociated over gold on a SiO2 support via the dual catalytic sites mechanism9 since the water trap was used in our set-up. Afterwards oxygen atoms react with the adsorbed CO molecules to form CO2 (process 4 in Fig. 7b).In order to rationalise the observed movement of the gold atoms at the surface and particle–support interface one has to note that the reaction temperature of 573 K is above the Hüttig temperature (TH = 400 K) that allows the surface atoms mobility in metals and is close to the Tammann temperature (TT = 600 K) that is associated with the solid-state diffusion.32,33 As CO conversion to CO2 is strongly exothermic (ΔH = −282.7 kJ mol−1),29 this would further increase the temperature at the surface, which in turn triggers nanoparticle restructuring.
In our study we show that an increase in the CO pressure accelerates gold reduction, which results in the particle size growth and reshaping. Moreover, the increased particle size results in the larger surface area, which favours catalyst activity as can be seen in Fig. 6. Our findings are in a good agreement with the X-ray photoelectron spectroscopy data and theoretical calculations for gold-based catalysts.15,34 Cuenya and co-workers reported the decomposition of Au2O3 in 5 nm Au NPs supported on SiO2 in the presence of CO.15 However their results were based on XPS data, which requires UHV and thus the reaction conditions were not industrially relevant. Ha et al. has shown that CO saturation opens a fast CO oxidation pathway over the Au/CeO2 system using DFT.34
Conclusions
We have successfully combined a highly controlled synthesis method that yields uniform gold nanoparticles arranged in regular hexagonal arrays with advanced surface-sensitive X-ray scattering techniques to gain insight into the mechanism of CO oxidation, and the role of the metal–support interface. It was revealed that supported Au nanoparticles undergo size and shape transformations during CO oxidation, primarily due to gold oxide removal at the metal–support interface along the particle perimeter. The fact that the highest CO2 conversion rate corresponds to the catalyst structure with the maximum metallic gold content helps to identify the nature and the origin of the true active species.We demonstrated that operando GISAXS/GIXD studies on model catalysts can be well correlated with the ‘real’ catalytic systems and thus support the dual catalytic sites mechanism where CO is activated on the gold surface whereas molecular oxygen is dissociating at the gold–support interface.
Our findings also highlight the importance of the operando studies in capturing the transient catalyst structures that are often not observed with the conventional methods. Monitoring of the catalyst structure under reaction conditions could help to potentially improve real world catalysts by designing high surface energy nanodisks or rods that will have better stability and reactivity.
Acknowledgements
The authors would like to thank the EPSRC for funding (grant EP/K007467/1) and the Diamond Light Source for the experiments SI10488 and SI12780. The authors thank Donato Decarolis and Jennifer J. Herbert for help during the beamtime. Dr Jonathan Rawle and Prof Chris Nicklin from I07 beamline, DLS, are also thanked for the excellent technical support. Dr Gennady Pospelov is acknowledged for help in using the BornAgain package. The authors are grateful to Prof. Hans-Gerd Boyen (Institute for Materials Research, Hasselt University, Diepenbeek, Belgium) for donation of the Au containing catalyst sample. The raw data can be accessed using the following link: http://tiny.cc/C8FD00007G.References
- G. Malta, S. A. Kondrat, S. J. Freakley, C. J. Davies, L. Lu, S. Dawson, A. Thetford, E. K. Gibson, D. J. Morgan, W. Jones, P. P. Wells, P. Johnston, C. R. A. Catlow, C. J. Kiely and G. J. Hutchings, Science, 2017, 355, 1399–1403 CrossRef PubMed.
- A. Corma and H. Garcia, Chem. Soc. Rev., 2008, 37, 2096 RSC.
- C. Della Pina, E. Falletta, L. Prati and M. Rossi, Chem. Soc. Rev., 2008, 37, 2077 RSC.
- M. Haruta, T. Kobayashi, H. Sano and N. Yamada, Chem. Lett., 1987, 16, 405–408 CrossRef.
- M. Comotti, W.-C. Li, B. Spliethoff and F. Schüth, J. Am. Chem. Soc., 2005, 128, 917–924 CrossRef PubMed.
- H. Sakurai and M. Haruta, Catal. Today, 1996, 29, 361–365 CrossRef.
- D. James Martin, D. Decarolis, Y. I. Odarchenko, J. J. J. Herbert, T. Arnold, J. Rawle, C. Nicklin, H.-G. Boyen and A. M. Beale, Chem. Commun., 2017, 53, 5159–5162 RSC.
- M. C. Kung, R. J. Davis and H. H. Kung, J. Phys. Chem. C, 2007, 111, 11767–11775 Search PubMed.
- I. X. Green, W. Tang, M. Neurock and J. T. Yates, Science, 2011, 333, 736–739 CrossRef PubMed.
- G. R. Bamwenda, S. Tsubota, T. Nakamura and M. Haruta, Catal. Lett., 1997, 44, 83–87 CrossRef.
- J. Jia, K. Haraki, J. N. Kondo, K. Domen and K. Tamaru, J. Phys. Chem. B, 2000, 104, 11153–11156 CrossRef.
- S. M. Rogers, C. R. A. Catlow, C. E. Chan-Thaw, D. Gianolio, E. K. Gibson, A. L. Gould, N. Jian, A. J. Logsdail, R. E. Palmer, L. Prati, N. Dimitratos, A. Villa and P. P. Wells, ACS Catal., 2015, 5, 4377–4384 CrossRef.
- K. Qian, L. Luo, H. Bao, Q. Hua, Z. Jiang and W. Huang, Catal. Sci. Technol., 2013, 3, 679–687 Search PubMed.
- I. Laoufi, M. C. Saint-Lager, R. Lazzari, J. Jupille, O. Robach, S. Garaudée, G. Cabailh, P. Dolle, H. Cruguel and A. Bailly, J. Phys. Chem. C, 2011, 115, 4673–4679 Search PubMed.
- L. K. Ono, B. R. Cuenya and B. Roldan Cuenya, J. Phys. Chem. C, 2008, 112, 4676–4686 Search PubMed.
- J. P. Spatz, S. Mössmer, C. Hartmann, M. Möller, T. Herzog, M. Krieger, H.-G. Boyen, P. Ziemann and B. Kabius, Langmuir, 2000, 16, 407–415 CrossRef.
- T. Arnold, C. Nicklin, J. Rawle, J. Sutter, T. Bates, B. Nutter, G. McIntyre and M. Burt, J. Synchrotron Radiat., 2012, 19, 408–416 CrossRef PubMed.
- M. Basham, J. Filik, M. T. Wharmby, P. C. Y. Chang, B. El Kassaby, M. Gerring, J. Aishima, K. Levik, B. C. A. Pulford, I. Sikharulidze, D. Sneddon, M. Webber, S. S. Dhesi, F. Maccherozzi, O. Svensson, S. Brockhauser, G. Náray and A. W. Ashton, J. Synchrotron Radiat., 2015, 22, 853–858 Search PubMed.
- J. Burle, C. Durniak, J. M. Fisher, M. Ganeva, G. Pospelov, W. Van Herck and J. Wuttke, 2017.
- R. Lazzari, J. Appl. Crystallogr., 2002, 35, 406–421 CrossRef.
- A. Singh, S. Schipmann, A. Mathur, D. Pal, A. Sengupta, U. Klemradt and S. Chattopadhyay, Appl. Surf. Sci., 2017, 414, 114–123 CrossRef.
- M. Kotlarchyk and S. Chen, J. Chem. Phys., 1983, 79, 2461–2469 CrossRef.
- S. K. Sinha, E. B. Sirota, S. Garoff and H. B. Stanley, Phys. Rev. B, 1988, 38, 2297–2311 CrossRef.
- B. L. Henke, E. M. Gullikson and J. C. Davis, At. Data Nucl. Data Tables, 1993, 54, 181–342 CrossRef.
- D. Nečas and P. Klapetek, Open Phys., 2012, 10, 181–188 Search PubMed.
- Y. Yu, A. Jain, A. Guillaussier, V. R. Voggu, T. M. Truskett, D.-M. Smilgies and B. A. Korgel, Faraday Discuss., 2015, 181, 181–192 RSC.
- K. Høydalsvik, J. B. Fløystad, A. Voronov, G. J. B. Voss, M. Esmaeili, J. Kehres, H. Granlund, U. Vainio, J. W. Andreasen, M. Rønning and D. W. Breiby, J. Phys. Chem. C, 2014, 118, 2399–2407 Search PubMed.
- R. W. G. Wyckoff, Crystal Structures, Interscience Publishers, New York, 2nd edn, 1963, vol. 1, p. 7 Search PubMed.
- T. X. T. Sayle, S. C. Parker and C. R. A. Catlow, J. Chem. Soc., Chem. Commun., 1992, 977 RSC.
- N. Weiher, E. Bus, L. Delannoy, C. Louis, D. E. Ramaker, J. T. Miller and J. A. van Bokhoven, J. Catal., 2006, 240, 100–107 CrossRef.
- J. Saavedra, H. A. Doan, C. J. Pursell and C. Lars, 2014, 345.
- J. A. Moulijn, A. E. Van Diepen and F. Kapteijn, Appl. Catal., A, 2001, 212, 3–16 CrossRef.
- M. Wolf, H. Kotzé, N. Fischer and M. Claeys, Faraday Discuss., 2017, 197, 243–268 RSC.
- H. Ha, H. An, M. Yoo, J. Lee and H. Y. Kim, J. Phys. Chem. C, 2017, 121, 26895–26902 Search PubMed.
Footnotes |
| † Electronic supplementary information (ESI) available. See DOI: 10.1039/c8fd00007g |
| ‡ Current address: Van’t Hoff Institute for Molecular Sciences, University of Amsterdam, Amsterdam, Netherlands, 1098XH. |
| This journal is © The Royal Society of Chemistry 2018 |

