Electrochemiluminescence biosensing based on different modes of switching signals
Ying
Zhuo†
 ,
Hai-Jun
Wang†
,
Yan-Mei
Lei
,
Pu
Zhang
,
Jia-Li
Liu
,
Ya-Qin
Chai
,
Hai-Jun
Wang†
,
Yan-Mei
Lei
,
Pu
Zhang
,
Jia-Li
Liu
,
Ya-Qin
Chai
 * and
Ruo
Yuan
 *
*
Key Laboratory of Luminescent and Real-Time Analytical Chemistry (Southwest University), Ministry of Education, College of Chemistry and Chemical Engineering, Southwest University, Chongqing 400715, PR China. E-mail: yuanruo@swu.edu.cn; yqchai@swu.edu.cn; Fax: +86-23-68253172; Tel: +86-23-68252277
First published on 23rd May 2018
Abstract
Electrochemiluminescence (ECL) has attracted much attention in various fields of analysis owing to low background signals, high sensitivity, and excellent controllability. In recent years, to further boost the performance of biosensors, diverse output signal modes have been developed, which exhibited respective advantages. In this review, we summarize the latest sensing applications of ECL bioanalysis by generalizing different output signal modes and give future perspectives for new developments in ECL analytical technology.
1. Introduction for ECL technology
Electrochemiluminescence (ECL), also called electrogenerated chemiluminescence, is a kind of chemiluminescence (CL) phenomenon powered by electrochemical means. By the smart integration of electrochemistry and spectroscopy, ECL has shown potential superiorities over other optical methods. First, compared with fluorescence, ECL has no need for external light sources, which not only simplifies the experimental apparatus but also disables background responses from luminous impurities and scattered light, thus resulting in high sensitivity. Second, ECL shows preferable control toward the position of the luminous emission because ECL emission is close to the surface of the electrode. Third, it has an excellent specificity owing to the relationship between the ECL species and co-reactants, and satisfied selectivity since the excited states can be operated by alternating the applied potential. Finally, ECL allows better control over the time of ECL systems, improving their simplicity and reproducibility. Therefore, the ECL technique has become one of the most powerful analytical tools in the field of trace target detection, food and environmental monitoring, imaging, etc.With the fast developing of ECL analysis, researchers realized several modes of switching a signal for ECL biosensing and ECL imaging. This review presents a detailed summary of the biological applications of ECL that are based on different switching modes. In particular, this review has tried to make an in-depth discussion and conclusions on the similarities and differences of ECL biosensing through a single channel and multiple channels.
2. Different signal output modes of ECL biosensors
2.1 Single signal switching modes
Single signal switching modes have been widely employed in either “signal-off” or “signal-on” modes over the past several decades. Correspondingly, the signal either decreases or increases in response to the presence of analytes. In general, the signal-off modes as a powerful approach have been demonstrated to be significantly prospective for a sensing platform due to its high sensitivity, facile manipulation, reagentless process, and so on.1–3 According to different ways of using the quenching mechanism, we classify the “signal-off” modes into four broad categories.2.1.2.1 Signal-off induced by ECL quencher. The ECL emission of the luminophore is directly quenched by the ECL quencher, making the ECL signal decreases with the increasing concentrations of analytes.4 Over the past few years, extensive efforts have been made to establish a traditional “signal-off” mode for target detection.5 Notably, the quencher is a fundamental and important material for the construction of the signal-off bioanalysis strategy based on electron transfer. For example, ferrocene (Fc) as a classic quencher has been demonstrated by Cao et al.6,7 to quench the ECL emission of Ru(bpy)32+via electron transfer. Moreover, Quantum dots (QDs) have been widely utilized in ECL sensors due to their beneficial physical properties such as broad excitation and symmetric tunable emission spectra, photochemical stability, and binding compatibility with biomolecules. Therefore, Ju's group proposed that a ferrocenyl-terminated dendrimer as quencher be constructed to quench the cathodic ECL emission of QDs; this made the ECL intensity drop notably due to the enrichment of Fc molecules.1 Lately, the construction of a novel and highly-effective quenching method has become a particular focus in practical applications of biosensor assays for accomplishing highly sensitive detection. As shown in Fig. 1, Chen et al. developed a “signal-off” ECL platform for thrombin by controlling the distance between CdS nanocrystals (NCs) and Au nanoparticles (NPs) and the enhanced ECL of CdS NCs with Au NPs based on energy transfer.8 They synthesized CdS NCs as an ECL emitter and attached an aptamer of thrombin. The single-stranded DNA–Au nanoparticle (ssDNA–AuNP) conjugates were formed after modification of complementary ssDNA on a CdS NCs modified electrode. An enhanced ECL signal was achieved because of energy transfer between AuNPs and CdS NCs with a separation length. Significantly, such ECL signal enhancement may be the most import and novel point in the “on–off” switch system construction for improving detection sensitivity as compared to the traditional “signal-off” modes. The ECL signal decrease was achieved by target-induced removal of ssDNA–AuNP conjugates, greatly reflecting the presence of target protein. Moreover, decrease of the ECL signal was logarithmically linear with the concentration of thrombin in a wide range from 100 aM to 100 fM. Summarized from the above examples, the single quenching path was usually designed in a signal-off biosensor construction. Thus, it can be concluded that the key point is that the more highly the initial signal of the “signal-on” state was enhanced, the larger the quenching rate of the “signal-off” state became, as well as the lower the background signal was.
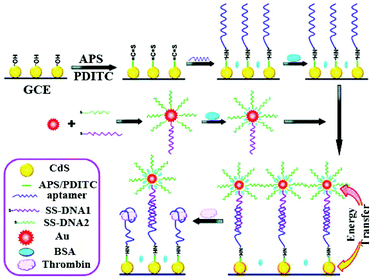 | ||
| Fig. 1 Illustration of the ECL enhancement of CdS NCs by Au NPs and “signal-off” ECL strategy originating from the replacement of ssDNA–AuNP conjugates by a target. (Reprinted with permission from ref. 8. Copyright 2011 American Chemical Society.) | ||
Moreover, with a high initial ECL signal as the desirable “signal-on” state and a multi-quenching as an excellent “signal-off state”, an elaborated system provided a new chance for constructing a variety of the highly sensitive “signal-off” modes. Thus, in our previous work, a novel “on–off” ECL aptasensor was developed based on multi quenching of the hemin/G-quadruplex DNAzymes towards the Ru(II) self-enhanced molecule (PTCA-PEI-Ru(II))-based ECL system for highly sensitive determination of thrombin (Fig. 2).9 First, based on the dual amplification strategies which are outlined as follows: (i) an intermolecular co-reaction between PTCA-PEI-Ru(II) and nicotinamide adenine dinucleotide (NADH) and (ii) an intramolecular self-enhanced PTCA-PEI-Ru(II), a strong initial ECL signal was achieved as the signal-on state. Then, the signal-off state was realized by the strategy of (i) consuming the co-reactant of NADH which originated from the hemin/G-quadruplex DNAzymes to oxidize NADH and in situ generate the H2O2; (ii) the active center of hemin could oxidize the excited state Ru(II)* to Ru(III), making the energy and electron transfer quench; and (iii) hemin/G-quadruplex DNAzymes could act as horseradish peroxidase (HRP) to catalyze H2O2 for in situ producing the quencher of O2. Down to the femtomolar level of thrombin was detected by the novel triple quenching effect of multifunctional hemin/G-quadruplex DNAzymes upon the Ru(II) self-enhanced complex-based ECL system. With the design of the “on–off” switch, the proposed aptasensor was anticipated to apply in determination of other targets.
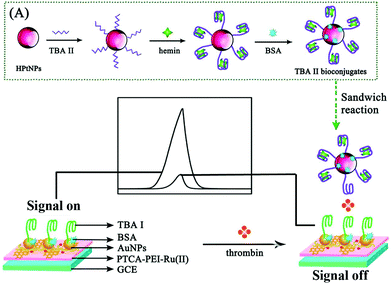 | ||
| Fig. 2 Schematic illustration of the possible luminescence mechanism of the “on–off” ECL aptasensor. (Reprinted with permission from ref. 9. Copyright 2015 American Chemical Society.) | ||
2.1.2.2 Signal-off induced by ECL-RET. An efficient sensing platform based on electrochemiluminescence resonance energy transfer (ECL-RET) was developed to further boost the sensitivity of ECL sensors. ECL-RET, often occurring between an effective energy donor and a suitable acceptor, is an attractive technique for sensitive detection of analytes due to its no excitation light source and no interference from the scattered light.10–12 Chen's group developed a sensitive biosensor based on a ECL-RET protocol with Au@Ag2S NPs as the ECL acceptor and Ru(bpy)32+ composites (graphene oxide(GO)-Au/RuSi@Ru(bpy)32+/chitosan(CS)) as the ECL donor.13 Significant advantages were acquired for ultrasensitive detection of nucleotide sequences, proteins and cells. Especially, the critical step to obtain optimal ECL-RET efficiency is to search for the perfect energy overlapped donor–acceptor pair (Table 1).
| Donor | Acceptor | Ref. |
|---|---|---|
| CdS QDs | Ru(bpy)32+ | 19 |
| g-C3N4 NS | Ru(bpy)32+ | 20 |
| CdS NRs | Ru(bpy)32+ | 21 |
| CdS QDs | Cy5 | 22 |
| Ru(dcbpy)32+ | CdSe@ZnS QDs | 23 |
| CdS QDs | Ag CNs | 24 |
| CdS QDs | Au NPs | 25 |
| Ru(bpy)32+ | CdTe QDs | 26 |
| CdTe QDs | TAEA-Ru | 27 |
| CdS:Eu QDs | Au NRs | 28 |
| CdS:Eu QDs | Au NPs | 29 |
| BSA-AuNC | Ru(bpy)32+ | 30 |
| G QDs | Au NPs | 31 |
| PTC-NH2 | S2O82− | 14 |
| ([Ru(bpy)3]2+)/2-(dibutylamino) ethanol | CdSe@ZnS QDs | 32 |
| Ru(bpy)32+ | AuNPs/GO | 33 |
| GO-Au/RuSi@Ru(bpy)32+/CS | Au@Ag2S | 34 |
| Pb(II)-β-cyclodextrin | CS/Ru(bpy)32+/silica NPs | 35 |
| CdTe/CdS QDs | AuNRs | 36 |
| Si QDs | Au NPs | 37 |
| NGQDs | Fe3O4@MnO2 | 38 |
| Luminol | Ru(bpy)32+ | 39 |
| Luminol | CdSe@ZnS QDs | 40 |
| Si-Containing polymer dots | DA | 41 |
Herein, our group constructed a ratiometric sensing platform for lead ion detection based on ECL-RET between peroxydisulfate/oxygen as a donor and the perylene derivative as an acceptor.14 Apparently, it is significant to look for a new donor–acceptor pair because energy-tunable materials show great application potential to realize an ECL-RET for enhancing the ECL intensity. Therefore, various kinds of nanocomposites such as Au NPs/GO,15 CdS/graphene,16 and hemin/graphene/gold nanorods (H/RGO/Au NRs)17 were also used as acceptors.
For example, Zhu's group reported a convenient and simple biosensing approach based on ECL-RET between luminol as a donor and CdSe@ZnS quantum dots (CdSe@ZnS QDs) as an acceptor in neutral conditions (Fig. 3).12 The thrombin binding aptamer (TBA) covalently functionalized the CdSe@ZnS QDs/GCE via an amidation reaction between the carboxyl group on the CdSe@ZnS QDs surface and the amino group of TBA. After hybridizing with TBA, the DNA probe was successfully immobilized on the modified electrode. Another layer of CdSe@ZnS QDs was connected to the DNA probe, and an enhancement of anodic ECL intensity was achieved due to the ECL-RET between the CdSe@ZnS QDs and the excited state of luminol. Once thrombin displaced the probe DNA due to its higher affinity for TBA, then sensitive detection of thrombin can be achieved. Upon ECL-RET, the as-proposed luminol-CdSe@ZnS QDs ECL biosensor yielded a linear range from 10 fM–100 pM, which will be a promising way for the analysis of protein. Summarizing from the above examples, “signal-off” strategies induced by ECL-RET strategies are springing up and have now become the main driving force of innovation for ECL assays.
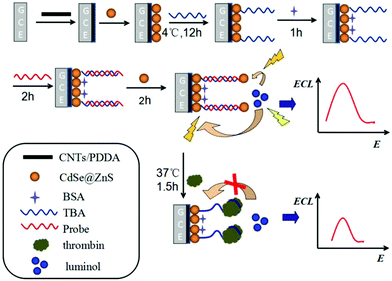 | ||
| Fig. 3 Schematic representation of the modification of GCE and detection of thrombin. (Reprinted with permission from ref. 12. Copyright 2014 American Chemical Society.) | ||
The above study demonstrated an intermolecular ECL-RET between CdSe@ZnS QDs and luminol, which was an efficiency strategy for biological applications. Although the method has improved the sensitivity of the sensors to a certain extent, the ECL-RET still suffers from a defect of low energy transfer efficiency. More recently, as shown in Fig. 4, our group employed the intramolecular ECL-RET between luminol as donor and Ru(bpy)32+ as an acceptor due to a perfect spectral overlap of the donor and acceptor.18 In brief, a high ECL signal was obtained through the intramolecular ECL-RET from the luminol excited state to Ru(bpy)2(mcpbpy)2+ in the Lum-Ru. Then, after the sample solution (containing dNTPs, Nt.BbvC I nicking enzyme, phi29 polymerase, and the target aflatoxin M1 (AFM1)) was incubated on the modified electrode and a one-pot target-induced circular exponential amplification (TICEA) was executed to recycle AFM1 and produced numerous ssDNA as the “mimic target”. Eventually, a mass of hairpin probe 1 (H1) on the surface of the electrode was opened to form numerous ferrocene-labeled double stranded DNA (dsDNA) resulting in a significant decrease of ECL intensity from the ferrocene quenching. Thus, the proposed aptasensor achieved quantitative detection of AFM1 through the change of ECL response to the concentration of AFM1 with high sensitivity. In general, with a highly-efficient ECL-RET in one molecule, a highly intense ECL signal of Lum-Ru was obtained owing to the short path of energy transmission and less energy loss between luminol and Ru(bpy)2(mcpbpy)2+.
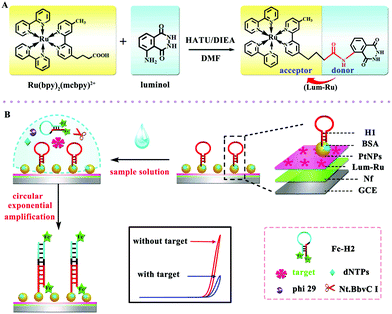 | ||
| Fig. 4 Representations of (A) the synthesis of the Lum-Ru compounds and (B) fabrication of the aptasensor and the reaction mechanism. (Reprinted with permission from ref. 18. Copyright 2017 Wiley.) | ||
2.1.2.3 Signal-off induced by steric hindrance. Steric hindrance from a target induced deposition or biorecognition reaction was usually designed in a signal-off biosensor construction.42 Steric hindrance could suppress the ECL signal from the electrode surface, which has enabled the development of signal-off ECL sensing systems.43,44 From the decrease of an ECL signal caused by physical effects, researchers have greatly improved performance by bringing in nanomaterials to improve ECL intensity and offering more binding sites, which is suitable for the sensing of biomacromolecules and cells.45,46 As shown in Fig. 5, using a steric hindrance effect, Jiang's group constructed a one-step ECL immunosensor for sensitive detection of carbohydrate antigen 19-9 (CA19-9).47 In this system, a magnetic graphene oxide nanomaterial (nanoFe3O4@GO) was synthesized for CA19-9 antibody (anti-CA19-9) binding and N-(4-aminobutyl)-N-ethylisoluminol (ABEI) loading. The multi-functionalized magnetic nanomaterial then was immobilized on the GCE surface in the presence of an external magnetic field. Finally, the ECL immunosensor was established based on a one-step direct immunoreaction process for ultrasensitive detection of CA19-9 with a detection limit of 0.0005 U mL−1.
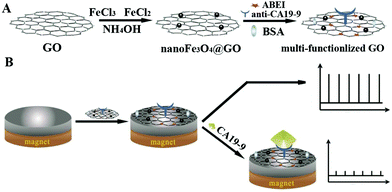 | ||
| Fig. 5 Schematic diagram for (A) the preparation of multi-functionalized graphene oxide, and (B) the fabrication and application protocol of the ECL immunosensor using multi-functionalized graphene oxide. (Reprinted with permission from ref. 47. Copyright 2015 Elsevier.) | ||
In a novel solid-state ECL sensor based on a steric hindrance effect reported by Fu's group (Fig. 6),48 a ECL “on–off” sensor with a luminescence-functionalized ruthenium metal–organic framework (Ru-MOF) nanoflowers and CdS QDs was developed as a “signal-off” switching sensor. The presence of tryptophan significantly inhibited the ECL signal from the electrode surface to achieve efficient reduction of the signal for tryptophan enantiomers detection. This “on–off” strategy may open new channels based on novel switches for sensing small molecules. And we expect that it will promote the development of nanomaterials-based sensors and improve their performance in a range of important applications. As depicted in Fig. 7, a non-labeled ECL immunosensor with the use of CdSe QDs for detection of human prealbumin (PAB) has been described based on a similar inhibition process.49 Specifically, cysteamine was first modified on the gold electrode surface and then conjugated with the Au NPs cysteine, anti-PAB (PAB antibody), and CdSe QDs via an amide bond. In the presence of PAB, the immunocomplex generated and inhibited the reaction between K2S2O8 with CdSe QD since the increase of the steric hindrance, eventually resulting in a decrease of ECL intensity. Although this system is simple and convenient, its sensitivity is limited, and it is difficult to realize the sensitive analysis of a constant target.
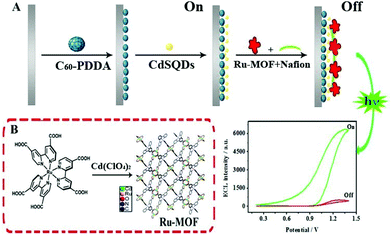 | ||
| Fig. 6 (A) Schematic illustration of the ECL sensor. (B) Preparation of the Ru-MOF. (Reprinted with permission from ref. 48. Copyright 2017 Elsevier.) | ||
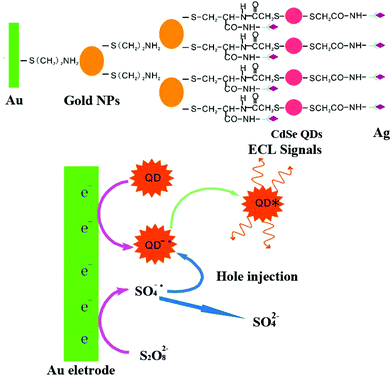 | ||
| Fig. 7 Schematic illustration of fabrication process (A) and ECL mechanisms (B) of the ECL immunosensor. (Reprinted with permission from ref. 49. Copyright 2008 Elsevier.) | ||
2.1.2.4 Signal-off induced by nucleic acid-based cutting strategy. Recently, signal-off strategy based on DNA enzyme (DNAzyme) has become an interesting alternative for sensitive detection of targets. Among various strategies, endonucleases and exonucleases were mainly utilized, and sensors were based on which were developed.50,51 Accordingly, many works have been done on utilizing endonucleases such as restriction endonucleases Nt.AlwI,51 EcoRI,52 T7 exonuclease (T7Exo),53 and so on. For example, as displayed in Fig. 8, our group had constructed a restriction endonucleases (Nt.AlwI)-powered DNA walking machine for sensitive detection of target DNA.54 With the help of Nt.AlwI, the walker (the target DNA) was induced in an autonomous and directional stepwise movement of the walker along the DNA track which was driven by the cleavage of the Ru(bpy)2phen-containing stators, leading to significantly decreased ECL signals for a highly sensitive detection of the walker. In addition, using DNA as the architectural scaffolds, a DNA walker can have great potential for building up a sensitive and specific biosensor.
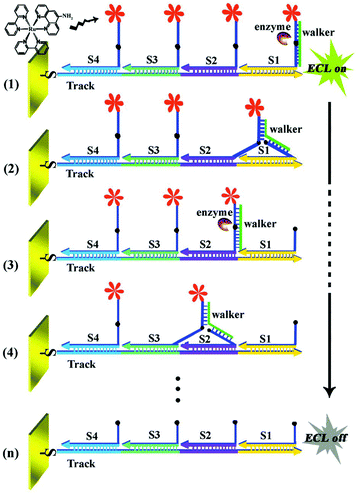 | ||
| Fig. 8 Working principle of the restriction endonucleases-powered DNA walking machine. (Reprinted with permission from ref. 54. Copyright 2015 Royal Society Chemistry.) | ||
Through the endonuclease-stimulated regeneration of the analyte, the aptasensor which focused on improving the sensitivity of target detection is highly desired. Alternatively, on the basis of site-specific cleavage of BamHI endonuclease and enzymatic signal amplification, an electrochemical method to detect the hepatitis C virus was developed. In this case, as show in Fig. 9, Dai's group had designed a novel strategy based on site-specific cleavage of BamHI endonuclease combined with bidentate chelation of the dithiocarbamate DNA (DTC-DNA) probe and the ECL activity of GQDs assembly.55 Using hepatitis C virus-1b genotype complementary DNA (HCV-1b cDNA) as a model, the BamHI endonuclease site-specifically recognized and cleaved the duplex symmetrical sequence 5′-GGATCC-3′, which made the dsDNA fragments and graphene quantum dots (GQDs) break off from the electrode surface, leading to a decline of the ECL intensity.
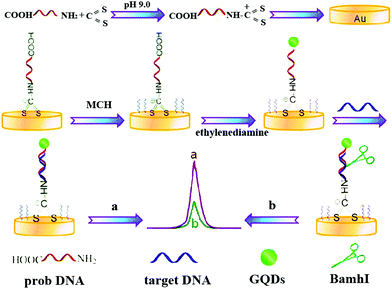 | ||
| Fig. 9 Schematic illustration of the ECL biosensor based on GQDs combined with endonuclease cleavage and bidentate chelation. (Reprinted with permission from ref. 55. Copyright 2015 American Chemical Society.) | ||
On the basis of variations of the ECL intensity before and after digestion of the DNA hybrid, a novel “signal-off” ECL system was developed. With reliance on the instinctive properties proposed above, we anticipate that this sensing strategy can be expanded to explore an extensive range of DNA targets with reasonable design and hold significant potential bioanalysis.
Moreover, due to the high catalysis efficiency and substrate specificity of nucleases, nuclease-based target cycling has been widely used in the field of highly sensitive biological analysis. For example, as depicted in Fig. 10, Chen's group56 reported an ultrasensitive and selective ECL biosensor with the use of G-quadruplex-based DNAzyme as the electrocatalyst for the reduction of H2O2, based on K-doped graphene/CdS:Eu QDs and nicking endonuclease assisted strand-scission cycle, which resulted in an obvious decrease in ECL intensity and thus achieved sensitive DNA detection. Besides, exonuclease cleavage of DNA also plays an important role in medicinal chemistry and biological fields. In addition, enzymatic DNA circuits could achieve high sensitive analysis which have been proposed and drawn particular interest in biosensing.
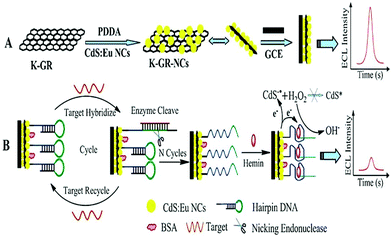 | ||
| Fig. 10 Schematic representation of the proposed ECL-DNA biosensor. (Reprinted with permission from ref. 56. Copyright 2013 Royal Society Chemistry.) | ||
2.1.3.1 Signal-on induced by introduction of luminophores. Usually, to construct a signal-on mode in an ECL biosensor, luminophores are introduced into the sensing interface through a sandwich immunoassay or sandwich-like immunoassay based on the target identification. A Ru complex,60 luminol and its derivatives,61 quantum dots,62 and, as usual ECL regents have been applied in many fields especially ECL immunosensors, nucleic acids biosensors, and aptamer sensors. Usually, a sandwich immunoassay format is the typical method in a signal-on-type ECL biosensor. Briefly, the primary antibody(Ab1) is immobilized on an electrode to capture the target antigen, then the detection antibody(Ab2)-bioconjugates, which are labelled by luminophores, can be introduced into the sensing interface after which an obvious ECL signal is obtained. For example, Sardesai and co-workers reported a sandwich immunoassay for prostate specific antigen (PSA) detection (Fig. 11).63 First, the [Ru-(bpy)3]2+ doped mesoporous silica nanoparticles were synthesized to prepare Ab2 bioconjugates ([Ru-(bpy)3]2+-silica-Ab2). What's more, single-wall carbon nanotubes were used to chemically attach Ab1 through an amide reaction. In the presence of PSA, the [Ru-(bpy)3]2+-silica-Ab2 bioconjugates could be introduced into the sensing interface to produce a strong ECL signal of [Ru-(bpy)3]2+. This immunosensor achieved a detection range from 0.04 to 5 ng mL−1 with a detection limit of 40 pg mL−1.
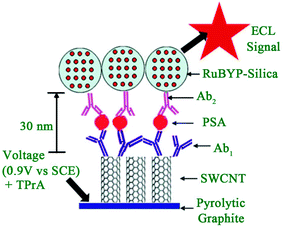 | ||
| Fig. 11 Scheme of representation of ECL-based SWCNT immunosensors after addition of PSA and [Ru-(bpy)3]2+-silica-Ab2 nanoparticles. (Reprinted with permission from ref. 63. Copyright 2009 Royal Chemical Society.) | ||
With the development of DNA biotechnology, intercalating Ru(phen)32+ (phen = phenanthroline) in a double stranded (ds)-DNA has emerged as an efficient method for ECL signal-on detection. Yin's group constructed a fragment of five thymidine bases (T5) immobilized on an electrode to capture the functional oligonucleotide (FO) which had been protected by five adenines at the tail end of Ru(phen)32+ and intercalating it into double stranded DNA (Fig. 12) which acted as a signal probe.64 When Hg2+ was added, the strong stability and specificity of T-Hg2+-T made FO combine with T5 to immobilize on the electrode successfully, achieving the increased ECL signal. This biosensor showed high selectivity, as well as a very low detection limit (20 pM). Since the initial ECL signal was relatively low, the ECL biosensor with signal-on mode could achieved high sensitivity.
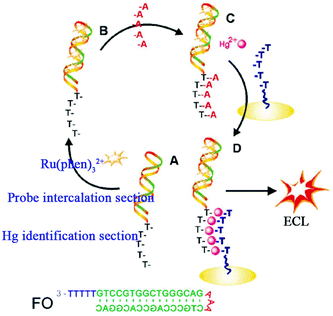 | ||
| Fig. 12 Schematic illustration of the ECL biosensor for detecting Hg2+. (A) The functional oligonucleotide (FO) containing Hg2+ identification and probe intercalation sections; (B) the intercalation of Ru(phen)32+ into FO; (C) the preformed A-T duplex; and (D) formation of T-Hg2+-T, which results in the introduction of the Ru(phen)32+ probe onto the electrode surface for ECL determination of Hg2+. (Reprinted with permission from ref. 64. Copyright 2010 Royal Chemical Society.) | ||
Luminol, as another important ECL luminophore, was added into detection solutions directly in early ECL assays, and it showed good stability and simple operation,65 but the relatively high noise was adverse to improving sensitivity. Recently, Cui's group reduced chloroauric acid by luminol directly to produce luminol-capped gold nanoparticles via physical adsorptions, which provided an easy and reliable approach for preparing a luminol doped signal tag.66 Subsequently, the sandwich ECL immunosensor was born at the right time based on this luminol doped signal tag. Li and co-workers achieved label-free ECL immunosensor for cardiac troponin I detection using luminol functionalized gold nanoparticles as a sensing platform with a detection limit of 0.1 ng mL−1 (Fig. 13).67
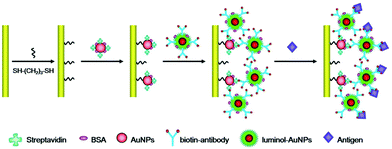 | ||
| Fig. 13 Schematic illustration of the fabrication processes of the label-free ECL immunosensor using luminol-AuNPs as antibody carriers and sensing platform. (Reprinted with permission from ref. 67. Copyright 2013 Royal Chemical Society.) | ||
2.1.3.2 Signal-on regulated by ECL co-reaction. As is well known, due to the weak signal of an individual ECL luminophore, a co-reactant, for example H2O2, TPrA, or C2O42−, was usually introduced to obtain an increased ECL signal.68–74 Therefore, a new signal-on mode was developed based on the regulation from aECL co-reaction. Regulation methods are divided into two kinds: (i) in situ generation of a co-reactant, and (ii) introduction of a co-reaction accelerator. Wang and co-workers proposed a versatile ECL immunosensor based on ceria doped ZnO nanoflowers (Ce:ZONFs) for the detection of amyloid-β protein (Aβ). The luminophore of luminol was immobilized on Ce:ZONFs and H2O2 was generated in situ via a catalytic reaction between glucose and glucose oxidase (GOD) and further catalyzed by Ce:ZONFs to produce ROSs, which promoted the emission of luminol (Fig. 14).75 This proposed ECL immunosensor had exhibited high sensitivity for Aβ detection with a wide linear range from 80 fg mL−1 to 100 ng mL−1 and an ultralow detection limit of 52 fg mL−1 (Table 2).
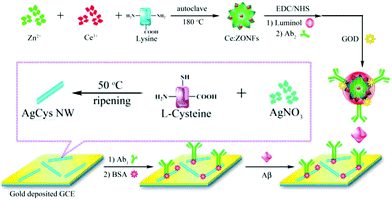 | ||
| Fig. 14 Schematic illustration of synthesis process of Ab2-GOD@Ce:ZONFs-Lum signal probe and preparation process of the AgCys Nanowires. (Reprinted with permission from ref. 75. Copyright 2016 American Chemical Society.) | ||
| Co-reaction accelerator | Luminophore | Co-reactant | Ref. |
|---|---|---|---|
| Semicarbazide | CdTe QDs | S2O82− | 104 |
| Perylene derivatives | CdTe QDs | S2O82− | 105 |
| Hemin | PTCA | S2O82− | 106 |
| Aniline | PTCA | S2O82− | 93 |
| Isoreticular metal organic framework-3 | CdTe QDs | S2O82− | 107 |
| CoFe2O4 MNPs | PTC-NH2 | S2O82− | 108 |
| Ag NPs | SnO2 nanoflowers | S2O82− | 109 |
| Fe3O4–CeO2 | Ag NCs | S2O82− | 110 |
| Ag NPs and Fe–Fe2O3 NPs | PTPE | H2O2 | 111 |
| TiO2 | Ag NCs | Dissolved O2 | 112 |
| Au–Ag–Pt heteronanostructures | Doxorubicin-luminol | Dissolved O2 | 113 |
| Pt nanomaterials | Rubrene | Dissolved O2 | 114 |
To further improve ECL intensity, a co-reaction accelerator has been proposed by our group, which can interact with a co-reactant rather than a luminophore to improve the ECL reaction rate of luminophore and co-reactant. We used semicarbazide as co-reaction accelerator with CdTe QDs-S2O82− to construct an ECL signal-on-type aptasensor for highly sensitive thrombin (TB) detection with a detection limit of 0.03 fM that was much lower than the other QDs-S2O82− ECL system (Fig. 15).76 And the possible ECL mechanism of this strategy has also been investigated. This new strategy provides a new orientation for signal amplification in ECL biosensing.
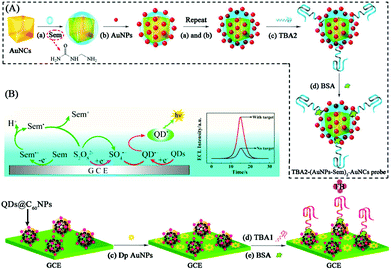 | ||
| Fig. 15 Schematic illustration of ECL aptasensor preparation process and possible luminescence mechanism: (A) fabrication of TBA2-(AuNPs-Sem)n-AuNCs signal probe; (B) fabrication of CdTe QDs@C60 NPs, and (C) possible ECL mechanism of the QD-based ECL system. (Reprinted with permission from ref. 77. Copyright 2015 American Chemical Society.) | ||
2.1.3.3 Signal-on induced by ECL-RET. ECL-RET is one of the high-efficiency means to construct a signal-on mode ECL biosensor. Up to now, abundant ECL-RET systems such as luminol-Ru,18 luminol-QDs,12 and QDs-Ru77 have been put forward and applied in many fields. In an ECL signal-on mode, the donor is always introduced in a detection solution where acceptor had existed before. Ju's group used luminescent conjugated polymer as a carrier to synthesize Ru(bpy)32+-doped polymer dots (RuPdots). What's more, it was demonstrated that the resonance energy transferred from the excited polymer dots to the encapsulated Ru(bpy)32+ led to a 15.7-fold higher ECL emission than that of Ru(bpy)32+ with the same amount at the gold electrode (Fig. 16).78 It achieved a detection limit of 0.8 fM using mutant KRAS gene as a model target.
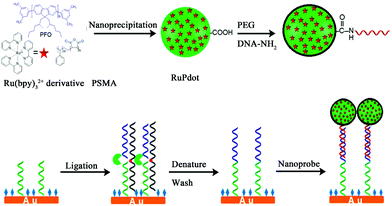 | ||
| Fig. 16 Schematic diagrams of (A) Preparation of RuPdots nanoprobe using PFO, hydrophobic Ru(bpy)32+ derivative, and PSMA; (B) SNP detection with ligase detection reaction and nanoprobe. (Reprinted with permission from ref. 78. Copyright 2017 American Chemical Society.) | ||
2.1.3.4 Signal-on induced by nucleic acid amplified strategy. With the development of nucleic acid technology, some nucleic acids amplified strategies have been developed for biosensor construction with targets of DNAs, microRNAs, and proteins.79,80
Among them, enzyme-free signal amplified strategies such as recycle hybridization chains reaction (HCR), strand displacement reaction (SDR), and catalyzed hairpin assembly (CHA) are utilized in ECL bioassays. Chen and co-workers have obtained sensitive DNA detection by HCR to efficiently intercalate Ru(phen)32+ into grooves of the dsDNA polymers (Fig. 17).81
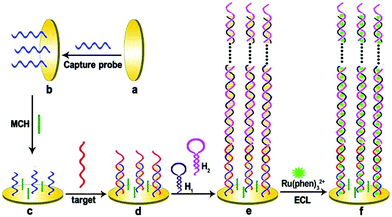 | ||
| Fig. 17 Illustration of the universal and highly sensitive HCR-based strategy for ECL detection of DNA. (Reprinted with permission from ref. 81. Copyright 2012 American Chemical Society.) | ||
Compared with static nucleic acid based amplification strategy, DNA-based nanomachines, which could be transformed with external stimuli leading to cargoes transit and realizing targets detection, attracted much attention of researchers. Most DNA nanomachines performed under one-dimensional (1D) or two-dimensional (2D) tracks, which limited the capture of payloads to a certain degree and went against sensitivity improvement.82 Recently, a few DNA nanomachines that performed on three-dimensional (3D) material have been reported due to the high DNA loading density on 3D material. Jiang and co-workers designed an ultrasensitive ECL signal-on a biosensor through target mucin 1 powered CHA which acted as 3D DNA nanomachine signal probe (Fig. 18).83 The prepared ECL biosensor showed a favorable linear response for mucin 1 detection with a relatively low detection limit of 0.62 fg mL−1.
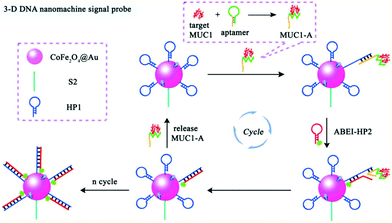 | ||
| Fig. 18 Scheme of (A) Assembly process of 3-D DNA nanomachine signal probe induced by protein-aptamer binding complex; (B) Schematic diagrams of the construction and luminescence Reaction mechanism of the biosensor. (Reprinted with permission from ref. 83. Copyright 2017 American Chemical Society.) | ||
2.2 Multiple signal switching mode
Despite the above advantages, single signal switching mode-based ECL biosensors may induce false negative or positive signals, which limits their application in analysis of real samples. Thus, a new intelligent output signal mode, named the multiple signal switching mode, has achieved extensive attention due to further improvements of selectivity and specificity. Usually, a multiple signal switching mode mainly includes the following four types: (i) signal off-on mode, (ii) signal on–off mode, (iii) signal on–off–on mode and (iv) ratiometric ECL biosensing.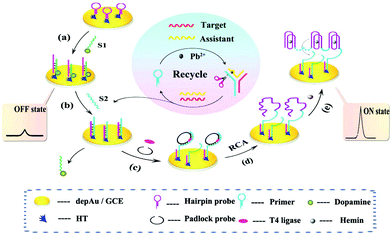 | ||
| Fig. 19 Schematic diagram of the dual amplified assay: (a) modification of S1, (b) displacement of S1 by S2, (c) incubation of T4 ligase and padlock probe, (d) RCA process, and (e) the formation of Hemin/G-quadruplex. (Reprinted with permission from ref. 87. Copyright 2015, American Chemical Society.). | ||
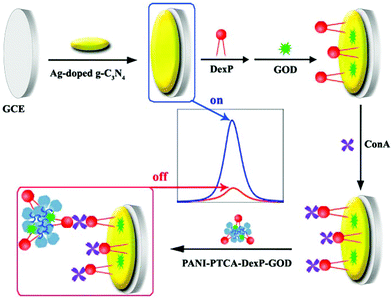 | ||
| Fig. 20 The illustration of the synthetic process of (A) Ag–g-C3N4 and (B) PANI-PTCA-DexP-GOD, and (C) the preparation of the ECL biosensor. (Reprinted with permission from ref. 89. Copyright 2016, Elsevier.) | ||
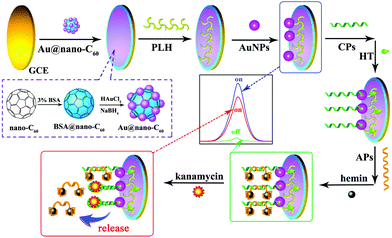 | ||
| Fig. 21 Schematic diagram of the preparation of the ECL aptasensor. (Reprinted with permission from ref. 92. Copyright 2015, Elsevier.) | ||
Ratiometric measurements based on the ECL-RET between two emitters are extensively explored, and an ECL-RET often occurs between a suitably matched donor/acceptor pair. For example, Ju et al. designed a dual-potential ratiometric ECL sensing approach for Mg2+ detection via ECL-RET between CdS QDs and Cy5 molecules.95 As shown in Fig. 22, we reported a ratiometric aptasensor for Pb2+ detection based on the ECL-RET from O2/S2O82− to a kind of amino-terminated perylene derivative (PTC-NH2). The ECL dual peaks at −0.7 V and −2.0 V were obtained when the prepared aptasensor was detected in an air-saturated S2O82− solution, which could be attributed to the emission of excited dimmers (π-excimers) (1(NH2-PTC)2*) and 1(O2)2*, respectively. In the presence of Pb2+, the dsDNA was unwound, and a Pb2+ G-quadruplex structure generated because of the highly specific affinity between Pb2+ and CPs, which made PTC-NH2 release from the electrode surface. As a result, the ECL signal at −0.7 V was decreased, and the ECL signal around −2.0 V was increased. By measuring the ratio of ECL intensities at two excitation potentials, the developed aptasensor exhibited a high selectivity for Pb2+ detection.14 Later, Wei's group fabricated a ratiometric biosensor for trinitrotoluene (TNT) detection, where an effective ECL-RET was achieved from luminol (donor) to CdTe QDs (acceptor).96 In addition, in order to further extend the field of ratiometric ECL-RET system applications, Xu’ group recently reported a dual-wavelength ratiometric approach for miRNA detection, where ECL-RET from a graphite-like carbon nitride nanosheet (g-C3N4 NS) to Ru(bpy)32+ resulted in one emission peak.97
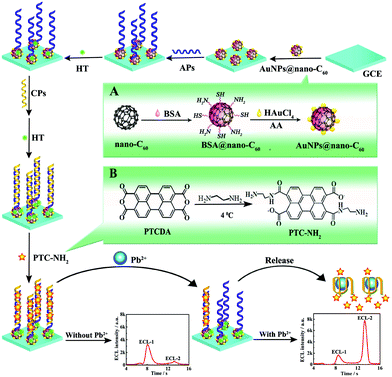 | ||
| Fig. 22 Schematic illustration of the preparation process of the ratiometric aptasensor: inset of (A) and (B) display the preparation procedure of AuNPs@nano-C60 and PTC-NH2. (Reprinted with permission from ref. 14. Copyright 2015, American Chemical Society.) | ||
It should be noted that the occurrence of ECL-RET needs to search for a suitable donor–acceptor pair, which greatly limits practical applications of ratiometric assays. Therefore, metal nanomaterials have been extensively employed to enhance or quench ECL intensity via RET, a surface plasmon resonance or catalysis effect in two different emitters systems, and thus construct a series of dual-potential ratiometric ECL biosensors such as Pt NPs,98 Au NPs,99,100 gold nanorods (AuNRs),101 Ag NPs,102 and Cu2O nanocrystals.103 As shown in Fig. 23, Zhao et al. developed an Au NPs mediated dual-potential ECL ratiometric approach for highly sensitive protein kinase activity and inhibition assay based on the simultaneous decrease of cathodic ECL from graphene quantum dots (GQDs) and enhancement of anodic ECL from luminol.115 Later, Huang et al. proposed a novel co-reactant-dependent ratiometric ECL method with luminol and CdS QDs as ECL emitters on the basis of the high catalytic ability of Pd NCs towards hydrogen peroxide as a co-reactant.116
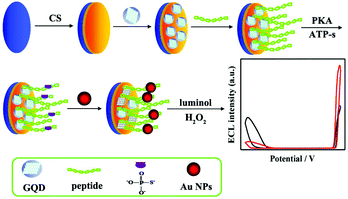 | ||
| Fig. 23 (A) Illustration of the ECL ratiometric approach for monitoring PKA activity and inhibitor screening. (Reprinted with permission from ref. 116. Copyright 2016, Royal Chemical Society.) | ||
Enzymes and metal ions are also employed to enhance or quench ECL intensity and construct double-potential ratiometric ECL without the ECL-RET. As shown in Fig. 24, we explored a double-potential ratiometric approach for organophosphorus pesticides (OPs) analysis, where the reduced graphene oxide-CdTe QDs and carboxyl conjugated polymer dots (PFO dots) were chosen as cathodic and anodic ECL emitters, and dissolved O2 and the product (H2O2) from enzymatic reactions served as their co-reactants, respectively.117 Meanwhile, Jiang et al. reported a novel ratiometric ECL strategy combination of dual-potential ECL signals from Au–g-C3N4 nanocomposites and luminol dependent on in situ generation and conversion of co-reactants initiated by catalytic reactions of glucose oxidase (GOx) for glucose detection.118 In addition, Liu's group reported that the double-potential ECL signals could be actuated by different ECL reactions merely from graphite-phase polymeric carbon nitride (GPPCN) nanosheets at anodic and cathodic potentials, respectively, where the different metal ions exhibited distinct quenching/enhancement of the ECL signal at different driven potentials.119 Later, Yao's group developed a single luminophore dual-potential ratiometric ECL system for Co2+ detection, where the Co2+ could evidently amplify the anodic intensity and quench the cathodic ECL intensity.120
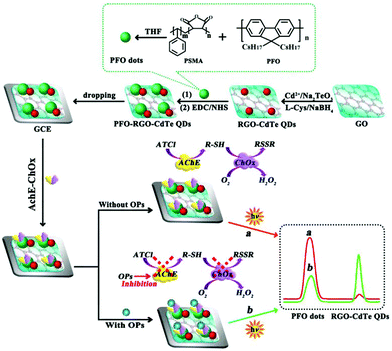 | ||
| Fig. 24 Double-potential ratiometric ECL for organophosphorus pesticides (OPs) analysis. (Reprinted with permission from ref. 117. Copyright 2017, American Chemical Society.) | ||
The dual-responses of an electrochemical and ECL ratiometric approach was reported at different potentials, which could alleviate cross-talking response. As shown in Fig. 25, Wu's group also developed dual-responses of an electrochemical and ECL ratiometric aptasensor for aflatoxin B1 (AFB1) detection. The electrochemical method was first used as a model to verify the specific interaction between AFB1 and the aptamer, in which Fc-anchored and methylene blue (MB)-anchored DNA sequences acted as dual signal producers. Consequently, the specific interaction between AFB1 and its aptamer was demonstrated by the “signal-on” mode of Fc and the “signal-off” mode of MB. Due to the dual-signal mode, the electrochemical sensor was further extended to the construction of an ECL aptasensor. In the ECL system, dual ECL signals were produced from CdTe/CdS/ZnS quantum dots (QDs) and luminol. Horseradish peroxidase-modified gold nanorods (HRP/Au NRs) acted as the quencher/enhancer and as such quenched the ECL signal of the QDs by ECL energy transfer and simultaneously catalyzed H2O2 to enhance the ECL of luminol. Owing to the self-calibration from the internal reference, both of the ratiometric aptasensors exhibited accurate and sensitive analytical performance for AFB1 detection.121 Jiang et al. also reported a ratiometric biosensor on a screen-printed carbon electrode (SPCE) for multiplexed detection of miRNAs based on the ratio of ECL intensity to cyclic voltammetry (CV) current.122
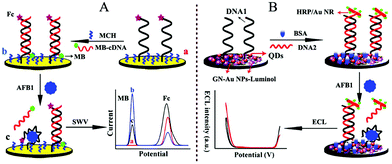 | ||
| Fig. 25 Schematic illustration of the dual-signaling sensor for AFB1 assay with (A) electrochemistry and (B) electrochemiluminescence. (Reprinted with permission from ref. 121. Copyright 2017, American Chemical Society.) | ||
The above-mentioned ratiometric ECL measurements adopt one working electrode modified by two emitters, which remains a challenge to choose the emitters and balance their ECL excitation potentials, intensities, wavelengths and co-reactants. In addition, the applied optical filters for these approaches could decrease the ECL intensity. Remarkably, a spatial-resolved ratiometric ECL approach based on a bipolar electrode for bioanalysis is simpler and more sensitive since the two ECL reactions can be spatially separated and no optical filters are required for data acquisition. As shown in Fig. 26, Feng et al. fabricated a ratiometric ECL aptasensor array on one homemade screen-printed carbon electrode (SPCE) substance consisting of two spatially resolved working electrodes to detect antibiotic chloramphenicol (CAP) based on the ratio of the working signal to the internal reference signal.123 Chen's group also developed a closed bipolar electrode (BPE)-ECL device for ratiometric detection of prostate specific antigen (PSA).124
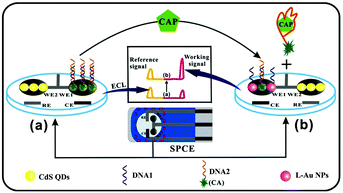 | ||
| Fig. 26 Schematic illustration of the ratiometric ECL array for CAP quantification. (Reprinted with permission from ref. 89. Copyright 2015, Elsevier.) | ||
2.3 ECL imaging mode
Although ECL analysis utilizes a photomultiplier tube (PMT) to achieve high sensitivity and a low detection limit, this method is not applicable to a complicated detecting system and also lacks ability for high-throughput analysis.125,126 Recently, ECL imaging has emerged as a novel technique in the ECL field; it uses a charge coupled device (CCD), or even naked eyes, instead of a PMT to image the ECL phenomenon and achieves simultaneous visual detection without the use of complicated detection systems and time-consuming data processing.127 In addition, ECL imaging offers remarkable superiorities over the widely used fluorescence and chemiluminescence imaging techniques in terms of minimized interruption of background light and improved spatial resolution, respectively.128 Therefore, the ECL imaging technique has been extensively investigated and applied in various areas, including microfluidic systems with bipolar electrodes (BPE),129,130 latent fingerprints (LFPs) visualization,131,132 immunoassay microarray,133 and metabolic toxicity screening.134,135Generally speaking, the previous work on ECL imaging is carried out for high-throughput analysis based on ECL arrays in microfluidic system. A bipolar electrode (BPE) combined with an ECL imaging technique is usually established in microfluidic chips, which can be used as an imaging tool to investigate biological recognition events. BPE-ECL imaging can be performed in two separated solutions (closed BPE) or one solution (open BPE). Wu et al. fabricated an ECL imaging platform for simultaneous detection of cancer biomarkers based on a closed BPE array. Multiple cancer biomarkers can be accurately quantified using an antibody/aptamer-based assay and doping thionine in silica nanoparticles coupled nanobioprobes activated ECL reaction on specific BPEs.129 As shown in Fig. 27, Zhang et al. developed a visual ECL sensing platform based on a dual-bipolar electrode (D-BPE) array chip. The chip was composed of two arrays of BPEs and three separated arrays of reservoirs filled with buffer, Ru(bpy)32+-TPrA, and luminol solutions, respectively. Both BPEs served as ECL reporting platforms. By applying 6.0 V voltage, an array of orange ECL signals belonging to Ru(bpy)32+ turned on. After adding DNAzyme and H2O2 in Ru(bpy)32+ and luminol reservoirs, the orange Ru(bpy)32+ signals decreased until they vanished due to the quenching effect. Meanwhile, a new array of blue ECL signals turned on because of the luminol-H2O2 ECL reaction. The designed D-BPE had superior properties compared with the three-electrode system and benefitted from the quantitative relation of the bipolar systems, which greatly enhanced the ECL detection sensitivity. Meanwhile, the visual color-switch ECL and the ratiometric detecting principle made the results easier to evaluate and more accurate. These designed and fabricated D-BPE ITO chips give different colors of ECL signals for human promyelocytic leukemia (HL-60) cancer cells detection.136 In addition, open BPE-ECL imaging has also been studied. Liu et al. developed a paper-based open BPE-ECL imaging sensing for visual detection.137 Later, Liu and co-workers also reported a battery-triggered open wireless ECL sensing strategy based on microfluidic cloth-based bipolar devices for measurements of H2O2 in milk and glucose in clinical urine and serum samples.138
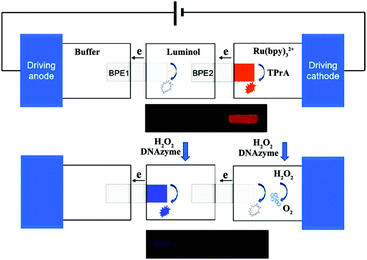 | ||
| Fig. 27 (A) Structure of double-bipolar electrodes (D-BPE), operation procedures of BPE-ECL sensing platform and ECL image of D-BPE. (Reprinted with permission from ref. 136. Copyright 2014, American Chemical Society.) | ||
Fingerprints are rarely seen (termed latent fingerprints, LFPs), but this methodology has been established as one effective trace that can be used as important evidence for an individual's identification.139,140 The ECL imaging technique can be used as an effective means to enhance the visualization of LFPs. As shown in Fig. 28, Xu and co-workers presented the combination of ECL imaging with enzyme immunoassay for the highly sensitive detection of protein/polypeptide residues in latent fingerprints. The single-HRP route was established to exemplify the fingerprint visualization approach using human immunoglobulin G (hIgG) as a test protein. Then, a multiple-HRP route further improved it and was applied for highly sensitive detection of the trace residues, i.e., epidermal growth factor, lysozymes, and dermcidins that are excreted by human eccrine glands.141 Su's group also exploited two operating methods for visualizing LFPs on the basis of spatially selective control of ECL generation at the electrode surface.142 Later, Tan et al. established an image-contrast technology based on the intrinsic mechanism of the ECL dynamic process for visualizing LFPs and in situ detection of TNT in fingerprints.143
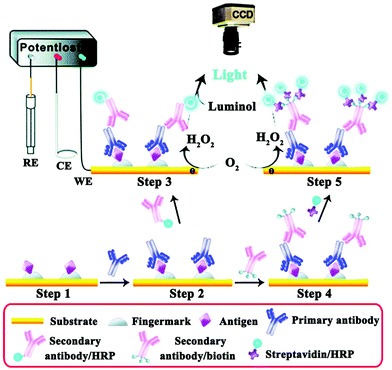 | ||
| Fig. 28 Illustration of the detection of antigenic residues present in a fingerprint using enzyme immunoassay and ECL imaging. (Reprinted with permission from ref. 141. Copyright 2014, Royal Society Chemistry.) | ||
The ECL imaging technique also has been widely used in clinical diagnostic immunoassays, which show some obvious advantages, such as rapid analysis, multi-component detection, and visualization. As shown in Fig. 29, Deiss et al. fabricated a class of sensing microarray that utilized ECL as a readout mechanism to detect multiple antigens simultaneously. The approach involved attaching specific receptors to microbeads and lead to localization of all the ECL reagents on the microbeads where the analyte had bound.144 Xu and co-workers fabricated an ECL immunosensor array featuring capture-antibody-decorated single-wall carbon nanotube forests residing in the bottoms of 10 μL wells with hydrophobic polymer walls. Silica nanoparticles containing Ru(bpy)32+ and secondary antibodies were employed in this system for highly sensitive two-analyte detection.145 Later, Sentic et al. reported that ECL imaging resolved at the single bead level provided a general description of the ECL phenomena operating in a bead-based ECL immunoassay, which allowed the deciphering of the mechanistic route, testing of co-reactant efficiency, and visualisation of the associated optical focusing effects.146
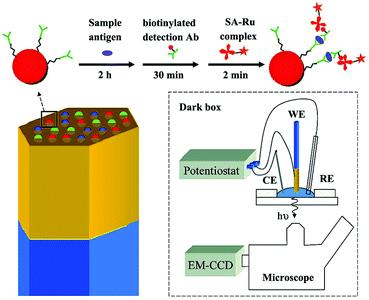 | ||
| Fig. 29 (Top) A sandwich immunoassay is performed by exposing antibody-functionalized microbeads to three solutions. The beads are housed in microwells created from an etched gold-coated fiber-optic bundle. The gold coated fiber bundle acts as the working electrode (WE) for ECL. CE and RE refer to counter electrode and reference electrode. (Reprinted with permission from ref. 144. Copyright 2009, American Chemical Society.) | ||
Toxicity assessment is a major problem in drug and environmental chemical development. Toxicity screening was also achieved by using ECL arrays in recent years. As shown in Fig. 30, Hvastkovs et al. presented and validated an ECL array format suitable for genotoxicity screening of compounds metabolized by cytochrome P450 (cyt P450, or CYP) and other enzymes, and which also can assign relative genotoxic activity to specific enzymes. Array spots containing DNA, various human cyt P450s, and ECL generating metallopolymer [Ru(bpy)2PVP10]2+ were exposed to H2O2 to activate the enzymes. ECL from all spots was visualized simultaneously using a CCD camera. Using benzo[a]pyrene as a test substrate, enzyme activity for producing DNA damage in the arrays was found in the order CYP 1B1 > CYP 1A2 > CYP 1A1 > CYP 2E1 > myoglobin, which is the same as the order of their metabolic activity. Thus, these arrays estimated the relative propensity of different enzymes to produce genotoxic metabolites.134 Pan et al. presented a metabolically representative ECL array by testing 11 chemicals of varying toxicity and exploring correlations with rodent toxic dose (TD50) and lethal dose (LD50), Ames tests, and Comet assays.147 Later, Wasalathanthri et al. described a comprehensive approach to evaluate chemical genotoxicity pathways from metabolites formed in situ by a broad spectrum of liver, lung, kidney and intestinal enzymes.148
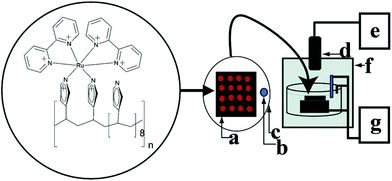 | ||
| Fig. 30 Conceptual diagram of the ECL array instrumentation. RuPVP polymer, DNA, and enzymes are located at each spot on a (a) pyrolytic graphite block; with (b) Ag/AgCl reference electrode, (c) Pt wire counter electrode, (d) CCD camera, (e) computer, (f) gel-doc dark room, and (g) potentiostat for applied voltage control. (Reprinted with permission from ref. 147. Copyright 2007, American Chemical Society.) | ||
Overall, ECL imaging is quite applicable to a complicated detecting system for high-throughput analysis and exhibits many advantages such as low background signal, simple instrumentation required, high sensitivity, low background signal, and high controllability. However, there still exist many unresolved problems and challenges. For example, the most prominent thing is that the sensitivity of imaging was not efficient enough because many ECL systems with a relatively low intensity could not achieve an image with high resolution. Therefore, future studies should be performed toward improving ECL efficiency of luminophores and constructing advanced imaging devices suitable for both electrochemical stimulation and light harvesting.
3. Combination of various signal output modes for multi-target detection on a single interface
In a clinical diagnosis, the detection of single target is not sensitive and specific enough to meet strict diagnostic criteria,144,149–151 since pathogenesis is an intricate process and most diseases have multiple markers associated with their incidence. Therefore, multi-target detection is becoming increasingly significant for early cancer screening and diagnosis. Based on the unique properties of ECL, such as the high sensitivity, wide detection range, and short time consumption. ECL technology has shown great potential for multi-target detection. However, it is necessary to consider the inevitable cross reactions between different ECL luminophores in the same ECL system, which directly interferes with the accurate detection of different targets.Recently, substantial works have been devoted to multiple target determinations based on a potential-resolved ECL sensing platform with multiple ECL luminophores.144,152 Han et al. constructed a potential resolved multiplex ECL sensing platform for the quantification of AFP and CEA antigen at cells using Ru(bpy)32+ and luminol as ECL probes.153 In this work, a self-quenching of luminescence was initialized by the introduction of concentrated aqueous luminol to obtain accurate measurements of two potential-resolved ECL signals from Ru(bpy)32+ and luminol. Furthermore, Yang's group designed a mutiplex cytosensor based on a dual ECL signal system for simultaneous and in situ evaluation of the expression levels of mannose and epidermal growth factor receptor (EGFR) on MCF-7 cell surfaces.154 As shown in Fig. 31, a more facile device based on an ITO electrode with two spatially resolved areas spaced 3 mm apart was designed to exclude the interference between Au@luminol and CdS QDs covalently linked with concanavalin A (ConA) and epidermal growth factor (EGF), respectively. Furthermore, this multiplex biosensor was applied for simultaneous quantitative evaluation of the expression levels of mannose and EGFR on MCF-7 cells, which is expected to develop a better diagnostic tool for diseases.
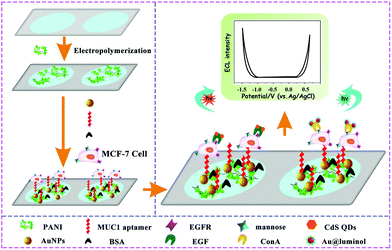 | ||
| Fig. 31 Preparation and Schematic Illustration of the Dual Electrochemiluminescence Signal System. (Reprinted with permission from ref. 154. Copyright 2017 American Chemical Society.) | ||
However, the above mentioned traditional strategies for multiple ECL detection employed different ECL probes, where cross-reactivity between ECL probes in multiplex detection existed. Recently, Yuan's group adopted multiple signal output modes to realize different biomarkers detection with a single luminophore.155 Therein, multiple sensitive detection of the miRNA biomarkers was performed by the introduction of dual miRNAs-fueled DNA nanogears into an enzyme-free ECL biosensor. In this work, the ECL “signal-on” or “signal-off” depended on the movement of the DNA nanogears driven by different target miRNAs, which changed the distance of QDs and AuNPs to obtain different ECL signals (Fig. 32). Similarly, Peng et al. designed a DNA walker induced by dual miRNAs of miRNA-21 and miRNA-155 to construct an ECL biosensor by using CdS:Mn NCs as the ECL emitters.156 Interestingly, the DNA walker could migrate along the track and then return to the original position, which made the proposed biosensor regenerated.
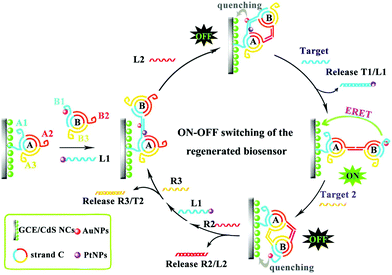 | ||
| Fig. 32 Operating principle of the dual miRNAs-fueled nanogear-based regenerated biosensor which realized the multiple ECL detection of miRNAs with a single luminophore. (Reprinted with permission from ref. 155. Copyright 2017 American Chemical Society.) | ||
Over the years, numerous studies indicate that the detection of different kinds of biomarkers could reflect more comprehensive information and play decisive roles in clinical diagnosis. Nie et al. reported a “on–off–on” switching platform to construct an ultrasensitive ECL biosensor for the detection of miRNA-141 and matrix metalloproteinase-2 (MMP-2).157 As shown in Fig. 33, based on a TdT-mediated extension and target induced cleavage of peptide, the ECL biosensor could successfully realize the sensitive detection of miRNA-141 and MMP-2 by varying ECL intensity of the different modification processes.
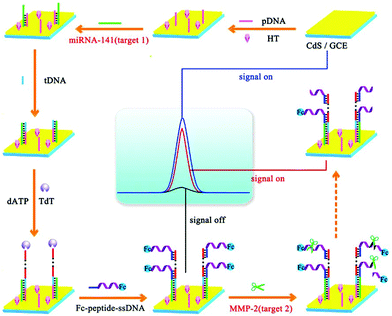 | ||
| Fig. 33 Fabrication of an ECL biosensing platform for the detection of multiple types of biomarkers on a single interface. (Reprinted with permission from ref. 157. Copyright 2017 American Chemical Society.) | ||
Although the above works achieved the dual component detection stepwise, it is an urgent challenge to develop a feasible strategy for simultaneous detection of multiple biomarkers on a single interface. Recently, Yuan's group proposed a simultaneous ECL assay to realize multiple detection of biomarker proteins on a single interface by a multivariate linear algebraic equation.158 Based on the hybridization chain reaction (HCR) and rolling circle amplification (RCA) strategy, the proposed simultaneous ECL assay achieved a sensitive detection of the N-terminal of the prohormone brain natriuretic peptide (BNPT) and cardiac troponin I (cTnI) with satisfactory accuracy, which provided a new avenue for early disease diagnosis (Fig. 34).
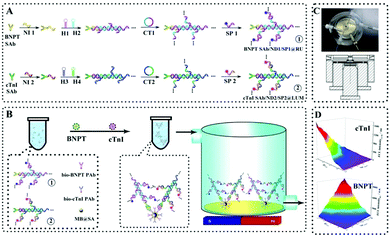 | ||
| Fig. 34 Schematic diagrams of a simultaneous ECL assay: (A) preparation of the nucleotide dendrimer labeled secondary antibodies; (B) schematic diagrams of the simultaneous ECL assay system; (C) image and mechanical design drawing of self-designed magnetic flow system; (D) cathodic ECL responses of the as proposed ECL assay for multiple detection of BNPT and cTnI. (Abbreviations, bio-PAb, biotinylated primary antibody; CT1–2, circular template for RCA reaction; H1–4, hairpin nucleotide for HCR reaction; NI1–2, nucleotide initiator; SP1–2, signal probe). (Reprinted with permission from ref. 158. Copyright 2016 American Chemical Society.) | ||
By converting different proteins to partially coincident sequences, Liang et al. proposed a competitive method based ECL assay with a single ECL indicator for the first time to efficiently estimate the concentration ratio of two proteins, which overcame the limitations of simultaneous ECL via multiple ECL indicators with inevitable cross reactions.159 As shown in Fig. 35, by converting P-gp and GAPDH to partially coincident nucleotide sequences, the concentration ratio between these different proteins was obtained to relate ECL signals via a sandwich type immunoassay on magnetic beads based on competitive nucleotide hybridization on an electrode surface. In order to amplify the responses, rolling circle amplification (RCA) was employed to produce repeated nucleotide sequences, which was enzymatically cut into different partially coincident nucleotide sequences to competitively react with the captured nucleotide sequences modified on the electrode surface. Especially, one of these partially coincident nucleotide sequences could capture the signal probes. Thus, ECL signals could be employed to demonstrate the competitive reactions and the concentration ratios of these nucleotide sequences which related to the target proteins.
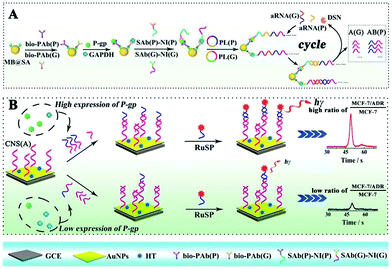 | ||
| Fig. 35 Schematic diagrams of the competitive method-based ECL assay to demonstrate the concentration ratio of P-gp and GAPDH as a model. (A) Schematic diagrams of the sandwich type immunoassay on magnetic beads to convert the different proteins to partially coincident nucleotide sequences; (B) schematic diagrams of the competitive reaction on the sensor's surface to obtain the concentration ratio related ECL signals. (Reprinted with permission from ref. 159. Copyright 2016 The Royal Society of Chemistry.) | ||
Recently, self-powered sensors160 for detection without external power sources has received increasing attention, owing to the excellent capability of a simple operation, miniaturization, and low-cost. Since Whitesides and co-workers161 developed the paper-based analytical devices (μ-PADs), the rapid detection in clinical cancer screening and early diagnostic applications for remote regions and developing countries has moved a step closer to a simple, portable, disposable, and low-cost diagnosis. As a powerful analytical technique, ECL with excellent controllability, high sensitivity, and low-cost instruments has been widely applied in μ-PADs.162–164 As shown in Fig. 36, Wang's group165 developed a self-powered 3D origami microfluidic ECL biosensing device (μ-s-OECLD) for the very first time, which integrated with a noble metal-free and environmentally-friendly primary battery to measure the concentration of glucose from 0.1 mM to 3 mM (R = 0.9954) with a detection limit of 0.1 mM. Therefore, this simple, low-cost and disposable μ-s-OECLD exhibited great application potential for the detection of glucose in clinical diagnostics.
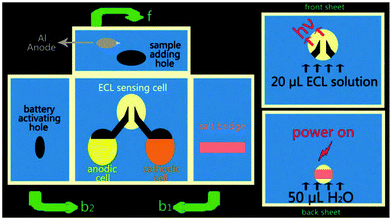 | ||
| Fig. 36 Schematic diagram of the working principle of a m-s-OECLD. f: Front sheet; b1: the sheet folded to the back first; b2: the back sheet. (Reprinted with permission from ref. 165. Copyright 2013 The Royal Society of Chemistry.) | ||
4. Conclusions and outlooks
Rapid improvements of ECL in both theoretical and practical areas have strongly proved that ECL is a significant method for the ultrasensitive determination of biomolecules. In this review, we have the retrospect of principles and advantages of applications of ECL based on different switching modes. Besides, we have focused the imaging studies in the ECL field. With the rapid developing of ECL analysis, the inherent virtues of ECL opens a new chapter in bioanalysis and other applications. We envision that the long-term needs in sensing, clinical diagnosis, biomedicine, food and environmental monitoring will continuously push the development of ECL analytical technology forwards.Conflicts of interest
There are no conflicts to declare.Acknowledgements
This work was financially supported by the NNSF of China (21775124, 21675129, 21675130 and 21575116) and Fundamental Research Funds for the Central Universities (XDJK2018AA003).Notes and references
- S. Y. Deng, J. P. Lei, Y. Liu, Y. Huang and H. X. Ju, Chem. Commun., 2013, 49, 2106–2108 RSC.
- X. J. Li, Z. K. Guo, J. X. Li, Y. Zhang, H. M. Ma, X. H. Pang, B. Du and Q. Wei, Anal. Chem., 2015, 854, 40–46 Search PubMed.
- L. L. Liu, Q. Ma, Y. Li, Z. P. Liu and X. G. Su, Biosens. Bioelectron., 2015, 63, 519–524 CrossRef PubMed.
- P. Zhao, L. F. Zhou, Z. Nie, X. H. Xu, W. Li, Y. Huang, K. Y. He and S. Z. Yao, Anal. Chem., 2013, 85, 6279–6286 CrossRef PubMed.
- X. Y. Wang, P. Dong, W. Yun, Y. Xu, P. G. He and Y. Z. Fang, Biosens. Bioelectron., 2009, 24, 3288–3292 CrossRef PubMed.
- W. Cao, J. Ferrance, J. Demas and J. P. Landers, J. Am. Chem. Soc., 2006, 128, 7572–7578 CrossRef PubMed.
- A. E. Radi, J. L. A. Sánchez, E. Baldrich and C. K. Sullivan, J. Am. Chem. Soc., 2006, 128, 117–124 CrossRef PubMed.
- J. Wang, Y. Shan, W. W. Zhao, J. J. Xu and H. Y. Chen, Anal. Chem., 2011, 83, 4004–4011 CrossRef PubMed.
- M. Zhao, N. Liao, Y. Zhuo, Y. Q. Chai, J. P. Wang and R. Yuan, Anal. Chem., 2015, 87, 7602–7609 CrossRef PubMed.
- P. Wu, X. D. Hou, J. J. Xu and H. Y. Chen, Chem. Rev., 2014, 114, 11027–11059 CrossRef PubMed.
- M. S. Wu, H. W. Shi, J. J. Xu and H. Y. Chen, Chem. Commun., 2011, 47, 7752–7754 RSC.
- Y. P. Dong, T. T. Gao, Y. Zhou and J. J. Zhu, Anal. Chem., 2014, 86, 11373–11379 CrossRef PubMed.
- M. S. Wu, L. J. He, J. J. Xu and H. Y. Chen, Anal. Chem., 2014, 86, 4559–4565 CrossRef PubMed.
- Y. M. Lei, W. X. Huang, M. Zhao, Y. Q. Chai, R. Yuan and Y. Zhuo, Anal. Chem., 2015, 87, 7787–7794 CrossRef PubMed.
- Y. P. Dong, Y. Zhou, J. Wang and J. J. Zhu, Anal. Chem., 2016, 88, 5469–5475 CrossRef PubMed.
- Y. P. Dong, Y. Zhou, J. Wang and J. J. Zhu, Sens. Actuators, B, 2016, 226, 444–449 CrossRef.
- J. Liu, M. Cui, H. Zhou and S. Zhang, Sci. Rep., 2016, 6, 30577 CrossRef PubMed.
- J. L. Liu, M. Zhao, Y. Zhuo, Y. Q. Chai and R. Yuan, Chem. – Eur. J., 2017, 23, 1853–1859 CrossRef PubMed.
- M. S. Wu, H. W. Shi, J. J. Xu and H. Y. Chen, Chem. Commun., 2011, 47, 7752–7754 RSC.
- Q. M. Feng, Y. Z. Shen, M. X. Li, Z. L. Zhang, W. Zhao, J. J. Xu and H. Y. Chen, Anal. Chem., 2015, 88, 937–944 CrossRef PubMed.
- M. S. Wu, H. W. Shi, L. J. He, J. J. Xu and H. Y. Chen, Anal. Chem., 2012, 84, 4207–4213 CrossRef PubMed.
- Y. Cheng, Y. Huang, J. Lei, L. Zhang and H. Ju, Anal. Chem., 2014, 86, 5158–5163 CrossRef PubMed.
- Z. Li, Z. Lin, X. Wu, H. Chen, Y. Chai and R. Yuan, Anal. Chem., 2017, 89, 6029–6035 CrossRef PubMed.
- Y. Y. Zhang, Q. M. Feng, J. J. Xu and H. Y. Chen, ACS Appl. Mater. Interfaces, 2015, 7, 26307–26314 Search PubMed.
- J. Wang, Y. Shan, W. Zhao, J. Xu and H. Chen, Anal. Chem., 2011, 83, 4004–4011 CrossRef PubMed.
- M. M. Chen, Y. Wang, S. B. Cheng, W. Wen, X. Zhang, S. Wang and W. H. Huang, Anal. Chem., 2018, 90, 5075–5081 CrossRef PubMed.
- X. Fu, X. Tan, R. Yuan and S. Chen, Biosens. Bioelectron., 2017, 90, 61–68 CrossRef PubMed.
- H. Zhou, Y. Y. Zhang, J. Liu, J. J. Xu and H. Y. Chen, J. Phys. Chem., 2012, 116, 17773–17780 Search PubMed.
- L. Deng, Y. Du, J. J. Xu and H. Y. Chen, Biosens. Bioelectron., 2014, 59, 58–63 CrossRef PubMed.
- Y. Yu, C. Lu and M. Zhang, Anal. Chem., 2015, 87, 8026–8032 CrossRef PubMed.
- J. Liu, X. He, K. Wang, D. He, Y. Wang, Y. Mao, H. Shi and L. Wen, Biosens. Bioelectron., 2015, 70, 54–60 CrossRef PubMed.
- T. Hu, X. Liu, S. Liu, Z. Wang and Z. Tang, Anal. Chem., 2014, 86, 3939–3946 CrossRef PubMed.
- Y. P. Dong, Y. Zhou, J. Wang and J. J. Zhu, Anal. Chem., 2016, 88, 5469–5475 CrossRef PubMed.
- M. S. Wu, L. J. He, J. J. Xu and H. Y. Chen, Anal. Chem., 2014, 86, 4559–4565 CrossRef PubMed.
- H. Ma, X. Li, T. Yan, Y. Li, H. Liu, Y. Zhang, D. Wu, B. Du and Q. Wei, ACS Appl. Mater. Interfaces, 2016, 8, 10121–10127 Search PubMed.
- J. Wang, X. Jiang and H. Han, Biosens. Bioelectron., 2016, 82, 26–31 CrossRef PubMed.
- Y. P. Dong, J. Wang, Y. Peng and J. J. Zhu, Biosens. Bioelectron., 2017, 89, 1053–1058 CrossRef PubMed.
- W. Zhu, M. S. Khan, W. Cao, X. Sun, H. Ma, Y. Zhang and Q. Wei, Biosens. Bioelectron., 2018, 99, 346–352 CrossRef PubMed.
- J. L. Liu, M. Zhao, Y. Zhuo, Y. Q. Chai and R. Yuan, Chem. – Eur. J., 2017, 23, 1853–1859 CrossRef PubMed.
- Y. P. Dong, T. T. Gao, Y. Zhou and J. J. Zhu, Anal. Chem., 2014, 86(22), 11373–11379 CrossRef PubMed.
- Y. Feng, C. Dai, J. Lei, H. Ju and Y. Cheng, Anal. Chem., 2015, 88, 845–850 CrossRef PubMed.
- X. Li, X. Zhang, H. Ma, D. Wu, Y. Zhang, B. Du and Q. Wei, Biosens. Bioelectron., 2014, 55, 330–336 CrossRef PubMed.
- H. Dai, G. Xu, S. Zhang, L. Gong, X. Li, C. Yang, Y. Lin, J. Chen and G. Chen, Biosens. Bioelectron., 2014, 61, 575–578 CrossRef PubMed.
- D. Liu, L. Wang, S. Ma, Z. Jiang, B. Yang, X. Han and S. Liu, Nanoscale, 2015, 7, 3627–3633 RSC.
- S. Y. Deng, J. P. Lei, Y. Huang, X. N. Yao, L. Ding and H. X. Ju, Chem. Commun., 2012, 48, 9159–9161 RSC.
- W. Gu, X. Deng, X. Gu, X. Jia, B. Lou, X. Zhang, J. Li and E. Wang, Anal. Chem., 2015, 87, 1876–1881 CrossRef PubMed.
- Y. H. Sha, Z. Y. Guo, B. B. Chen, S. Wang, G. P. Ge, B. Qiu and X. H. Jiang, Biosens. Bioelectron., 2015, 66, 468–473 CrossRef PubMed.
- S. Zhu, X. Lin, P. Y. Ran, Q. Xia, C. C. Yang, J. Ma and Y. Z. Fu, Biosens. Bioelectron., 2017, 91, 436–440 CrossRef PubMed.
- G. F. Jie, H. P. Huang, X. L. Sun and J. J. Zhu, Biosens. Bioelectron., 2008, 23, 1896–1899 CrossRef PubMed.
- H. Zhou, J. Liu, J. J. Xu, S. S. Zhang and H. Y. Chen, Chem. Soc. Rev., 2018, 47, 1996–2019 RSC.
- J. Ma, Y. H. Chen, Z. Hou, W. Jiang and L. Wang, Biosens. Bioelectron., 2013, 43, 84–87 CrossRef PubMed.
- Y. J. Li, Y. Q. Li, Y. Y. Wu, F. S. Lu, Y. W. Chen and W. H. Gao, Biosens. Bioelectron., 2017, 87, 585–591 CrossRef PubMed.
- L. Ge, W. X. Wang, X. M. Sun, T. Hou and F. L, Anal. Chem., 2016, 88, 2212–2219 CrossRef PubMed.
- Y. Chen, Y. Xiang, R. Yuan and Y. Q. Chai, Nanoscale, 2015, 7, 981–986 RSC.
- J. Lou, S. S. Liu, W. W. Tu and Z. H. Dai, Anal. Chem., 2015, 87, 1145–1151 CrossRef PubMed.
- H. Zhou, Y. Y. Zhang, J. Liu, J. J. Xu and H. Y. Chen, Chem. Commun., 2013, 49, 2246–2248 RSC.
- L. L. Ren, H. Dong, T. T. Han, Y. Chen and S. N. Ding, Analyst, 2017, 142, 3934–3941 RSC.
- G. F. Jie, Y. Q. Qin, Q. M. Meng and J. L. Wang, Analyst, 2015, 140, 79–82 RSC.
- G. H. Zhao, X. J. Li, Y. B. Zhao, Y. Y. Li, W. Cao and Q. Wei, Analyst, 2017, 142, 3272–3277 RSC.
- S. Carrara, F. Arcudi, M. Prato and L. D. Cola, Angew. Chem., Int. Ed., 2017, 56, 4757–4761 CrossRef PubMed.
- H. Cui, Y. Xu and Z. F. Zhang, Anal. Chem., 2004, 76, 4002–4010 CrossRef PubMed.
- Y. C. Yu, J. J. Shi, X. C. Zhao, Z. Q. Yuan, C. Lu and J. Lu, Analyst, 2016, 141, 3305–3312 RSC.
- N. Sardesai, S. Pan and J. Rusling, Chem. Commun., 2009, 33, 4968–4970 RSC.
- C. X. Tang, Y. Zhao, X. W. He and X. B. Yin, Chem. Commun., 2010, 46, 9022–9024 RSC.
- B. Yang, J. P. Li, L. M. Zhang and G. B. Xu, Analyst, 2016, 141, 5822–5828 RSC.
- H. Cui, W. Wang, C. F. Duan, Y. P. Dong and J. Z. Guo, Chem. – Eur. J., 2007, 13, 6975–6984 CrossRef PubMed.
- F. Li, Y. Q. Yu, H. Cui, D. Yang and Z. P. Bian, Analyst, 2013, 138, 1844 RSC.
- E. Kerr, E. H. Doeven, G. J. Barbante, C. F. Hogan, D. J. Hayne, P. S. Donnelly and P. S. Francis, Chem. Sci., 2016, 7, 5271–5279 RSC.
- X. Zhang, H. Ke, Z. M. Wang, W. W. Guo, A. M. Zhang, C. S. Huang and N. Q. Jia, Analyst, 2017, 142, 2253–2260 RSC.
- X. Q. Lu, H. F. Wang, J. Du, B. M. Huang, D. Liu, X. H. Liu, H. X. Guo and Z. H. Xue, Analyst, 2012, 137, 1416–1420 RSC.
- P. J. Smith and C. K. Mann, J. Org. Chem., 1969, 34, 1821–1826 CrossRef.
- L. J. Xiao, Y. Q. Chai, R. Yuan, H. J. Wang and L. J. Bai, Analyst, 2014, 139, 1030–1036 RSC.
- H. T. Xiong and X. W. Zheng, Analyst, 2014, 139, 1732–1739 RSC.
- Z. L. Qiu, J. Shu and D. P. Tang, Analyst, 2015, 140, 5885–5890 RSC.
- J. X. Wang, Y. Zhuo, Y. Zhou, H. J. Wang, Y. Yuan and Y. Q. Chai, ACS Appl. Mater. Interfaces, 2016, 8, 12968–12975 Search PubMed.
- M. N. Ma, Y. Zhuo, R. Yuan and Y. Q. Chai, Anal. Chem., 2015, 87, 11389–11397 CrossRef PubMed.
- M. S. Wu, H. W. Shi, J. J. Xu and H. Y. Chen, Chem. Commun., 2011, 47, 7752–7754 RSC.
- Y. Q. Feng, F. Sun, N. N. Wang, J. P. Lei and H. X. Ju, Anal. Chem., 2017, 89, 7659–7666 CrossRef PubMed.
- X. Q. Chen, W. Y. Gui, H. Liu and Q. Ma, Analyst, 2017, 142, 4142–4149 RSC.
- S. Kirschbaum-Harriman, M. Mayer, A. Duerkop, T. Hirsch and A. J. Baeumner, Analyst, 2017, 142, 2469–2474 RSC.
- Y. Chem, J. Xu, J. Su, Y. Xiang, R. Yuan and Y. Q. Chai, Anal. Chem., 2012, 84, 7750–7755 CrossRef PubMed.
- Y. Y. Yang, M. A. Goetzfried, K. Hidaka, M. X. You, W. H. Tan, H. Sugiyama and M. Endo, Nano Lett., 2015, 15, 6672–6676 CrossRef PubMed.
- X. Y. Jiang, H. J. Wang, H. J. Wang, Y. Zhuo, R. Yuan and Y. Q. Chai, Anal. Chem., 2017, 89, 4280–4286 CrossRef PubMed.
- Y. T. Liu, J. P. Lei, Y. Huang and H. X. Ju, Anal. Chem., 2014, 86, 8735–8741 CrossRef PubMed.
- G. F. Jie, K. Chen, X. C. Wang and Z. K. Lu, RSC Adv., 2016, 6, 2065–2071 RSC.
- L. C. Peng, P. Zhang, Y. Q. Chai and R. Yuan, Anal. Chem., 2017, 89, 5036–5042 CrossRef PubMed.
- P. Zhang, X. Y. Wu, R. Yuan and Y. Q. Chai, Anal. Chem., 2015, 87, 3202–3207 CrossRef PubMed.
- C. Y. Xiong, W. B. Liang, Y. N. Zheng, Y. Zhuo, Y. Q. Chai and R. Yuan, Anal. Chem., 2017, 89, 3222–3227 CrossRef PubMed.
- Y. Fan, X. R. Tan, X. Ou, Q. Lu, S. H. Chen and S. P. Wei, Electrochim. Acta, 2016, 202, 90–99 CrossRef.
- X. J. Du, D. Jiang, N. Hao, Q. Liu, J. Qian, L. M. Dai, H. P. Mao and K. Wang, Chem. Commun., 2015, 51, 11236–11239 RSC.
- Y. Zhou, H. J. Wang, Y. Zhuo, Y. Q. Chai and R. Yuan, Anal. Chem., 2017, 89, 3732–3738 CrossRef PubMed.
- M. Zhao, Y. Zhuo, Y. Q. Chai and R. Yuan, Biomaterials, 2015, 52, 476–483 CrossRef PubMed.
- Y. M. Lei, M. Zhao, A. Wang, Y. Q. Yu, Y. Q. Chai, R. Yuan and Y. Zhuo, Chem. – Eur. J., 2016, 22, 8207–8214 CrossRef PubMed.
- X. Y. Jiang, H. J. Wang, H. J. Wang, R. Yuan and Y. Q. Chai, Anal. Chem., 2016, 88, 9243–9250 CrossRef PubMed.
- Y. Cheng, Y. Huang, J. P. Lei, L. Zhang and H. X. Ju, Anal. Chem., 2014, 86, 5158–5163 CrossRef PubMed.
- Z. X. Li, Y. Q. Zhou, D. P. Yan and M. Wei, J. Mater. Chem. C, 2017, 5, 3473–3479 RSC.
- Q. M. Feng, Y. Z. Shen, M. X. Li, Z. L. Zhang, W. Zhao, J. J. Xu and H. Y. Chen, Anal. Chem., 2015, 88, 937–944 CrossRef PubMed.
- H. R. Zhang, J. J. Xu and H. Y. Chen, Anal. Chem., 2013, 85, 5321–5325 CrossRef PubMed.
- H. R. Zhang, M. S. Wu, J. J. Xu and H. Y. Chen, Anal. Chem., 2014, 86, 3834–3840 CrossRef PubMed.
- N. Hao, X. L. Li, H. R. Zhang, J. J. Xu and H. Y. Chen, Chem. Commun., 2014, 50, 14828–14830 RSC.
- K. Shao, B. Wang, S. Y. Ye, Y. P. Zuo, L. Wu, Q. Li, Z. C. Lu, X. C. Tan and H. Y. Han, Anal. Chem., 2016, 88, 8179–8187 CrossRef PubMed.
- Y. Z. Wang, N. Hao, Q. M. Feng, H. W. Shi, J. J. Xu and H. Y. Chen, Biosens. Bioelectron., 2016, 77, 76–82 CrossRef PubMed.
- X. M. Fu, X. R. Tan, R. Yuan and S. H. Chen, Biosens. Bioelectron., 2017, 90, 61–68 CrossRef PubMed.
- M. N. Ma, Y. Zhuo, R. Yuan and Y. Q. Chai, Anal. Chem., 2015, 87, 11389–11397 CrossRef PubMed.
- Y. Q. Yu, H. Y. Zhang, Y. Q. Chai, R. Yuan and Y. Zhuo, Biosens. Bioelectron., 2016, 85, 8–15 CrossRef PubMed.
- W. J. Zeng, N. Liao, Y. M. Lei, J. Zhao, Y. Q. Chai, R. Yuan and Y. Zhuo, Biosens. Bioelectron., 2018, 100, 490–496 CrossRef PubMed.
- X. Yang, Y. Q. Yu, L. Z. Peng, Y. M. Lei, Y. Q. Chai, R. Yuan and Y. Zhuo, Anal. Chem., 2018, 90, 3995–4002 CrossRef PubMed.
- Y. M. Lei, B. Q. Xiao, W. B. Liang, Y. Q. Chai, R. Yuan and Y. Zhuo, Biosens. Bioelectron., 2018, 109, 109–115 CrossRef PubMed.
- M. H. Jiang, P. Lu, Y. M. Lei, Y. Q. Chai, R. Yuan and Y. Zhuo, Electrochim. Acta, 2018, 271, 464–471 CrossRef.
- Y. Zhou, M. Chen, Y. Zhuo, Y. Chai, W. Xu and R. Yuan, Anal. Chem., 2017, 89, 6787–6793 CrossRef PubMed.
- J. Zhao, W. B. Liang, Y. M. Lei, Y. X. Ou, Y. Q. Chai, R. Yuan and Y. Zhuo, Biosens. Bioelectron., 2017, 98, 317–324 CrossRef PubMed.
- Y. Zhou, H. Wang, Y. Zhuo, Y. Chai and R. Yuan, Anal. Chem., 2017, 89, 3732–3738 CrossRef PubMed.
- F. F. Wu, Y. Zhou, H. Zhang, R. Yuan and Y. Q. Chai, Anal. Chem., 2018, 90, 2263–2270 CrossRef PubMed.
- J. L. Liu, Z. L. Tang, Y. Zhuo, Y. Q. Chai and R. Yuan, Anal. Chem., 2017, 89, 9108–9115 CrossRef PubMed.
- H. F. Zhao, R. P. Liang, J. W. Wang and J. D. Qiu, Chem. Commun., 2015, 51, 12669–12672 RSC.
- Y. Huang, J. P. Lei, Y. Cheng and H. X. Ju, Biosens. Bioelectron., 2016, 77, 733–739 CrossRef PubMed.
- H. M. Chen, H. Zhang, R. Yuan and S. H. Chen, Anal. Chem., 2017, 89, 2823–2829 CrossRef PubMed.
- J. J. Jiang, D. Chen and X. Z. Du, Sens. Actuators, B, 2017, 251, 256–263 CrossRef.
- Q. W. Shang, Z. X. Zhou, Y. F. Shen, Y. Y. Zhang, Y. Li, S. Q. Liu and Y. J. Zhang, ACS Appl. Mater. Interfaces, 2015, 7, 23672–23678 Search PubMed.
- H. J. Chen, W. Li, Q. Wang, X. Jin, Z. Nie and S. Z. Yao, Electrochim. Acta, 2016, 214, 94–102 CrossRef.
- L. Wu, F. Ding, W. M. Yin, J. Ma, B. R. Wang, A. X. Nie and H. Y. Han, Anal. Chem., 2017, 89, 7578–7585 CrossRef PubMed.
- X. B. Feng, N. Gan, H. R. Zhang, T. H. Li, Y. T. Cao, F. T. Hu and Q. L. Jiang, Biosens. Bioelectron., 2016, 75, 308–314 CrossRef PubMed.
- X. B. Feng, N. Gan, S. C. Lin, T. H. Li, Y. T. Cao, F. T. Hu, Q. L. Jiang and Y. J. Chen, Sens. Actuators, B, 2016, 226, 305–311 CrossRef.
- Y. Z. Wang, W. Zhao, P. P. Dai, H. J. Lu, J. J. Xu, J. Pan and H. Y. Chen, Biosens. Bioelectron., 2016, 86, 683–689 CrossRef PubMed.
- Y. Chen, S. W. Zhou, L. L. Li and J. J. Zhu, Nano Today, 2017, 12, 98–115 CrossRef.
- Z. Y. Zhou, L. R. Xu, S. Z. Wu and B. Su, Analyst, 2014, 139, 4934–4939 RSC.
- Z. J. Lin, X. M. Chen, T. T. Jia, X. D. Wang, Z. X. Xie, M. Oyama and X. Chen, Anal. Chem., 2008, 81, 830–833 CrossRef PubMed.
- J. J. Xu, P. Y. Huang, Y. Qin, D. C. Jiang and H. Y. Chen, Anal. Chem., 2016, 88, 4609–4612 CrossRef PubMed.
- M. S. Wu, Z. Liu, H. W. Shi, H. Y. Chen and J. J. Xu, Anal. Chem., 2014, 87, 530–537 CrossRef PubMed.
- K. F. Chow, F. Mavré, J. A. Crooks, B. Y. Chang and R. M. Crooks, J. Am. Chem. Soc., 2009, 131, 8364–8365 CrossRef PubMed.
- L. R. Xu, Y. Li, Y. Y. He and B. Su, Analyst, 2013, 138, 2357–2362 RSC.
- Y. Li, L. R. Xu, Y. Y. He and B. Su, Electrochem. Commun., 2013, 33, 92–95 CrossRef.
- J. Zhang, P. P. Chen, X. Y. Wu, J. H. Chen, L. J. Xu, G. N. Chen and F. F. Fu, Biosens. Bioelectron., 2011, 26, 2645–2650 CrossRef PubMed.
- E. G. Hvastkovs, M. So, S. Krishnan, B. Bajrami, M. Tarun, I. Jansson, J. B. Schenkman and J. F. Rusling, Anal. Chem., 2007, 79, 1897–1906 CrossRef PubMed.
- S. Krishnan, E. G. Hvastkovs, B. Bajrami, D. Choudhary, J. B. Schenkman and J. F. Rusling, Anal. Chem., 2008, 80, 5279–5285 CrossRef PubMed.
- H. R. Zhang, Y. Z. Wang, W. Zhao, J. J. Xu and H. Y. Chen, Anal. Chem., 2016, 88, 2884–2890 CrossRef PubMed.
- R. Liu, C. S. Zhang and M. Liu, Sens. Actuators, B, 2015, 216, 255–262 CrossRef.
- M. Liu, D. Wang, C. L. Liu, R. Liu, H. J. Li and C. S. Zhang, Sens. Actuators, B, 2017, 246, 327–335 CrossRef.
- K. Song, P. Huang, C. L. Yi, B. Ning, S. Hu, L. M. Nie, X. Y. Chen and Z. H. Nie, ACS Nano, 2015, 9, 12344–12348 CrossRef PubMed.
- J. Wang, T. Wei, X. Y. Li, B. H. Zhang, J. X. Wang, C. Huang and Q. Yuan, Angew. Chem., Int. Ed., 2014, 126, 1642–1646 CrossRef.
- L. R. Xu, Z. Y. Zhou, C. Z. Zhang, Y. Y. He and B. Su, Chem. Commun., 2014, 50, 9097–9100 RSC.
- L. R. Xu, Y. Li, S. Z. Wu, X. H. Liu and B. Su, Angew. Chem., Int. Ed., 2012, 124, 8192–8196 CrossRef.
- J. Tan, L. R. Xu, T. Li, B. Su and J. M. Wu, Angew. Chem., Int. Ed., 2014, 53, 9822–9826 CrossRef PubMed.
- F. Deiss, C. N. LaFratta, M. Symer, T. M. Blicharz, N. Sojic and D. R. Walt, J. Am. Chem. Soc., 2009, 131, 6088–6089 CrossRef PubMed.
- N. P. Sardesai, J. C. Barron and J. F. Rusling, Anal. Chem., 2011, 83, 6698–6703 CrossRef PubMed.
- M. Sentic, M. Milutinovic, F. Kanoufi, D. Manojlovic, S. Arbault and N. Sojic, Chem. Sci., 2014, 5, 2568–2572 RSC.
- S. M. Pan, L. L. Zhao, J. B. Schenkman and J. F. Rusling, Anal. Chem., 2011, 83, 2754–2760 CrossRef PubMed.
- D. P. Wasalathanthri, D. D. Li, D. H. Song, Z. F. Zheng, D. Choudhary, I. Jansson and J. F. Rusling, Chem. Sci., 2015, 6, 2457–2468 RSC.
- J. Wang, G. Liu and A. Merkoçi, J. Am. Chem. Soc., 2003, 125, 3214–3215 CrossRef PubMed.
- J. R. Miao, Z. J. Cao, Y. Zhou, C. Lau and J. Z. Lu, Anal. Chem., 2008, 8, 1606–1613 CrossRef PubMed.
- H. Li, Z. J. Cao, Y. H. Zhang, C. W. Lau and J. Z. Lu, Analyst, 2011, 136, 1399–1405 RSC.
- Z. Y. Guo, T. T. Hao, S. P. Du, B. B. Chen, Z. B. Wang, X. Li and S. Wang, Biosens. Bioelectron., 2013, 44, 101–107 CrossRef PubMed.
- F. F. Han, H. Jiang, D. J. Fang and D. C. Jiang, Anal. Chem., 2014, 86, 6896–6902 CrossRef PubMed.
- B. Zhou, Y. Y. Qiu, Q. Q. Wen, M. Y. Zhu and P. H. Yang, ACS Appl. Mater. Interfaces, 2017, 9, 2074–2082 Search PubMed.
- P. Zhang, Z. F. Lin, Y. Zhuo, R. Yuan and Y. Q. Chai, Anal. Chem., 2017, 89, 1338–1345 CrossRef PubMed.
- L. C. Peng, P. Zhang, Y. Q. Chai and R. Yuan, Anal. Chem., 2017, 89, 5036–5042 CrossRef PubMed.
- Y. M. Nie, P. Zhang, H. J. Wang, Y. Zhuo, Y. Q. Chai and R. Yuan, Anal. Chem., 2017, 89, 12821–12827 CrossRef PubMed.
- W. B. Liang, C. C. Fan, Y. Zhuo, Y. N. Zheng, C. Y. Xiong, Y. Q. Chai and R. Yuan, Anal. Chem., 2016, 88, 4940–4948 CrossRef PubMed.
- W. B. Liang, M. Z. Yang, Y. Zhuo, Y. N. Zheng, C. Y. Xiong, Y. Q. Chai and R. Yuan, Chem. Sci., 2016, 7, 7094–7100 RSC.
- D. M. Cate, J. A. Adkins, J. Mettakoonpitak and C. S. Henry, Anal. Chem., 2015, 87, 19–41 CrossRef PubMed.
- A. W. Martinez, S. T. Phillips, M. J. Butte and G. M. Whitesides, Angew. Chem., Int. Ed., 2007, 46, 1318–1320 CrossRef PubMed.
- G. Lei, J. H. Yu, S. G. Ge and M. Yan, Anal. Bioanal. Chem., 2014, 406, 5613–5630 CrossRef PubMed.
- W. Y. Gao, M. Saqib, L. M. Qi, W. Zhang and G. B. Xu, Curr. Opin. Electrochem., 2017, 3, 4–10 CrossRef.
- Y. Zhang, L. Li, L. N. Zhang, S. G. Ge, M. Yan and J. H. Yu, Nano Energy, 2017, 31, 174–182 CrossRef.
- X. W. Zhang, J. Li, C. Q. Chen, B. H. Lou, L. L. Zhang and E. K. Wang, Chem. Commun., 2013, 49, 3866–3868 RSC.
Footnote |
| † These authors contributed equally to this work. |
| This journal is © The Royal Society of Chemistry 2018 |
