 Open Access Article
Creative Commons Attribution 3.0 Unported Licence
Graphene oxide/Fe3O4/SO3H nanohybrid: a new adsorbent for adsorption and reduction of Cr(VI) from aqueous solutions†
Abdolhamid Alizadeh *ab,
Gisya Abdia,
Mohammad Mehdi Khodaeia,
Muthupandian Ashokkumarc and
Jhaleh Amiriand
aDepartment of Organic Chemistry, Faculty of Chemistry, Razi University, Kermanshah, 6714967346, Iran. E-mail: ahalizadeh2@hotmail.com; ahalizadeh2@razi.ac.ir; Fax: +98 833 427 4559; Tel: +98 833 427 4559
bNanoscience & Nanotechnology Research Center (NNRC), Razi University, Kermanshah, Iran
cSchool of Chemistry, University of Melbourne, VIC 3010, Australia
dDepartment of Regenerative Medicine, College of Medicine, Soonchunhyang University, 366-1, Sangyong-dong, Cheonan-City, Chung Cheong Nam-Do 330-090, Republic of Korea
First published on 8th March 2017
Abstract
A sulfonated magnetic graphene oxide (SMGO) hybrid was successfully synthesized via the nucleophilic substitution reaction and characterized. The removal of chromate by SMGO was investigated. The effects of contact time, initial pH of the solution, and initial chromate concentration on the removal efficiency were investigated. The optimal experimental conditions for enhanced chromate removal were found to be a contact time of 60 min at an initial solution pH of 3. The observed data were fitted with Lagergren pseudo-second-order kinetic model, indicating that chromate adsorption on SMGO was a chemical interaction in nature. The Langmuir model was also used to describe the adsorption processes and the adsorption capacity was found to be 222.22 mg g−1. Thermodynamic studies (ΔG < 0, ΔH > 0, ΔS > 0) revealed that the adsorption process was exothermic and spontaneous. SMGO has potential to be applied several times after desorption in wastewater treatment.
1. Introduction
Heavy metal ion contamination in wastewater has become a severe environmental issue.1,2 Among these heavy metal ions, chromium ions could cause severe health problems for both animals and human beings.3–5 Chromium ions are present in the environment in several different forms. The most common oxidation forms are hexavalent (Cr(IV)) and trivalent (Cr(III)). While, Cr(III) is generally nontoxic, Cr(VI) is one of the most toxic heavy metal ions.6,7 Therefore, the removal of Cr(VI) from wastewater is a hot research topic in environmental science and technology areas. The removal of Cr(VI) has been extensively investigated by various methods that include chemical precipitation, ion exchange, neutralization, membrane separation, flocculation, bio-treatment, ultrafiltration and adsorption strategies.8,9 Adsorption is an easy, economic and promising method for sewage purification, which has the characteristics of high selectivity and ease of operation.10,11 The adsorbent plays a key role in the adsorption process. Therefore, the design and synthesis of adsorbents with excellent performance are important in adsorption research.12Graphene oxide (GO) and reduced graphene oxide (RGO) are flexible lamellar materials with large specific surface areas and aromatic sp2 domains. GO possesses a wide range of functional groups such as epoxy (C–O–C), hydroxyl (OH), and carboxyl (COOH) groups on its backbone and edges, which render strong hydrophilic properties and excellent adsorption capacity for heavy metal pollutants.13,14 However, most of these materials are used as nanosized sorbent particles and are difficult to collect from water following treatment, which restricts their practical application.15 The incorporation of magnetic particles on the surface of GO can combine the high adsorption capacity of GO and the separation convenience of magnetic materials.16,17 In order to increase the adsorption ability of these materials, a great number of GO derivatives have been synthesized by grafting new functional groups onto GO backbone.18
In this work, GO/Fe3O4/SO3H hybrid was prepared and its use as an adsorbent for Cr(IV) evaluated. The hybrid material was also characterized by a number of analytical techniques.
2. Materials and methods
2.1 Materials
Graphite powder, chlorosulphonic acid, sodium hydroxide, potassium dichromate, potassium permanganate, ferric chloride hexahydrate (FeCl3·6H2O) and ferrous chloride tetrahydrate (FeCl2·4H2O) were purchased from Sigma Aldrich. Chlorosulphonic acid, hydrochloridric acid, orthophosphoric acid, ammonia and ethanol were procured from Merck. All other reagents used in this study were analytical grade, and distilled or double distilled water was used in the preparation of all solutions.2.2 Characterization
X-ray photoelectron spectroscopy (XPS) spectra were obtained by using the ESCALAB 250 X-ray Photoelectron Spectroscopy/ESCA equipment. X-ray diffraction (XRD) spectra were recorded on D/MAX-250, Rigaku, Tokyo, Japan using 40 kV with Cu Kα irradiation (λ = 1.541 Å). Fourier transform infrared (Bruker FTIR) spectra were recorded in KBr pellets in the range of 400–4000 cm−1. Scanning electron microscopy (SEM) images of the product were taken using a JSM-6701F microscope (JEOL, Japan) equipped for EDS. A small part of scaffold was placed on the SEM sample holder and sputter coated with platinum. An accelerating voltage of 10 kV was used. Transmission electron microscopy (TEM) was performed on JEOL JEM-1010n. The magnetic measurements were carried out in a vibrating sample magnetometer (VSM, BHV-55, Riken, Japan) at room temperature. Measurements of Raman spectra were carried out using a Senterra Raman Scope system with a 532 nm wavelength incident laser light and power 20 mW. Brunauer–Emmett–Teller (BET) specific surface area and pore volume were measured by nitrogen adsorption using Micromeritics Tristar 3020. The pore size distribution for each sample was calculated using non-local density functional theory (NLDFT), from the desorption branch of the isotherms. Thermogravimetric analysis (TGA) was carried out using a Q5000IR (TA instruments) under nitrogen flow (100 mL min−1) with ramp rate of 10 °C min−1. UV-visible spectra were recorded by Perkin Elmer Lambda 25 spectrometer.2.3 Methods
GO/Fe3O4/SO3H hybrid was synthesized by adding dropwise chlorosulfonic acid (20 mmol, 1.2 cm3) to 0.2 g GO/Fe3O4 suspension in 20 mL dichloromethane (CH2Cl2) with constant stirring in an ice bath for 2 h. The resulted paste was washed repeatedly until pH was about 7.0. Then, the obtained product was collected by the aid of a permanent magnet and dried in a vacuum oven at 50 °C to obtain GO/Fe3O4/SO3H.
3. Results and discussion
3.1 Synthesis and characterization of GO/Fe3O4/SO3H hybrid (SMGO)
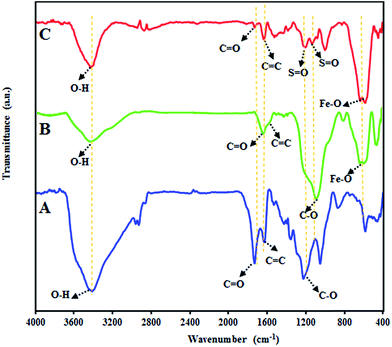
The interaction between GO, Fe3O4 or GO/Fe3O4 and chlorosulphonic acid has three possibilities: hydrogen bonding, electrostatic interaction and nucleophilic substitution reaction. As depicted in Scheme 1, the nucleophilic reaction between surface hydroxyl or epoxy groups with chloro group is presumably the dominant possibility for this attachment. These may lead to the covalent attachment of –SO3H moiety onto the surface of GO, Fe3O4 or GO/Fe3O4 (Scheme 1). In order to identify the interaction between GO/Fe3O4 hybrid and chlorosulphonic acid, the obtained GO/Fe3O4/SO3H was characterized by FTIR. Fig. 1 depicts the FTIR signals of GO, GO/Fe3O4, and GO/Fe3O4/SO3H hybrid. Fig. 1A reveals the characteristic absorption peaks for GO at 1728, 1629, 1422, 1052 and 1225 cm−1, which can be attributed to C![[double bond, length as m-dash]](https://www.rsc.org/images/entities/char_e001.gif) O stretching, C
O stretching, C![[double bond, length as m-dash]](https://www.rsc.org/images/entities/char_e001.gif) C in-plane stretching vibration, adsorbed water molecules, O–H deformation, alkoxy C–O stretching, and epoxy C–O stretching vibration, respectively.21 All these results clearly indicate the formation of graphene oxide and presence of oxygenated functionalities on a graphene skeleton, which we have used for the growth of magnetic nanoparticles. FTIR spectrum of magnetic graphene oxide (MGO) is shown in Fig. 1B. The peak at 1728 cm−1 corresponding to C
C in-plane stretching vibration, adsorbed water molecules, O–H deformation, alkoxy C–O stretching, and epoxy C–O stretching vibration, respectively.21 All these results clearly indicate the formation of graphene oxide and presence of oxygenated functionalities on a graphene skeleton, which we have used for the growth of magnetic nanoparticles. FTIR spectrum of magnetic graphene oxide (MGO) is shown in Fig. 1B. The peak at 1728 cm−1 corresponding to C![[double bond, length as m-dash]](https://www.rsc.org/images/entities/char_e001.gif) O of carboxyl group on the GO shifts to 1638 cm−1, may be due to the formation of –COO− after coating with Fe3O4. FTIR spectrum show two broad peaks at 1587 and 1084 cm−1 which correspond to the aromatic C
O of carboxyl group on the GO shifts to 1638 cm−1, may be due to the formation of –COO− after coating with Fe3O4. FTIR spectrum show two broad peaks at 1587 and 1084 cm−1 which correspond to the aromatic C![[double bond, length as m-dash]](https://www.rsc.org/images/entities/char_e001.gif) C stretch and C–O stretch, respectively. The transmittance band around 583 cm−1 is attributed to Fe–O. The FTIR spectra of SMGO hybrid (Fig. 1C) shows a peak at 1729 cm−1 corresponding to the stretching vibration of carbonyl (C
C stretch and C–O stretch, respectively. The transmittance band around 583 cm−1 is attributed to Fe–O. The FTIR spectra of SMGO hybrid (Fig. 1C) shows a peak at 1729 cm−1 corresponding to the stretching vibration of carbonyl (C![[double bond, length as m-dash]](https://www.rsc.org/images/entities/char_e001.gif) O) groups on the GO, and the strong broad band centered at approximately 3437 cm−1 was assigned to the O–H stretching modes of the hydroxyl groups on SMGO hybrid.22
O) groups on the GO, and the strong broad band centered at approximately 3437 cm−1 was assigned to the O–H stretching modes of the hydroxyl groups on SMGO hybrid.22
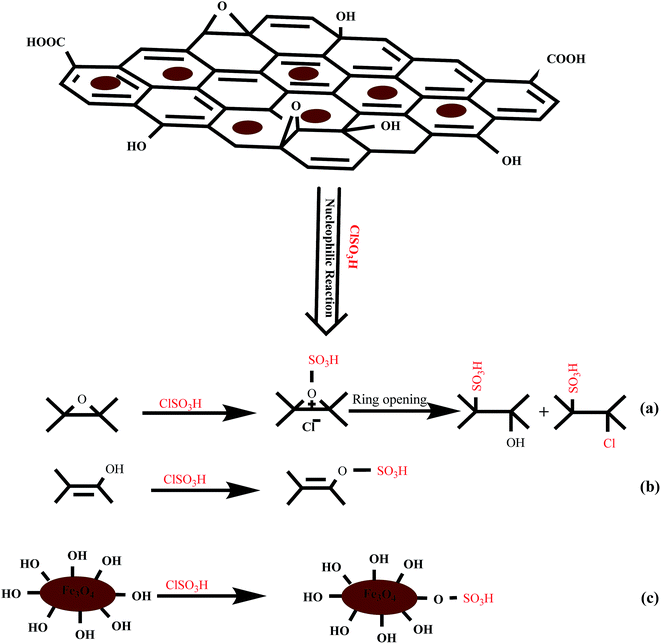 | ||
| Scheme 1 Proposed nucleophilic substitution reactions for modification of magnetic graphene oxide by chlorosulphonic acid. | ||
The peak at 1634 cm−1 corresponds to aromatic stretch C![[double bond, length as m-dash]](https://www.rsc.org/images/entities/char_e001.gif) C. The peaks at 1199 and 1129 cm−1 confirmed the presence of S
C. The peaks at 1199 and 1129 cm−1 confirmed the presence of S![[double bond, length as m-dash]](https://www.rsc.org/images/entities/char_e001.gif) O group.23,24 The peak at 574 cm−1 is a characteristic peak corresponding to the stretching vibration of Fe–O.25
O group.23,24 The peak at 574 cm−1 is a characteristic peak corresponding to the stretching vibration of Fe–O.25
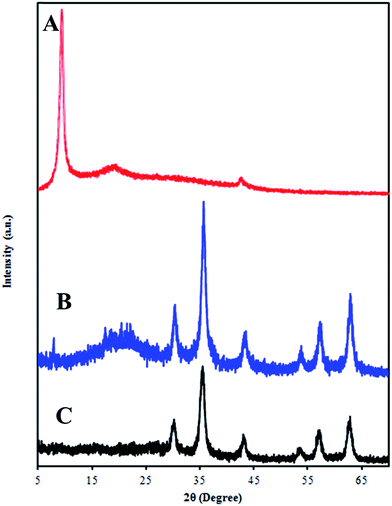
Fig. 2 shows XRD patterns of GO and GO/Fe3O4/SO3H. The XRD pattern of GO showing a sharp diffraction peak at scattering angle 2θ = 10° corresponding to (001) plane of GO, giving the interlayer separation to be ∼8.83 Å. The increased d-spacing of GO sheets is due to the presence of abundant oxygen-containing functional groups on both sides of the grapheme sheet causing an atomic-scale roughness on the grapheme sheet. The XRD patterns of SMGO hybrids (Fig. 2B) show diffraction peaks indexed to (111), (220), (311), (400), (422), (511), and (440) planes appearing at 2θ = 17.53, 30.40°, 35.67°, 43.33°, 53.24°, 57.34°, and 62.85°, respectively, which are consistent with the standard XRD data for the cubic phase Fe3O4 with a face-centered cubic (fcc) structure.26 The broad diffraction peaks are indications of the nanoparticles with very small size. The broad peak which appears at 22.0 attributed to reduced graphene oxide (RGO).22 X-ray powder diffraction patterns of GO/Fe3O4/SO3H were recorded using CuKα radiation (λ = 1.542 Å).
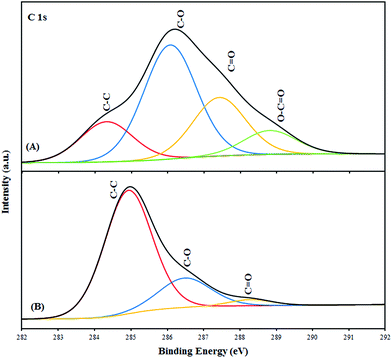
The X-ray photoelectron spectroscopy (XPS) was used to investigate the chemical changes brought by magnetite nanoparticles. ESI Fig. S2A† shows the wide scan X-ray photoemission spectroscopy (XPS) of SMGO hybrid. The XPS spectra of the SMGO shows photoelectron lines at a binding energy of about 167.6, 284.5, 530, 711 eV attributed to S2p, C1s, O1s, and Fe2p, respectively (ESI Fig. S2†). The C1s XPS spectrum of GO with peak-fitting curves is presented in Fig. 3A. The peaks at 284.9, 286.2, 288.3, and 289.3 eV were assigned to carbon atoms in the C–C bond (sp2), C–O, C![[double bond, length as m-dash]](https://www.rsc.org/images/entities/char_e001.gif) O and O–C
O and O–C![[double bond, length as m-dash]](https://www.rsc.org/images/entities/char_e001.gif) O, respectively.
O, respectively.
This result suggested that GO contained large numbers of functional groups on its surface. Compared with GO, the intensity of the C–O and C![[double bond, length as m-dash]](https://www.rsc.org/images/entities/char_e001.gif) O peaks in the SMGO composite shown in Fig. 3B is dramatically decreased, indicating effective deoxygenation of GO after reduction by magnetic nanoparticles. It is notable that the peaks of O1s in SMGO composite spectra shifted to lower binding energy and broadened, which is characteristic of the O1s in Fe3O4 lattice (ESI Fig. S2C†).
O peaks in the SMGO composite shown in Fig. 3B is dramatically decreased, indicating effective deoxygenation of GO after reduction by magnetic nanoparticles. It is notable that the peaks of O1s in SMGO composite spectra shifted to lower binding energy and broadened, which is characteristic of the O1s in Fe3O4 lattice (ESI Fig. S2C†).
Raman spectroscopy is widely used to characterize crystal structure, disorder and defects in graphene-based materials. Fig. S-3 in ESI† presents the Raman spectra (532 nm excitation) of GO (A) and SMGO composite (B). The D-band (1373 cm−1) and G-band (1594 cm−1) are two predominate peaks27 for GO. The G-band for GO due to the presence of isolated double bonds appeared at frequencies higher than that of the G-band of the graphite (1580 cm−1).28 The G-band of SMGO occurred at 1577 cm−1, and peak at 1363 cm−1 was attributed to D-band. The intensity ratio of D band to G band (r = ID/IG) is usually used as a measure of the disorder.29 The intensity ratio of D band to G band (r = ID/IG) of SMGO (1.27) increased notably, indicating that the reduction process altered the structure of GO (0.89) with a high quantity of structural defects.
Surface area measurement of the SMGO via the nitrogen gas absorption–desorption isotherm yielded a Brunauer, Emmett and Teller (BET) surface area of 184.17 m2 g−1. The pore size distribution of samples could be calculated by Barrett–Joyner–Halenda (BJH) method (ESI Fig. S4†). The SMGO exhibited average pore size centralizing at 4.19 nm (ESI Fig. S5†).
Thermogravimetric analysis (TGA) is a useful tool to determine the composition of the samples. Figure displays the TGA thermograms of GO and SMGO composite (at a heating rate of 10 °C min−1 and under a nitrogen atmosphere). The initial weight loss of GO below 120 °C is ascribed to the elimination of adsorbed water and the weight loss from 120 °C to ∼300 °C is ascribed to decomposition and evaporation of oxygen-containing functional groups (ESI Fig. S6†). The curve for the SMGO composite shows the weight loss before 200 °C (wt loss 8%) and another ∼375 (wt loss 7%). The nanocomposite shows far greater stability up to 800 °C.
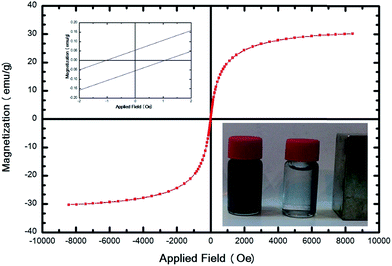
The magnetic property of SMGO was characterized by a vibrating sample magnetometer (VSM) and Fig. 4 shows the typical room temperature magnetization curve of SMGO. The saturation magnetization (Ms) of the GO/Fe3O4/SO3H hybrid is 26 emu g−1 (magnetic field ± 10 kOe) (Fig. 4), indicating the high magnetic property. The left inset in Fig. 4 is the magnification of hysteresis loop of GO/Fe3O4/SO3H. The right inset of Fig. 4 shows that SMGO hybrid is attracted by an external magnet, and the clear solution can be easily removed by pipette or decanting. It has been reported that the Fe3O4 nanoparticles with a high value of coercivity (Hc) could be called ferromagnetic at room temperature, whereas those with a low value (lower than 20 Oe) could be called superparamagnetic.30 Our results showed that the Hc of catalysts is 1.05 Oe and the Mr (remnant magnetization) is ∼0.055 emu g−1.
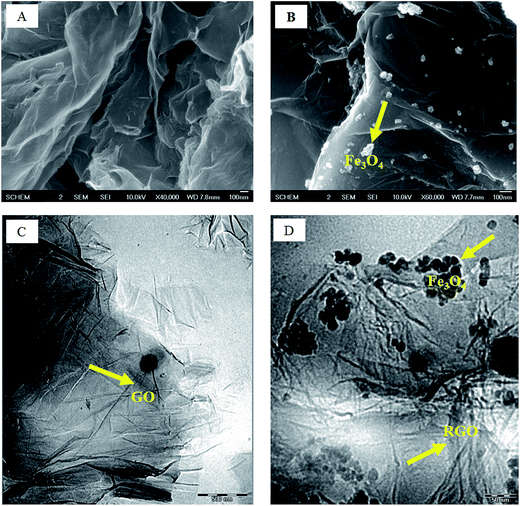
The scanning electron microscopy (SEM) and transmission electron microscopy (TEM) images of the GO and SMGO hybrids are shown in Fig. 5. The presence of magnetite in SMGO hybrid and folding nature of graphene oxide sheets can be seen throughout the morphology (Fig. 5B). The TEM images are shown in Fig. 5C and D, and the crumpled graphene oxide sheets and the presence of magnetite nanoparticles suggest that GO/Fe3O4 hybrids are formed. The TEM image (Fig. 4D) shows that the GO film is transparent and Fe3O4 nanoparticles are dispersed on the surface. The quantitative elemental analyses of the samples obtained by EDS (ESI Fig. S7†), results are shown in Table 1.
| Element | Weight% | ||
|---|---|---|---|
| GO | MGO | SMGO | |
| C K | 47.18 | 38.24 | 15.92 |
| O K | 52.82 | 24.44 | 43.36 |
| N K | — | 2.20 | — |
| S K | — | — | 22.47 |
| Fe L | — | 35.13 | 18.25 |
| Totals | 100 | 100 | 100 |
3.2 Adsorption study
To evaluate the performance of surface-modified GO nanosheets in Cr(VI) removal from aqueous solution, we set four parallel control experiments to make a comparison on the performance of GO, GO–SO3H, GO/Fe3O4 and GO/Fe3O4/SO3H as adsorbent (Table 2). GO with several hydrophilic functional groups on its backbone and edges has excellent adsorption capacity for heavy metal pollutant. However, as GO nanosheets are nanosized adsorbent, their collection is very difficult or impossible from water following treatment and this restricts their practical application. In addition, grafting new functional groups onto GO backbone presumably lead to increase in the adsorption ability of GO sheets. In a simple treatment of GO with ClSO3H, another adsorbent (GO–SO3H) were prepared and employed as adsorbent. It was found that GO and GO–SO3H were completely dispersed in water (ESI Fig. S8†). At the end of adsorption test, their high dispersity in water made their separation very difficult from water solution even with the help of high speed centrifuging process (Table 2). Even though their high adsorption capacity is useful to remove pollutant, due to the difficulty of their separation they can became contamination. The incorporation of magnetic particles on the surface of GO can combine the high adsorption capacity of GO and the separation convenience of magnetic material. So, the adsorbent GO/Fe3O4 was prepared and employed as an easily separable adsorbent in Cr(VI) removal. But since the preparation of this composite take places in the presence of 30% NH3 (∼pH 10), its surface charge was negative and GO/Fe3O4 was not suitable adsorbent for removing of HCrO4− anion. Combining GO, Fe3O4 and SO3H led to a hybrid material showing excellent adsorption capacity for heavy metal pollutant with feasibility in final separation. Based on our further investigations, GO/Fe3O4/SO3H (SMGO) adsorbent showed excellent performance in Cr(VI) removal from water.| Adsorbent | Dispersity in water | Separation with | |
|---|---|---|---|
| Centrifuge | External magnet | ||
| GO | ✓ | Trace | — |
| GO/SO3H | ✓ | Trace | — |
| GO/Fe3O4 | ✗ | — | ✓ |
| GO/Fe3O4/SO3H | ✗ | — | ✓ |
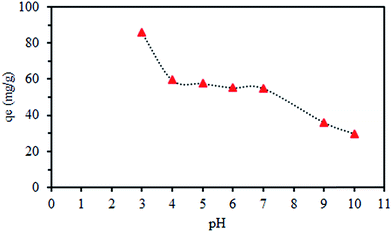
The concentration of SMGO was 0.5 g L−1, and the initial Cr(VI) concentration was 100 mg L−1. The amount of the ionic metal adsorbed on adsorbent is calculated using the relation qt = (C0 − Ct)/m)V. Here, qt (mg g−1) is the amount of metal ions adsorbed by the adsorbent at t time condition, C0 is the initial metal ion concentration, Ce is the metal ion concentration at equilibrium, V is the volume of the initial chromate solutions, and m is the mass of the adsorbent. The maximum adsorption occurs at pH = 3. Upon addition of SMGO to the solution, there was a slight change in pH; the initial pH and final pH were 3 and 2.86 values, respectively. This might be due to the acidic nature of poly sulphonated composite.
In the adsorption kinetic studies Lagergren pseudo-first-order model and pseudo-second-order model are often used to reveal the mechanism of adsorption process, which can be expressed as follows:
ln(qe − qt) = −k1t + ln![[thin space (1/6-em)]](https://www.rsc.org/images/entities/char_2009.gif) qe qe
| (1) |
 | (2) |
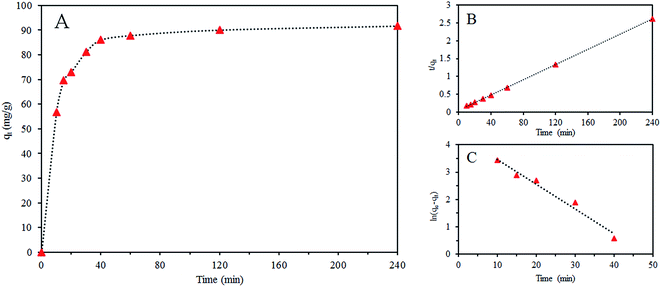
Where qt (in mg g−1) are the equilibrated adsorption capacities, k1 (in min−1) and k2 (in g mg−1 min−1) are rate constants of the pseudo-first-order and pseudo-second-order kinetic models, and t (min) is contact time.
As shown in Fig. 7 and Table 3, we found that the coefficient of determination (R2) of pseudo-second-order model for Cr(VI) is 0.999, which is higher than the value obtained by the pseudo-first-order model, indicating adsorption of Cr(VI) on GO/Fe3O4/SO3H can be described by the Lagergren pseudo-second-order kinetic model and its adsorption rate is determined by the chemical adsorption.
| Experimental | First-order kinetic | Second-order kinetic | ||||
|---|---|---|---|---|---|---|
| qe,exp (mg g−1) | k1 | qe,cal (mg g−1) | R2 | k2 | qe,cal (mg g−1) | R2 |
| 87.82 | 0.0906 | 80.16 | 0.975 | 0.0021 | 93.45 | 0.999 |
 | (3) |
The linear form of Freundlich model could be expressed as follows (eqn (4)):
 | (4) |
Where Ce (in mg L−1) is the concentration of equilibrium, qe (in mg g−1) is the equilibrated adsorption capacity, KL (in L mg−1) and qm (in mg g−1) are Langmuir parameters relevant to energy and capacity of adsorption, and n and KF (in mg1−n Ln g−1) are Freundlich parameters to the intensity and capacity of adsorption.
To judge whether the adsorption process is favorable or not, a dimensionless constant referred to as separation factor or equilibrium parameter RL is calculated using following eqn (5):31
 | (5) |
Where KL (L mg−1) is the Langmuir constant and C0 (mg L−1) is the initial concentration of chromate solution. The RL value indicates adsorption process is irreversible when RL is 0; favorable when RL is between 0 and 1; linear when RL is 1; and unfavorable when RL is greater than 1.
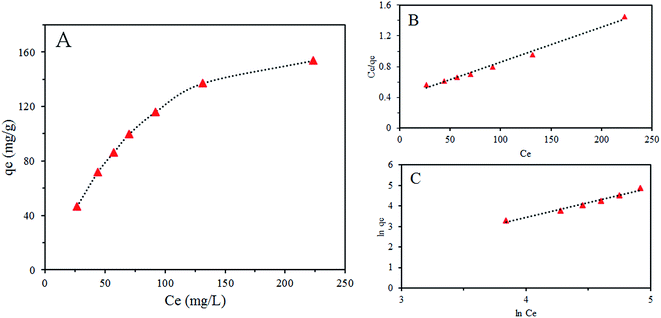
Isotherms of Cr(VI) adsorption on SMGO hybrid are illustrated in Fig. 8. Fitting adsorption equilibrium data to these two models, isotherm parameters were obtained and shown in Table 4. It is obvious that an increase in the initial metal ion concentration leads to a decrease in adsorption percentage but contributes to the increase of adsorption capacities for Cr(VI), which suggests that SMGO hybrid has great potential in the treatment of wastewater contaminated with high concentration of Cr(VI).
| Langmuir model | Freundlich model | |||||
|---|---|---|---|---|---|---|
| qm | KL | R2 | RL | KF | n | R2 |
| 222.22 | 0.0111 | 0.989 | 0.3 < RL < 0.64 | 0.0928 | 0.69 | 0.983 |
The related parameters of the two models are tabulated in Table 4. Moreover, R2 of Langmuir model is more precise in evaluating adsorption equilibrium, the fact that the adsorption data of Cr(VI) is in accordance with the Langmuir model suggests that monolayer coverage of chromium on SMGO is the main adsorption mechanism and the surface of SMGO hybrid is homogenous. The calculated value of RL is in the range of 0.3–0.64, confirming that the adsorption processes is favorable.
The maximum adsorption capacity of SMGO hybrids, qm obtained from the slope were found to be 222.22 mg g−1. To compare the potential capacity of SMGO with those of other sorbents reported in the literature, we used qm, a Langmuir parameter that has been used in most of the earlier investigations. Although a direct comparison of SMGO with other sorbents is difficult due to the different experimental conditions applied, Table 5 gives a simple comparison of the adsorption ability of the adsorption ability of different adsorption materials with SMGO. We engineered the surface of magnetic graphene oxide by SO3H groups for adsorption of anionic pollutants. Chromate is one sample which can exist in different forms in media, as we explained in paper, generally Cr(VI) species may be represented in several forms in solution as a function of pH such as H2CrO4 (<1.0), HCrO4− and Cr2O72− (1.0–6.0), and CrO42− (>6.0), which make its adsorption complex but with control of pH and engineering the surface of adsorbent, it is possible to overcome its multi-appearance and increase its adsorption amount. Higher adsorption capacity of present work compared to other reported adsorbents in the literatures is noteworthy. Moreover the magnetic separation convenience make SMGO an attractive sorbent for the removal of chromium.
| Adsorbent | Concentration of absorbent (g L−1) | pH | Contact time (min) | Adsorption capacity (mg g−1) | Ref. |
|---|---|---|---|---|---|
| Layered zinc hydroxide nitrate | 1.5 | 8 | 120 | 194.3 | 32 |
| MCM-49/MCM-41 composite | 10 | 6 | 80 | 4.1 | 33 |
| Amine-based-surfactant-modified clinoptilite | 14 | 4 | 120 | 6.72 | 34 |
| Superporous magnetic cationic cryogels | 0.15 | 7 | 180 | 65.5 | 35 |
| Magnetic ionic liquid/chitosan/graphene oxide | 1.0 | 3 | 40 | 145.35 | 36 |
| HDTMA-zeolite | 25 | 3 | 240 | 8.83 | 6 |
| Banana skin | 5.0 | 2 | 30 | 249.6 | 37 |
| Mesoporous iron–zirconium | 1.0 | 5 | 600 | 59.9 | 38 |
| Poly(catechol-diethylenetriamine-p-phenylenediamine) | 0.5 | 3 | 48 (h) | 200 | 2 |
| SMGO | 0.5 | 3 | 60 | 222.22 | This work |
3.3 Mechanisms of adsorption
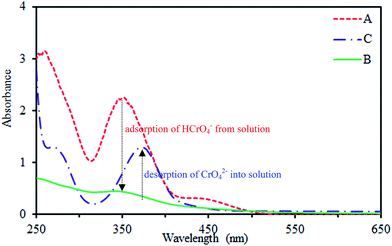
Generally, the Cr(VI) species may be represented in several forms in solution as a function of pH such as H2CrO4 (<1.0), HCrO4− and Cr2O72− (1.0–6.0), and CrO42− (>6.0).39,40 So the pH is one of the most important factors affecting adsorbent, sorbate, and adsorption properties. At lower pH values, the hydroxyl, carboxyl and sulfonate groups on the surface of SMGO hybrids with the aid of protons in aqueous phase become positively charged due to strong protonation. The electrostatic interaction between the positively charged surface and the negatively charged HCrO4−, Cr2O72− in the interlayer region, will enhance the Cr(VI) adsorption. The more positive the surface charge of SMGO, the more the removal of Cr(VI) from aqueous phase. Thus, higher amount of Cr(VI) will be absorbed by SMGO hybrid in the lower pH solution. To investigate the accuracy of this assumption, after adsorption process, the solution was removed and the adsorbent copiously washed with deionized water. Then, a NaOH solution (pH = 10) was added to the adsorbent and agitated for a while. Later on, the adsorbent was separated by an external magnet and a UV-Vis spectrum of the remained solution (Fig. 9C) was obtained. In this spectrum, the characteristic absorbance peak of CrO42− which is the most stable form of Cr(VI) at pH = 10 was easily detectable at λmax = 370 nm. This observation proved the fact that OH− at pH = 10 can replace the sites of adsorbed HCrO4− on solid phase at pH ∼3 (Fig. 9B) and release them to aqueous solution in the form of CrO42− (Fig. 10).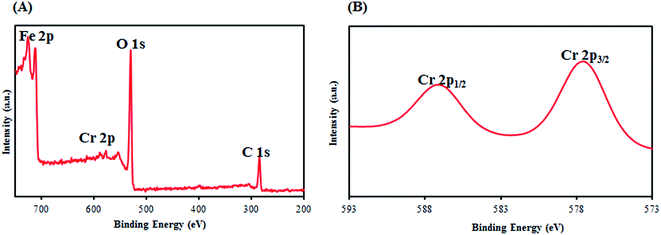 | ||
| Fig. 10 X-ray photoelectron spectroscopy (XPS) spectra: (A) wide scan, (B) Cr2p spectra of SMGO after adsorption process. | ||
Also, the low pH of media is an appropriate factor for promotion of redox reactions in aqueous and solid phases, because protons participate in these reactions.37,40 Hydroxyl groups and π electrons on graphene oxide sheets could act as electron-donor groups. Therefore, Cr(III) ions can be produced in aqueous and solid phases. To investigate the formation of Cr(III) in aqueous media, during the adsorption time, we considered the UV-visible spectra of solution and no absorption peak was found at wavelengths >560 nm (Fig. 9B).41 This suggests that if the Cr(III) ions are formed based on the aforementioned possibility, they are only present on the surface of hybrid material and not freely in the solution. Due to the cationic nature of Cr(III) ion, it can be easily immobilized onto the surface of composite with the help of several groups such as OH, SO3H and COOH. These groups all contain oxygen as donor atom and can form complex structure. This conclusion is supported by the X-ray photoelectron spectroscopy (XPS) spectra of the obtained SMGO composites after adsorption process. To prove the presence of Cr(III) on the surface of SMGO hybrid, the XPS analysis of the SMGO hybrid after adsorption was investigated. In the XPS spectrum of SMGO, the peaks of Cr2p1/2 at 584 eV and Cr2p3/2 at 575 eV, proved the presence of Cr(III) in the bottom layers of SMGO hybrid (ESI, Fig. S2A†).
According to aforementioned results, we proposed a plausible Cr(VI) removal mechanism which is consists of: (1) protonation of –OH, –COOH, or –SO3H on the surface of M (Fe) and GO (graphene oxide) and then adsorption of HCrO4− by electrostatic attraction; (2) reduction of Cr(VI) on the solid surface to Cr(III) with the assistance of acidic groups, vast π system and phenolic groups on SMGO. These are summarized in Scheme 2.
3.4 Thermodynamic study
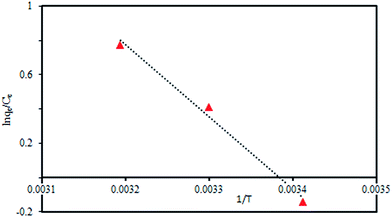
Thermodynamic parameters Gibbs free energy (ΔG), standard change in enthalpy (ΔH), and standard change in entropy (ΔS) were explored at 293, 313, and 333 K. eqn (6) and 7 shown below were used.
 | (6) |
| ΔG = −TΔS + ΔH | (7) |
Where T (in K) is the temperature of the system in Kelvin and R (8.3145 J mol−1 K−1) is the ideal gas constant.
The values for –ΔH/R and ΔS/R, which are equal to the slope and intercept of the straight line in Fig. 11, were obtained by plotting ln(qe/Ce) against 1/T. The corresponding thermodynamic parameters were also calculated and listed in Table 6. The positive ΔH value suggest that the adsorption process is endothermic, which is in accordance with the increasing adsorption as the temperature increases. The main cause of endothermic process is this fact that Cr(VI) is well-dissolved in water and hydration cover has to be broken down before its adsorption on SMGO hybrids. This dehydration process needs high temperature. It can be inferred that the endothermicity of desolvation process is higher than the enthalpy of adsorption to a considerable extent. With the increase of temperature the value of ΔG becomes more negative, which is a good sign of a spontaneous process. At high temperature, chromium is desolvated easily which made its adsorption more favorable. The positive value of ΔS indicates the fact that the degree of freedom increases at the solid-phase interface during the adsorption of Cr(VI) on SMGO hybrid. When adsorption occurs, Cr(VI) ions in solution which were surrounded by a highly ordered hydration layer come into close interaction with the hydration cover of SMGO and the order of water molecules are disturbed, resulting in the increased freedom of the system. However, the adsorption of Cr(VI) ions on SMGO may decrease the degree of freedom of system, but the entropy increase of water molecules surpasses the entropy decrease of Cr(VI) ions. It can be concluded that the adsorption of Cr(VI) on SMGO is an endothermic and spontaneous process. The thermodynamic parameters are related not only to the properties of sorbate but also to the properties of solid particles.42
| T (K) | ΔH (kJ mol−1) | ΔS (J mol−1 K−1) | ΔG (kJ mol−1) |
|---|---|---|---|
| 293 | 35.079 | 118.7144 | 2.976 |
| 303 | — | — | −0.891 |
| 313 | — | — | −2.779 |
3.5 The reusability of GO/Fe3O4/SO3H hybrids
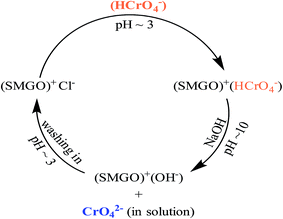
The stability and potential regeneration of SMGO were studied. The measured zeta potential of SMGO hybrid in pH = 3 (∼+34) confirms that these colloids are positively charged and therefore, they are very stable. As it was explained earlier, chromate ion (HCrO4−) could be adsorbed onto the positively charged SMGO surface through an electrostatic interaction. This clearly causes the surface of SMGO be saturated (occupied) and for reusing of adsorbent, it is necessary to wash out the adsorbed material from surface. Washing the used adsorbent with NaOH solution (pH ∼ 10) leads to the replacement of chromate with OH− ion at the surface of SMGO. This is shown in Fig. 9C which confirms the desorption process of chromate (as CrO42− in pH > 6) into the solution. On the other hand, in this pH (basic) the functional groups of surface of SMGO are as –SO3−, –O−, –COO− which are not suitable for reuse in adsorption of negatively charged HCrO4−. Therefore, an acid treatment process (stirring of recovered SMGO in a solution pH ∼ 3) is needed to regenerate positive surface before the next run of adsorption (Scheme 3).Several adsorption–desorption cycles were carried out and the recovery analyses were performed. The adsorption capacities of SMGO after recycling for Cr(VI) is illustrated in Fig. 12, which shows that only a slight loss in adsorption capacity can be seen after four consecutive cycles of adsorption–desorption. The results indicate that SMGO, as a good adsorbent, can be recycled in the removal of Cr(VI) ion from aqueous solution.
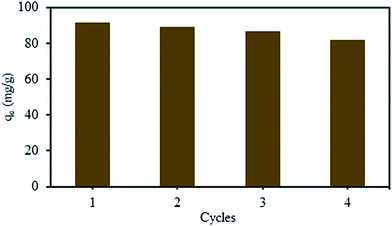 | ||
| Fig. 12 Recycling of SMGO for the adsorption of Cr(VI). The concentration of SMGO was 1.0 mg L−1, initial concentration of Cr(VI) = 100 mg L−1, temperature = 298 K, contact time = 60 min, pH = 3. | ||
4. Conclusions
Magnetic hybrid consisting of GO, Fe3O4, and sulphonic acid moiety (SMGO) were successfully prepared. The SMGO hybrid exhibited good water-dispersity, simple and rapid separation, high adsorption capacity for chromium removal in water due to the high surface area and the abundant of functional groups of adsorbent. The pseudo-second order kinetic model best describes the adsorption behavior of the Cr(VI) on SMGO. These materials exhibited remarkable adsorption capacity at relatively lower pH value solutions. Langmuir adsorption isotherm gave a good fit to the adsorption data with an adsorption capacity of 222.22 mg g−1. The adsorbed chromium could be effectively washed out from the sorbent into the solution using 2 M NaOH (2 mL) and the surface adsorption sites of SMGO reactivated by HCl (pH ∼ 3) washing process. This ensures the process to be economical and eco-friendly. The reusability of SMGO hybrid indicated that it could have great potential applications in removing metal ions from polluted water. Thermodynamic studies revealed that adsorption process is exothermic and spontaneous.Acknowledgements
The authors are grateful to Razi University and Melbourne University for their financial support for accomplishment of the work and providing necessary facilities. G. Abdi is also thankful to the Iran Nanotechnology Initiative Council (INIC) for their partial support on this project.References
- G. Liu, S. Gui, H. Zhou, F. Zeng, Y. Zhou and H. Ye, Dalton Trans., 2014, 43, 6977–6980 RSC.
- Q. Liu, Q. Liu, W. Ma, W. Liu, X. Cai and J. Yao, Colloids Surf., A, 2016, 511, 8–16 CrossRef CAS.
- M. Sahranavard, A. Ahmadpour and M. R. Doosti, Eur. J. Sci. Res., 2011, 58(3), 392–400 Search PubMed.
- G. Bayramoğlu and M. Y. Arıca, Sep. Purif. Technol., 2005, 45, 192–199 CrossRef.
- H. Faghihian and M. Rasekh, Iran. J. Chem. Chem. Eng., 2014, 33(1), 45–51 CAS.
- Y. Zeng, H. Woo, G. Lee and J. Park, Desalination, 2010, 257, 102–109 CrossRef CAS.
- N. Sankararamakrishnan, A. Dixit, L. Iyengar and R. Sanghi, Bioresour. Technol., 2006, 97, 2377–2382 CrossRef CAS PubMed.
- M. Tan, X. Liu, W. Li and H. Li, J. Chem. Eng. Data, 2015, 60(5), 1469–1475 CrossRef CAS.
- M. Yusuf, M. A. Khan, M. Otero, E. C. Abdullah, M. Hosomi, A. Terada and S. Riya, J. Colloid Interface Sci., 2017, 493, 51–61 CrossRef CAS PubMed.
- F. Zhang, Y. Song, S. Song, R. Zhang and W. Hou, ACS Appl. Mater. Interfaces, 2015, 7, 7251–7263 CAS.
- M. Liu, C. Chen, J. Hu, X. Wu and X. Wang, J. Phys. Chem. C, 2011, 115, 25234–25240 CAS.
- L. Cui, Y. Wang, L. Gao, L. Hu, L. Yan, Q. Wei and B. Du, Chem. Eng. J., 2015, 281, 1–10 CrossRef CAS.
- H. Wang, X. Yuan, Y. Wu, H. Huang, G. Zeng, Y. Liu, X. Wang, N. Lin and Y. Qi, Appl. Surf. Sci., 2013, 279, 432–440 CrossRef CAS.
- H. Wang, X. Yuan, G. Zeng, Y. Wu, Y. Liu, Q. Jiang and S. Gu, Adv. Colloid Interface Sci., 2015, 221, 41–59 CrossRef CAS PubMed.
- H. Wang, X. Yuan, Y. Wu, X. Chen, L. Leng, H. Wang, H. Li and G. Zeng, Chem. Eng. J., 2015, 262, 597–606 CrossRef CAS.
- X. Yang, X. Zhang, Y. Ma, Y. Huang, Y. Wang and Y. Chen, J. Mater. Chem., 2009, 19, 2710–2714 RSC.
- X. Yang, C. Chen, J. Li, G. Zhao, X. Ren and X. Wang, RSC Adv., 2012, 2, 8821–8826 RSC.
- H. Wang, X. Yuan, Y. Wu, H. Huang, X. Peng, G. Zeng, H. Zhong, J. Liang and M. Ren, Adv. Colloid Interface Sci., 2013, 195, 19–40 CrossRef PubMed.
- W. S. Hummers Jr and R. E. Offeman, J. Am. Chem. Soc., 1958, 80, 1339 CrossRef.
- J. Basett, R. Denney, G. Jerrery and J. Mendham, Vogel's Text Book of Quantitative Inorganic Analysis, Longman Group, England, 1986, pp. 1–6 Search PubMed.
- G. Liu, S. Gui, H. Zhou, F. Zeng, Y. Zhou and H. Ye, Dalton Trans., 2014, 43, 6977–6980 RSC.
- V. Chandra, J. Park, Y. Chun, J. W. Lee, I.-C. Hwang and K. S. Kim, ACS Nano, 2010, 4, 3979–3986 CrossRef CAS PubMed.
- S. M. Chackalackal and F. E. Stafford, J. Am. Chem. Soc., 1966, 88, 4815–4819 CrossRef CAS.
- X.-j. Hu, Y.-g. Liu, H. Wang, A.-w. Chen, G.-m. Zeng, S.-m. Liu, Y.-m. Guo, X. Hu, T.-t. Li and Y.-q. Wang, Sep. Purif. Technol., 2013, 108, 189–195 CrossRef CAS.
- K. Urbas, M. Aleksandrzak, M. Jedrzejczak, M. Jedrzejczak, R. Rakoczy, X. Chen and E. Mijowska, Nanoscale Res. Lett., 2014, 9, 1–12 CrossRef CAS PubMed.
- A. Alizadeh, M. M. Khodaei, M. Beygzadeh, D. Kordestani and M. Feyzi, Bull. Korean Chem. Soc., 2012, 33, 2546–2552 CrossRef CAS.
- A. Jorio, M. S. Dresselhaus, R. Saito and G. Dresselhaus, Raman spectroscopy in graphene related systems, John Wiley & Sons, 2011 Search PubMed.
- R. Voggu, B. Das, C. S. Rout and C. Rao, J. Phys.: Condens. Matter, 2008, 20, 472204 CrossRef.
- A. C. Ferrari and J. Robertson, Phys. Rev. B: Condens. Matter Mater. Phys., 2000, 61, 14095 CrossRef CAS.
- H. Iida, K. Takayanagi, T. Nakanishi and T. Osaka, J. Colloid Interface Sci., 2007, 314, 274–280 CrossRef CAS PubMed.
- A. Özcan, E. M. Öncü and A. S. Özcan, Colloids Surf., A, 2006, 277, 90–97 CrossRef.
- H. B. de Oliveira and F. Wypych, J. Solid State Chem., 2016, 243, 136–145 CrossRef.
- L. Wei, H. Zhang, Y. Dong, W. Song, X. Liu and Z. Zhao, RSC Adv., 2016, 6, 71375–71383 RSC.
- P. Guzel, Y. A. Aydın and N. Deveci Aksoy, Int. J. Environ. Sci. Technol., 2016, 13, 1277–1288 CrossRef CAS.
- N. Sahiner, S. Demirci, M. Sahiner and S. Yilmaz, J. Appl. Polym. Sci., 2016, 133(20), 43438 CrossRef.
- L. Li, C. Luo, X. Li, H. Duan and X. Wang, Int. J. Biol. Macromol., 2014, 66, 172–178 CrossRef CAS PubMed.
- D. Park, S.-R. Lim, Y.-S. Yun and J. M. Park, Bioresour. Technol., 2008, 99, 8810–8818 CrossRef CAS PubMed.
- Y. Wang, D. Liu, J. Lu and J. Huang, Colloids Surf., A, 2015, 481, 133–142 CrossRef CAS.
- T. Karthikeyan, S. Rajgopal and L. R. Miranda, J. Hazard. Mater., 2005, 124, 192–199 CrossRef CAS PubMed.
- H. Wang, X. Yuan, Y. Wu, G. Zeng, X. Chen, L. Leng, Z. Wu, L. Jiang and H. Li, J. Hazard. Mater., 2015, 286, 187–194 CrossRef CAS PubMed.
- B. Stanton, L. Zhu and C. Atwood, Experiments in General Chemistry: Featuring MeasureNet, Cengage Learning, 2009 Search PubMed.
- D. Shao, Q. Fan, J. Li, Z. Niu, W. Wu, Y. Chen and X. Wang, Microporous Mesoporous Mater., 2009, 123, 1–9 CrossRef CAS.
Footnote |
| † Electronic supplementary information (ESI) available. See DOI: 10.1039/c7ra01536d |
| This journal is © The Royal Society of Chemistry 2017 |

