 Open Access Article
Creative Commons Attribution 3.0 Unported Licence
Elucidation of adsorption processes at the surface of Pt(331) model electrocatalysts in acidic aqueous media†
Marcus D.
Pohl
a,
Viktor
Colic
a,
Daniel
Scieszka
ab and
Aliaksandr S.
Bandarenka
*ab
aPhysik-Department ECS, Technische Universität München, James-Franck-Straße 1, 85748 Garching, Germany. E-mail: bandarenka@ph.tum.de
bNanosystems Initiative Munich (NIM), Schellingstraße 4, 80799 Munich, Germany
First published on 29th February 2016
Abstract
The Pt(331) surface has long been known to be the most active pure metal electrocatalyst for the oxygen reduction reaction (ORR) in acidic media. Its activity is often higher than those known for the Pt-based alloys towards ORR, being comparable with the most active Pt3Ni(111), Pt3Y or Pt5Gd, and being more active than e.g. polycrystalline Pt3Ni. Multiple active sites at this surface offer adsorption energies which are close to the optimal binding energy with respect to the main ORR intermediates; nevertheless, the exact location of these sites is still not clear. Taking into account the unique surface geometry of Pt(331), some adsorbates (including some oxygenated ORR-intermediates) should also contribute to the electronic structure of the neighbouring catalytic centres. However, the experimental elucidation of the specific adsorption of oxygenated species at this surface appears to be a non-trivial task. Such information holds the keys to the understanding of the high activity of this material and would enable the rational design of nanostructured ORR catalysts even without alloying. In this work, the electrified Pt(331)/electrolyte interface has been characterised using cyclic voltammetry (CV) combined with potentiodynamic electrochemical impedance spectroscopy (PDEIS) in 0.1 M HClO4 solutions. The systems were studied in the potential region between 0.05 V and 1.0 V vs. RHE, where the adsorption of *H, *OH and *O species is possible in both O2-free and O2-saturated electrolytes. Our CV and PDEIS results support the hypothesis that in contrast to Pt(111), many Pt(331) surface sites are likely blocked by *O species at the polymer electrolyte membrane fuel cell benchmark potential of 0.9 V (RHE). We propose a model illustrated by simplified adsorbate structures at different electrode potentials, which is, however, able to explain the voltammetric and impedance data, and which is in good agreement with previously reported electrocatalytic measurements.
Introduction
The oxygen reduction reaction (ORR) is one of the fundamental reactions for the realization of a sustainable provision of renewable energy.1–13 It is, for instance, of extreme importance for the so-called polymer electrolyte membrane fuel cells (PEMFCs),2,6,14–16 where it takes place at the cathode2,4,17–19 and largely limits the fuel cells' performance.2,17–20 This is mainly because of the relatively slow kinetics of the ORR, even if state-of-the-art platinum cathode electrocatalysts are used.6,8,17–19,21–24 The ORR in PEMFCs normally proceeds through at least three adsorbed intermediates, *OOH, *O, and *OH, towards molecular water (* denotes the adsorbed species).4,14,20,23,25 The latter species are localized at specific catalytic centers on the surface. The nature, structure, electronic properties and relative surface abundance of these sites determine the observed activity, selectivity and stability of the catalytic materials.1,20 If these specific centers are identified, recent methodological advances and synthetic innovations would likely enable a relatively easy optimization of electro-catalysts.4,9,20,26,27 Alternatively, one would be able to create nanostructured materials with a maximal density of these centers at the surface.28–31 Therefore, single crystal surfaces, which offer a methodologically easier approach for the identification of active sites, are indispensable model objects on the way to a better understanding and optimization of nanostructured electrocatalysts.Platinum is one of only a few materials known to offer a good balance between high ORR activity, required selectivity, and stability in aggressive acidic media necessary for modern PEMFCs.1,4,25,32,33 According to state-of-the-art models, the high activity of Pt is possibly due to the fact that the adsorption energies of the main intermediates (mentioned above) at the surface are quite close to the optimum.34,35 These models also suggest that the most active sites are located at the Pt(111) facets, which bind e.g. *OH just ∼0.1 eV stronger than the optimal binding energy.4,20,36 The active sites themselves can be roughly localized and described as “on-top” adsorption sites at the Pt(111) surface.37–41 These models recently facilitated the discovery of a series of promising Pt-alloys and nanostructured materials to catalyze the ORR.27,36,42–46 However, there are some highly active materials which seemingly contradict the above-mentioned theories.7,47,48
Remarkably, the most active surface towards the ORR known to date is Pt(331), which can also be designated as Pt[3(111) × (111)], and belongs to the family of these “unusual” catalysts.20,48 The ORR activity of Pt(331) is ∼4.5 times better than that of Pt(111) at the PEMFC-benchmark electrode potential of 0.9 V (RHE), being more active than multiple Pt-alloy electrocatalysts.48 While fcc(331) is known to be a surface with an extremely high density of steps, it seems logical that the defects themselves and not the (111)-terraces are the most active sites, similar to some other electrocatalytic reactions.49–52 This contradicts the finding that a surface with an even higher density of steps, Pt(110), shows an ORR activity similar to that measured for Pt(111).7,20,47,48
The origin of these surprising experimental facts is still under debate. Several theoretical models have been elaborated based on explicit density functional theory (DFT) calculations (see e.g.ref. 53). Recently, it has been suggested that steps at platinum surfaces should likely be blocked by oxygenated species at “very early” electrode potentials.20,54 Most probably the blockage should occur after the desorption of underpotentially deposited hydrogen species in the range between ∼0.05 V and ∼0.4 V (RHE) in O2-free acidic electrolytes,4,20,54 although these assumptions remain somewhat controversial. Based on the former hypothesis and experimental data, it has been demonstrated that the observed trends in the activities of Pt[n(111) × (111)] and Pt[n(111) × (100)] can be explained within the existing theoretical framework.20 This is further supported by the hypothesis that the active sites are located at the (111) terraces.20,55 The (111) terraces of Pt(331) indeed provide almost optimal binding energy with respect to the ORR intermediates.20 However, it is not clear why the electronic structure at these terraces is so different compared to Pt(111). One of the possible explanations is that some adsorbates (even some oxygenated ORR-intermediates) likely contribute to the electronic structure of the neighbouring catalytic centres.
Nevertheless, the exact adsorbate structures developed at different electrode potentials relevant for PEMFC applications at Pt(331) surfaces are still not known. The main difficulty is that it has been so far impossible to visualize these structures in situ, in liquid electrolytes or at elevated temperatures using e.g. electrochemical scanning tunneling microscopy. One of the main reasons is that the intermediate species (for instance *OH) are mobile and are basically a part of the first H2O layer on the electrode.56–61 However, using other experimental techniques and some reference points, provided by numerous quantum chemistry calculations available in the literature, it might still be possible to develop a better understanding of these structures and their role in ORR electrocatalysis.
In this work we propose a model employing simplified adsorbate structures at different electrode potentials at the Pt(331) surface based on voltammetric and potentiodynamic electrochemical impedance spectroscopy data obtained in O2-free and O2-saturated HClO4 electrolytes. This model is capable of explaining the experimental results, and is in good agreement with previously reported electrocatalytic measurements.
Experimental
A bead-type Pt(331) crystal (icryst, Jülich, Germany) and a Pt(111) single crystal (5 mm in diameter, Mateck, Jülich, Germany) were used for all experiments. The crystals were flame-annealed using a butane–propane flame and cooled down in a mixture of 1000 ppm CO (4.7, Air Liquide, Germany) and Ar (5.0, Air Liquide, Germany). The status of the surface was assessed by characteristic voltammograms obtained in Ar-saturated HClO4 electrolytes.The electrochemical cell used in this work is described in detail in the ESI.† Before the experiments, all glassware was cleaned with a 3![[thin space (1/6-em)]](https://www.rsc.org/images/entities/char_2009.gif) :
:![[thin space (1/6-em)]](https://www.rsc.org/images/entities/char_2009.gif) 1 mixture of H2SO4 and H2O2 (both Suprapur, Merck, Germany) and subsequently rinsed multiple times with ultrapure water obtained from an Evoqua Ultra Clear 10 TWF 30 UV (Evoqua, Germany) water purification system. A VSP-300 potentiostat (Bio-Logic, France) was used to control all electrochemical measurements.
1 mixture of H2SO4 and H2O2 (both Suprapur, Merck, Germany) and subsequently rinsed multiple times with ultrapure water obtained from an Evoqua Ultra Clear 10 TWF 30 UV (Evoqua, Germany) water purification system. A VSP-300 potentiostat (Bio-Logic, France) was used to control all electrochemical measurements.
The working electrodes were introduced into the electrolytes under potential control at 0.05 V vs. RHE. Cyclic voltammetry (CV) was performed at a scan rate of 50 mV s−1 in Ar-saturated solutions (Ar 5.0, Air Liquide, Germany).
A mercury–mercurous sulfate electrode (MMS) (SI Analytics, Germany) was used as a reference electrode. It was kept in a separate compartment filled with 0.1 M HClO4 and separated from the working electrolyte by an ionically conducting ceramic insert. A polycrystalline Pt-wire was used as a counter electrode. All potentials in this paper are referenced to the RHE scale.
0.1 M HClO4 aqueous solutions were used as working electrolytes. They were prepared from 70% HClO4 (Suprapur, Merck, Germany), respectively, by diluting them with ultrapure water.
EIS measurements were performed in O2-free and O2-saturated (O2 5.0, Air Liquide, Germany) 0.1 M HClO4 electrolytes in the frequency range between 30 kHz and 10 Hz and a 10 mV amplitude of the probing signals. Issues related to modeling and fitting of large experimental EIS datasets are reported in detail elsewhere62 and also presented in the ESI.† The quality of the measured impedance spectra was evaluated using the “linear”63 and “logarithmic”64 Kramers–Kronig check procedures.
The output of the fitting procedure was controlled by the root-mean-square deviations and estimated individual parameter errors using the “EIS Data Analysis 1.0” software, in order to ensure the validity of the model and the correctness of the fitting, as described in detail elsewhere.65,66
Results
Cyclic voltammetry experiments
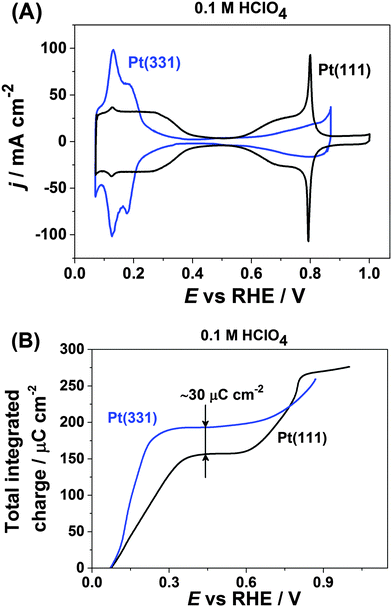
Fig. 1A shows the typical cyclic voltammograms of Pt(111) and Pt(331) in 0.1 M HClO4. For both electrodes one can distinguish two regions where pairs of reversible peaks appear. For the Pt(111) electrode, the well-known symmetrical peaks due to hydrogen adsorption and desorption at more negative potentials between ∼0.05 V and ∼0.4 V are visible. However, Pt(331) reveals different distribution of adsorption energies in that range. At more positive potentials OH-adsorption on Pt(111) manifests itself as a pair of the so-called “butterfly” peaks between ∼0.55 V and ∼0.9 V with sharp features at ∼0.8 V.67 In contrast, the Pt(331) CVs are featureless in that region, with wide but relatively small peaks.Integration of the respective anodic voltammetric currents (with the correction for the double layer capacitive current) reveals a difference in the charge of ∼30 μC cm−2. Pt(331) gives a charge of ∼190 μC cm−2 while Pt(111) gives a charge of only ∼160 μC cm−2 at the potentials of the anodic processes completed at the more negative potential region (Fig. 1B). However, at the key electrode potential of ∼0.9 V for PEMFC applications the net anodic charges obtained from the integration of both CVs appeared to be approximately similar, ∼280 μC cm−2.
Potentiodynamic impedance spectroscopy experiments
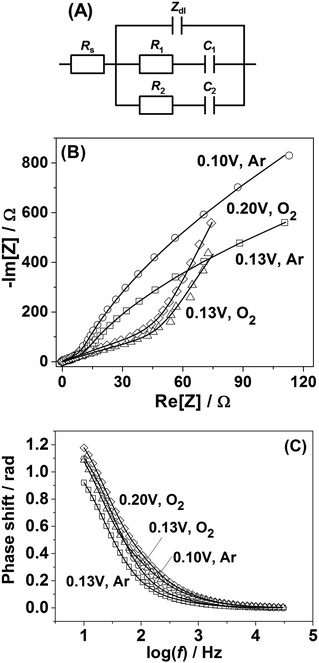
In order to shed further light on the origin of the difference in the adsorption behavior between Pt(111) and Pt(331) electrodes, PDEIS experiments68 were performed using Pt(331) surfaces. It is well known that impedance measurements cannot distinguish the double layer capacitance charging and the Faradaic processes in the region between 0.05 V and 0.4 V RHE for Pt(111) electrodes in acidic media using the common measurement schemes. Only in some cases it has been possible to do that, e.g., using very high frequencies and special equipment.69However, our impedance analysis (see the ESI,† Section S2, for further information about the equivalent electric circuit) shows that in the case of Pt(331) it is possible to distinguish several Faradaic adsorption processes with different time constants. Fig. 2A shows a schematic representation of a physical model (equivalent electric circuit), known for the reversible surface limited adsorption, used in this work (see ref. 70 and the ESI† for the detailed discussion of this model). It comprises three branches. The first branch consists of the impedance of the so-called constant phase element (CPE), Zdl = 1/Cdl′(jω)−ϕ, where Cdl′ is proportional to the double layer capacitance (Cdl), and ϕ is the exponent accounting for the frequency dispersion of the double layer (see detailed information related to this parameter in ref. 56). The other two branches consist of the series combination of the resistances of adsorption, Ri, and capacitances of adsorption, Ci. They account for slower adsorption processes with different time constants. An additional resistance was necessary in parallel to the double layer impedance to account for the oxygen reduction reaction in the oxygen saturated electrolytes, similar to the situation described in ref. 56, 71 and 72 (not shown in Fig. 2A). Rs stands for the uncompensated resistance.
It turned out that the model presented in Fig. 2A fits well with all the potentiodynamic impedance spectra obtained in this work. Fig. 2B and C show the typical examples of the impedance spectra of Pt(331) electrodes obtained in Ar-saturated and O2-saturated 0.1 M HClO4 electrolytes together with the fitting results.
Fig. 3 presents the dependencies of the parameters of the equivalent circuit (shown in Fig. 2A) on the electrode potential, which are of primary importance to elucidate the nature of adsorbates at the electrode surface. Those parameters are the capacitances of adsorption, designated as C1 (Fig. 3A) and C2 (Fig. 3B), as well as Cdl′ ≈ Cdl (Fig. 3C), which can be approximated as the double layer capacitance, as φ is relatively close to 1. While it is possible to extract additional information from φ(E) dependencies,56 we simplify the analysis to maintain the main focus of this work. The adsorption resistances are not considered, as they largely correlate with the respective capacitances and do not provide further necessary information for the current study. Therefore, only the adsorption capacitances will be used for further analysis.
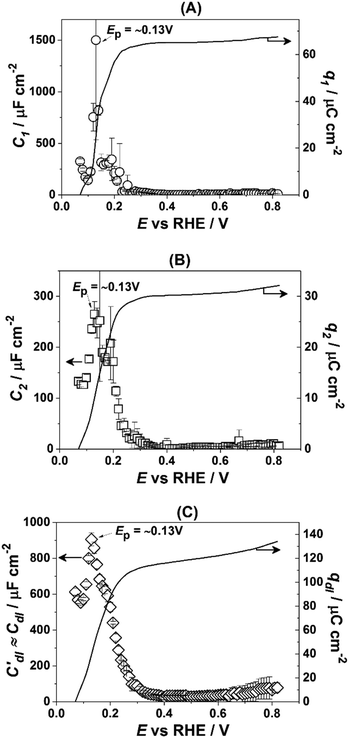 | ||
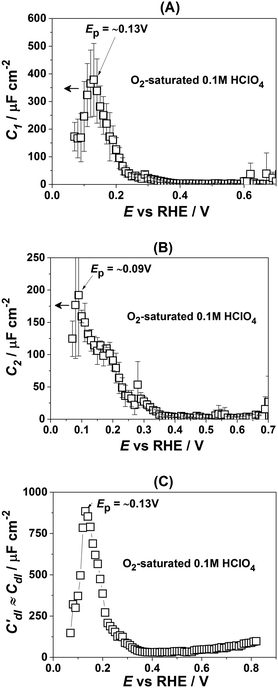
| Fig. 3 Dependencies of the parameters of the equivalent electric circuit shown in Fig. 2A. They reflect different adsorption processes at the Pt(331) surface in contact with 0.1 M HClO4. (A and B) Adsorption capacitances C1 and C2. (C) The “approximate” double layer capacitance which includes an unseparable contribution from the very fast underpotential deposition/desorption of hydrogen atoms. Solid lines represent the integrated charges obtained from the capacitance values. | ||
As can be seen in Fig. 3A, the adsorption capacitance C1 demonstrates a well-pronounced peak at ∼0.13 V with the value of ca 1500 μF cm−2. Integration of the C1(E) dependence between 0.07 V and 0.4 V gives the charge of ca. 60 μC cm−2.
Fig. 3B shows the dependence of another adsorption capacitance, C2(E), as a function of electrode potential. While the shape and the maximal values of this curve are drastically different when compared with C1(E), the peak position is exactly the same: ∼0.13 V. Integration of the C2(E) between 0.07 V and 0.4 V gives a charge of ∼30 μC cm−2, as shown in the figure.
Finally, the “approximate” double layer capacitance demonstrates unusually high values in the potential region between 0.07 V and 0.4 V with the peak at ∼0.13 V (Fig. 4C). The high values of this parameter are due to the fact that it is not possible to separate fast H-adsorption/desorption from the double layer response completely. Formal integration of this curve in this potential range gives values which are slightly above ∼110 μC cm−2. Thus the sum of the charges obtained from PDEIS measurements (60 + 30 + 110 = 200 μC cm−2) is very close to the voltammetric charge obtained from the CV in this range (∼190 μC cm−2). The slight differences are due to the fact that the CV data were corrected for the background.
However, in the above-presented data there are no direct indications of the adsorption processes with the adsorption capacitances C1 and C2. It is well accepted that ClO4− anions cannot be specifically adsorbed in this system. Therefore, both C1 and C2 can represent slower adsorption of hydrogen, or alternatively they can reveal the adsorption of *OH at two different types of sites. Finally, one of these capacitances can reveal *OH-adsorption while the other represents the slower adsorption of hydrogen. In order to assign the adsorption capacitances to the specific processes we use the previously documented fact56,71,72 that OH-adsorption on Pt is very sensitive to the presence of the dissolved O2 as *OH is also an intermediate in the ORR. In the presence of oxygen the OH-adsorption isotherms are shifted to more negative potentials.
Fig. 4 shows how the capacitance peaks change in O2-saturated 0.1 M HClO4. As can be seen from Fig. 4, in the presence of dissolved oxygen the dependencies of the observed parameters are different. While all three curves look slightly “depressed”, the positions of the main peaks in Fig. 4A and C remain the same. However, the position of the main peak in Fig. 4B is shifted by ∼40 mV towards more negative potentials. Thus, this peak in the C2(E) curve is highly sensitive to the presence of the molecular oxygen in the electrolyte.
Discussion
As mentioned above, the working hypothesis of this study is that at stepped Pt surfaces, particularly Pt(331), the steps are blocked by “oxygenated” species at the PEMFC critical potential of 0.9 V (RHE) influencing the electronic structure and the performance of the catalytic sites at the (111) facets. The data presented in the previous section in general confirm this hypothesis. It should be noted that the adsorption of oxygenated species, e.g. *OH, likely starts at the potentials close to 0.1 V (RHE). The first evidence of this is provided by cyclic voltammetry data. Formally, Pt(331) has approximately the same amount of adsorption sites as Pt(111). The only difference is that steps change the coordination number of some of the surface atoms leading to a non-uniform adsorption energy distribution along the surface. However, while it is well known that the maximal charge associated with adsorption/desorption of hydrogen atoms for Pt(111) terraces is ∼160 μC cm−2, the integrated charge in that potential region for Pt(331) is ∼30 μC cm−2 higher, both in perchloric and sulfuric acids. Assuming that the specific adsorption of perchlorate anions is unlikely on Pt-surfaces,56 this excessive charge can be associated with the specific adsorption/desorption of *OH from water.PDEIS data support the idea that the excessive charge of ∼30 μC cm−2 is due to adsorption of *OH in the potential range between 0.07 V and 0.4 V. In 0.1 M HClO4 using impedance analysis it was possible to distinguish at least two adsorption processes other than fast H-adsorption, which is indistinguishable from the double layer response (Fig. 3). Surprisingly, the integration of one of the associated capacitance dependencies (Fig. 3B), namely C2(E), gives approximately the same charge, ∼30 μC cm−2, which is observed as the additional one in the CV data. Furthermore, under the ORR conditions the peak in C2(E) is shifted towards more negative potentials (Fig. 4B). This behavior is typical in the case of adsorbed *OH as reported earlier,56,71,72 as *OH is also an ORR intermediate. Notably, the positions of the other peaks, which can therefore be associated with H-adsorption/desorption, are not affected by the molecular oxygen as it is not directly involved in these processes (Fig. 3A and C).
Thus, high values of Cdl(E) are associated with a very fast adsorption of hydrogen, C1 represents a slower adsorption of hydrogen at different types of sites and C2 accounts for the OH-adsorption.
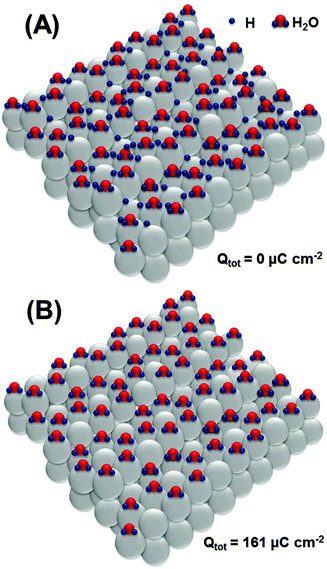
Based on the obtained data, it is now important to elucidate possible adsorbate structures, involving *H, *OH and also *O, explaining the main impedance and voltammetric features in all potential regions used in this work. We start with the most probable structure at the surface of Pt(111) (Fig. 5A). The existence of ordered superstructures consisting of surface water and adsorbed *H species is supported by DFT calculations;73 however, we use it for Pt(331) as the first approximation, as it can be affected by different coordinations at steps on the Pt[3(111) × (111)] surface.
Oxidation of the adsorbed hydrogen corresponds to the charge of ∼161 μC cm−2, as shown in Fig. 5B.
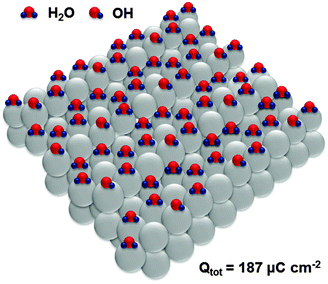
Adsorption sites on the steps of Pt(331) are the “weakest links” towards oxidation, which is equivalent in this system to the adsorption of oxygenated species. Interestingly, oxidation of H2O molecules at steps of every third atom (Fig. 6) is equivalent to the total anodic charge equal to ∼187 μC cm−2, i.e. very close to the charge measured by CV within the relevant potential region (∼190 μC cm−2). Accordingly, we hypothesize that structures close to those shown in Fig. 6 exist at the potential of ca 0.4 V (RHE).
Further oxidation would involve the second row of platinum atoms on the Pt(111) facets. Again, we hypothesize that oxidation starts at every third platinum atom as schematically shown in Fig. 7A, leading to the formation of an OH-layer with simultaneous oxidation of *OH at steps to *O. The formation of the structure shown in Fig. 7A corresponds to the total anodic charge of ∼241 μC cm−2. Interestingly, this charge was obtained by integration of the CV shown in Fig. 1 at the potential of ca 0.8 V (RHE), where the onset of a new oxidation wave can be seen.
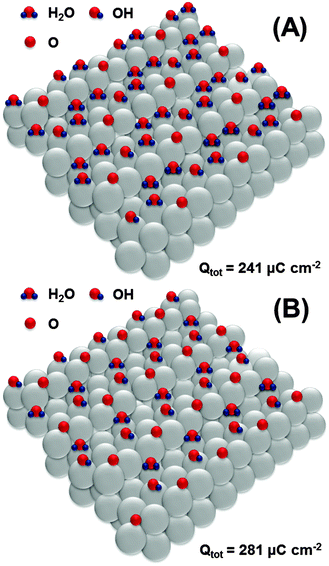 | ||
| Fig. 7 Proposed adsorbate structures at the Pt(331) electrode surface developed at the potentials between 0.8 V and 0.9 V (RHE). | ||
Finally, at the potential of ∼0.9 V, the integrated anodic charge from the voltammograms is ∼280 μC cm−2. This might correspond to the structure shown in Fig. 7B, with a slightly increased coverage of *O and *OH at the steps and terraces, respectively.
While the proposed structures presented in Fig. 5–7 are largely hypothetical, as there are unfortunately no straightforward means to directly visualize the real adsorbate structures in situ, they can explain CV and PDEIS data with a high accuracy. Nevertheless, the main results of the combined CV and PDEIS studies are that *OH adsorption at Pt(331) starts as early as 0.1 V (RHE) and that at the potential of 0.9 V, critical for PEMFC applications, all the steps are indeed blocked by *O. This provides further evidence that the active sites for the ORR are located at (111) terraces,20,55 which confirms earlier hypotheses and previous theoretical studies showing that the (111) terraces are responsible for the high activity of many extended Pt surfaces and some “normal shape” convex nanoparticles. This provides a direct input to the theoretical modelling, which can involve quantum chemistry calculations, as well as to future combined theoretical and experimental studies: adsorbed *O at the surface of non-uniform ORR electrocatalysts with a significant number of under-coordinated sites should be taken into account. Our experiment with the Pt(331) surface, where only a few types of “on-top” sites exist, shows that immobile *O at steps likely and largely contributes to the high activity of Pt(331), as each atomic raw meets the atomic raw with the adsorbed *O at (111) terraces (where the active sites should be located). This is the main difference between the status of Pt(111) and Pt(331) surfaces at the benchmark potentials close to 0.9 V RHE.
Conclusions
Combined CV and PDEIS studies confirm that OH-adsorption on the most active Pt ORR electrocatalysts in acidic media, Pt(331), starts as early as at ca. 0.1 V (RHE). At the key electrode potential of 0.9 V (RHE) for PEMFC applications, almost all the step sites are blocked by the adsorbed *O. This fact supports the hypothesis that the most active sites for the ORR should be located at the (111) terraces. Moreover, *O should largely contribute to the high activity of the (111) terraces. Further investigations, for instance, explicit calculations using density functional theory, are necessary to identify the exact locations and properties of the resulting catalytic sites at the these terraces.Notes and references
- M. Winter and R. J. Brodd, Chem. Rev., 2004, 104, 4245 CrossRef CAS PubMed.
- Fuel Cell Catalysis: A Surface Science Approach, ed. M. Koper, John Wiley & Sons, Inc., Hoboken, 2008 Search PubMed.
- X. Yu and S. Ye, J. Power Sources, 2007, 172, 145 CrossRef CAS.
- I. E. L. Stephens, A. S. Bondarenko, U. Grønbjerg, J. Rossmeisl and I. Chorkendorff, Energy Environ. Sci., 2012, 5, 6744 CAS.
- Y. Nie, L. Li and Z. Wei, Chem. Soc. Rev., 2015, 44, 2168 RSC.
- A. Rabis, P. Rodriguez and T. J. Schmidt, ACS Catal., 2012, 2, 864 CrossRef CAS.
- A. Hitotsuyanagi, M. Nakamura and N. Hoshi, Electrochim. Acta, 2012, 82, 512 CrossRef CAS.
- H. A. Gasteiger, S. S. Kocha, B. Sompalli and F. T. Wagner, Appl. Catal., B, 2005, 56, 9 CrossRef CAS.
- V. R. Stamenkovic, B. Fowler, B. S. Mun, G. Wang, P. N. Ross, C. A. Lucas and N. M. Markovic, Science, 2007, 315, 493 CrossRef CAS PubMed.
- F. Calle-Vallejo, M. T. M. Koper and A. S. Bandarenka, Chem. Soc. Rev., 2013, 42, 5210 RSC.
- A Handbook of Fuel Cells, Fundamentals Technology and Applications, ed. W. Vielstich, A. Lamm and H. Gasteiger, Wiley, West Sussex, 2003 Search PubMed.
- Catalysis in Electrochemistry: From Fundamental Aspects to Strategies for Fuel Cell Development, ed. E. Santos and W. Schmickler, John Wiley & Sons, New Jersey, 2015 Search PubMed.
- A. M. Gómez-Marín and J. M. Feliu, Catal. Today, 2015, 244, 172 CrossRef.
- A. U. Nilekar and M. Mavrikakis, Surf. Sci., 2008, 602, L89 CrossRef CAS.
- Y. Wang, K. S. Chen, J. Mishler, S. C. Cho and X. C. Adroher, Appl. Energy, 2011, 88, 981 CrossRef CAS.
- M. Watanabe, D. A. Tryk, M. Watsisaka and H. Yanom H. Uchida, Electrochim. Acta, 2012, 84, 187 CrossRef CAS.
- H. A. Gasteiger and N. M. Markovic, Science, 2009, 324, 48 CrossRef CAS PubMed.
- M. K. Debe, Nature, 2012, 486, 43 CrossRef CAS PubMed.
- M. H. Shao, K. Shoemaker, A. Peles, K. Kaneko and L. Protsailo, J. Am. Chem. Soc., 2010, 132, 9253 CrossRef CAS PubMed.
- A. S. Bandarenka, H. A. Hansen, J. Rossmeisl and I. E. L. Stephens, Phys. Chem. Chem. Phys., 2014, 16, 13625 RSC.
- PEM Fuel Cell Electrocatalysts and Catalyst Layers, ed. J. Zhang, Springer London, London, 2008 Search PubMed.
- N. M. Markovic and P. N. Ross, Electrochim. Acta, 2000, 45, 4101 CrossRef CAS.
- Z. Duan and G. Wang, Phys. Chem. Chem. Phys., 2011, 13, 20178 RSC.
- J. Larminie and A. L. Dicks, Fuel Cell Systems Explained, John Wiley and Sons Inc., Hoboken, NJ, 2nd edn, 2003 Search PubMed.
- A. S. Bandarenka and M. T. M. Koper, J. Catal., 2013, 308, 11 CrossRef CAS.
- J. Greeley and J. K. Nørskov, J. Phys. Chem. C, 2009, 113, 4932 CAS.
- J. B. Henry, A. Maljusch, M. Huang, W. Schuhmann and A. S. Bondarenko, ACS Catal., 2012, 2, 1457 CrossRef CAS.
- D. Li, C. Wang, D. S. Strmcnik, D. V. Tripkovic, X. Sun, Y. Kang, M. Chi, J. D. Snyder, D. van der Vliet, Y. Tsai, V. R. Stamenkovic, S. Sun and N. M. Markovic, Energy Environ. Sci., 2014, 7, 4061 CAS.
- A. J. Appleby, Catal. Rev., 1970, 4, 221 CAS.
- K. Kinoshita, Electrochemical Oxygen Technology, Wiley, New York, 1992 Search PubMed.
- Y. Dai and S. Chen, ACS Appl. Mater. Interfaces, 2015, 7, 823 CAS.
- V. R. Stamenkovic, B. Simon Mun, K. J. J. Mayrhofer, P. N. Ross and N. M. Markovic, J. Am. Chem. Soc., 2006, 128, 8813 CrossRef CAS PubMed.
- O. T. Holton and J. W. Stevenson, Platinum Met. Rev., 2013, 57, 259 CrossRef.
- J. K. Nørskov, J. Rossmeisl, A. Logadottir, L. Lindqvist, J. R. Kitchin, T. Bligaard and H. Jónsson, J. Phys. Chem. B, 2004, 108, 17886 CrossRef.
- Fuel Cell Technology Handbook, ed. G. Hoogersy, CRC Press, Boca Raton, 2002 Search PubMed.
- J. Greeley, I. E. L. Stephens, A. S. Bondarenko, T. P. Johansson, H. A. Hansen, T. F. Jaramillo, J. Rossmeisl, I. Chorkendorff and J. K. Nørskov, Nat. Chem., 2009, 1, 552 CrossRef CAS PubMed.
- L. M. C. Pinto, P. Quaino, M. D. Arce, E. Santos and W. Schmickler, ChemPhysChem, 2014, 15, 2003 CrossRef CAS PubMed.
- G. S. Karlberg, Phys. Rev. B, 2006, 74, 153414 CrossRef.
- A. Michaelides and P. Hu, J. Am. Chem. Soc., 2001, 123, 4235 CrossRef CAS PubMed.
- A. Michaelides and P. Hu, J. Chem. Phys., 2001, 114, 513 CrossRef CAS.
- F. Calle-Vallejo, J. Tymoczko, V. Colic, Q. H. Vu, M. D. Pohl, K. Morgenstern, D. Loffreda, P. Sautet, W. Schuhmann and A. S. Bandarenka, Science, 2015, 350, 185 CrossRef CAS PubMed.
- P. Strasser, S. Koh, T. Anniyev, J. Greeley, K. More, C. Yu, Z. Liu, S. Kaya, D. Nordlund, H. Ogasawara, M. F. Toney and A. Nilsson, Nat. Chem., 2010, 2, 454 CrossRef CAS PubMed.
- V. Stamenkovic, B. S. Mun, K. J. J. Mayrhofer, P. N. Ross, N. M. Markovic, J. Rossmeisl, J. Greeley and J. K. Norskov, Angew. Chem., Int. Ed., 2006, 45, 2897 CrossRef CAS PubMed.
- M. Escudero-Escribano, A. Verdaguer-Casadevall, P. Malacrida, U. Grønbjerg, B. P. Knudsen, A. K. Jepsen, J. Rossmeisl, I. E. L. Stephens and I. Chorkendorff, J. Am. Chem. Soc., 2012, 134, 16476 CrossRef CAS PubMed.
- C. Zhang, S. Y. Hwang and Z. Peng, J. Mater. Chem. A, 2014, 2, 19778 CAS.
- Y. Takesue, M. Nakamura and N. Hoshi, Phys. Chem. Chem. Phys., 2014, 16, 13774 RSC.
- T. Rurigaki, A. Hitotsuyanagi, M. Nakamura, N. Sakai and N. Hoshi, J. Electroanal. Chem., 2014, 716, 58 CrossRef CAS.
- A. Kuzume, E. Herrero and J. M. Feliu, J. Electroanal. Chem., 2007, 599, 333 CrossRef CAS.
- N. P. Lebedeva, A. Rodes, J. M. Feliu, M. T. M. Koper and R. A. van Santen, J. Phys. Chem. B, 2002, 106, 9863 CrossRef CAS.
- N. P. Lebedeva, M. T. M. Koper, J. M. Feliu and R. A. van Santen, J. Phys. Chem. B, 2002, 106, 12938 CrossRef CAS.
- J. L. Gland and V. N. Korchak, Surf. Sci., 1978, 75, 733 CrossRef CAS.
- G. García and M. T. M. Koper, J. Am. Chem. Soc., 2009, 131, 5384 CrossRef PubMed.
- J. Yue, Z. Du and M. Shao, J. Phys. Chem. Lett., 2015, 6, 3346 CrossRef CAS PubMed.
- M. J. T. C. van der Niet, N. Garcia-Araez, J. Hernández, J. M. Feliu and M. T. M. Koper, Catal. Today, 2013, 202, 105 CrossRef CAS.
- J. Greeley, J. Rossmeisl, A. Hellman and J. K. Nørskov, Z. Phys. Chem., 2007, 221, 1209 CrossRef CAS.
- A. S. Bondarenko, I. E. L. Stephens, H. A. Hansen, F. J. Perez-Alonso, V. Tripkovic, T. P. Johansson, J. Rossmeisl, J. K. Nørskov and I. Chorkendorff, Langmuir, 2011, 27, 2058 CrossRef CAS PubMed.
- G. A. Kimmel, N. G. Petrik, Z. Dohnalek and B. D. Kay, Phys. Rev. Lett., 2005, 95, 166102 CrossRef PubMed.
- K. J. P. Schouten, M. J. T. C. van der Niet and M. T. M. Koper, Phys. Chem. Chem. Phys., 2010, 12, 15217 RSC.
- E. Codorniu-Hernandez and P. G. Kusalik, J. Am. Chem. Soc., 2012, 134, 532 CrossRef CAS PubMed.
- A. Picolin, C. Busse, A. Redinger, M. Morgenstern and T. Michely, J. Phys. Chem. C, 2009, 113, 691 CAS.
- N. M. Markovic and P. N. Ross, Surf. Sci. Rep., 2002, 45, 117 CrossRef CAS.
- A. S. Bondarenko, Anal. Chim. Acta, 2012, 743, 41 CrossRef CAS PubMed.
- B. A. Boukamp, J. Electrochem. Soc., 1995, 142, 1885 CrossRef CAS.
- C. A. Schiller, F. Richter, E. Gülzow and N. Wagner, Phys. Chem. Chem. Phys., 2001, 3, 374 RSC.
- B. B. Berkes, A. Maljusch, W. Schuhmann and A. S. Bondarenko, J. Phys. Chem. C, 2011, 115, 9122 CAS.
- B. B. Berkes, J. B. Henry, M. Huang and A. S. Bondarenko, ChemPhysChem, 2012, 13, 3210 CrossRef CAS PubMed.
- V. Climent, N. M. Markovic and P. N. Ross, J. Phys. Chem. B, 2000, 104, 3116 CrossRef CAS.
- G. A. Ragoisha and A. S. Bondarenko, Electrochim. Acta, 2005, 50, 1553 CrossRef CAS.
- E. Sibert, R. Faure and R. Durand, Electrochem. Commun., 2001, 3, 181 CrossRef CAS.
- B. B. Berkes, G. Inzelt, W. Schuhmann and A. S. Bondarenko, J. Phys. Chem. C, 2012, 116, 10995 CAS.
- A. S. Bondarenko, I. E. L. Stephens, L. Bech and I. Chorkendorff, Electrochim. Acta, 2012, 82, 517 CrossRef CAS.
- J. Tymoczko, V. Colic, A. S. Bandarenka and W. Schuhmann, Surf. Sci., 2015, 631, 81 CrossRef CAS.
- E. Skulason, V. Tripkovic, M. E. Björketun, S. Gudmundsdottir, G. Karlberg, J. Rossmeisl, T. Bligaard, H. Jonsson and J. K. Nørskov, J. Phys. Chem. C, 2010, 114, 18182 CAS.
Footnote |
| † Electronic supplementary information (ESI) available: Further experimental details and supporting experimental data. See DOI: 10.1039/c5cp08000b |
| This journal is © the Owner Societies 2016 |

