 Open Access Article
Creative Commons Attribution 3.0 Unported Licence
Characterisation of the solid electrolyte interface during lithiation/delithiation of germanium in an ionic liquid
Abhishek
Lahiri
*,
Natalia
Borisenko
,
Andriy
Borodin
,
Mark
Olschewski
and
Frank
Endres
*
Institute of Electrochemistry, Clausthal University of Technology, Arnold Sommerfeld str 6, 38678, Clausthal-Zellerfeld, Germany. E-mail: abhishek.lahiri@tu-clausthal.de; frank.endres@tu-clausthal.de
First published on 22nd January 2016
Abstract
In this paper, we present investigations of the interface of electrodeposited Ge during lithiation/delithiation in the ionic liquid 1-butyl-1-methylpyrrolidinium bis(trifluoromethylsulfonyl)imide containing 0.5 M lithium bis(trifluoromethylsulfonyl)imide (LiTFSI/[Py1,4]TFSI). Cyclic voltammetry (CV) and infrared spectroscopy were used to study the electrochemistry and the changes in the electrolyte during the Li intercalation/deintercalation processes. From infrared spectroscopic analysis, it was found that the TFSI− anion decomposes during the lithiation process, resulting in the formation of a solid–liquid interface (SEI) layer. X-ray photoelectron spectroscopy was used to analyse the composition of the SEI layer and the changes in the electrodeposited germanium. Furthermore, atomic force microscopy (AFM) was used to evaluate the changes in the SEI layer which showed that the SEI layer was inhomogenous and changed during the lithiation/delithiation processes.
Introduction
In recent years, lithium ion batteries (LIBs) have gained a lot of attention and are being used as energy storage devices.1–3 To meet the current demands, high capacity electrodes with highly stable cyclability have become important. In the last two decades carbon has been used as a negative electrode which gives a moderate specific capacity of 372 mA h g−1.4,5 Silicon and germanium nanostructures also have gained a lot of attention due to their high specific capacity (4200 mA h g−1 for Li4.4Si, 1600 mA h g−1 for Li4.4Ge).6,7 Both silicon and germanium undergo a large volume change during lithium intercalation. To reduce these volume changes nanostructures especially in the form of nanowires and nanotubes are beneficial.6 However, cycle life greater than a few hundred cycles has not yet been demonstrated which is also due to the instability of the solid electrolyte interface (SEI).8,9 Presently, carbonate electrolytes with LiPF6 or LiTFSI are used for LIBs.10 The organic electrolytes are usually inflammable thereby limiting the usage of batteries at higher temperatures. Furthermore, it has been shown that there is a chemical reaction between the electrode (example Si) and the organic electrolyte/LiPF6 which hampers the specific capacity.11In comparison, ionic liquids provide a large electrochemical window and they do not ignite as easily as volatile organic solvents. Also the decomposition temperature of ionic liquids is relatively high making them promising electrolytes for LIBs.12,13 In the last decade, ionic liquid electrolytes have been extensively studied in LIB systems. Lewandowski and Świderska-Mocek have reviewed a range of ionic liquids with additives that can be potentially used as electrolytes in LIBs.13 However, most of the studies have been based on using graphite as a negative electrode. The main concern in graphite electrodes is the irreversibility due to the intercalation of [Py1,n]+ cations along with Li+ ions.14 Other negative electrodes such as TiO2, lithium metal, aluminium and silicon have shown better compatibility with ionic liquid electrolytes.12,15–19 With TiO2 electrodes, it was shown that ionic liquids based on [Py1,n]+ ions are stable at an elevated temperature of 120 °C.12 The lithium metal electrode in ionic liquids was characterised using spectroscopic and electrochemical techniques. It was shown that the SEI layer was primarily made up of decomposition products of the TFSI− anion.15 X-ray photoelectron spectroscopy showed the formation of compounds such as Li2O, LiOH, Li2S2O4, LiyC2Fxetc.15 Al macroporous structures and Al nanowires, both grown by electrodeposition, showed good mechanical stability over 50 cycles in a LiTFSI based ionic liquid.16,17 However, no further investigations into the electrochemistry or the composition of the SEI layer were performed. Nguyen et al.18,19 recently studied the interfacial processes on the Si–Cu electrode in ionic liquids using XPS and FTIR. From their analysis, they found that during initial charging the TFSI anion decomposes leading to the formation of LiF and Si–F type compounds.19
Compared to the silicon matrix in a Li ion battery, the diffusivity of Li in Ge is 400 times faster.7 Therefore, studying the interfacial processes on a Ge electrode in an ionic liquid electrolyte for LIBs is of interest. To date, most of the research has been done on developing Ge negative electrodes using vacuum techniques.7,20,21 Our group has already shown the feasibility of developing Ge thin films, macroporous structures, nanowires and nanotubes by electrodeposition from ionic liquids.22–25
In this paper, we have characterised electrodeposited Ge thin film electrodes. The interfacial processes and the formation of the SEI layer were characterised using cyclic voltammetry, scanning electron microscopy (SEM), energy dispersive X-ray (EDX), atomic force microscopy (AFM) and X-ray photoelectron spectroscopy (XPS) analyses after various lithiation/delithiation processes. Correspondingly, the changes in the ionic liquid were also evaluated using infrared spectroscopy. AFM force-distance experiments were also performed to understand the mechanical properties of the SEI layer and the changes in the layer during lithiation/delithiation processes.
Experimental
[Py1,4]TFSI was purchased in the highest available quality from Io-Li-Tec (Germany) and was used after drying under vacuum at 100 °C to remove the water content to below 2 ppm. GeCl4 (99.9999%) was purchased from Alfa Aesar. The working electrode in the experiment was a copper plate. Prior to experiments, the copper plate was cleaned in isopropanol and acetone to remove any surface contamination. Platinum and silver wires were used as a counter and a quasi-reference electrode, respectively, which gave good stability in the ionic liquid throughout the experiments. The electrochemical cell was made of Teflon and clamped over a Teflon-covered Viton O-ring onto the substrate, yielding a geometric surface area of 0.3 cm2. Prior to experiments, the Teflon cell and the O-ring were cleaned in a mixture of 50![[thin space (1/6-em)]](https://www.rsc.org/images/entities/char_2009.gif) :
:![[thin space (1/6-em)]](https://www.rsc.org/images/entities/char_2009.gif) 50 vol% of concentrated H2SO4 and H2O2 (35%) followed by refluxing in distilled water.
50 vol% of concentrated H2SO4 and H2O2 (35%) followed by refluxing in distilled water.
The electrochemical measurements were performed in an argon-filled glove box with water and oxygen contents below 2 ppm (OMNI-LAB from Vacuum Atmospheres) by using a VersaStatt II (Princeton Applied Research) potentiostat/galvanostat controlled by powerCV and power-step software. The scan rate during cyclic voltammetry was 10 mV s−1 unless otherwise stated. The deposits obtained by constant potential deposition were characterized using scanning electron microscopy (SEM, Carl Zeiss DSM 982 Gemini) and energy dispersive X-ray spectroscopy (EDX). The samples for SEM were transferred in air.
For germanium deposition, constant potential deposition was performed for 30 minutes. After electrodeposition, the remaining ionic liquid in the cell was removed and the electrodeposited germanium was cleaned with pure ionic liquid inside of the glove box. For testing the electrodeposited Ge electrode for lithium cycling, the Ag and Pt wires in the electrochemical cell were replaced by lithium which acted both as a reference and a counter electrode. 0.5 M LiTFSI in [Py1,4]TFSI ionic liquid was used as the electrolyte. After CV and charge–discharge cycles, the electrodeposited Ge was washed in dimethyl carbonate (DMC) to remove the remaining ionic liquid.
For XPS measurements, the samples were transferred directly from the glove box into the XPS equipment using a special transfer chamber to limit any oxidation of the sample. The spectra were obtained using an ultrahigh vacuum (UHV) apparatus with a base pressure below 1 × 10⁻¹⁰ Pa. The sample was irradiated using the Al Kα line (a photon energy of 1486.6 eV) of a non-monochromatic X-ray source (Omicron DAR 400). Electrons emitted were detected using a hemispherical analyzer (Omicron EA125) under an angle of 45° to the surface normal. All XPS spectra were displayed as a function of the binding energy with respect to the Fermi level.
Fourier transform infrared spectroscopy (VERTEX 70 V, Bruker Optics GmbH) was used to characterise the electrolyte before and after the experiments to understand the changes in the ionic liquid.
Results and discussion
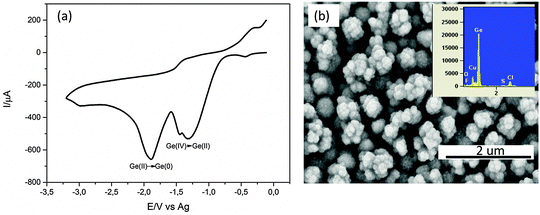
Fig. 1a shows one cyclic voltammetry cycle of 0.25 M GeCl4 on the Cu substrate. Two reduction peaks are observed in the cathodic regime. The first peak at −1.4 V is the reduction of Ge(IV) to Ge(II) species and the second peak at −1.9 V is the reduction of Ge(II) to Ge(0). A kink is also observed at −1.5 V here whose assignment to a reduction process is difficult. In the anodic regime, a slight increase in current is observed at −0.5 V which could be the oxidation of the electrodeposited Ge.The CV was stopped at the former open circuit potential (OCP) to limit the oxidation/dissolution of the Cu substrate. Upon constant potential deposition at −1.9 V for 30 minutes, a black deposit was observed. The SEM of the deposit is shown in Fig. 1b. Agglomerates of about 300 nm in size are evident which are made up of smaller Ge nanoparticles in the range of 10–40 nm.26 The EDX of the deposit shows prominent peaks of Ge and Cu. Impurities such as Cl, S and O are also observed. Cl and S are due to the remaining ionic liquid in the deposit and O is due to the partial oxidation of Ge during the transfer to the SEM.
To test the electrodeposited Ge for lithium alloying/dealloying, constant potential electrodeposition on Cu was performed at −1.9 V for 30 minutes. Li deposition and stripping cycles were subsequently performed on the electrodeposited Ge from 0.5 M LiTFSI. The CV of 0.5 M LiTFSI–[Py1,4]TFSI is shown in Fig. 2a. In the first cycle, a reduction peak at 1.25 V is seen which could be the underpotential deposition of Li. Another broad reduction process is observed at 0.5 V and might correspond to the formation of a SEI layer on the electrodeposited Ge. Below 0.25 V a negative increase in current is observed and can be attributed to the intercalation of Li and the formation of a LixGe1−x compound.
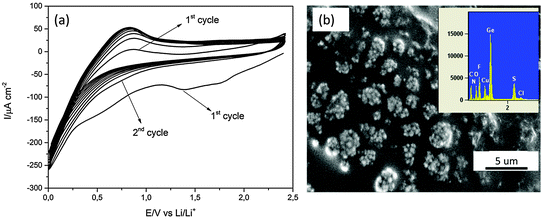 | ||
| Fig. 2 (a) CV cycles of 0.5 M LiTFSI–[Py1,4]TFSI on the electrodeposited Ge. The scan rate was 5 mV s−1, (b) the morphology of Ge after 10 CV cycles. The inset shows the EDX of the electrodeposit. | ||
In the second CV cycle and all consecutive cycles, no reduction peak at 1.25 V is noted. Only an increase in negative current from ∼0.75 V is observed which can be attributed to the formation of a LixGe1−x compound. The morphology of the electrodeposited Ge after 10 CV cycles looks different (Fig. 2b) compared to the electrodeposited Ge shown in Fig. 1b. The formation of a layer is observed in the SEM in Fig. 2b compared to the germanium nanoparticles observed in Fig. 1b, partly made up of ionic liquid. The EDX in the inset shows elements of Ge, Cu, S, F, O, N and C.
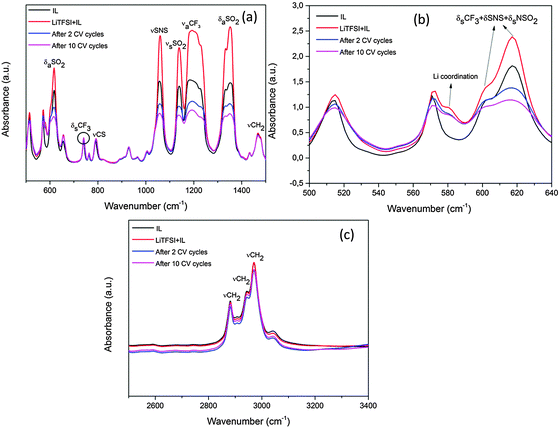
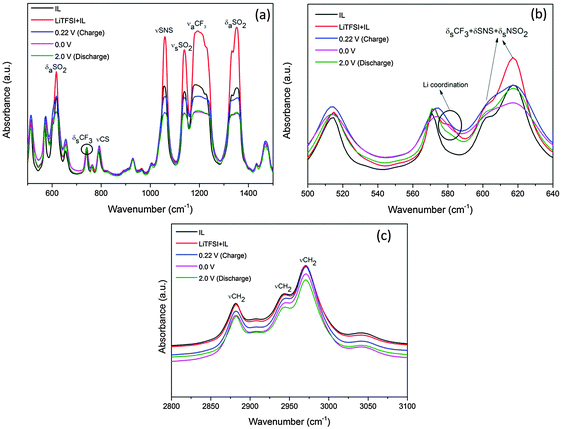
Additionally, the ionic liquid after 2 and 10 CV cycles was characterised using FTIR. Fig. 3 shows the mid-infrared spectra of the IL before and after the CV cycles. The mid-infrared spectra of IL (black line) in Fig. 3a between 500 and 1500 cm−1 show distinct peaks of the various CF3, SNS and SO2 stretching modes from the TFSI− anion and are consistent with the literature.15
Upon addition of LiTFSI to the ionic liquid (red line, Fig. 3a and b), a shoulder arises at 581 cm−1 and an increase in the peak intensities for SNS, OSO and CF3 groups is observed which is related to the formation of conformers.27 After two CV cycles (blue line) the intensity of the CF3, SNS and SO2 peaks decreases between 1000 and 1400 cm−1. Such a decrease in the peak intensities has been related to the decomposition of the TFSI− anion in the ionic liquid.28,29 Furthermore, between 500 and 640 cm−1 in Fig. 3b, certain changes are noted at 601 and 618 cm−1 after 2 and 10 CV cycles. The 601 cm−1 peak has been related to the C1 conformer of TFSI whereas 618 cm−1 is related to the C2 conformer.27 From Fig. 3b, it is clear that during CV cycling the C1 conformer related to the bending modes of CF3, SNS and NSO2 is affected during the decomposition of TFSI and merges with the C2 conformer peak after 10 CV cycles. A slight decrease in the Li coordination at 581 cm−1 is also seen which indicates the formation of some Li compounds with the decomposed TFSI in the SEI layer. Furthermore there might be some decomposed products which do not absorb IR light and therefore could not be observed in the spectra. Upon increasing the number of CV cycles to 10 (pink line), a further decrease in the peak intensities in the TFSI− anions is observed which suggests that the TFSI− anion continues to decompose with an increase in the number of CV cycles. The IR spectra in the range between 2800 and 3100 cm−1 (Fig. 3c) show peaks of [Py1,4]+ of the ionic liquid. From the IR spectra, it is evident that there is no dramatic decrease in the peak intensities of γCH2 after CV cycles compared to LiTFSI–[Py1,4]TFSI (red line), which indicates that [Py1,4]+ is relatively stable during the CV cycles.
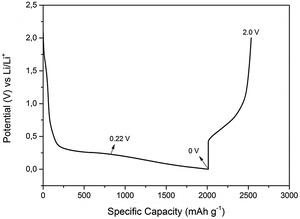
In order to investigate the lithiation/delithiation processes, galvanostatic charge–discharge cycles were performed at constant current density and the formation of SEI layer was evaluated. Fig. 4 represents a typical charge discharge curve of 0.5 M LiTFSI–[Py1,4]TFSI on the electrodeposited Ge on Cu. It is evident from the first charge–discharge curve that the specific capacity of the lithiation process was about 2000 mA h g−1 compared to the delithiation process which was about 750 mA h g−1 indicating that the Columbic efficiency in the first charge–discharge cycle with a constant current of 200 μA cm−2 is only ∼38%. To evaluate the interfacial processes during the first charge–discharge cycle, the experiments were stopped at various cut-off voltages and the SEI layer formed on the electrodeposited Ge was evaluated.
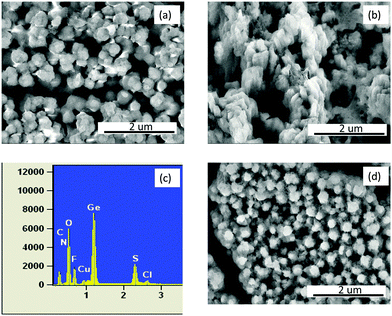
The SEM in Fig. 5 shows the microstructure of electrodeposited Ge at cut-off voltages of 0.22 V, 0 V and 2.0 V vs. Li/Li+. Fig. 5a represents the microstructure obtained at a cut-off voltage of 0.22 V, from which it is evident that the spherical morphology of the electrodeposited Ge (Fig. 1b) has rather changed into a flat plate like structure. This suggests that at initial states Ge has alloyed with lithium. Upon fully charging the electrodeposited Ge, the growth of an additional layer is evident in Fig. 5b and the Ge nanoparticles can no longer be observed. The EDX in Fig. 5c shows that besides Ge, there is S, F, O, Cl and C. The presence of these elements indicates that a thick SEI layer has formed on the electrodeposited Ge. However, after 1 charge–discharge cycle (Fig. 5d), the layer observed in Fig. 5b has diminished, suggesting that there is a change in the SEI layer during the discharge process.
In order to gain more insight into the SEI layer, AFM and XPS were performed at different cut-off potentials indicated by the arrows in Fig. 4. Fig. 6 shows the AFM images and force distance curves of electrodeposited Ge and Ge charged until a potential of 0.22 V. The 3D morphology of the electrodeposited Ge in Fig. 6a shows the formation of Ge clusters and is consistent with the SEM results. Force distance analysis shows a direct contact as expected when the cantilever touches the Ge deposit. Upon charging to a cut-off voltage of 0.22 V vs. Li/Li+ (Fig. 6b), a completely different topography is obtained. The surface topography shows the formation of uneven crests and troughs at different regions of the deposit.
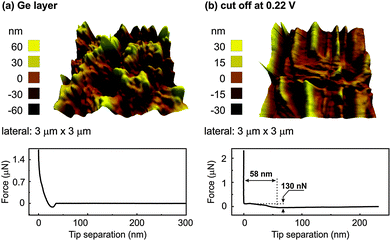 | ||
| Fig. 6 (a) AFM of the electrodeposited Ge and force distance curve (b) AFM and the force distance curve of electrodeposited Ge until a cut-off voltage of 0.22 V in 0.5 M LiTFSI–[Py1,4]TFSI. | ||
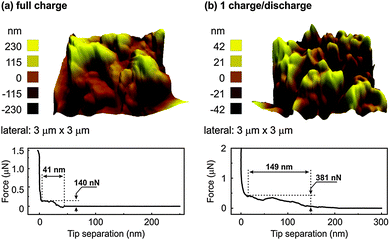
From the force distance curve, as the AFM tip moves towards the surface, an increase in the force is observed at 58 nm before contact is achieved. The force required to rupture the layer was found to be 130 nN and is related to the formation of a SEI layer. However, when the force distance curves were measured at different sites of the sample, at many sites a direct contact was obtained. This indicates that the SEI layer was inhomogeneous over the electrodeposited Ge. Also, the crests and troughs in the AFM image in Fig. 6b are at random places which led to a varied force-distance curve. It has been shown that with a reduced concentration (<1 M) of the lithium salt, the intercalation/deintercalation process in graphite does not take place which was due to the exfoliation of graphite and possibly unstable SEI layer formation.30,31 As the concentration of LiTFSI in our case is 0.5 M, a uniform SEI layer might not have formed at 0.22 V. Upon fully charging, a thick SEI layer formation is observed over the entire sample, Fig. 7a. From the force distance curve, an increase in force is observed at 41 nm before contact and the force measured was 140 nN. Almost a linear increase in force is observed from 41 nm to about 30 nm after which a plateau region is observed. This suggests that upon fully charging, the SEI forms a layered structure with each layer having different mechanical properties. Similar indentation curves were also reported previously with organic electrolytes.32
After one charge–discharge cycle, the surface roughness of the SEI layer increases as evident from Fig. 7b. The force distance curve shows an extended SEI layer formation having a depth of 149 nm and a force of 381 nN is required to rupture the SEI layer. From the force distance curve, it is evident that the SEI layer consists of a multi-layered structure as a linear increase and plateaued regions are observed. In order to investigate better into the SEI layer, 10 charge–discharge cycles were performed. The AFM after 10 charge–discharge cycles (Fig. 8) shows the topography similar to that of after 1 charge–discharge cycles in Fig. 7b. Furthermore, the force distance curve in Fig. 8 shows that the SEI layer is about 151 nm thick and 451 nN of force is needed to rupture the SEI layer.
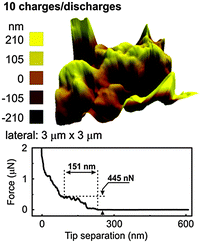 | ||
| Fig. 8 3D AFM of electrodeposited Ge after 10 charge–discharge cycles in 0.5 M LiTFSI–[Py1,4]TFSI along with the force distance curve. | ||
The values are similar to the one of Fig. 7b suggesting that after the first charge–discharge cycle the thickness of the SEI layer remains stable on the electrodeposited Ge. However, the change in the force indicates that some change in the composition of the SEI layer might have taken place during the charge–discharge cycles.
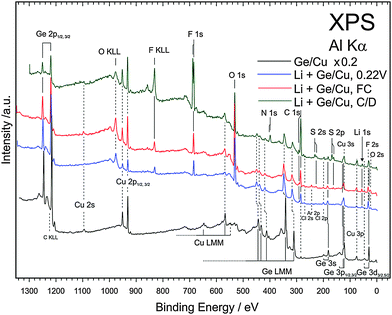
XPS was performed to understand the chemical composition of the SEI layer after different states of the first charge–discharge cycle. Fig. 9 compares the XPS survey spectra of electrodeposited Ge, Ge charged till a cut-off of 0.22 V, fully charged Ge and after one charge–discharge cycle. It was observed previously that even after rinsing, small amounts of ionic liquid remain on the surface of the material and therefore the samples were etched by Ar sputtering before acquiring the XPS spectra. The XPS spectrum of the electrodeposited Ge shows mainly the peaks of germanium and copper (black line, Fig. 9). The XPS survey spectra after charging to 0.22 V, fully charged and after one charge–discharge cycle mainly show the decomposition products of the ionic liquids.
Furthermore, peak splits in N 1s, C 1s, S 2s and 2p and F 1s are observed. To identify the peak splits, detailed spectra were fit to different components. Fig. 10 shows the XPS spectra of Ge 2p3/2, F 1s and C 1s at different cut-off voltages. From the Ge 2p spectra in Fig. 10a, the electrodeposited Ge shows two components of elemental Ge and of some oxide formation. Upon charging to 0.22 V, a shoulder appears at 1217 eV with a clear shift of 1 eV to lower binding energies from elemental Ge. The shoulder corresponds to the formation of GexLi alloys. The formation of an alloy in XPS spectra is consistent with the change in the Ge microstructure observed in Fig. 5a. The XPS in Fig. 10a also shows a dominant presence of GeO2. A similar observation was made previously by Nguyen et al.19 for the case of the Si–Cu alloy in the same ionic liquid. After fully charging the Ge electrode to 0 V, a slight increase in the GexLi alloy peak is found with reduction in GeO2 formation.
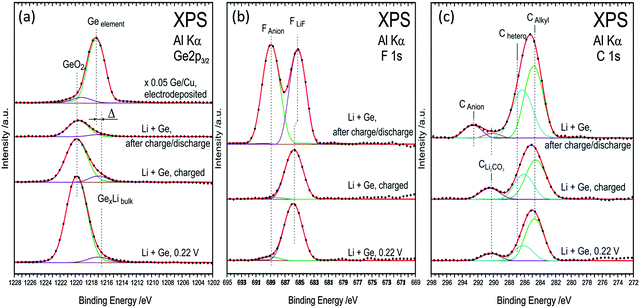 | ||
| Fig. 10 (a) XPS spectra of Ge 2p (b) F 1s (c) C 1s, during first charge–discharge process at various cut-off potentials in the 0.5 M LiTFSI–[Py1,4]TFSI electrolyte. | ||
The decreased intensity could be related to the thick SEI layer formation as evidenced from the AFM in Fig. 7a. After one charge–discharge process, only GeO2 is present and the shoulder of GexLi disappears indicating that a complete deintercalation process took place during the discharge process.
Upon charging to 0.22 V, the F 1s peak in Fig. 10b shows a prominent peak at 685.5 eV and corresponds well to the formation of LiF.33 A shoulder at 689 eV is also seen which could be related to the presence of anion species from the ionic liquid.33 No change in the composition is seen on fully charged Ge. After one charge–discharge cycle a clear split in the F 1s peak is observed and the peaks relate to LiF and fluoride from the anion. The XPS of C 1s is shown in Fig. 10c. Upon charging to 0.22 V, peaks at 284.5 and 291 eV are observed. The 284.5 eV peak can be deconvoluted into two peaks which correspond to the carbon from the butyl and alkyl groups of the cation. The peak at 291 eV is due to the formation of Li2CO3. Upon charging germanium completely, the presence of Li2CO3 and cations of ionic liquids is again observed. After the charge–discharge cycle, the Li2CO3 peak disappears and an additional peak is seen at 293 eV which is associated with the carbon atoms in the anion of the ionic liquid.32
The Li 1s spectra in Fig. 11a show a peak at 55.6 eV after various charge–discharge processes and do not correspond to metallic lithium or LiOH. The peak fits with Li2O, Li2S, and LiF whose binding energies differ within ±0.1 eV. The O 1s spectra (Fig. 11b) after charging to 0.22 V and fully charged can be deconvoluted into two peaks and indicate the formation of Li2CO3, LiOH/Li2O2 and some oxygen from the anions. However, after one charge–discharge cycle, the deconvoluted peak at 530 eV related to LiOH/Li2O2 drastically reduces. Thus, from the C 1s and O 1s spectra, it can be clearly seen that during the charging and discharging cycle, the lithium compounds change in the SEI layer which might have resulted in the formation of a porous SEI layer as observed in the AFM in Fig. 7b. In the case of S 2p, for the fully charged and charged to 0.22 V show peaks at 162.5 eV and 168.5 eV. These peaks can be ascribed to the formation of Li2S/GeSx or adsorbed sulphur on copper34,35 from the decomposed TFSI. After one charge discharge process a shift at 168.5 eV to 169 eV is observed and can be related to the sulphur from the SO2 group in the anion.
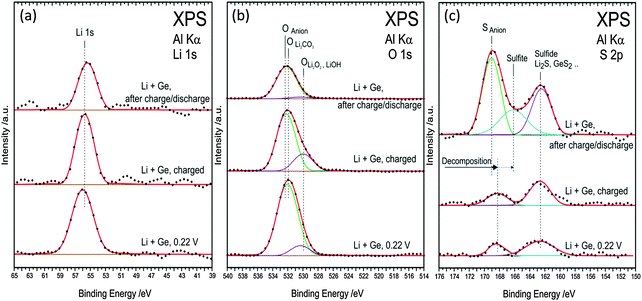 | ||
| Fig. 11 (a) XPS spectra of Li 1s (b) O 1s (c) S 2p during first charge–discharge process at various cut-off potentials in the 0.5 M LiTFSI–[Py1,4]TFSI electrolyte. | ||
Correspondingly, we also investigated the changes in the ionic liquid after each cut-off voltage. Fig. 12 shows the IR spectra of the IL after various cut-off voltages. From Fig. 12a it is evident that after charging to 0.22 V, a decrease in intensity in the IR is observed and upon charging to 0 V, a further decrease in intensity takes place. However, after the discharge process, no change in intensity is observed. This indicates that the decomposition of the TFSI anion during the charging process results in the formation of a SEI layer as seen from AFM and XPS studies. During discharge the TFSI anion remains stable.
Upon looking into the Li coordinated region between 500 and 640 cm−1 (Fig. 12b), it is clear that a decrease in the coordination is observed at the 581 cm−1 peak during charging to 0.22 V and 0 V which can be related to the formation of lithium compounds in the SEI layer as shown by XPS analysis. Furthermore, the 601 cm−1 peak related to the bending modes of CF3, SNS and NSO2 is affected during the decomposition of TFSI wherein the peak diminishes and merges with the 621 cm−1 peak. Small shifts of about 3 cm−1 are also seen in the 571 cm−1 peak which correspond to the mixed C1 and C2 conformers of TFSI. These results indicate that there are some structural changes which occur in the IL electrolyte during the decomposition of TFSI anions and corroborate well with the formation of various lithium carbonate and sulphur compounds as seen from the XPS spectra in Fig. 10c and 11c. Fig. 12b compares the IR spectra of [Py1,4]+ at various charge–discharge processes. A slight decrease in the IR intensity is observed only after full charge and after the discharge process. This indicates that although there is some decomposition of [Py1,4]+, the cation of the IL remains relatively stable compared to the TFSI− anion.
Conclusions
In this paper we studied the morphology and composition of the SEI layer formed on electrodeposited Ge from 0.5 M LiTFSI–[Py1,4]TFSI using SEM, AFM and XPS at various cut-off potentials during lithium intercalation/deintercalation cycles. From both SEM and AFM it was observed that a thick SEI layer is formed on Ge during charging. However, during the discharge cycle, the microstructure of the SEI layer changed. From XPS, it was clear that the composition of the SEI layer changes during the charge–discharge cycle and is consistent with AFM force-distance analysis. Furthermore, the electrolyte was also analysed after the charge–discharge processes from which it could be seen that during charging there is significant decomposition of the TFSI− ion whereas the [Py1,4]+ cation is relatively stable. Thus we can conclude that LiTFSI–[Py1,4]TFSI is, although, not a bad ionic liquid based electrolyte for lithium batteries and forms a relatively thick and stable SEI layer, modification in the electrolyte or a different anion might be necessary to improve the stability and composition of the SEI layer.References
- J. B. Goodenough and K-S. Park, J. Am. Chem. Soc., 2013, 135, 1167–1176 CrossRef CAS PubMed.
- J.-M. Tarascon and M. Armand, Nature, 2001, 414, 359–367 CrossRef CAS PubMed.
- V. Etacheri, R. Marom, R. Elazari, G. Salitra and D. Aurbach, Energy Environ. Sci., 2011, 4, 3243–3262 CAS.
- C. S. Wang, G. T. Wu and W. Z. Li, J. Power Sources, 1998, 76, 1–10 CrossRef CAS.
- C. de las Casas and W. Li, J. Power Sources, 2012, 208, 74–85 CrossRef CAS.
- R. Teki, M. K. Datta, R. Krishnan, T. C. Parker, T.-M. Lu, P. N. Kumta and N. Koratkar, Small, 2009, 5, 2236–2242 CrossRef CAS PubMed.
- C. K. Chan, X. F. Zhang and Y. Cui, Nano Lett., 2008, 8, 307–309 CrossRef CAS PubMed.
- T. D. Hatchard and J. R. Dahn, J. Electrochem. Soc., 2004, 151, A838–A842 CrossRef CAS.
- P. R. Raimann, N. S. Hochgatterer, C. Korepp, K. C. Möller, M. Winter, H. Schröttner, F. Hofer and J. O. Besenhard, Ionics, 2006, 12, 253–255 CrossRef CAS.
- S. S. Zhang, J. Power Sources, 2006, 162, 1379–1394 CrossRef CAS.
- B. Philippe, R. Dedryvère, M. Gorgoi, H. Rensmo, D. Gonbeau and K. Edström, Chem. Mater., 2013, 25, 394–404 CrossRef CAS.
- J. Mun, Y. S. Jung, T. Yim, H. Y. Lee, H.-J. Kim, Y. G. Kim and S. M. Oh, J. Power Sources, 2009, 194, 1068–1074 CrossRef CAS.
- A. Lewandowski and A. Świderska-Mocek, J. Power Sources, 2009, 194, 601–609 CrossRef CAS.
- M. Ishikawa, T. Sugimoto, M. Kikuta, E. Ishiko and M. Kono, J. Power Sources, 2006, 162, 658–662 CrossRef CAS.
- P. C. Howlett, N. Brack, A. F. Hollenkamp, M. Forsyth and D. R. MacFarlane, J. Electrochem. Soc., 2006, 153, A595–A606 CrossRef CAS.
- L. H. S. Gasparotto, A. Prowald, N. Borisenko, S. Zein El Abedin, A. Garsuch and F. Endres, J. Power Sources, 2011, 196, 2879–2883 CrossRef CAS.
- S. Zein El Abedin, A. Garsuch and F. Endres, Aust. J. Chem., 2012, 65, 1529–1533 CrossRef.
- C. C. Nguyen and S.-W. Song, Electrochem. Commun., 2010, 12, 1593–1595 CrossRef CAS.
- C. C. Nguyen, S.-W. Woo and S.-W. Song, J. Phys. Chem. C, 2012, 116, 14764–14771 CAS.
- A. M. Chockla, K. C. Klavetter, C. B. Mullins and B. A. Korgel, ACS Appl. Mater. Interfaces, 2012, 4, 4658–4664 CAS.
- B. Laforge, L. Levan-Jodin, R. Salot and A. Billard, J. Electrochem. Soc., 2008, 155, A181–A188 CrossRef CAS.
- A. Lahiri, S. Zein El Abedin and F. Endres, J. Phys. Chem. C, 2012, 116, 17739–17745 CAS.
- X. Meng, R. Al-Salman, J. Zhao, N. Borissenko, Y. Li and F. Endres, Angew. Chem., Int. Ed., 2009, 48, 2703 CrossRef CAS PubMed.
- R. Al-Salman, J. Mallet, M. Molinari, P. Fricoteaux, F. Martineau, M. Troyon, S. Zein El Abedin and F. Endres, Phys. Chem. Chem. Phys., 2008, 10, 6233–6237 RSC.
- A. Lahiri, A. Willert, S. Zein El Abedin and F. Endres, Electrochim. Acta, 2014, 121, 154–158 CrossRef CAS.
- R. Al-Salman, S. Zein El Abedin and F. Endres, Phys. Chem. Chem. Phys., 2008, 10, 4650–4657 RSC.
- J.-C. Lassègues, J. Grondin, C. Aupetit and P. Johansson, J. Phys. Chem. A, 2009, 113, 305–314 CrossRef PubMed.
- P. C. Howlett, E. I. Izgorodina, M. Forsyth and D. R. MacFarlane, Z. Phys. Chem., 2006, 220, 1483–1498 CrossRef CAS.
- A. Lahiri, T. J. S. Schubert, B. Iliev and F. Endres, Phys. Chem. Chem. Phys., 2015, 17, 11161–11164 RSC.
- Y. Yamada, Y. Takazawa, K. Miyazaki and T. Abe, J. Phys. Chem. C, 2010, 114, 11680–11685 CAS.
- S. Takeuchi, K. Miyazaki, F. Sagane, T. Fukutsuka, S.-K. Jeong and T. Abe, Electrochim. Acta, 2011, 56, 10450–10453 CrossRef CAS.
- J. Zhang, R. Wang, X. Yang, W. Lu, X. Wu, X. Wang, H. Li and L. Chen, Nano Lett., 2012, 12, 2153–2157 CrossRef CAS PubMed.
- M. Olschewski, R. Gustus, M. Marschewski, O. Höfft and F. Endres, Phys. Chem. Chem. Phys., 2014, 16, 25969–25977 RSC.
- S. Murugesan, P. Kearns and K. J. Stevenson, Langmuir, 2012, 28, 5513–5517 CrossRef CAS PubMed.
- B. Uhl, F. Buchner, S. Gabler, M. Bozorgchenani and R. J. Behm, Chem. Commun., 2014, 50, 8601–8604 RSC.
| This journal is © the Owner Societies 2016 |

