 Open Access Article
Creative Commons Attribution 3.0 Unported Licence
Investigating the quasi-liquid layer on ice surfaces: a comparison of order parameters†
Jihong
Shi
 a,
Maxwell
Fulford
a,
Hui
Li‡
a,
Mariam
Marzook§
a,
Maryam
Reisjalali¶
a,
Matteo
Salvalaglio
a,
Maxwell
Fulford
a,
Hui
Li‡
a,
Mariam
Marzook§
a,
Maryam
Reisjalali¶
a,
Matteo
Salvalaglio
 b and
Carla
Molteni
 *a
*a
aDepartment of Physics, King's College London, Strand, London WC2R 2LS, UK. E-mail: carla.molteni@kcl.ac.uk
bDepartment of Chemical Engineering, University College London, Torrington Place, London WC1E 7JE, UK
First published on 5th May 2022
Abstract
Ice surfaces are characterized by pre-melted quasi-liquid layers (QLLs), which mediate both crystal growth processes and interactions with external agents. Understanding QLLs at the molecular level is necessary to unravel the mechanisms of ice crystal formation. Computational studies of the QLLs heavily rely on the accuracy of the methods employed for identifying the local molecular environment and arrangements, discriminating between solid-like and liquid-like water molecules. Here we compare the results obtained using different order parameters to characterize the QLLs on hexagonal ice (Ih) and cubic ice (Ic) model surfaces investigated with molecular dynamics (MD) simulations in a range of temperatures. For the classification task, in addition to the traditional Steinhardt order parameters in different flavours, we select an entropy fingerprint and a deep learning neural network approach (DeepIce), which are conceptually different methodologies. We find that all the analysis methods give qualitatively similar trends for the behaviours of the QLLs on ice surfaces with temperature, with some subtle differences in the classification sensitivity limited to the solid–liquid interface. The thickness of QLLs on the ice surface increases gradually as the temperature increases. The trends of the QLL size and of the values of the order parameters as a function of temperature for the different facets may be linked to surface growth rates which, in turn, affect crystal morphologies at lower vapour pressure. The choice of the order parameter can be therefore informed by computational convenience except in cases where a very accurate determination of the liquid–solid interface is important.
1 Introduction
Quasi-liquid layers develop on ice surfaces at temperatures below the bulk melting point.1–4 This interesting pre-melting phenomenon is related to the structure of the ice surfaces,5–7 influences the growth and morphology of ice crystals,8–10 and mediates chemical reactions at the vapour–ice interface.11,12 Since their prediction about 160 years ago by Michael Faraday,13 the existence of such QLLs has been confirmed by a variety of experimental techniques, including photoelectron spectroscopy,14 glancing angle X-ray,15,16 ellipsometry,17 atomic force microscopy,18,19etc.20–24 These methods, however, did not reach a consensus on the QLL thickness and the temperature associated with the onset of pre-melting, which depend on the probes used.25–28 Meanwhile, extensive efforts contributed by computer simulations support that the thickness of the QLLs is directly correlated with temperature.29–33Hexagonal ice (Ih) is the most common among the many phases of ice, as it is found at ambient conditions.34,35 The Ih structure determines the sophisticated hexagonally-symmetric shape of snowflakes. It is usually obtained by freezing water at ordinary temperature. Vapour deposition at a lower temperature can produce cubic ice (Ic), which is a metastable structure with the oxygens arranged in a diamond lattice.36,37 The structures of Ih and Ic are distinct, but the differences are subtle: the local arrangement of the four first neighbours is similarly tetrahedral,38 with differences emerging in the second coordination shell. In fact, the Ih second hydration shell contains 12(+1) molecules, whereas that of Ic contains 12 with a different arrangement. The extra water molecule in the Ih second shell,39 anharmonic nuclear vibrations40 and nuclear-quantum effects41,42 can be linked to the greater stability of Ih over Ic.
Ih has three main crystal surfaces: the basal (0001), the primary prism (10![[1 with combining macron]](https://www.rsc.org/images/entities/char_0031_0304.gif) 0) (prism1) and the secondary prism (
0) (prism1) and the secondary prism (![[1 with combining macron]](https://www.rsc.org/images/entities/char_0031_0304.gif) 2
2![[1 with combining macron]](https://www.rsc.org/images/entities/char_0031_0304.gif) 0) (prism2) surfaces.43 Whether the macroscopic prism and hexagonal symmetry in snow flakes and macroscopic ice crystals reflects the molecular hexagons (with prism2 faces) or the crystallographic hexagons (with prism1 faces) is difficult to establish, especially at temperature around the melting points with both surfaces recorded,25 although experiments supports the primary prism (
0) (prism2) surfaces.43 Whether the macroscopic prism and hexagonal symmetry in snow flakes and macroscopic ice crystals reflects the molecular hexagons (with prism2 faces) or the crystallographic hexagons (with prism1 faces) is difficult to establish, especially at temperature around the melting points with both surfaces recorded,25 although experiments supports the primary prism (![[1 with combining macron]](https://www.rsc.org/images/entities/char_0031_0304.gif) 2
2![[1 with combining macron]](https://www.rsc.org/images/entities/char_0031_0304.gif) 0) at the ice–vapour interface and the secondary prism at the ice–water interface, attributing this to a subtle interplay between entropy and enthalpy.27 Ic has two main crystal surfaces: the (001) and (111) surfaces. Based on the coexistence of Ic and Ih between 160 and 240 K, research on Ih has often been accompanied by that on Ic.44
0) at the ice–vapour interface and the secondary prism at the ice–water interface, attributing this to a subtle interplay between entropy and enthalpy.27 Ic has two main crystal surfaces: the (001) and (111) surfaces. Based on the coexistence of Ic and Ih between 160 and 240 K, research on Ih has often been accompanied by that on Ic.44
With the development of precise and efficient methods for distinguishing different local molecular environments, the accurate definition of QLLs can be taken a step further. A selection of these methods is briefly reviewed below. This list wants to be representative, rather than exhaustive, with additional techniques available.45–48
Steinhardt order parameters (SOPs) distinguish the local environment of an atom or molecule by capturing the orientational arrangement of neighbours positioned within a pre-defined cutoff distance from that atom. Modifications to the original version (ql)49 have been proposed, for example with the complex bond order vectors being averaged over the first neighbour shell of a given particle and the particle itself to increase the accuracy with which different crystal structures can be distinguished (“local averaged” Steinhardt parameter laql).50,51 The “local” Steinhardt parameters (lql) is another local order parameter that measures the extent to which the orientation of the atoms in the first coordination sphere of an atom matches the orientation of the central atom.52,53 Based on Steinhardt parameters,54 the CHILL algorithm was developed to identify liquid water from ice and to classify different ice polymorphs,55 according to the coherence of the molecules orientational order with that of their neighbours. An extended version of the CHILL algorithm, CHILL+, can identify not only hexagonal ice, cubic ice and liquid water but also clathrate hydrates in molecular simulations.56
Local order metric (LOM) is based on a measure of the optimal overlap between the local environment and reference patterns.57 Two global order parameters derived from LOM, the average score (the site-averaged LOM) and its standard deviation, have been proved helpful to analyze with high resolution crystallization and amorphization of supercooled water within computer simulations; they can also be used as collective variables in enhanced sampling simulations. Template matching for staggered and eclipsed conformations has been exploited for classifying water and ice structures.58
An entropy fingerprint, distinguishing ordered and disordered environments, can be derived from an approximate expression of the entropy projected on individual atoms, based on radial pair distribution functions.59
With the development of machine learning techniques in recent years, several examples feature machine learning approaches to distinguish local molecular environments, including, neural networks for crystal structure identification,60 a PointNet-architecture-based method for local structural environments determination,61 recognizing molecular patterns based on hydrogen bonding by machine learning,62 GCIceNet,63 with multiple graph convolutional layers, and our own DeepIce,64 which we developed for distinguish hexagonal ice and liquid water in the bulk and at interfaces.
In this work we want to compare and cross-validate a selection of classification techniques when applied to the characterisation of the QLLs for a range of ice polymorphs, crystal surfaces, and temperatures. To achieve this task we select three conceptually different classification methods based on (i) Steinhart order parameters in different flavours, (ii) entropy fingerprints and (iii) machine learning, via DeepIce.64 Atomistic configurations are generated through molecular dynamics simulations with the TIP4P/Ice model for three crystal facets in the case of Ih, and for one crystal facet for Ic. Ih surfaces are simulated in the temperature range between 240 K and 270 K, while ice Ic is modelled at 200 K to 270 K. Based on the results with the different classification methods, we are interested in systematically investigating the temperature dependence of QLLs arising from ice premelting and the relationship between QLLs and ice surface orientation.
2 Methodology
2.1 Molecular dynamics simulations
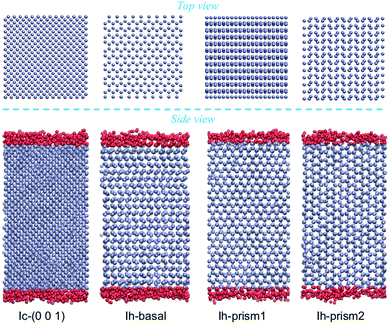
Molecular dynamics simulations are performed using the rigid four-site TIP4P/Ice water model, which is designed for the study of crystalline and amorphous ices to reproduce as closely as possible the phase diagram and allow for accurate predictions of the densities of several ice structures.65,66 Calculations with this model yield a melting temperature of hexagonal ice of 272.2 K at 1 bar which closely approximates the experimental value.65 Bulk ice and bulk supercooled water reference systems are investigated, in periodically repeated orthorhombic supercells containing 2880 molecules for Ih and 2744 molecules for Ic, with initial dimensions of 45.000 × 46.765 × 43.920 Å3 and 44.506 × 44.506 × 44.506 Å3, respectively. Hydrogens were initially in a disordered configuration determined by a Monte Carlo procedure so to minimize the dipole moment of the supercell while obeying the Bernal–Fowler rule for hydrogen bonding.26,67For the surfaces, we use the slabs of Ih and Ic doubling the size of the bulk supercells in the direction perpendicular to the surface of interest, as shown in Fig. 1 in a MD snapshot, containing 5760 and 5488 water molecules respectively. As periodic boundary conditions are applied in all three directions, a vacuum layer is added by elongating the dimension of the box by 40 Å in the direction perpendicular to the surface, producing two equivalent ice/vacuum interfaces. The size of the vacuum layer is chosen to be large enough so that the two ice/vacuum interfaces do not interact, and similarly the length of the slab is chosen so that the two QLLs do not influence each other, especially at the higher temperatures. The basal slab consists of 48 layers each composed of 120 molecules, arranged in pairs with intra-bilayer spacing of 0.929 Å and inter-bilayer spacing at 3.738 Å; the primary prism slab consists of 48 layers of 120 atoms each, also arranged in pairs, with intra-bilayer spacing of 1.296 Å and inter-bilayer spacing of 2.766 Å; the secondary prism slab consists of 40 equally spaced layers at a distance of 2.275 Å, each composed of 144 molecules. The cubic slab consists of 56 equally spaced layers at a distance of 1.561 Å, each composed of 98 molecules.
The reference MD simulations for bulk Ih and bulk Ic are performed at the temperature of 250 K and 260 K. Bulk water is studied at 300 K and 280 K, and supercooled at 260 K and 250 K. The MD simulations for Ih slabs are conducted at temperatures between 240 K and 270 K, in 5 K intervals. The MD simulations for the Ic slab are conducted at temperatures between 200 K and 270 K, in 10 K intervals. The simulations are carried out using the LAMMPS (Dec 9, 2014 version) package.68 The cutoffs for the long-range Coulomb and van der Waals interactions are set to 12 Å. A time step of 1 fs is used. Temperature and pressure are controlled with Nosé–Hoover thermostat and barostat with relaxation times of 100 fs and 1000 fs, respectively.
To equilibrate the reference bulk ice, 10 ns of NPT simulation are performed at zero pressure at the temperature of 250 K and 260 K. Once the NPT simulations are complete the final NPT configuration (atomic positions and supercell) are used to run NVT simulations for 20 ns. For the bulk supercooled water, the final NPT configuration is subjected to a fast-melting process at 400 K for 10 ns in the NVT ensemble. Then, a 10 ns cooling process is performed to the target temperature progressively (300 K, 280 K, 260 K and 250 K), followed by 10 ns NVT simulations. The trajectories selected to analyze are the last 9 ns of the NVT simulations; the diffusivity of the supercooled water was checked by analysing the mean square displacements. Only the oxygen atoms are considered for structure classification. The protocol and parameters of the MD simulations for the Ih and Ic slabs are similar to the reference bulk ice, but longer simulations are run. 10 ns of NPT simulations are run to equilibrate the system followed by 100 ns of NVT simulations; in the last 90 ns statistics are collected for analysed with datasets containing MD snapshots at 10 ps intervals. The simulations at 270 K are run for 400 ns to improve the sampling due to large fluctuations close to the melting point.
2.2 Analysis details
Analyzing the QLLs relies on the method used to discriminate liquid-like molecules from ice-like molecules. In this work, we analyze atomistic trajectories sampling ice surfaces to characterize the QLLs by using Steinhardt order parameters, entropy fingerprints and the DeepIce method.64 The analysis details are introduced below. The analyses with Steinhardt parameters and entropy fingerprints are done using PLUMED 2.5.1,52,69 while the DeepIce analysis uses an in-house code.64 | (1) |
 | (2) |
The local average-ql (laql) introduces averages over the first neighbour shell of a given particle and the particle itself.50 This improves the classification accuracy compared to the global parameter ql, as longer-range information is accounted for.41,50 laql is defined as:
 | (3) |
 | (4) |
The local-ql (lql) provides an alternative computational recipe within SOP-based calculations.52,53 It measures the extent to which the orientation of the particles in the first coordination sphere of a given particle matches the orientation of the central particle, and is defined as:
 | (5) |
In this work, the sum over the first neighbours is handled by using the sharp continuous switching function
 | (6) |
We test ql, laql and lql with l = 3, 4, 6, with lq3 and laq3 resulting the best choices for ice and water classification as described in the result section.50,71,72
 | (7) |
 | (8) |
To improve the resolution between different environments, a locally averaged entropy, le, can be defined as:
 | (9) |
In this work, we train DeepIce on water, and both Ih and Ic using MD trajectories of bulk ice and supercooled water at 260 K. The last 9 ns of the simulated trajectories in the bulk system totalling 1800 frames are used to generate the local environments that constitute the training data set. The training data is randomly split into a training set (81%), a validation set (9%), and a test set (10%). A key feature of DeepIce is the ability to classify undercoordinated ordered environments, a feature that remains a challenge for methods based on local order parameters developed for the bulk. To generate the training data necessary to classify correctly interfaces, one of the simulation box edges is increased by 30 Å yielding undercoordinated molecular environments at the ice/vacuum and water/vacuum interfaces. In our setting, this corresponds to the prism1 surface in Ih and the (001) surface in Ic; it was previously demonstrated that training on a surface would be sufficient also for other surfaces of Ih.64 The network is trained for 20 epochs to avoid overfitting, using the Adam optimizer with an initial learning rate of 0.001. The minibatch learning uses 30 batches, so that the weights and biases can be adjusted dividing by 30 the number of data samples in a single epoch. For the predicting procedure we use 1000 frames sampling the last 90 ns of the trajectories of the Ic and Ih slabs.
Whereas the SOPs set the number of neighbours by choosing a cutoff distance, DeepIce uses a fixed number n of nearest neighbours. In the first hydration shell, the number of water molecules around a specific water molecule is 4 in both Ih and Ic. The number of water molecules in the second coordination shell of both ice Ih and Ic is close to 12. For comparison, we trained DeepIce with 10 (nn10) and 16 (nn16) nearest neighbours, meant to represent only the first and half of the second coordination shell for oxygen atoms in the Ih and Ic structures as in the original work,64 or both the first and second nearest neighbour shells in full, respectively. Hence, we can compare how the number of nearest neighbours affects the identification of water molecules in the QLLs.
3 Results and discussion
3.1 Classification of phases in bulk systems through steinhardt parameters and entropy fingerprints
To characterize the QLLs on ice slabs, first, we need to determine the thresholds of the order parameters for distinguishing water and ice in the bulk systems. We carry out this task using the SOPs ql, lql and laql with l = 3, 4, 6 and the entropy fingerprint e and le approaches. In the classification process, the use of just one order parameter to distinguish water molecules from ice is named “single classification”, while “double classification” denotes when two order parameters are simultaneously used.The probability distribution of SOPs and entropy fingerprints of ice and supercooled water provide an intuitive reference to determine the threshold values to distinguish different structures of ice and water and is shown in Fig. 2 for representative cases, with all the investigated cases available in the ESI,† Fig. S1. The probability distributions are normalized to one and are calculated at both 250 K and 260 K to evaluate temperature effects. The ql parameters do not have the potential to classify different ice structures and water because their distributions for ice and water overlap for large intervals of values. Moreover, Ih and Ic are degenerate with respect to ql, i.e. their respective ql distributions overlap completely, making ql unable to distinguish between ice polymorphs. Locally averaged parameters such as lq3, laq3, lq4 and laq4 are able to distinguish water and different ice structures with similarly good results. When compared to the corresponding ql parameters, the overlap area between ice and water is significantly reduced, and the overlap area between different Ih and Ic is also reduced. Among these parameters, lq3 and laq3 can distinguish water from ice clearly. Instead, it is more difficult to distinguish water and Ih using the lq4 and laq4 parameters. The lq3 parameter is also the best for discriminating Ih from Ic. Finally, lq6 and laq6 are good choices to distinguish water and ice structures, but they cannot distinguish different ice structures as Ih and Ic; lq6 and laq6 distributions overlap significantly.
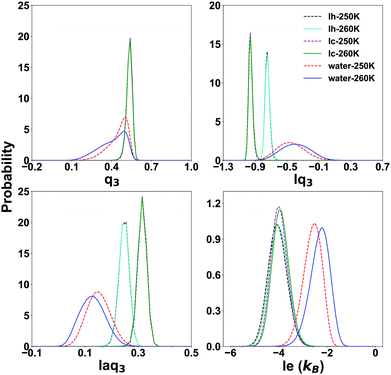 | ||
| Fig. 2 The probability distribution of the Steinhardt parameters lq3 and laq3 and the local entropy fingerprint le for bulk water and ice at 250 K and 260 K. | ||
The entropy fingerprint e and its local average le are very effective in distinguishing water from ice, with le providing a better separation, similarly to the effect of local averaging in the Steinhart parameters and basically the same threshold for Ih and Ic. However, these parameters cannot separate Ic and Ih.
Focusing on the local parameters that can clearly distinguish water from ice, we determine the discriminating threshold by taking the point of intersection between the curves of water and ice as the threshold, testing the effect of temperature at 250 K and 260 K. The thresholds and the overlap integrals between the corresponding probability distribution are shown in Table 1.
| Threshold | le(kB) | lq3 | laq3 | lq4 | laq4 | lq6 | laq6 |
|---|---|---|---|---|---|---|---|
| 250 K-water–Ih | −3.33 | −0.68 | 0.21 | 0.42 | 0.26 | 0.49 | 0.38 |
| 260 K-water–Ih | −3.17 | −0.67 | 0.20 | 0.41 | 0.25 | 0.48 | 0.37 |
| 250 K-water–Ic | −3.33 | −0.84 | 0.26 | 0.60 | 0.34 | 0.53 | 0.40 |
| 260 K-water–Ic | −3.18 | −0.82 | 0.26 | 0.58 | 0.34 | 0.52 | 0.39 |
| Overlap | le (kB) | lq3 | laq3 | lq4 | laq4 | lq6 | laq6 |
|---|---|---|---|---|---|---|---|
| 250 K-water–Ih | 0.076 | 0.192 | 0.134 | 0.216 | 0.325 | 0.056 | 0.032 |
| 260 K-water–Ih | 0.047 | 0.076 | 0.087 | 0.192 | 0.264 | 0.054 | 0.032 |
| 250 K-water–Ic | 0.072 | 0.009 | 0.012 | 0.025 | 0.020 | 0.028 | 0.014 |
| 260 K-water–Ic | 0.044 | 0.008 | 0.007 | 0.023 | 0.018 | 0.029 | 0.025 |
| 250 K-Ih–Ic | 0.813 | 0.021 | 0.066 | 0.068 | 0.043 | 0.522 | 0.520 |
| 260 K-Ih–Ic | 0.894 | 0.007 | 0.073 | 0.078 | 0.047 | 0.512 | 0.543 |
The effect of the temperature is overall small, with the overlap integral being slightly smaller at 260 K. Hence it is justifiable to use the threshold determined at 260 K for all the investigated temperatures. Choosing a sharp threshold is an approximation which will inevitably result in failure to detect some water molecules, although the smaller is the overlap integral the smaller is the probability to miss them. We will compare the different methods to identify these hard-to-identify molecules in a subsequent section, and select for the comparison lq3, laq3 and le. They can be used individually or in combination (le + lq3 or le + laq3) to exploit the features of both entropy and Steinhardt parameters. Examples of joint le + lq3 and le + laq3 distributions are shown in Fig. 3.
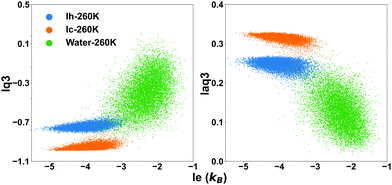 | ||
| Fig. 3 The distribution of the values of the local entropy fingerprint le and either or laq3 for bulk water (green dots), Ih (blue dots) and Ic (orange dots) at 260 K. | ||
3.2 Characterizing QLLs on Ice slabs
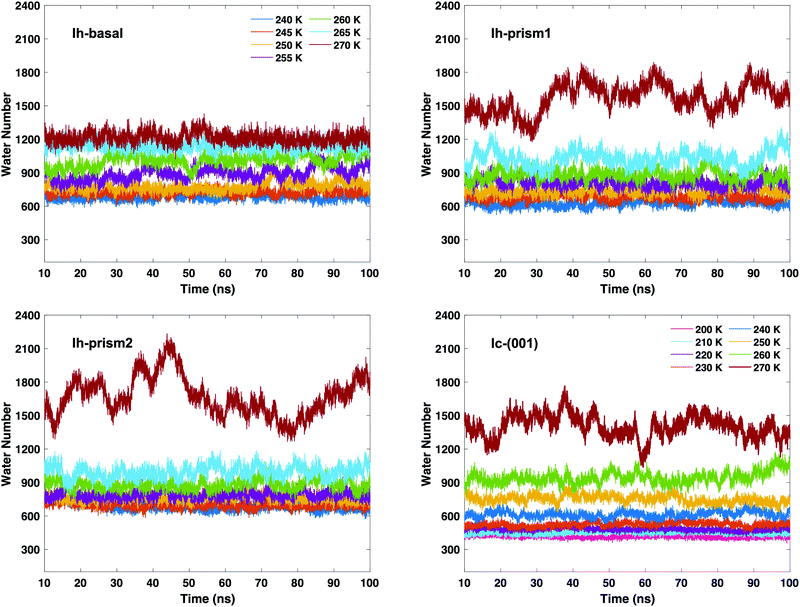
After determining the relevant thresholds for local SOPs and entropy fingerprint in the bulk, we can use such cutoffs to locate the molecules in the quasi-liquid layers on the different ice slabs. Using single and double classification to identify the QLLs, we can visualize the MD trajectories to observe the QLLs on the ice surfaces. No molecule in the QLLs of the different surfaces of Ih and Ic is found to evaporate from the surface. This result allows us to conclude that under all the tested temperature conditions and for the sampled times, the ice surfaces are stable. Even at 270 K, surfaces do not melt and yield a QLL with stationary thickness. The techniques used did not identify spurious liquid-like molecules at the surfaces of the perfect ice slabs.The time-evolution of the number of liquid-like molecules on the two surfaces of the ice slabs in the MD trajectories are shown in Fig. 4 as calculated using the local entropy fingerprint as order parameter, as an example, and in Fig. S2–S5 of the ESI† for the lq3, laq3, le and their combinations. While the numbers vary depending on the classification methods, the trends are consistent. In particular, when using double classification, the number of molecules classified as liquid-like on all ice surfaces (Ih and Ic) is lower than that when using the corresponding single classification, due to the more stringent requirement to satisfy simultaneously two criteria. From the graphs in Fig. 4, we can observe that, as the temperature gradually rises, the QLLs on the different ice surfaces grow in thickness. In particular, in the temperature range between 260 and 270 K, the number of liquid-like molecules on Ic surface increases substantially. This behaviour is also shown by both Ih-prism1 and Ih-prism2 surfaces when the temperature changes from 265–270 K, while the number of liquid-like molecules on the Ih basal surface fluctuates more strongly than those on the prismatic surfaces in the temperature range 255–260 K.
The time-evolution of the number of molecules in QLLs on different ice surfaces is also investigated using DeepIce with 10 and 16 nearest neighbours. The time evolution on all surfaces is consistent with the trend generated by using the local SOPs and entropy fingerprint in Fig. 4. Hence we only show the comparison on the Ih prism2 surface here in Fig. 5 when different numbers of neighbours are used for DeepIce. The graphs for the other ice surfaces are included in the ESI† in Fig. S6. The average number of liquid-like molecules obtained using 16 nearest neighbours are larger than the results obtained with 10 nearest neighbours. Hence, using 16 nearest neighbours tend to identify more liquid-like disordered molecules on the three different Ih surfaces than when 10 is used. This reason may be due to the second shell that can improve the ability to distinguish water and ice structures. The comparison between the nearest neighbours 10 and 16 is further discussed later on.
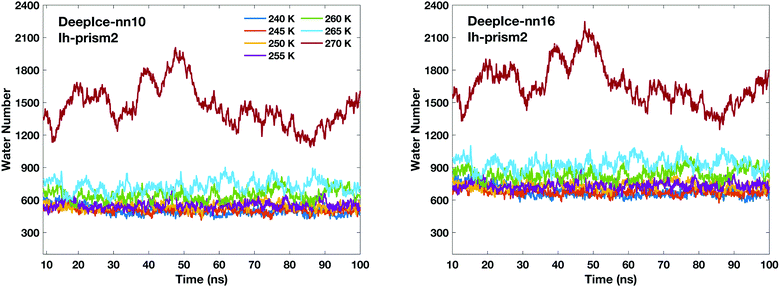 | ||
| Fig. 5 Time-evolution of the number of liquid-like molecules in QLLs on the Ih prism2 surface using DeepIce with 10 nearest neighbours (left panel) and 16 nearest neighbours (right panel). | ||
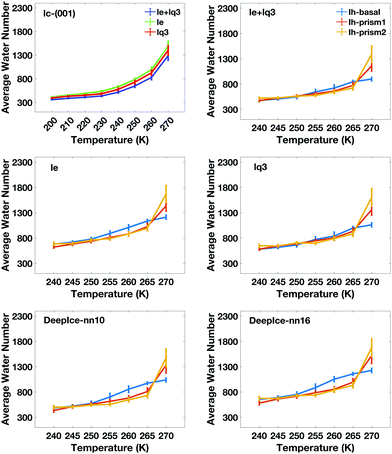
The average number of liquid-like molecules in the QLLs as a function of the system's temperature defined by local SOPs and entropy fingerprint, single, double classification and DeepIce is shown in Fig. 6 for a selection of cases. Error bars represent the standard deviation in the trajectories and capture the amplitude of fluctuations observed in Fig. 4 and 5. The Ic data in the top-left panel is shown for different methods, while the Ih data is shown for the different surfaces with the same classification method. The number of liquid-like molecules in QLLs on all ice surfaces increases as the temperature increases as expected. The results obtained by using different order parameters and DeepIce show large standard deviations close to the melting point 270 K, which corresponds to the dramatic fluctuation of the number of liquid-like molecules on the prismatic planes and Ic in Fig. 4 and 5; for the Ih basal surface the fluctuations and corresponding standard deviations are larger at 255–260 K. For the Ic surface, the curve shows a gentle upward trend against the temperature rise; overall le detects more liquid-like molecules than lq3 and there is a subset of molecules detected either by le or lq3 which therefore are counted in the double classification scheme. In general, the number of liquid-like molecules in QLLs on different ice surfaces fluctuates around a particular averaged value, with fluctuations which increase as the temperature increase, as expected and previously observed in MD simulations when using TIP4P/Ice and other water models.6 Below 270 K, the number of liquid-like molecules on different ice surfaces is similar for Ih; when the temperature is close to 270 K, the order of the number of liquid-like molecules on Ih surfaces is basal plane > primary prismatic plane > second prismatic plane, but an inversion, although small is observed around 260 K, more noticeable when the local entropy order parameter is used. In the range of 250 K to 265 K, the curves of basal and prismatic planes using le are better separated than those using lq3; this separation is even more clear for the results obtained with DeepIce and interestingly is approximately in the range of temperature where there is an change of morphology in ice crystals with hexagonal prism shape, from platelets to needles to platelets again.9
Previous simulations with TIP4P/Ice6 predicted a different order of thickness close to the melting point, with the basal surface characterized by a thicker QLL, followed by the primary prism and then by the secondary prism surfaces. Besides differences due to the use of a tetrahedral order parameter, the trends are similar except at high temperature. The discrepancies are likely to be due to a difference in sampling, which is substantially longer in our work at 270 K; our slabs are also larger. Size and sampling effects are more significant close to divergence and the melting point, which have still not been investigated in detail. Simulations with different water models (mW and TIP5P-Ew) also predicted a thinner QLL for the basal with respect to the primary prism surface close to the melting point.33,77
To obtain a result independent from the size of the supercell, we can evaluate the thickness of the QLLs (in Å) as follows:19
 | (10) |
 is the average number of liquid-like molecules during the simulation time, M = 18.01574 g mol−1 is the molecular weight of water, NAV is the Avogadro number, ρ is the density of water in units of g cm−3, S is the size of the ice surface exposed to vacuum. The 2 in the denominator take into account that the ice slab models have two independent QLLs at both ends. The calculations here use the vacuum-facing surface area of the supercell at the end of the NPT simulations at the relevant temperature, as used in the NVT simulations. However, the variation with temperature of the cell cross-sections calculations are fairly small. Specifically these cross sections are within 1984.76–1998.97 Å2 for the Ic (001) surface, 2120.09–2126.26 Å2 for the Ih basal surface, 1999.12–2003.67 Å2 for the Ih prism1 surface, and 2068.07–2082.14 Å2 for the Ih prism2 surface. In principle, there are also slight differences in the density of water at different temperatures. The density of the TIP4P/Ice water model at the melting point is close to 0.99 g cm−3,66 and this value is adopted here for the evaluation of the thickness.
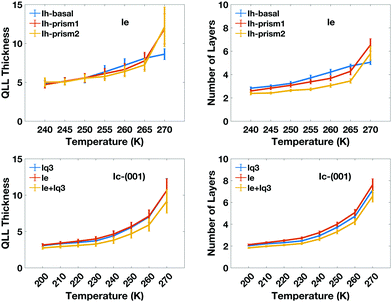
The calculated thickness in Å of the QLLs on Ic and Ih surfaces using the various recipes are summarized in Tables S1 and S2 in the ESI,† respectively. Here, the thickness of QLLs on Ic (001) surface calculated by lq3, le in single and double classification and on Ih surfaces defined by le are shown in Fig. 7 as an example. The Ic data in the bottom-left panel are shown for different recipes, while the Ih data in the top-left are shown for the different surfaces with the same classification method le. Even at temperature as low as 200 K, the liquid layer still appears on the ice surface with some thickness. Single and double classification methods both confirmed that the thickness of QLLs gradually increased with the increase of temperature. When the temperature is below 270 K, the thicknesses of QLLs at different ice surfaces at a specific temperature are close to each other.
We can also interpret the results in term of the number of ice-equivalent layers in the QLL, which is independent on the supercell, and reflects the arrangement in bilayers of the basal and prism1 Ih surfaces and in single layers of the Ih prism2 and the (001) Ic surfaces. The number of water molecules in each layer is 98 on the Ic (001) plane, 120 on the basal and primary prismatic planes, and 144 on the secondary prismatic plane. Hence, the number of layers can be calculated by dividing the average number of water molecules in QLLs by the water number in each layer. The results of the ice-equivalent number of layers for a single surface per slab are plotted in Fig. 7, to provide an idea of how many ice-equivalent layers are involved in the surface pre-melting. At 270 K the number of ice-equivalent layers on prismatic planes fluctuates by 2 to 3 as the error bar shows. This illustrates that additional layers start to melt and this transition causes the thickness of the melted layer to fluctuate more. The interface between the quasi-liquid layer and the ice is where the relevant crystallization and melting process occur, which causes the increase or decrease of the QLLs. The number of ice-equivalent layers on the basal plane is more stable with a fluctuation range from 1 to 2 ice-equivalent layers. This is linked to the rate of premelting and surface energy for different planes.43
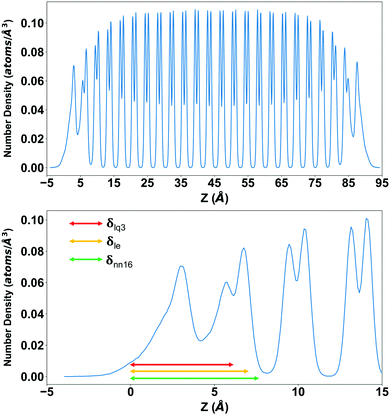
In the direction orthogonal to the surface, the QLL shows a “layered” structure, not necessarily corresponding to the number of ice-equivalent layers in Fig. 7, which can be monitored through the oxygen density in the direction orthogonal to the surface. As an example, the oxygen density for the Ih basal slab at 260 K is shown in Fig. 8, compared with the thickness estimated with a selection of methods: 7.50 ± 0.42 Å when calculated with DeepIce-nn16, 7.20 ± 0.43 Å with le, and 6.13 ± 0.39 Å with lq3. The QLL extends approximately to the first minimum with zero density of the density profile, and has a three-peak structure showing a degree of layering.
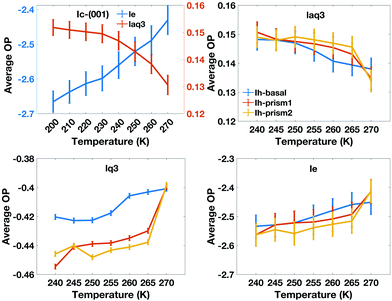
We also characterize the “character” of the liquid-like molecules in the QLLs by calculating, as a function of temperature, the average values of the order parameters for the water-like molecules, which are shown in Fig. 9. The le values of different ice Ih surfaces reflect the degree of disorder captured through entropy, which increases with temperature. It is interesting to note that the value of le for the basal plane between 250 K and 265 K is higher than that of the primary prism plane, which again may be correlated with the rate of growth and crystal morphology. This is consistent with experiments, where the interfacial water organization of the basal surface was found to undergo a transition from one to two molten bilayers at 257 K.43 However, the prism planes proceed in a continuous pattern with progressive melting, resulting in the cross-over. laq3 on all Ih surfaces shows a downward trend, but again with cross-overs for the basal and prism faces, while lq3 does not show this behaviour. The DeepIce results do not provide information on the character of the liquid-like molecules as they do not have a associated order parameter of variable value.
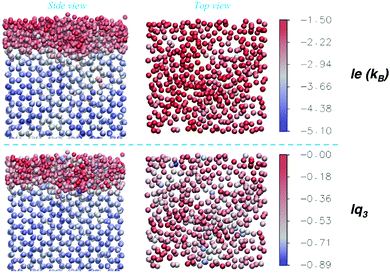
To complement the information of the average order parameters, an exemplary snapshot of one of the Ih prism2 surfaces at 270 K, hence at conditions characterized by large fluctuations, is shown in Fig. 10, where the oxygen atoms are coloured according to the values of either le (top) or lq3 (bottom). The two order parameters have different characteristic distributions for crystal and liquid-like molecules, as shown in Fig. 2 and evident in Fig. 10, with the occasional misclassified molecule. Instantaneous inhomogeneities are observable on the surfaces which may show in-plane patterns, as investigated for ice26,33 and other liquid surfaces.78
3.3 Comparison of recipes for characterizing the QLLs
The single classification (lq3, laq3, and le), the double classification (lq3–le, laq3–le), and DeepIce (nn10 and nn16) recipes have all proved to be overall good at distinguishing between liquid-like and ice molecules and thus at defining the quasi-liquid layers, giving qualitatively similar results. However, there are still some discrepancies in the definition of liquid-like molecules using the different recipes, which lead to errors in the accuracy of the final quantitative definition of the QLLs. Hence, we need to perform a comparative study of these recipes.The number of liquid-like molecules defined by lq3 and laq3 is always slightly smaller than the number of liquid-like molecules defined by le. By comparing the results obtained with lq3 and le we observe that the difference mainly occur at the ice-QLL interface, as shown in an example in Fig. 11 for the Ic and Ih prism2 slabs at 260 K, where the histograms show the location of the liquid-like molecules in the direction perpendicular to the surfaces. Here the number of liquid-like molecules identified by le but not by lq3 or laq3 is rather small, with laq3 detecting slightly less liquid-like molecules than lq3. le tends to identify more complete layers at the liquid-ice interface. Other surfaces show similar results with again some differences at the solid–liquid interfaces.
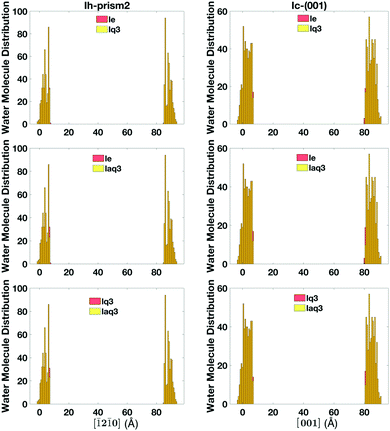 | ||
| Fig. 11 The histogram of the liquid-like molecules in QLLs detected by lq3, laq3, and le on Ic and Ih prism2 surfaces at 260 K. | ||
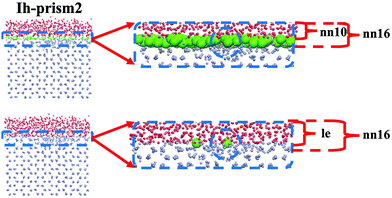
A comparison of DeepIce with 10 and 16 nearest neighbours is illustrated in Fig. 12 with an example of an MD snapshot for the Ih prism2 surface at 270 K. From this graph, compared to nn16, nn10 misses a certain amount of liquid-like molecules, which suggests that when the two nearest complete shells are taken into account, more information is provided for the classification of the molecule phase. By comparing DeepIce-nn16 with le we find that the results are very similar as illustrated in Fig. 12, with a few liquid-like molecule difference in this particular example.
From these results DeepIce-nn16 and le have similar identification capacity, followed by lq3 and laq3. From the computational point of view, DeepIce-nn16 is time-consuming in the datasets preparation stage, and calculations using le as implemented in PLUMED are more expensive because of the calculation of the g(r) than those using laq3 and lq3.
4 Conclusions
In this work, the QLLs on ice Ih and Ic have been systematically studied as a function of temperature by using different classification recipes. Molecular dynamics simulations showed that the size of QLLs increases as the temperature increases as expected. Among these recipes, the 3rd order local and local average Steinhardt parameters (lq3 and laq3) and the local entropy fingerprint (le) are all good at distinguishing ice and water molecules, with le identifying extra liquid molecules at the ice-liquid interface. The neural network DeepIce with 16 nearest neighbours in the datasets provides similar results to le, while using only 10 nearest neighbours tend to miss in Ih the identification of some liquid-like molecules at the QLL-ice interface compared with nn16 and le. The Steinhardt and entropy order parameters further provide some measure of the character of the molecules in the QLLs, which DeepIce cannot do. This can shed some light into the different temperature behaviour of the Ih basal and prism surfaces and its relation to the temperature-dependent morphology of hexagonal prism shaped crystals at low vapour pressure.9,79 The cross-overs of le and laq3 and of the QLL size as function of temperature for the Ih surfaces nicely correlates with the variation in crystal morphology.There are some differences in computational costs for the various methods, in the implementation we use, with DeepIce needing time in the datasets preparation and le some extra expenses with respect to the local Steinhardt parameters. As the order parameters were developed for bulk systems and used without modifications, it is interesting to observe that they do not seem to have problems at the surface level, but show some differences at the ice-QLL interface, which is a bulk-like environment. DeepIce is trained to recognize undercoordinated atoms at surfaces.
Overall, for qualitative trends all methods are equally valid, and the choice can be informed by computational convenience with the local Steinhart parameters representing a good compromise between accuracy and computational cost. If a precise information and definition is needed at the QLL-ice interface then DeepIce-nn16 and the entropy fingerprint le may be more precise. This could be important for cases like the Ih basal and prism1 surfaces characterized by closely spaced bilayers.
Conflicts of interest
There are no conflicts to declare.Acknowledgements
We are grateful for computational support from the UK high performance computing services ARCHER and ARCHER2, for which access was obtained via the UKCP consortium and funded by EPSRC grant EP/P022472/1, and the UK Materials and Molecular Modelling Hub for computational resources, which is partially funded by EPSRC (grants EP/P020194/1 and EP/T022213/1). We acknowledge the Royal Society International Exchange Scheme 2013/R2. JS is supported by a King's China Scholarship Council PhD studentship. We thank Pablo Piaggi (Princeton University) for information on the use of the entropy fingerprint in PLUMED, and Alejandro Santana Bonilla (King's College London) for technical support.The data supporting this work are available at the King's College London research data repository, KORDS, at https://doi.org/10.18742/19425842.v1. The PLUMED input files required to reproduce the results reported in this paper are available at PLUMED-NEST (http://www.plumed-nest.org), the public repository of the PLUMED consortium,80 with plumID:22.014.
References
- F. F. Abraham, Phys. Rep., 1981, 80, 340–374 CrossRef.
- J. Dash, Contemp. Phys., 1989, 30, 89–100 CrossRef CAS.
- F. Delogu, J. Phys. Chem. B, 2006, 110, 12645–12652 CrossRef CAS PubMed.
- A. Siavosh-Haghighi and D. L. Thompson, J. Phys. Chem. C, 2007, 111, 7980–7985 CrossRef CAS.
- N. H. Fletcher, The Chemical Physics of Ice, Cambridge University Press, 2009 Search PubMed.
- M. Conde, C. Vega and A. Patrykiejew, J. Chem. Phys., 2008, 129, 014702 CrossRef CAS.
- B. Slater and A. Michaelides, Nat. Rev. Chem., 2019, 3, 172–188 CrossRef CAS.
- M. J. Shultz, Phys. Today, 2018, 71, 34–39 CrossRef CAS.
- K. G. Libbrecht, Rep. Prog. Phys., 2005, 68, 855 CrossRef.
- G. C. Sosso, J. Chen, S. J. Cox, M. Fitzner, P. Pedevilla, A. Zen and A. Michaelides, Chem. Rev., 2016, 116, 7078–7116 CrossRef CAS.
- R. Peltier, Adv. Geophys., 1982, 24, 1–146 Search PubMed.
- P. V. Hobbs, Ice Physics, Oxford University Press, 2010 Search PubMed.
- M. Faraday, Proc. R. Soc. London, 1860, 440–450 Search PubMed.
- H. Bluhm, D. F. Ogletree, C. S. Fadley, Z. Hussain and M. Salmeron, J. Phys.: Condens. Matter, 2002, 14, L227 CrossRef CAS.
- A. Lied, H. Dosch and J. Bilgram, Phys. Rev. Lett., 1994, 72, 3554 CrossRef CAS PubMed.
- H. Dosch, A. Lied and J. Bilgram, Surf. Sci., 1995, 327, 145–164 CrossRef CAS.
- Y. Furukawa, M. Yamamoto and T. Kuroda, J. Cryst. Grow., 1987, 82, 665–677 CrossRef CAS.
- M. Goertz, X.-Y. Zhu and J. Houston, Langmuir, 2009, 25, 6905–6908 CrossRef CAS PubMed.
- A. Döppenschmidt and H.-J. Butt, Langmuir, 2000, 16, 6709–6714 CrossRef.
- X. Wei, P. B. Miranda and Y. Shen, Phys. Rev. Lett., 2001, 86, 1554 CrossRef CAS PubMed.
- S. F. Dec, J. Phys. Chem. C, 2009, 113, 12355–12361 CrossRef CAS.
- S. F. Dec, J. Phys. Chem. C, 2012, 116, 9660–9665 CrossRef CAS.
- M. T. Suter, P. U. Andersson and J. B. Pettersson, J. Chem. Phys., 2006, 125, 174704 CrossRef.
- H. Asakawa, G. Sazaki, K. Nagashima, S. Nakatsubo and Y. Furukawa, Proc. Natl. Acad. Sci. U. S. A., 2016, 113, 1749–1753 CrossRef CAS.
- M. J. Shultz, Annu. Rev. Phys. Chem., 2017, 68, 285–304 CrossRef CAS PubMed.
- T. Kling, F. Kling and D. Donadio, J. Phys. Chem. C, 2018, 122, 24780–24787 CrossRef CAS.
- A. Brumberg, K. Hammonds, I. Baker, E. H.-G. Backus, P. J. Bisson, M. Bonn, C. P. Daghlian, M. Mezger and M. J. Shultz, Proc. Natl. Acad. Sci. U. S. A., 2017, 114, 5349–5354 CrossRef CAS PubMed.
- J. Gelman Constantin, M. M. Gianetti, M. P. Longinotti and H. R. Corti, Atmos. Chem. Phys., 2018, 18, 14965–14978 CrossRef.
- X. Wei, P. B. Miranda, C. Zhang and Y. Shen, Phys. Rev. B: Condens. Matter Mater. Phys., 2002, 66, 085401 CrossRef.
- D. T. Limmer and D. Chandler, J. Chem. Phys., 2014, 141, 18C505 CrossRef PubMed.
- Y. Qiu and V. Molinero, J. Phys. Chem. Lett., 2018, 9, 5179–5182 CrossRef CAS PubMed.
- B. Weber, Y. Nagata, S. Ketzetzi, F. Tang, W. J. Smit, H. J. Bakker, E. H. Backus, M. Bonn and D. Bonn, J. Phys. Chem. Lett., 2018, 9, 2838–2842 CrossRef CAS PubMed.
- I. Pickering, M. Paleico, Y. A.-P. Sirkin, D. A. Scherlis and M. H. Factorovich, J. Phys. Chem. B, 2018, 122, 4880–4890 CrossRef CAS PubMed.
- T. Bartels-Rausch, V. Bergeron, J. H. Cartwright, R. Escribano, J. L. Finney, H. Grothe, P. J. Gutiérrez, J. Haapala, W. F. Kuhs and J. B. Pettersson, et al. , Rev. Mod. Phys., 2012, 84, 885 CrossRef CAS.
- V. Buch and J. P. Devlin, Water in Confining Geometries, Springer Science Business Media, 2003 Search PubMed.
- E. M. Schulson, JOM, 1999, 51, 21–27 CrossRef CAS.
- C. G. Salzmann and B. J. Murray, Nat. Mater., 2020, 19, 586–587 CrossRef CAS PubMed.
- E. B. Moore and V. Molinero, Phys. Chem. Chem. Phys., 2011, 13, 20008–20016 RSC.
- M. Chaplin, Water Structure and Science, 2002, https://water.lsbu.ac.uk/water/cubic_ice.html.
- E. A. Engel, B. Monserrat and R. J. Needs, Phys. Rev. X, 2015, 5, 021033 Search PubMed.
- B. Cheng, E. A. Engel, J. Behler, C. Dellago and M. Ceriotti, Proc. Natl. Acad. Sci. U. S. A., 2019, 116, 1110–1115 CrossRef CAS PubMed.
- S. J. Buxton, D. Quigley and S. Habershon, J. Chem. Phys., 2019, 151, 144503 CrossRef PubMed.
- M. A. Sánchez, T. Kling, T. Ishiyama, M.-J. van Zadel, P. J. Bisson, M. Mezger, M. N. Jochum, J. D. Cyran, W. J. Smit and H. J. Bakker, et al. , Proc. Natl. Acad. Sci. U. S. A., 2017, 114, 227–232 CrossRef PubMed.
- G. Johari, Philos. Mag. B, 1998, 78, 375–383 CrossRef CAS.
- P. M. Larsen, S. Schmidt and J. Schiøtz, Modell. Simul. Mater. Sci. Eng., 2016, 24, 055007 CrossRef.
- P.-L. Chau and A. Hardwick, Mol. Phys., 1998, 93, 511–518 CrossRef CAS.
- J. R. Errington and P. G. Debenedetti, Nature, 2001, 409, 318–321 CrossRef CAS PubMed.
- A. Stukowski, Modell. Simul. Mater. Sci. Eng., 2012, 20, 045021 CrossRef.
- P. J. Steinhardt, D. R. Nelson and M. Ronchetti, Phys. Rev. B: Condens. Matter Mater. Phys., 1983, 28, 784 CrossRef CAS.
- W. Lechner and C. Dellago, J. Chem. Phys., 2008, 129, 114707 CrossRef PubMed.
- M. Fitzner, G. C. Sosso, S. J. Cox and A. Michaelides, Proc. Natl. Acad. Sci. U. S. A., 2019, 116, 2009–2014 CrossRef CAS PubMed.
- M. Bonomi, D. Branduardi, G. Bussi, C. Camilloni, D. Provasi, P. Raiteri, D. Donadio, F. Marinelli, F. Pietrucci and R. A. Broglia, et al. , Comput. Phys. Commun., 2009, 180, 1961–1972 CrossRef CAS.
- B. Cheng, G. A. Tribello and M. Ceriotti, Phys. Rev. B: Condens. Matter Mater. Phys., 2015, 92, 180102 CrossRef.
- P. Rein ten Wolde, M. J. Ruiz-Montero and D. Frenkel, J. Chem. Phys., 1996, 104, 9932–9947 CrossRef.
- E. B. Moore, E. De La Llave, K. Welke, D. A. Scherlis and V. Molinero, Phys. Chem. Chem. Phys., 2010, 12, 4124–4134 RSC.
- A. H. Nguyen and V. Molinero, J. Phys. Chem. B, 2015, 119, 9369–9376 CrossRef CAS PubMed.
- F. Martelli, H.-Y. Ko, E. C. Oğuz and R. Car, Phys. Rev. B: Condens. Matter Mater. Phys., 2018, 97, 064105 CrossRef CAS.
- G. Roudsari, F. G. Veshki, B. Reischl and O. H. Pakarinen, J. Phys. Chem. B, 2021, 125, 3909–3917 CrossRef CAS PubMed.
- P. M. Piaggi and M. Parrinello, J. Chem. Phys., 2017, 147, 114112 CrossRef PubMed.
- P. Geiger and C. Dellago, J. Chem. Phys., 2013, 139, 164105 CrossRef PubMed.
- R. S. DeFever, C. Targonski, S. W. Hall, M. C. Smith and S. Sarupria, Chem. Sci., 2019, 10, 7503–7515 RSC.
- P. Gasparotto and M. Ceriotti, J. Chem. Phys., 2014, 141, 174110 CrossRef PubMed.
- Q. Kim, J.-H. Ko, S. Kim and W. Jhe, Phys. Chem. Chem. Phys., 2020, 22, 26340–26350 RSC.
- M. Fulford, M. Salvalaglio and C. Molteni, J. Chem. Inf. Model., 2019, 59, 2141–2149 CrossRef CAS PubMed.
- J. L. Abascal and C. Vega, J. Chem. Phys., 2005, 123, 234505 CrossRef CAS PubMed.
- J. Abascal, R. G. Fernandez, L. MacDowell, E. Sanz and C. Vega, J. Mol. Liq., 2007, 136, 214–220 CrossRef CAS.
- N. Grishina and V. Buch, J. Chem. Phys., 2004, 120, 5217–5225 CrossRef CAS PubMed.
- S. Plimpton, J. Comput. Phys., 1995, 117, 1–19 CrossRef CAS.
- G. A. Tribello, M. Bonomi, D. Branduardi, C. Camilloni and G. Bussi, Comput. Phys. Commun., 2014, 185, 604–613 CrossRef CAS.
- J. D. Honeycutt and H. C. Andersen, J. Phys. Chem., 1987, 91, 4950–4963 CrossRef CAS.
- A. Archer, H. R. Foxhall, N. L. Allan, D. S. Gunn, J. H. Harding, I. T. Todorov, K. P. Travis and J. A. Purton, J. Phys.: Condens. Matter, 2014, 26, 485011 CrossRef PubMed.
- A. Reinhardt, J. P. Doye, E. G. Noya and C. Vega, J. Chem. Phys., 2012, 137, 194504 CrossRef PubMed.
- F. Saija, A. M. Saitta and P. V. Giaquinta, J. Chem. Phys., 2003, 119, 3587–3589 CrossRef CAS.
- T. Truskett, S. Torquato and P. Debenedetti, Phys. Rev. E: Stat., Nonlinear, Soft Matter Phys., 2000, 62, 993 CrossRef CAS PubMed.
- F. Chollet et al. , Keras, 2015, https://keras.io Search PubMed.
- M. Abadi, A. Agarwal, P. Barham, E. Brevdo, Z. Chen, C. Citro, G. S. Corrado, A. Davis, J. Dean, M. Devin, S. Ghemawat, I. Goodfellow, A. Harp, G. Irving, M. Isard, Y. Jia, R. Jozefowicz, L. Kaiser, M. Kudlur, J. Levenberg, D. Mané, R. Monga, S. Moore, D. Murray, C. Olah, M. Schuster, J. Shlens, B. Steiner, I. Sutskever, K. Talwar, P. Tucker, V. Vanhoucke, V. Vasudevan, F. Viégas, O. Vinyals, P. Warden, M. Wattenberg, M. Wicke, Y. Yu and X. Zheng, TensorFlow: Large-Scale Machine Learning on Heterogeneous Systems, 2015, https://www.tensorflow.org/, Software available from tensorflow.org.
- J. Gelman Constantin, M. A. Carignano, H. R. Corti and I. Szleifer, J. Phys. Chem. C, 2015, 119, 27118–27124 CrossRef CAS.
- B. G. Walker, N. Marzari and C. Molteni, J. Chem. Phys., 2007, 127, 134703 CrossRef PubMed.
- K. G. Libbrecht, Annu. Rev. Mater. Res., 2017, 47, 271–295 CrossRef CAS.
- M. Bonomi, G. Bussi, C. Camilloni, G. A. Tribello, P. Banás, A. Barducci, M. Bernetti, P. G. Bolhuis, S. Bottaro, D. Branduardi, R. Capelli, P. Carloni, M. Ceriotti, A. Cesari, H. Chen, W. Chen, F. Colizzi, S. De, M. De La Pierre, D. Donadio, V. Drobot, B. Ensing, A. L. Ferguson, M. Filizola, J. S. Fraser, H. Fu, P. Gasparotto, F. L. Gervasio, F. Giberti, A. Gil-Ley, T. Giorgino, G. T. Heller, G. M. Hocky, M. Iannuzzi, M. Invernizzi, K. E. Jelfs, A. Jussupow, E. Kirilin, A. Laio, V. Limongelli, K. Lindorff-Larsen, T. Löhr, F. Marinelli, L. Martin-Samos, M. Masetti, R. Meyer, A. Michaelides, C. Molteni, T. Morishita, M. Nava, C. Paissoni, E. Papaleo, M. Parrinello, J. Pfaendtner, P. Piaggi, G. Piccini, A. Pietropaolo, F. Pietrucci, S. Pipolo, D. Provasi, D. Quigley, P. Raiteri, S. Raniolo, J. Rydzewski, M. Salvalaglio, G. C. Sosso, V. Spiwok, J. Sponer, D. W.-H. Swenson, P. Tiwary, O. Valsson, M. Vendruscolo, G. A. Voth and A. White, Nat. Methods, 2019, 16, 670–673 CrossRef PubMed.
Footnotes |
| † Electronic supplementary information (ESI) available. See DOI: https://doi.org/10.1039/d2cp00752e |
| ‡ Current address: Integrated Quantum Materials, Cavendish Laboratory, University of Cambridge, Cambridge, CB3 0HE, UK. |
| § Current address: Institute for Materials Discovery, University College London, Malet Place, London WC1E 7JE, UK. |
| ¶ Current address: Department of Chemistry University of Liverpool, Crown Street, Liverpool L69 7ZD, UK. |
| This journal is © the Owner Societies 2022 |

