
 Open Access Article
 This Open Access Article is licensed under a
 Creative Commons Attribution 3.0 Unported Licence
Side-chain tuning in conjugated polymer photocatalysts for improved hydrogen production from water†
Duncan J.
Woods‡
a,
Sam A. J.
Hillman‡
b,
Drew
Pearce
b,
Liam
Wilbraham
c,
Lucas Q.
Flagg
 d,
Warren
Duffy
e,
Iain
McCulloch
e,
James R.
Durrant
f,
Anne A. Y.
Guilbert
b,
Martijn A.
Zwijnenburg
*c,
Reiner Sebastian
Sprick
*a,
Jenny
Nelson
*b and
Andrew I.
Cooper
*a
d,
Warren
Duffy
e,
Iain
McCulloch
e,
James R.
Durrant
f,
Anne A. Y.
Guilbert
b,
Martijn A.
Zwijnenburg
*c,
Reiner Sebastian
Sprick
*a,
Jenny
Nelson
*b and
Andrew I.
Cooper
*a
aDepartment of Chemistry and Material Innovation Factory, University of Liverpool, Crown Street, Liverpool L69 7ZD, UK. E-mail: ssprick@liverpool.ac.uk; aicooper@liverpool.ac.uk
bDepartment of Physics and Centre for Plastic Electronics, Imperial College London, Prince Consort Road, London SW7 2AZ, UK. E-mail: jenny.nelson@imperial.ac.uk
cDepartment of Chemistry, University College London, 20 Gordon Street, London WC1H 0AJ, UK. E-mail: m.zwijnenburg@ucl.ac.uk
dDepartment of Chemistry, University of Washington, Seattle, WA 98195-1700, USA
eKing Abdullah University of Science and Technology, KAUST Solar Center, Thuwal 23955, Saudi Arabia
fDepartment of Chemistry and Centre for Plastic Electronics, Imperial College London, Exhibition Road, London SW7 2AZ, UK
First published on 7th May 2020
Abstract
Structure–property–activity relationships in solution processable polymer photocatalysts for hydrogen production from water were probed by varying the chemical structure of both the polymer side-chains and the polymer backbone. In both cases, the photocatalytic performance depends strongly on the inclusion of more polar groups, such as dibenzo[b,d]thiophene sulfone backbone units or oligo(ethylene glycol) side-chains. We used optical, spectroscopic, and structural characterisation techniques to understand the different catalytic activities of these systems. We find that although polar groups improve the wettability of the material with water in all cases, backbone and side-chain modifications affect photocatalytic performance in different ways: the inclusion of dibenzo[b,d]thiophene sulfone backbone units improves the thermodynamic driving force for hole transfer to the sacrificial donor, while the inclusion of oligo ethylene glycol side-chains aids the degree of polymer swelling and also extends the electron polaron lifetime. The best performing material, FS-TEG, exhibits a HER of 72.5 μmol h−1 for 25 mg photocatalyst (2.9 mmol g−1 h−1) when dispersed in the presence of a sacrificial donor and illuminated with λ > 420 nm light, corresponding to a hydrogen evolution EQE of 10% at 420 nm. When cast as a thin film, this HER was further boosted to 13.9 mmol g−1 h−1 (3.0 mmol m−2 h−1), which is among the highest rates in this field.
Broader contextHigh performance, light absorbing semiconductor materials are of interest for the photocatalytic solar-driven generation of hydrogen from water. Organic semiconductors are attractive candidates that can be synthesised from abundant materials. They offer control over microstructure, light harvesting properties, and redox potentials, and can be used in technologically simple devices. Despite strong recent advances in activities for organic photocatalysts, few studies have attempted to deconvolute the structural, optical, and electronic factors that affect photocatalytic performance. Here, we use computational design rules to guide the synthesis of a collection of novel linear conjugated polymer photocatalysts, focussing on the effect of polar groups in the backbone and as side chains on the polymers’ interactions with their liquid environments. The most polar materials are among the best performing organic photocatalysts reported to date, with hydrogen evolution rates reaching levels similar to many inorganic photocatalysts. We combine computational, spectroscopic and other experimental techniques to distinguish the different effects of modifying the backbone and side chains. By capitalising on the impact of polarity on polymer microstructure, we used the champion polymer to build a scaled-up photoreactor that operated under natural sunlight, demonstrating a beginning-to-end workflow from computational design through to fully scalable devices. |
Introduction
While inorganic semiconductor materials have been investigated for decades for the photocatalytic production of hydrogen from water,1–4 the application of organic materials as photocatalysts has attracted attention only recently. Organic photocatalysts can be prepared from earth-abundant starting materials and offer advantages such as synthetic modularity and tunability of band gaps.5–7 In particular, the recent development of linear conjugated polymer photocatalysts8–11 has allowed for a more systematic fine-tuning of optical properties, band positions and other properties compared to carbon nitrides (C3N4),12,13 covalent organic frameworks (COFs),14–16 covalent triazine-based frameworks (CTFs)17–19 and conjugated microporous polymers (CMPs).20–22In most cases, these organic photocatalysts have not been shown to oxidize water. For this reason, hole scavengers, typically amines, are used to facilitate hydrogen production, with the exception of a few reports on modified carbon nitrides,23–25 Z-schemes with carbon nitrides,12 and two claims of overall water splitting using CMPs.26,27
We demonstrated recently that the addition of solubilizing alkyl side-chains to a carbazole-phenylene co-polymer allowed for the processing of photocatalytically active films with a high surface area to volume ratio.28 However, the activity of this material was rather low, in part due to the hydrophobic nature of the side-chain. Recent studies have shown that polymer hydrophilicity is an important factor in determining photocatalytic performance.29–32 The incorporation of polar moieties such as dibenzo[b,d]thiophene sulfone33 or nitrogen substituted benzenes34 into the polymer backbone substantially improves the interaction with water. This in turn enhances the hydrogen evolution activity, partly by stabilizing the charge-separated state that is produced by hole transfer to the hole scavenger following photoexcitation of the polymer.29
While control of charge separation via chemical structure is useful, modification of the backbone to control polarity will also impact the electronic properties of the materials. To address the challenge of catalyst hydrophobicity independently of electronic properties, we investigate here the incorporation of more hydrophilic side-chains, which also allow for convenient processing in common organic solvents and enhanced interaction of the catalyst with water.
While control of charge separation via chemical structure is useful, modification of the backbone to control polarity will also impact the electronic properties of the materials. To address the challenge of catalyst hydrophobicity independently of electronic properties, we investigate here the incorporation of more hydrophilic side-chains, which also allow for convenient processing in common organic solvents and enhanced interaction of the catalyst with water.
We present two series of co-polymers containing fluorene and either non-polar phenylene or polar dibenzo[b,d]thiophene sulfone units.8,29 The polarity is further modulated through the choice of the side-chain on the fluorene unit; that is, by using di-n-hexyl-, di-2-ethylhexyl-, di-n-octyl-, di-n-dodecyl-, or di-tri(ethylene glycol) side-chains. In particular, tri(ethylene glycol) (TEG) side-chains are more hydrophilic compared to the alkyl side-chains and are hence expected to attract water when the polymers are dispersed in aqueous mixtures, thus aiding photocatalytic performance.35
Dimethyl-9H-fluorene co-polymers,8,30 which are insoluble in chloroform, were also included in this study to further investigate the effect of the side-chains. Hydrogen evolution experiments were performed on polymer particles dispersed in water mixtures containing triethylamine (TEA) as the sacrificial hole-scavenger, with methanol also added to enhance the miscibility of TEA with water.8 We found that photocatalytic activity is substantially increased both by modifying the backbone to include polar dibenzo[b,d]thiophene sulfone and by using polar TEG side-chains instead of alkyl side-chains. A comparison of co-polymers of dibenzo[b,d]thiophene sulfone with either alkyl-fluorene or TEG-substituted-fluorene units, were studied by atomistic molecular dynamics (MD), density functional theory (DFT) calculations, contact angle measurements, quartz crystal microbalance (QCM) gravimetry, atomic force microscopy (AFM), photoelectron spectroscopy in air (PESA), and femtosecond and microsecond transient absorption spectroscopy (TAS). This combination of techniques revealed in detail how the TEG side-chains influence the photocatalytic properties of the polymer. We confirmed that TEG side-chains enhance the polymer's affinity for water, and found that this increases swelling in aqueous environments as well as lengthening the lifetime of the photogenerated polaronic state. We also evaluated the performance of the most active material when cast on different supports, highlighting the benefit of solution processing for maximizing catalytically active surface area. Furthermore, the potential for scale-up was shown through application of a solution-processable material in a photoreactor on a 1 liter scale.
Results
Materials design and synthesis
Our design objective was to improve the photocatalytic performance of linear conjugated polymers through the inclusion of polar groups. As a design tool, we first used atomistic molecular dynamics (MD) simulations to explore the liquid-polymer interactions in a co-polymer of dibenzo[b,d]thiophene sulfone and 9,9-dioctyl-9H-fluorene, FS-Oct, and the analogue where n-octyl side-chains are replaced by tri(ethylene glycol) (TEG) side-chains, FS-TEG. We chose to study n-octyl side-chains in order to avoid effects due to differences in side-chain length, as opposed to solvation interactions. In these simulations, we studied short oligomers (trimers) of each polymer in the same water/methanol/TEA (1![[thin space (1/6-em)]](https://www.rsc.org/images/entities/char_2009.gif) :1:1) mixture that was used in hydrogen evolution experiments. We see from Fig. 1c that TEG side-chains increase the water content of the local environment of the polymer at the expense of TEA. Our previous work29 showed that this water affinity can also be achieved using dibenzo[b,d]thiophene sulfone units in the polymer backbone, with the more polar local environment being critical to achieving higher hydrogen evolution rates. Thus, based on this molecular dynamics model we would predict that TEG side-chains should increase the polarity of the surrounding medium and, hence, might tend to assist hydrogen evolution.29 Following these simulations, two series of polymers with fluorene-phenylene (FP) and fluorene-dibenzo[b,d]thiophene sulfone (FS) backbones were prepared (Fig. 1a). Within each series both n-octyl (FP-Oct, FS-Oct) and TEG (FP-TEG, FS-TEG) side-chains were utilized.
:1:1) mixture that was used in hydrogen evolution experiments. We see from Fig. 1c that TEG side-chains increase the water content of the local environment of the polymer at the expense of TEA. Our previous work29 showed that this water affinity can also be achieved using dibenzo[b,d]thiophene sulfone units in the polymer backbone, with the more polar local environment being critical to achieving higher hydrogen evolution rates. Thus, based on this molecular dynamics model we would predict that TEG side-chains should increase the polarity of the surrounding medium and, hence, might tend to assist hydrogen evolution.29 Following these simulations, two series of polymers with fluorene-phenylene (FP) and fluorene-dibenzo[b,d]thiophene sulfone (FS) backbones were prepared (Fig. 1a). Within each series both n-octyl (FP-Oct, FS-Oct) and TEG (FP-TEG, FS-TEG) side-chains were utilized.
 | ||
| Fig. 1 (a) Structure of the fluorene co-phenyl (FP-R) and fluorene-co-dibenzo[b,d]thiophene sulfone (FS-R) polymer series where R is the alkyl group which is modified as shown; (b) molecular dynamics simulations of FS-Oct and FS-TEG in 1:1:1 water/methanol/TEA. TEA is shown in blue, and the water/methanol phase is shown in pink. In these simulations, FS-TEG draws a substantially higher concentration of water close to the polymer backbone at the expense of TEA; (c) bar chart showing fraction of volume within a 2 nm radius of the oligomer that is occupied by each component in the liquid medium: methanol (orange), water (red) and TEA (blue). | ||
A further three pairs of polymers with different alkyl side-chains (FP-Hex, FS-Hex = n-hexyl, FP-EtHex, FS-EtHex = 2-ethylhexyl, FP-Dodec, FS-Dodec = n-dodecyl) were also synthesized to study the influence of the type of solubilizing side-chain on photocatalytic performance. All polymers were synthesized by Pd(0)-catalyzed Suzuki–Miyaura-type polycondensation, purified by Soxhlet extraction and reprecipitation into methanol from chloroform except for FP-Me (previously reported as P2)8 and FS-Me (previously reported as P35),30 in which case no chloroform-soluble fraction was obtained. In these two cases, the insoluble fraction was used for all further experiments. All other polycondensation reactions gave chloroform-soluble fractions in yields ranging from 17–79%.
1H NMR spectroscopy (Fig. S1 and S2, ESI†), and gel permeation chromatography (GPC) were used to study the structures and molecular weights of the soluble materials. The number average molecular weights (Mn) range from 6600 to 18200 g mol−1 for the FP series and from 3800 to 19000 g mol−1 for the FS series (Table 1). Powder X-ray diffraction (PXRD) patterns that show none of the polymers are highly crystalline although, in line with observations by others,36 members of the FS series with shorter side-chains appear to have some limited long-range order (Fig. S4 and S5, ESI†). Thermogravimetric analysis (TGA) shows that all materials exhibit thermal stability under air up to 300 °C (Fig. S6 and S7, ESI†). This is somewhat lower than for other insoluble, unsubstituted photocatalysts,20,29,30 but is typical for polyfluorenes with solubilizing side-chains.35,37
| Polymer | M n /g mol−1 | M w /g mol−1 | Đ | Optical gapc/eV | Contact angle (H2O)d/° | HERe/μmol h−1 |
|---|---|---|---|---|---|---|
|
a Obtained from gel permeation chromatography in chloroform calibrated against polystyrene standards (see ESI for full details).
b Polymer dispersity index (Mw/Mn).
c Optical band gap calculated from absorption on-set of films.
d Contact angles of polymer films with water (3 μL) at room temperature calculated using the Laplace–Young equation.
e Conditions: 25 mg polymer was suspended in 22.5 mL water/methanol/triethylamine solution (1:1:1), irradiated with visible light (λ > 420 nm filter, 300 W Xe light source).
f Not determined due to insolubility in CHCl3.
g Measured in the solid-state with diffuse reflectance spectrophotometry.
h Measured for polymer pellets instead of thin-films.
|
||||||
| FP-Me | —f | —f | —f | 2.86g | 94.0 ± 8.0h | 0.20 ± 0.03 |
| FP-Hex | 18200 |
43200 |
4.4 | 2.97 | 92.8 ± 0.6 | 0 |
| FP-EtHex | 14600 |
39000 |
2.7 | 3.02 | 94.7 ± 0.3 | 0.10 ± 0.03 |
| FP-Oct | 16300 |
57900 |
3.6 | 2.98 | 101.4 ± 0.6 | 0.13 ± 0.03 |
| FP-Dodec | 6600 | 12900 |
2.0 | 2.99 | 99.4 ± 0.5 | 0.15 ± 0.03 |
| FP-TEG | 8200 | 12300 |
1.5 | 2.94 | 72.0 ± 1.0 | 7.65 ± 0.15 |
| FS-Me | —f | —f | —f | 2.59g | 77.0 ± 3.0h | 21.00 ± 0.50 |
| FS-Hex | 3800 | 8200 | 2.2 | 2.80 | 83.0 ± 4.0 | 34.25 ± 0.75 |
| FS-EtHex | 19000 |
36900 |
1.9 | 2.84 | 86.4 ± 1.2 | 13.38 ± 0.08 |
| FS-Oct | 14900 |
25400 |
1.7 | 2.83 | 90.2 ± 0.4 | 17.00 ± 0.75 |
| FS-Dodec | 18900 |
31900 |
1.7 | 2.82 | 109 ± 2.7 | 12.00 ± 0.15 |
| FS-TEG | 8700 | 11500 |
1.4 | 2.79 | 69.6 ± 0.3 | 72.50 ± 2.50 |
Absorption and emission properties
The light absorption and photoluminescence of the polymers were measured as powders, as spin-coated films, and as solutions dissolved in chloroform (Fig. S8–S19, ESI†). The absorption and emission profiles of the FP series dissolved in chloroform are typical of poly(fluorene)-type materials (λmax ≈ 370 nm, PLmax ≈ 410 nm, Fig. S8, ESI†).38 The absorption spectra of solutions of the FS series (Fig. S14, ESI†) are all red-shifted in relation to the FP series, but are otherwise similar with minimal variation across the series. (TD-)DFT calculations, performed for both the chloroform and solid-state cases (Table S2, ESI†), show the same red-shift in the absorption on-set for FS polymers relative to FP polymers as observed experimentally.The ground state absorption of FS-TEG and FS-Hex dispersions in the water/methanol/TEA mixture are shown in Fig. 2a. Both exhibit an absorption peak around the 400–420 nm region with tails which extend into the visible region such that these materials may be expected to show photocatalytic activity upon 420 nm excitation (vide infra). Both materials also exhibit some absorption below 300 nm, though this is irrelevant in the context of the visible-light-driven hydrogen evolution experiments performed here. The specific absorbance of FS-TEG is considerably higher than that of FS-Hex when dispersed in water/methanol/TEA mixtures at low concentrations. As the decadic molar extinction coefficients of the two polymers are similar in chloroform, this difference in absorbance in the aqueous mixture may be caused by differences in the particle size distributions, given that the efficiency of light harvesting per unit volume for a particle decreases continuously with increasing particle size, once the particle is large compared to the wavelength of light. Different particle size distributions could result from differences in dispersibility in reaction mixture between the two materials. We note that, although there is a significant difference in absorbance in the samples shown in Fig. 2, the same difference in absorptivity may necessarily not apply to the samples measured for hydrogen evolution. Dispersions studied for hydrogen evolution are significantly more concentrated and of a larger volume, making FS-Hex and FS-TEG highly scattering and relatively opaque, such that specific absorption is difficult to measure.
 | ||
| Fig. 2 (a) Absorption spectra of FS-TEG and FS-Hex dispersions in water/methanol/TEA (1:1:1), filtered from 1 mg mL−1 dispersions using a 1.5 μm filter to reduce scattering. The dashed line is at 420 nm; (b) (1-transmittance) at 420 nm of FS-TEG and FS-Hex samples which have been filtered from 1 mg mL−1 dispersions with Nylon filters of different pore sizes (see also Fig. S58 for spectra, ESI†). All polymers were dispersed in water/methanol/TEA and measured in a 1 mm quartz cuvette. | ||
Polymer–liquid interaction
Particle size distributions of FS-Hex, FS-Oct, FS-Dodec and FS-TEG were estimated by static light scattering (SLS) in water and water/methanol/TEA (1:1:1) (Table S3, ESI†). In all cases, Sauter mean diameters39 were on the order of micrometers or higher (ESI,† Section 7). SLS measurements show that these dispersions are polydisperse and dominated by particles that are relatively large (ca. 10 μm) relative to their likely exciton diffusion lengths (<10 nm). Hence, the Sauter mean diameters are representative of particles with relatively low specific activity; smaller, more active particles that may be present are not detected in this measurement. To characterize the distribution of these smaller particles, 1 mg mL−1 dispersions of FS-Hex and FS-TEG were passed through filters of varying pore size and their ground state transmission measured.
For exactness, the data in Fig. 2 represents the amount of light not transmitted rather than absorbed and hence includes a contribution of light lost due to scattering. However, these scattering differences are small relative to the intensity of the main absorption peak, allowing valid discussion of differences in absorbance.
Fig. 2b shows the percentage of photons not transmitted at 420 nm for each filtered sample. The spectra can be found in Fig. S22 (ESI†). Neither polymer is filtered out completely at a specific pore size, indicating that both are highly polydisperse, in line with the SLS experiments. The absorbance of the FS-TEG samples are higher than those of the FS-Hex samples for all filter sizes.
Absorption measurements taken on FS-Hex and FS-TEG films of varying thickness suggest that 99% of 420 nm photons are absorbed within approximately 200–300 nm of the surface. By assuming that absorption only occurs within the ∼200–300 nm of each particle that is closest to the probe beam source, and that the dispersions can be represented by a quad-modal distribution with particles of exactly 1.5, 1.0, 0.45 and 0.20 μm in diameter, the calculated relative absorbance per particle can be used to estimate this quad-modal number distribution from the dispersion absorption data. Details of this calculation can be found in the ESI† (Fig. S22, S24, S25 and Table S4).
For the 0.2 μm pore size, the absorbance of FS-TEG is around 16 times higher than FS-Hex. Since the absorbing volume per particle is similar for the 0.2 μm filtered samples, the FS-TEG dispersion is estimated to comprise approximately 16 times as many particles as FS-Hex that are smaller than 0.2 μm. Contact angle measurements on polymer films (Table 1) show that FS-TEG exhibits a lower contact angle with water (69.6°) than both FS-Hex (83.0°) and FS-Oct (90.2°). Similarly, FP-TEG has a significantly reduced contact angle with water compared to FP-Hex and FP-Oct (72.0° vs. 92.8 and 101.4°). The TEG side-chains enhance the wettability of these materials considerably compared to their alkylated counterparts, as expected from MD simulation results. We also observe an increase in contact angle with increasing alkyl side-chain length from 83.0° for FS-Hex to 109.0° for FS-Dodec. The FS series of polymers are found to be less hydrophobic than the FP polymers.
The polymers in this work were not expected to be porous. Nitrogen sorption measurements confirmed that both FS-Hex and FS-TEG are non-porous to nitrogen with Brunauer–Emmett–Teller surface areas (SABET) determined to be 46 and 6 m2 g−1 (Fig. S29, ESI†). This is low compared to non-alkylated, crosslinked polymer networks.30 However, dynamic water vapour sorption (DVS) measurements showed a notably higher uptake for FS-TEG compared to FS-Hex (Fig. 3). The type-III water uptake isotherm of FS-TEG is indicative of swelling of the polymer in an aqueous environment.40 To investigate the possibility that these polymers are permeable when dispersed, we compared the thickness and mass of dry FS-Hex and FS-TEG films to films exposed to either water or TEA. Atomic force microscopy (AFM) shows that films of FS-TEG swell by 37 ± 7% when in contact with water. FS-Hex, conversely, exhibits negligible swelling (Fig. S30, ESI†).
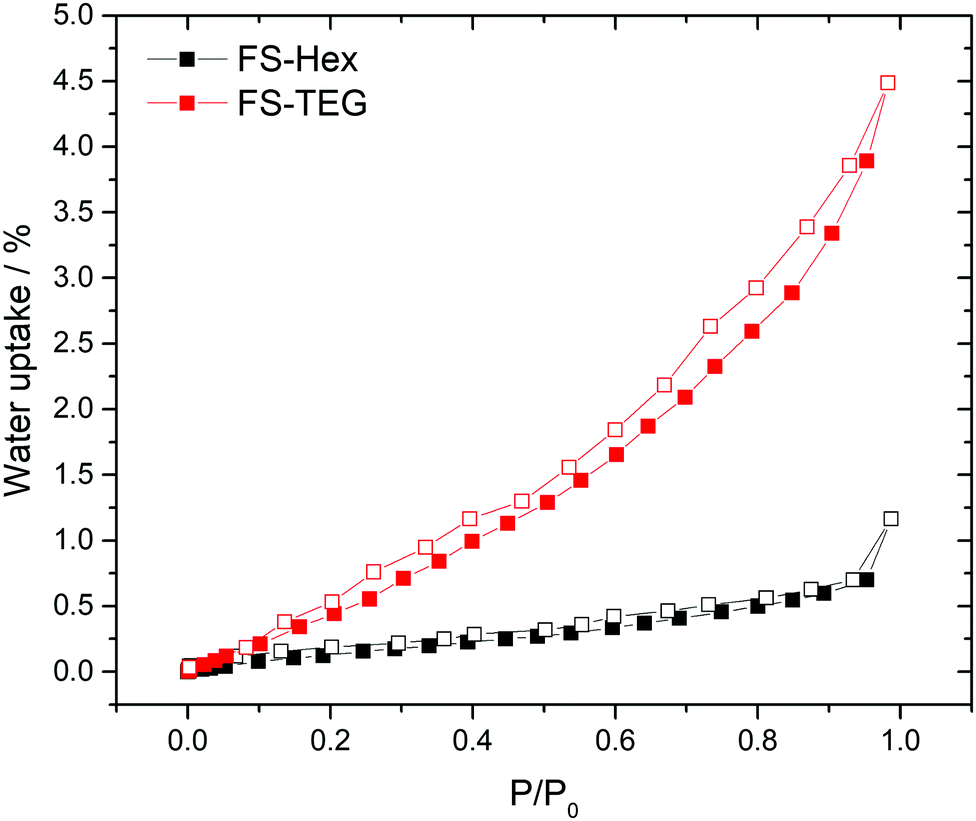 | ||
| Fig. 3 Water vapor isotherms of FS-Hex and FS-TEG at 20.0 °C and up to 23 mbar. | ||
Quartz crystal microbalance (QCM) measurements also support this result, showing that a FS-TEG film gains more mass upon exposure to water than a FS-Hex film (Fig. S31, ESI†). AFM measurements also show that both FS-TEG and FS-Hex swell moderately in TEA (19 ± 7% and 14 ± 10% respectively), suggesting that the nature of the side-chain does not significantly impact permeability to the scavenger.
Potentials
The ionization potentials (IP) of the polymers were measured experimentally for dry films using photoelectron spectroscopy in air (PESA) and in the case of FS-TEG films also by cyclic voltammetry (CV) in acetonitrile. The ionization potentials, electron affinities (EA) and exciton potentials (IP* and EA*) of the polymers with alkyl side-chains were also predicted using (TD-)DFT.29,41,42 In these calculations, the potentials of dry polymers are considered alongside polymers immersed in pure TEA and immersed in pure water. For reasons of computational tractability, in all calculations side-chains are described as methyl groups. Focussing initially on the dry polymers, both the experimental PESA measurements and the DFT predictions agree that the ionization potentials of the FS polymers with alkyl side-chains, e.g., FS-Me or FS-Hex, lie deeper than those of the corresponding FP polymers, e.g.FP-Me or FP-Hex (Fig. 4, air panel, see also Table S2 and S6, ESI†).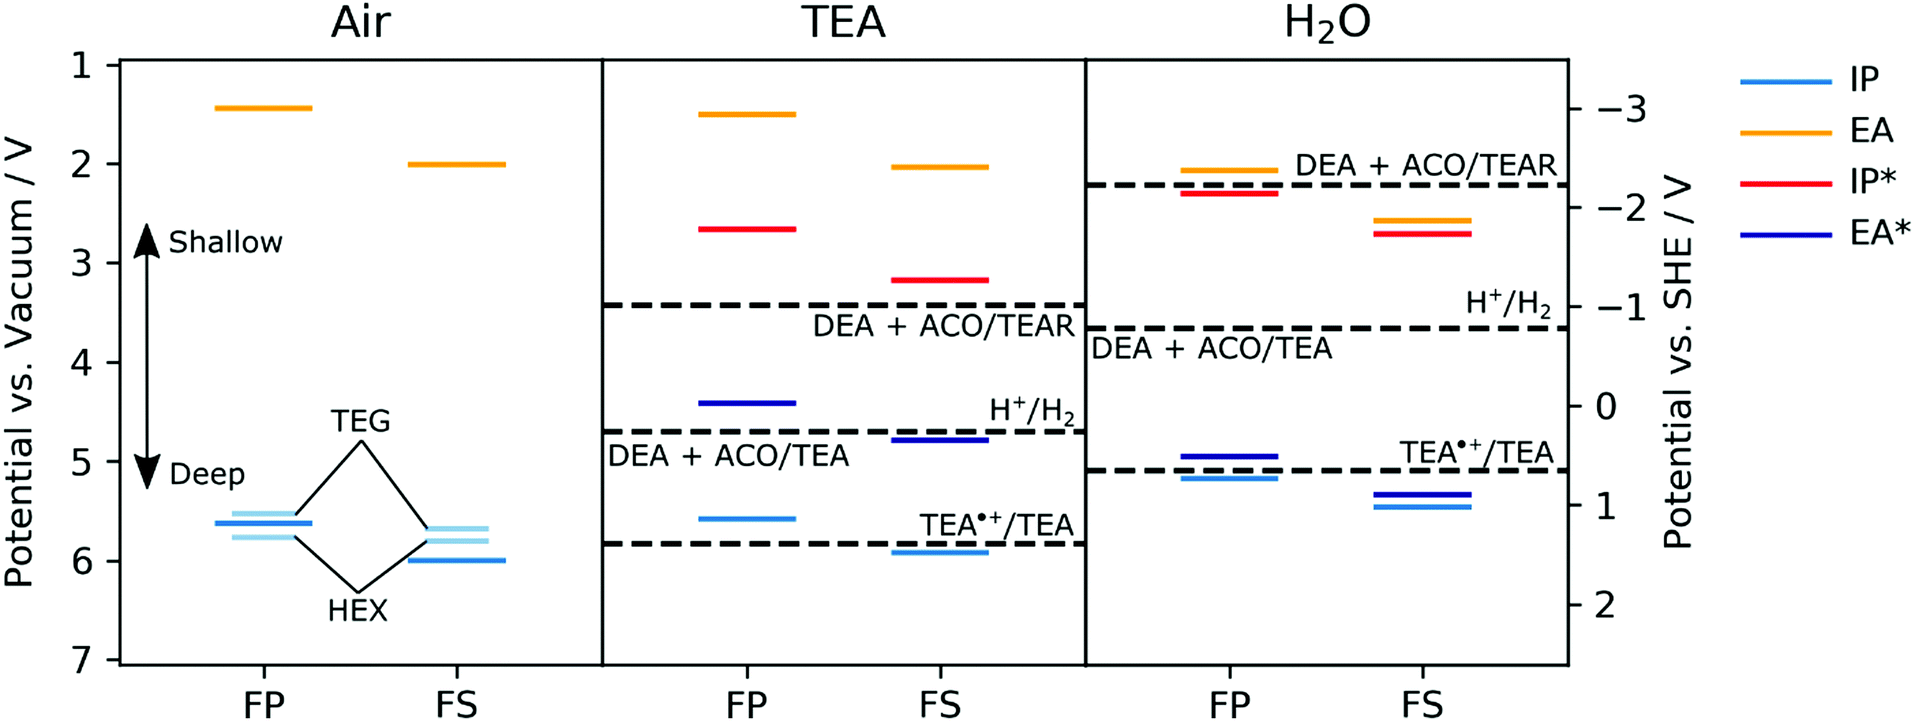 | ||
| Fig. 4 Experimental potentials for FP-TEG, FP-Hex, FS-TEG and FS-Hex films in air (left panel, shorter, light blue lines) and DFT-predicted ground and excited-state ionization potentials and electron affinities of FP-Me and FS-Me in the presence of air (left panel, thicker lines), TEA (central panel) and water (pH ∼ 11, right panel). In the DFT (B3LYP/DZP)43–46 calculations the polymers are modelled as single strands embedded in a dielectric continuum47 with a relative dielectric permittivity value of 80.1, 2.38 and 2.0, describing the dielectric screening of charges in the polymer near the surface of the polymer particles by water, TEA or the polymers themselves in the absence of a liquid (i.e., air) respectively. Solution potentials have been taken from previous work,29 where protons in all half-reactions were modelled as adducts with TEA (i.e. TEA:H+). TEA˙+ = charged triethylamine radical; DEA = diethylamine; ACO = acetaldehyde; TEAR = neutral triethylamine radical. | ||
The IP of a FS-TEG film in acetonitrile, approximated from the onset of oxidation current in a cyclic voltammetry experiment, gives similar values to those predicted by DFT (see Fig. S33 and Table S8, ESI†). The PESA-measured ionization potentials of the polymers with TEG side-chains maintain the same relationship between backbone and IP but are also shifted to slightly shallower values than their alkylated analogues relative to vacuum (see also Table S6, ESI†). This shift is most likely due to the higher relative dielectric permittivity of TEG side-chains than alkyl side-chains, combined with the possible absorption of atmospheric water vapour, stabilizing the photogenerated holes.
The predicted IP values for FP-Me and FS-Me get shallower as the relative permittivity of the environment is increased (air to TEA to water), whilst the predicted EA values get correspondingly deeper (Fig. 4). In all cases, FS potentials remain deeper than FP potentials. This is in line with what is expected from previous work simulating different dielectric environments.46 Comparing the predicted EA potentials to the solution half-reactions for proton reduction to molecular hydrogen suggests that both polymers FP-Me and FS-Me should have a significant driving force for proton reduction.
However, the EA* level for FP-Me is shallower than the potential for the one-hole oxidation of TEA to its radical form (TEA˙+/TEA29), both in TEA and in water, while FS-Me has a small driving force for this reaction when in water. As this reaction is the first step of TEA oxidation, this indicates that the ability of FP polymers to oxidise TEA may be severely hindered despite having a significant driving force for the overall reaction TEA/[DEA + ACO].
Hydrogen evolution experiments
Hydrogen evolution experiments were performed under visible light irradiation (λ > 420 nm, 300 W Xe light source) on polymer dispersions in water/methanol/TEA (1:1:1 by volume). The hydrogen evolution rates (HERs) of insoluble methyl-substituted FP-Me and all alkylated FP polymers were found to be poor (<0.25 μmol h−1, see Table 1). However, the performance of the TEG-substituted FP-TEG was significantly higher than the alkylated polymers, with a HER of 7.65 μmol h−1.
The photocatalytic activities of polymers in the FS series are all notably higher than analogues in the FP series. All alkylated polymers evolve hydrogen at a lower rate than FS-Me (21.0 μmol h−1) apart from FS-Hex which is somewhat higher (34.3 μmol h−1), which can possibly be explained by differences in molecular weight. Hydrogen evolution performance is generally found to decrease with increasing alkyl side-chain length (e.g.FS-Hex = 34.3 μmol h−1, FS-Dodec = 12.0 μmol h−1). As with the FP series, FS-TEG displays significantly enhanced performance relative to alkylated analogues with a rate of 72.5 μmol h−1 under visible light illumination. Wavelength-dependent experiments of powders and films of FS-TEG (Fig. S51 and S52, ESI†) show that the hydrogen evolution rate follows the optical absorption spectrum and hence that the hydrogen is indeed photocatalytic in origin. External quantum efficiencies (EQE) of FS-TEG dispersions were estimated to be 10.0% at 420 nm and 3.2% at 470 nm (see ESI† for details). This is higher than many insoluble polymer photocatalysts, such as poly(p-phenylene) (EQE420nm = 0.4%), dibenzo[b,d]thiophene sulfone phenylene co-polymer P7 (EQE420nm = 7.2%) under the same conditions in water/methanol/TEA mixtures,8,29 but lower than dibenzo[b,d]thiophene sulfone dibenzo[b,d]thiophene co-polymer P64 under the same conditions in water/methanol/TEA mixtures (EQE420nm = 20.7%)33 and CTF co-polymer with phenyl-benzothiadiazole and carbazole loaded with Pt nanoparticles from aqueous triethanolamine solution (10 vol%) (EQE420nm = 22.8%).48 A wider-literature comparison to other polymer photocatalysts can be found in Table S14 (ESI†).
The photocatalytic performance of an FS-TEG dispersion under visible light irradiation (λ > 420 nm, 300 W Xe light source) was tested over 85 hours with intermittent degassing (Fig. S44, ESI†). Over 2.1 mmol of H2 was evolved over this period. While a reduction in photocatalytic performance was observed, this does not seem to be due to polymer degradation as evident by 1H NMR spectroscopy taken after the photocatalysis experiment (Fig. S3, ESI†).
A freestanding film, obtained during the filtration of the polymer after reprecipitation in methanol, was found to have excellent photocatalytic stability; it evolved 881 μmol hydrogen over 141 hours in 5 vol% TEA under visible light irradiation (Fig. 6).
In this case, we were able to replace the sacrificial mixture and show that photocatalytic activity can be almost completely recovered, suggesting that the loss of performance over time may be associated with degradation of the scavenger solution and/or fouling of the catalyst surface rather than polymer degradation, at least over timescales of a few hundred hours. This is further confirmed by 1H NMR and UV-vis spectra of the sample that show no changes compared to the as made materials (S45 and S46, ESI†). Long-term performance of FS-TEG was also tested using other sacrificial reagents: specifically, L-ascorbic acid (0.2 M) and a Na2S/Na2SO3 mixture (0.35 M/0.25 M) (Fig. S47, ESI†). Steady hydrogen evolution was observed over more than 80 hours although the rates were, as anticipated, significantly lower than for the water/methanol/TEA mixture (1.2 and 0.6 μmol h−1 for the L-ascorbic acid and Na2S/Na2SO3 mixtures, respectively).
Polymer photocatalysts on supports
Hydrogen evolution experiments were also performed on FS-TEG films immersed in a 5 vol% solution of TEA in water. To prevent delamination of the film glass slides were first treated with n-octadecyltrichlorosilane (OTS), which promotes adherence of the polymers to the glass support.49,50The homogeneity of films cast on these supports enabled the effect of altering film thickness on photocatalytic performance to be investigated. Film thicknesses were measured using atomic force microscopy (AFM) for thin films and profilometry for thicker samples. Hydrogen evolution rates, obtained by irradiating the slides in 5 vol% TEA solutions over a 5 hour period, show a linear increase in performance with increasing FS-TEG film thickness from 11.3 nm up to 79 nm (Fig. 5d). The 79 nm-thick film evolved hydrogen at a rate of 5.3 ± 0.4 mmol m−2 h−1.
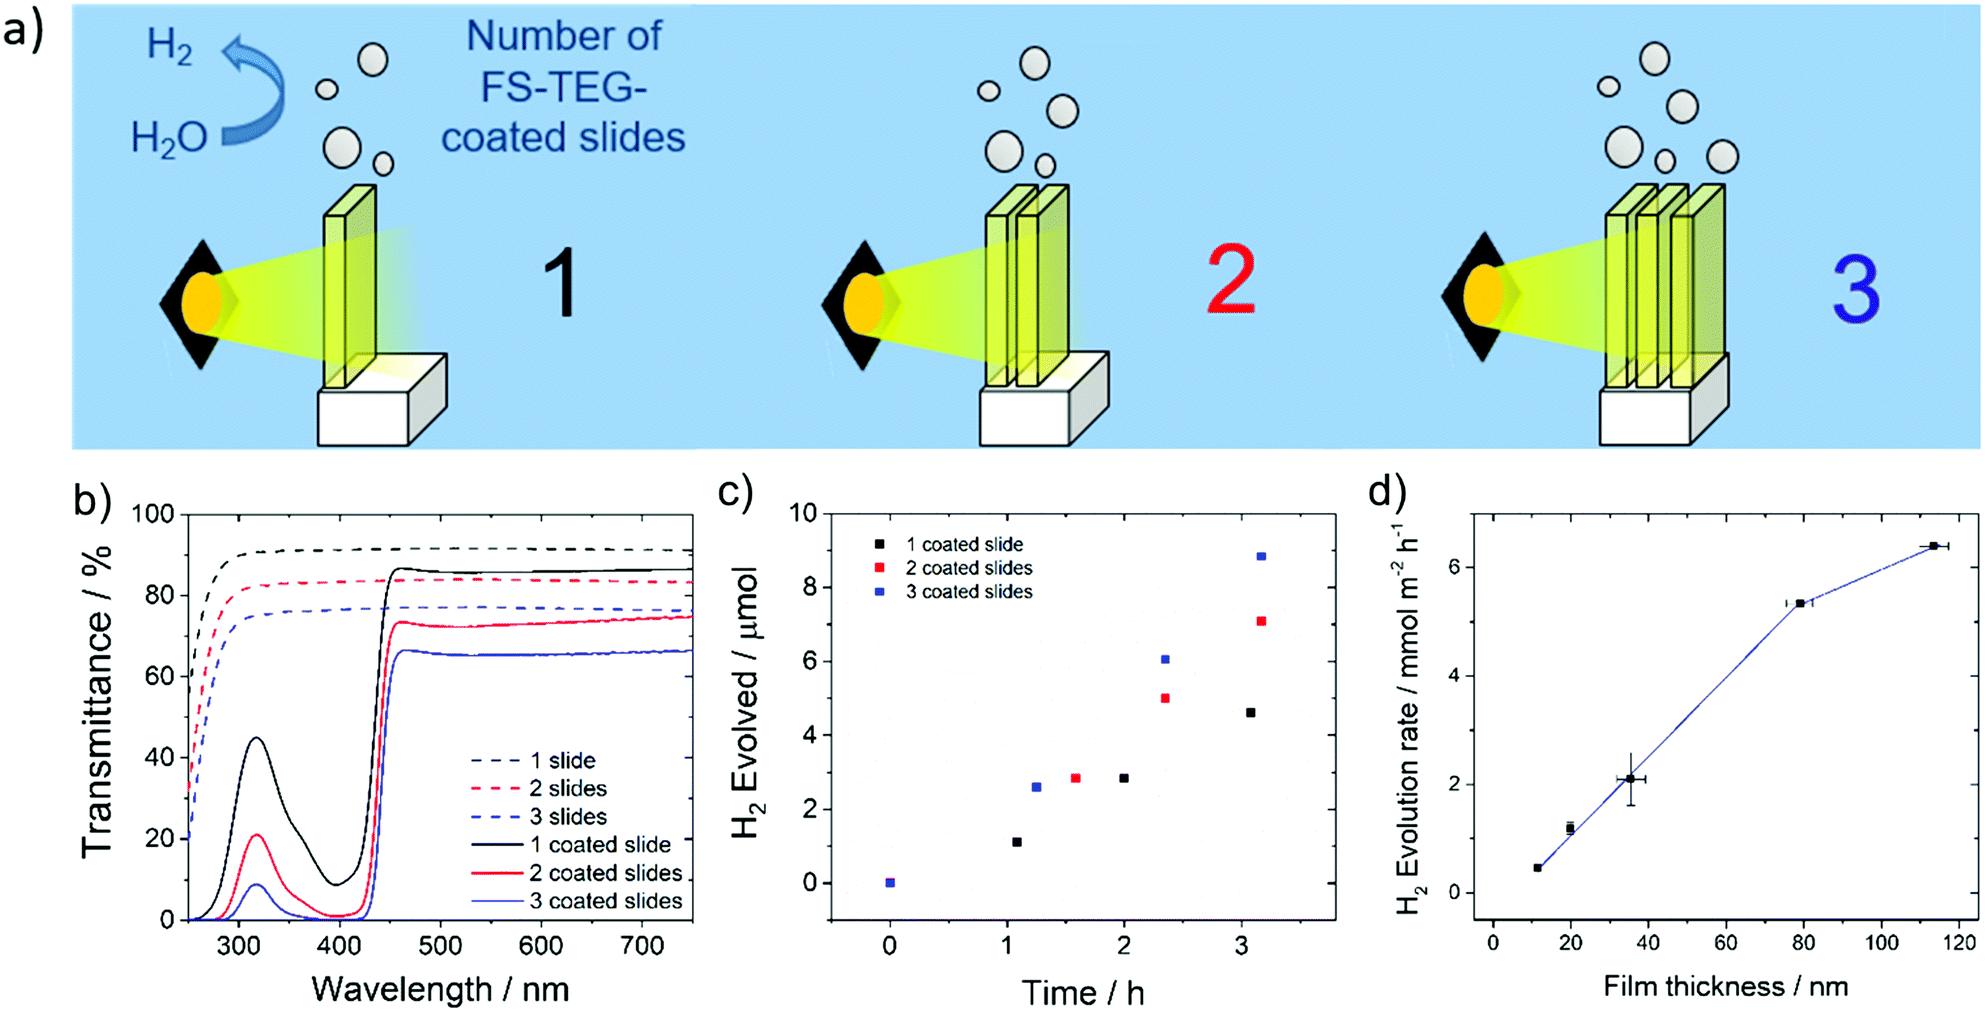 | ||
| Fig. 5 (a) Schematic diagram of FS-TEG-coated glass slides stacked in series under the experimental conditions; (b) UV-visible transmittance spectra of slides stacked in series; (c) hydrogen evolved by stacked films in series under visible light; (d) hydrogen evolution rates of FS-TEG films of varying thicknesses. Conditions for (c) and (d): spin-coated from chloroform solution onto OTS-functionalized glass slides; 5 vol% TEA in water, irradiated with visible light (λ > 420 nm filter, 300 W Xe light source). | ||
 | ||
| Fig. 6 (a) Images of free-standing film suspended in 5 vol% TEA before and after photocatalytic experiment; (b) hydrogen evolution of free-standing film of FS-TEG from a 5 vol% TEA mixture under λ > 420 nm irradiation over a period of 141 hours with intermittent degassing (black dashed lines) and replacement of scavenger mixture (red dashed lines) (300 W Xe light source); (c) direct comparison of hydrogen evolution runs after replacing the scavenger mixture. | ||
Above this thickness, performance appears to start levelling off; a 113 nm film gave a HER of 6.4 ± 0.1 mmol m−2 h−1.
Based on these results, increasing film thickness beyond 79 nm was not expected to significantly enhance performance. Instead, polymer-coated glass slides were stacked in series to further improve the quantity of hydrogen produced per unit geometric area exposed to light. Up to three OTS-functionalized glass slides spin-coated with 79 nm films of FS-TEG were placed in series (Fig. 5a), and the amount of light harvested increased with the addition of each subsequent slide (Fig. 5b). An increase in HER was observed with the addition of each polymer-coated slide in accordance with the increased light absorption, from 4.8 ± 0.2 mmol m−2 h−1 for one slide up to 9.6 ± 0.2 mmol m−2 h−1 for three slides (Fig. 5c). Stacking more than three slides in series was not expected to result in significant rate enhancements due to the low transmittance of light through three stacked polymer films.
Films were also deposited on roughened glass slides without OTS treatment to increase the amount of polymer in contact with the aqueous solution. An FS-TEG film (0.08 mg, 0.12 mmol) evolved 4.6 μmol after 4 hours and 10 minutes under visible light irradiation in a 5 vol% TEA solution, corresponding to a rate of 13.9 mmol g−1 h−1 or 3.0 mmol m−2 h−1 when normalized to the area of film irradiated (Fig. S49, ESI†).
Transient absorption spectroscopy
To understand why the improved wettability of TEG-substituted polymers increases the HERs relative to their alkylated equivalents, dispersions of FS-TEG and FS-Hex in water/methanol/TEA were studied with transient absorption spectroscopy (TAS). We chose to focus on materials with different side-chains as the influence of backbone modification has been studied in our previous work.29To compare the kinetics of photogenerated species, measurements were made both under identical excitation fluences and also with fluences adjusted such that the density of the observed species was the same in both materials. The femtosecond TA spectra comprise three major features for both polymers (Fig. 7a for FS-TEG and Fig. S62 for FS-Hex, ESI†). Immediately after excitation with 420 nm light, a large positive peak which extends beyond 750 nm and a negative feature in the 470–500 nm are at maximum magnitude. The 750 nm peak can be assigned to absorption of the polymers’ excitonic state. The negative feature matches the 470 nm photoluminescence maxima seen in Fig. S63 (ESI†) and is assigned to the stimulated emission of the excitonic state. The observation of these two features is in good agreement with previous work on poly(fluorene)s.51
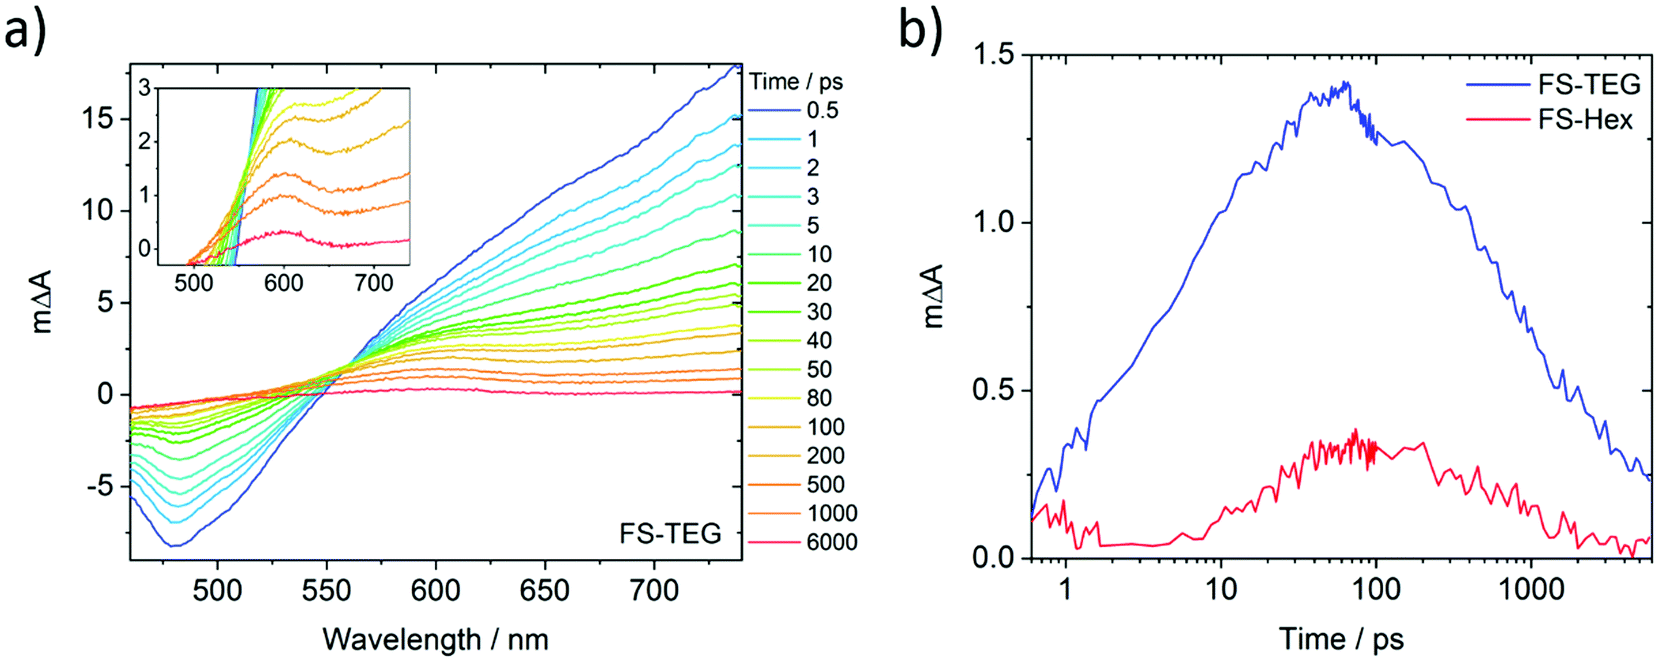 | ||
| Fig. 7 (a) fs-TAS spectra of an FS-TEG dispersion in water/methanol/TEA. The color scale is measured in picoseconds after 420 nm excitation. Inset: Magnified spectra highlighting the 600 nm absorption feature; (b) deconvoluted fs-TAS kinetics of the electron, probed at 600 nm, for dispersions of FS-TEG and FS-Hex. These kinetics were calculated by subtracting the shape of the TAS spectrum at 0.5 ps, at which point only excitons have formed, from all subsequent times. Both 0.2 mg mL−1 samples were measured under identical fluences of 87 μJ cm−2. | ||
The third feature in the fs-TAS spectra is a positive signal centred around 600 nm. The kinetics of this species, deconvoluted from the raw spectra, can be found in Fig. 7b (see the ESI† for calculation details). It grows over the course of approximately 100 ps before decaying with a much longer half-life (ca. 1 ns) than the excitonic features (<10 ps). At 6 ns after excitation, a significant proportion of this feature remains for both polymers whilst the excitonic absorption has mostly decayed to zero. This feature is not seen when the polymers are dispersed in water/methanol only (Fig. S64 and S65, ESI†). Given the role of TEA as a hole scavenger, this 600 nm feature is therefore assigned to the polymer anion. This is in good agreement with our previous work, where the polymer anion was assigned to a positive feature at 630 nm in similar dibenzo[b,d]thiophene sulfone-containing materials.29
As the FS-TEG and FS-Hex polymers have the same backbone structure, they are electronically similar. This is evident from the similarity of their absorption and emission profiles (Fig. S14 and S15, ESI†). Hence the absorption differences (ΔA) at the wavelengths detailed above give a reasonable comparison of the density of the relevant photogenerated species between the two polymer samples. When excited under identical excitation conditions (87 μJ cm−2, 420 nm), FS-TEG has a higher maximum exciton density than FS-Hex (Fig. S66a, ESI†). This is expected given the stronger ground state absorbance of the FS-TEG water/methanol/TEA dispersion (Fig. 2b and Fig. S67, ESI†). The exciton decay rate is also slower for the FS-TEG sample (half-lives: τTEG = 8.7 ps; τHex = 5.6 ps, Fig. S66b, ESI†).
Fig. 7b shows that the maximum amplitude of the 600 nm feature is almost four times higher in FS-TEG than in FS-Hex at the 100 ps temporal maximum, indicating that the maximum photogenerated electron density is four times higher. The sub-nanosecond electron decay kinetics are similar when normalized (τTEG = 950 ps; τHex = 850 ps, Fig. S68a, ESI†) such that the ratio between the two populations is similar until times beyond 1 ns.
When FS-TEG is excited at a lower fluence of 13 μJ cm−2 such that the exciton density in the sample is identical to FS-Hex when excited at 102 μJ cm−2, the exciton lifetime is substantially longer in FS-TEG (τTEG = 22 ps; τHex = 4.4 ps, Fig. S69a, ESI†). The photogenerated electrons in FS-TEG also decay notably slower than those in FS-Hex (τTEG = 2000 ps; τHex = 650 ps, Fig. S69b, ESI†).
Microsecond transient absorption spectra of FS-TEG (Fig. 8a) and FS-Hex (Fig. S70, ESI†) dispersions in the water/methanol/TEA mixture both have the same 600 nm polaronic absorption peak as the sole feature when excited at 420 nm. Again, TAS performed on dispersions in water/methanol show no such absorption features (Fig. S71, ESI†). The nature of the 600 nm peak is further confirmed through spectroelectrochemical measurements of an FS-TEG film (see the ESI† for details). When a negative bias is applied to the film in a three-electrode setup, the in situ steady state absorption spectrum comprises a single absorption peak centred at 585 nm which grows with increasing negative bias after an injection threshold of −1.8 V is reached (vs. Ag/AgCl, Fig. S72, ESI†). The strong similarity between the steady state spectrum of the reduced polymer and the spectra measured by TAS allows for confident assignment of the 600 nm TAS feature as the polymer anion.
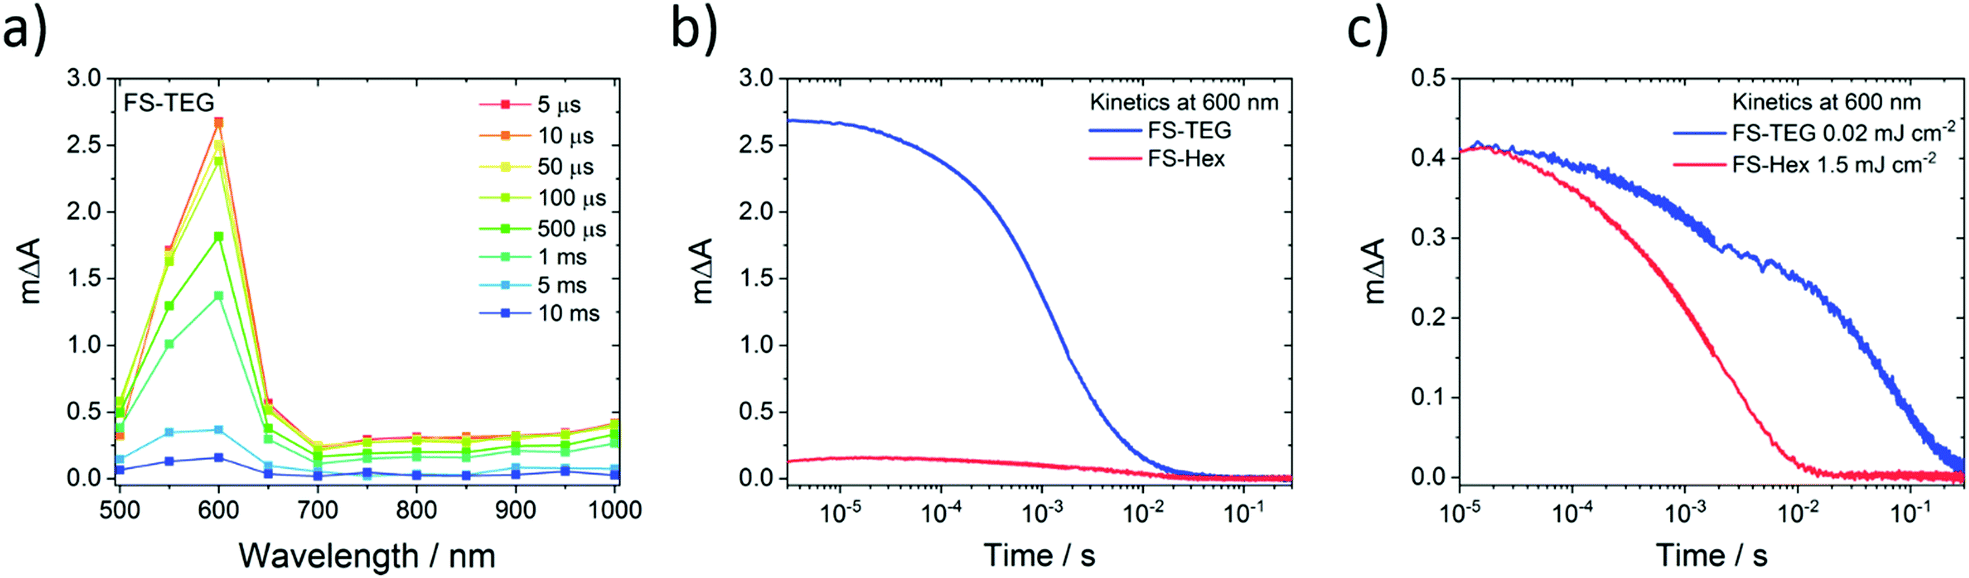 | ||
| Fig. 8 Microsecond transient absorption data taken on 0.02 mg mL−1 water/methanol/TEA FS-TEG and FS-Hex dispersions, excited at 420 nm. (a) Spectrum of an FS-TEG dispersion showing the 600 nm feature, assigned to electron polaron absorption, as the only feature; (b) electron kinetics for FS-TEG and FS-Hex dispersions, illuminated with an excitation fluence of 0.92 mJ cm−2; (c) electron kinetics for FS-TEG and FS-Hex dispersions, illuminated at different excitation fluences. The FS-Hex sample was first excited at a fluence of 1.5 mJ cm−2. The incident fluence on the FS-TEG sample was then adjusted to 0.02 mJ cm−2 such that it had a comparable maximum ΔA at 600 nm, indicating a similar electron density. | ||
For hydrogen evolution catalysts, proton reduction is expected to occur on the timescale of microseconds to seconds after photoexcitation.52–54 When dispersions of the same concentration are illuminated under identical conditions with a fluence of 0.92 mJ cm−2, the amplitude of the electron polaron signal in FS-TEG is approximately 15 times higher than in FS-Hex during the first microseconds after excitation (Fig. 8b) and four times higher after 10 milliseconds. The higher polaron density of FS-TEG over FS-Hex correlates well with the HERs for these materials, with FS-TEG being twice as active as FS-Hex per gram of polymer.
On the millisecond timescale, the electron density in FS-TEG decays slower than FS-Hex (τTEG = 4.4 ms; τHex = 2.0 ms, Fig. S73a, ESI†). When samples are excited at fluences such that the electron density in the samples are the same (1.5 mJ cm−2 and 0.02 mJ cm−2 for FS-Hex and FS-TEG), FS-TEG electrons live more than an order of magnitude longer than FS-Hex (τTEG = 22.8 ms; τHex = 1.1 ms, Fig. 8c). The fluence dependence of the FS-TEG sample indicates that the electron decay rates in these polymers are heavily dependent on the electron density, in good agreement with the fs-TAS data. However, the difference in the FS-TEG and FS-Hex electron lifetimes when their electron densities are the same shows that the polaronic state is inherently longer lived when TEG chains are present.
The conversion efficiency of excitons into electrons on these timescales can be visualised by normalizing the μs-TAS 600 nm kinetics by the maximum 750 nm ΔA absorption seen in fs-TAS, which is assumed proportional to the number of excitons generated. Fig. S73b, ESI† shows that, under identical excitation conditions, FS-TEG still has five times as many electrons per absorbed photon surviving on a timescale of 100 s of microseconds. This contrasts with the fs-TAS electron data, where FS-TEG and FS-Hex exhibit comparable electron density per photon ratios in the nanosecond regime (Fig. S68b, ESI†). The increase in the electron-per-photon ratio between the nanosecond (end of fs-TAS) and microsecond (beginning of μs-TAS) regimes suggests that the rate of electron decay in FS-TEG slows significantly relative to FS-Hex as the electron density reduces. This is in good agreement with the difference in electron lifetimes seen in both femtosecond and microsecond TAS when electron densities in the samples are the same.
Scale-up to a photoreactor
A key advantage of these polymers is that they are solution processable, suggesting possibilities for scale up and incorporation in more sophisticated set-ups, for example to allow overall water splitting by contracting a Z-scheme.12,55,56 To demonstrate proof-of-concept here, we built a 1 L cylindrical glass photoreactor, where FS-TEG-coated glass fibers were used. This photoreactor was found to evolve hydrogen at a rate of 0.94 L m−2 h−1 under natural light irradiation on a largely overcast day in Liverpool, U.K. (21st August 2017) in the presence of 5 vol% TEA (Fig. 9).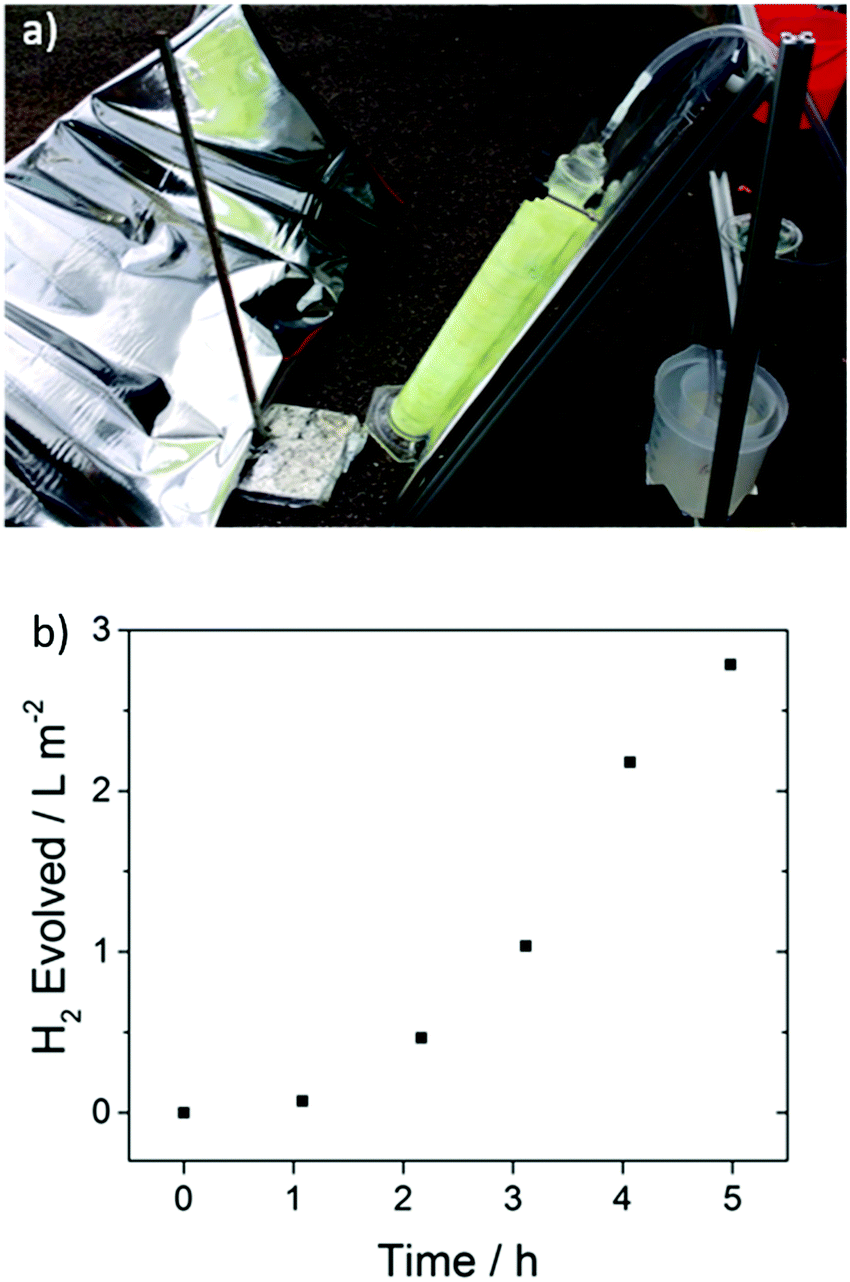 | ||
| Fig. 9 (a) Side-view of the photoreactor set-up with reflective panel and polymer-coated glass fibers submerged in 5 vol% TEA and connected to a hydrogen collection vessel (right) (b) amount of hydrogen evolved over a 5 hour period on a largely overcast day (see supporting video of the experiment, ESI†). | ||
Discussion
The differences in photocatalytic performance between FS and FP polymers with the same side-chains, such as FP-Hex and FS-Hex, can be explained by differences in the thermodynamic driving force for the one-hole oxidation of TEA to its radical form TEA˙+. The increased polarity of the dibenzo[b,d]thiophene sulfone unit is believed to attract water molecules close to the polymer backbone. The resulting water-rich environment then stabilizes the polaronic state of the polymer, as detailed in previous work.29 Specifically, the stabilization of the EA* level makes hole transfer from the polymer to TEA thermodynamically favourable. By contrast, polymers in the FP series are expected to draw less water close to their backbones, resulting in a TEA-rich environment; as a result, the EA* is calculated as being far shallower and charge transfer to TEA is thermodynamically unfavourable.The electronic properties of the materials with different side-chains are—in contrast to the backbone tuning—very similar within each of the FP and FS series, with only slight changes in absorption onsets resulting from side-chain variation (Fig. S10 and S16, ESI†).
The hydrogen evolution rate of the FS series is correlated to the side chain length for four of the polymers (Hex > Oct > EtHex > Dodec), while FS-TEG has the highest activity. FS-Me has a lower hydrogen evolution rate than FS-Hex despite having shorter side chains. Due to the insolubility of FS-Me in organic solvents, we cannot estimate its molecular weight by GPC. The molecular weight of FS-Me may be much lower than FS-Hex as the polymer precipitates from the polycondensation reaction early on when comparing to the other organic soluble materials. This expected difference in microstructure could affect the performance. We also note that FS-Hex has the highest degree crystallinity (only FS-Hex and FS-EtHex show any limited diffraction), which can be beneficial for charge-transport and may contribute to the higher performance of FS-Hex over FS-Me.
The differences in performance caused by side-chain tuning are exemplified primarily through the comparison of FS-TEG and FS-Hex. Our molecular dynamics simulations show that TEG chains attract water closer to the polymer backbone than alkylated polymers such as FS-Oct.
The higher affinity of TEG polymers to water is demonstrated through contact angle measurements. Generally, increasing the length of the alkyl side-chains makes the polymer more hydrophobic, as evidenced by higher contact angles with water. For both the FS and FP series, polymers with TEG side-chains have contact angles that are at least 20° lower than their octyl-substituted equivalents. Water uptake measurements support a difference in hydrophilicity between TEG-substituted and alkyl-substituted polymers, with FS-TEG adsorbing almost four times as much water as FS-Hex. Further, QCM and AFM swelling measurements conclusively show that FS-TEG is permeable to water, while FS-Hex is not. For impermeable films, increases in performance with film thickness should diminish at thicknesses beyond the exciton diffusion length (typically in the order of 5–10 nm for semiconducting polymers).57 Instead, hydrogen evolution rates of thin films of FS-TEG increase linearly with film thickness up to a thickness of 79 nm, suggesting that both water and TEA may penetrate tens of nanometres into the polymer, whether prepared as a thin film or dispersed as particles.
The higher affinity of TEG polymers to water is demonstrated through contact angle measurements. Generally, increasing the length of the alkyl side-chains makes the polymer more hydrophobic, as evidenced by higher contact angles with water. For both the FS and FP series, polymers with TEG side-chains have contact angles that are at least 20° lower than their octyl-substituted equivalents. Water uptake measurements support a difference in hydrophilicity between TEG-substituted and alkyl-substituted polymers, with FS-TEG adsorbing almost four times as much water as FS-Hex. Further, QCM and AFM swelling measurements conclusively show that FS-TEG is permeable to water, while FS-Hex is not. For impermeable films, increases in performance with film thickness should diminish at thicknesses beyond the exciton diffusion length (typically in the order of 5–10 nm for semiconducting polymers).57 Instead, hydrogen evolution rates of thin films of FS-TEG increase linearly with film thickness up to a thickness of 79 nm, suggesting that both water and TEA may penetrate tens of nanometres into the polymer, whether prepared as a thin film or dispersed as particles.
Both polymers produce the same maximum density of electrons around 100 ps when the excitation fluence is adjusted so that the initial exciton density in the samples is the same. This is likely because TEA penetrates similarly into FS-TEG and FS-Hex particles, so the active area for TEA oxidation—that is, for exciton quenching—in the two materials is similar, given that most particles are large compared to the penetration depth of TEA. Instead, the difference in electron density seen on the pico-nanosecond timescale when samples are excited at the same fluence is primarily a consequence of the difference in absorption between the samples.
Perhaps more significantly, the penetration of solvents into the polymer will also affect the effective dielectric constant experienced by the material. Since FS-TEG is more permeable to water than FS-Hex, photogenerated species within FS-TEG particles can be expected to experience a larger effective dielectric constant than FS-Hex based on the greater polarity of water. For the same polaron density, electrons in FS-TEG decay slower than those in FS-Hex. This increase in charge carrier lifetime is likely due to the water-rich environment both surrounding and also within FS-TEG extending the polaron lifetime relative to the impermeable FS-Hex.
On the nanosecond timescale after excitation at the same fluence, FS-TEG and FS-Hex electron polarons decay at a similar rate despite the difference in environment due to the electron density in FS-TEG being approximately three times higher. As the electron densities decrease with time, the recombination rate in FS-TEG slows relative to FS-Hex such that, by microseconds after photoexcitation, FS-TEG has an electron density which is 15 times higher than FS-Hex. The superior performance of FS-TEG over its less hydrophilic relatives can then be partially attributed to it having a substantially higher photogenerated electron density on the timescales that proton reduction is expected to occur. We suggest that the remaining difference is primarily due to the increased active surface area caused by water penetration into polymer particles and films.
The precise morphological control afforded by the processability of FS-TEG allows us to use the polymers’ permeability to maximise its catalytic activity. The linear relationship between HER and film thickness on films up to 79 nm thick shows that morphological control can be used to increase both light absorption and also the liquid–polymer surface area available for catalytic hydrogen evolution. The efficiency of light harvesting in a given irradiated area can be boosted by stacking these polymer-coated slides in parallel, leading to further performance improvements. The effectiveness of polymer processing was also demonstrated with the construction of a photoreactor that used FS-TEG-coated glass fibres. The construction of this photoreactor showcases the scalability and stability of solution-processable polymer photocatalysts such as FS-TEG.
Conclusions
The series of polymers reported here provide valuable insights into the design of solution-processable polymer photocatalysts. We have shown that both side-chain and backbone tuning can be used to improve the wettability of polymer photocatalysts and that this in turn improves their hydrogen evolving activity in the presence of a sacrificial electron donor. In line with MD simulations, the inclusion of polar dibenzo[b,d]thiophene sulfone backbone units and oligo(ethylene glycol) side-chains was found to increase the wettability of the polymer, drawing water close to the polymer backbone at the expense of non-polar TEA. This was confirmed by contact angle measurements, as well as by QCM and AFM swelling measurements in different liquid media. The use of the dibenzo[b,d]thiophene sulfone unit was also shown to improve the driving force for hole transfer to TEA, in line with our previous work.29The choice of side-chain was found to have a significant impact on the hydrogen evolution activity of these polymers, with longer alkyl side-chains inhibiting performance. In particular, a comparison between materials with hexyl (FS-Hex) and ethylene glycol (FS-TEG) side-chains showed that using the more polar side-chain substantially increased the materials’ affinity to water. This caused FS-TEG to form particles that are, on average, smaller than FS-Hex particles, improving light absorption three-fold. The TEG side-chains also improve the polymers’ permeability to water, likely increasing the active catalytic area as well as significantly increasing the intrinsic lifetime of photogenerated electrons such that far more can survive to the timescales at which proton reduction occurs.
We find that the efficiency of electron transfer from polymer to water is not improved by using TEG side chains to improve polymer hydrophilicity, as might be assumed from simple arguments based on wetting properties. Instead, the transfer efficiency is constant and it is the density of available electrons that changes due to differences in the polymers’ microstructural and dielectric properties.
By maximising polymer polarity through the combination of polar TEG side-chains with a polar dibenzo[b,d]thiophene sulfone backbone, we found that FS-TEG evolves hydrogen at a rate of 72.5 μmol h−1 (2.9 mmol g−1 h−1) under visible light and has an EQE of 10.0% at λ > 420 nm. These values are amongst the highest reported in the field of polymer photocatalysts. By optimising the microstructure through the processing of FS-TEG thin films, we were able to further increase the HER to 13.9 mmol g−1 h−1. The solubility of these materials also enabled us to build a 1 liter scale up reactor, which shows that soluble materials have potential to be used on large scale.
This work shows that combining polarity and processability is an effective method for improving the photocatalytic performance of linear polymers. We envisage that the structure–property–function relationships described here will aid future polymer design through the inclusion of other hydrophilic units. While these polymers do not oxidize water, they have the potential to be used in composites or in Z-schemes with an oxygen-evolving photocatalyst to achieve overall water splitting. Their solution processability may be a key advantage here.
Author contributions
D. J. W. synthesised FP-TEG and FS-TEG and characterised and performed hydrogen evolution experiments in suspension with these as well as with films and the scale-up experiment. R. S. S. designed the materials and synthesised, characterised and performed hydrogen evolution experiments of all materials, except FP-TEG and FS-TEG. D. J. W. also performed the SLS experiments and contact angle measurements for all materials. S. A. J. H. performed TAS measurements and S. A. J. H., J. N. and J. R. D. interpreted the data. S. A. J. H. also performed the filtration study, characterised the FS-TEG film thicknesses and performed the spectroelectrochemistry measurements. D. P. performed MD calculations with supervision from A. A. Y. G. and J. N. L. W. and M. A. Z. performed DFT calculations and interpreted the results. L. Q. F. performed the QCM and AFM swelling measurements. W. D. and I. M. performed PESA measurements. R. S. S. performed the gas sorption experiments. R. S. S., J. N. and A. I. C. supervised the project. The manuscript was written by D. J. W., S. A. J. H., D. P., L. W., M. A. Z., R. S. S., J. N. and A. I. C. All authors have approved the final version of the manuscript.Conflicts of interest
There are no conflicts to declare.Acknowledgements
AIC, RSS, MAZ, LW, and DW acknowledge the UK Engineering and Physical Sciences Research Council (EPSRC) for funding via grant EP/N004884/1. JN and DP acknowledge funding from the EPSRC via grants EP/P005543/1 and EP/R023581/1. AAYG thanks the EPSRC for award of a research fellowship (EP/P00928X/1). SJH thanks the EPSRC for a Centre for Doctoral Training post-graduate studentship (EP/L016702/1). JN also thanks the European Research Council for support under the European Union's Horizon 2020 research and innovation program (Grant Agreement No. 742708) and the Imperial College Research Computing Service for computational resources. JD and IM acknowledge financial support from the KAUST award OSR-2015-CRG4-2572. LQF acknowledges funding from the National Science Foundation (NSF DMR-1607242) and the NSF DMREF (award number 1629369).Notes and references
- X. Chen, S. Shen, L. Guo and S. S. Mao, Chem. Rev., 2010, 110, 6503–6570 CrossRef CAS PubMed.
- Y. Li, G. Chen, Q. Wang, X. Wang, A. Zhou and Z. Shen, Adv. Funct. Mater., 2010, 20, 3390–3398 CrossRef CAS.
- D. Praveen Kumar, M. V. Shankar, M. M. Kumari, G. Sadanandam, B. Srinivas and V. Durgakumari, Chem. Commun., 2013, 49, 9443–9445 RSC.
- O. Rosseler, M. V. Shankar, M. K. Le Du, L. Schmidlin, N. Keller and V. Keller, J. Catal., 2010, 269, 179–190 CrossRef CAS.
- C. J. Brabec, Sol. Energy Mater. Sol. Cells, 2004, 83, 273–292 CrossRef CAS.
- G. Zhang, Z.-A. Lan and X. Wang, Angew. Chem., Int. Ed., 2016, 55, 15712–15727 CrossRef PubMed.
- J. Jayakumar and H. Chou, ChemCatChem, 2020, 12, 689–704, DOI:10.1002/cctc.201901725.
- R. S. Sprick, B. Bonillo, R. Clowes, P. Guiglion, N. J. Brownbill, B. J. Slater, F. Blanc, M. A. Zwijnenburg, D. J. Adams and A. I. Cooper, Angew. Chem., Int. Ed., 2016, 55, 1792–1796 CrossRef CAS PubMed.
- C. Yang, B. C. Ma, L. Zhang, S. Lin, S. Ghasimi, K. Landfester, K. A. I. Zhang and X. Wang, Angew. Chem., Int. Ed., 2016, 55, 9202–9206 CrossRef CAS PubMed.
- R. S. Sprick, C. M. Aitchison, E. Berardo, L. Turcani, L. Wilbraham, B. M. Alston, K. E. Jelfs, M. A. Zwijnenburg and A. I. Cooper, J. Mater. Chem. A, 2018, 6, 11994–12003 RSC.
- P.-J. J. Tseng, C.-L. L. Chang, Y.-H. H. Chan, L.-Y. Y. Ting, P.-Y. Y. Chen, C.-H. H. Liao, M.-L. L. Tsai and H.-H. H. Chou, ACS Catal., 2018, 8, 7766–7772 CrossRef CAS.
- D. J. Martin, P. J. T. Reardon, S. J. A. Moniz and J. Tang, J. Am. Chem. Soc., 2014, 136, 12568–12571 CrossRef CAS PubMed.
- J. Liu, Y. Liu, N. Liu, Y. Han, X. Zhang, H. Huang, Y. Lifshitz, S.-T. Lee, J. Zhong and Z. Kang, Science, 2015, 347, 970–974 CrossRef CAS PubMed.
- L. Stegbauer, K. Schwinghammer and B. V. Lotsch, Chem. Sci., 2014, 5, 2789–2793 RSC.
- V. S. Vyas, F. Haase, L. Stegbauer, G. Savasci, F. Podjaski, C. Ochsenfeld and B. V. Lotsch, Nat. Commun., 2015, 6, 8508 CrossRef CAS PubMed.
- X. Wang, L. Chen, S. Y. Chong, M. A. Little, Y. Wu, W.-H. Zhu, R. Clowes, Y. Yan, M. A. Zwijnenburg, R. S. Sprick and A. I. Cooper, Nat. Chem., 2018, 10, 1180–1189 CrossRef CAS PubMed.
- K. Schwinghammer, S. Hug, M. B. Mesch, J. Senker and B. V. Lotsch, Energy Environ. Sci., 2015, 8, 3345–3353 RSC.
- J. Bi, W. Fang, L. Li, J. Wang, S. Liang, Y. He, M. Liu and L. Wu, Macromol. Rapid Commun., 2015, 36, 1799–1805 CrossRef CAS PubMed.
- C. B. Meier, R. Clowes, E. Berardo, K. E. Jelfs, M. A. Zwijnenburg, R. S. Sprick and A. I. Cooper, Chem. Mater., 2019, 31, 8830–8838 CrossRef CAS PubMed.
- R. S. Sprick, J. X. Jiang, B. Bonillo, S. Ren, T. Ratvijitvech, P. Guiglion, M. A. Zwijnenburg, D. J. Adams and A. I. Cooper, J. Am. Chem. Soc., 2015, 137, 3265–3270 CrossRef CAS PubMed.
- L. Li, Z. Cai, Q. Wu, W. Y. Lo, N. Zhang, L. X. Chen and L. Yu, J. Am. Chem. Soc., 2016, 138, 7681–7686 CrossRef CAS PubMed.
- R. S. Sprick, B. Bonillo, M. Sachs, R. Clowes, J. R. Durrant, D. J. Adams and A. I. Cooper, Chem. Commun., 2016, 52, 10008–10011 RSC.
- G. Zhang, Z. A. Lan, L. Lin, S. Lin and X. Wang, Chem. Sci., 2016, 7, 3062–3066 RSC.
- Z. Pan, Y. Zheng, F. Guo, P. Niu and X. Wang, ChemSusChem, 2017, 10, 87–90 CrossRef CAS PubMed.
- X. Wu, C. Zhu, L. Wang, S. Guo, Y. Zhang, H. Li, H. Huang, Y. Liu, J. Tang and Z. Kang, ACS Catal., 2017, 7, 1637–1645 CrossRef CAS.
- L. Wang, Y. Wan, Y. Ding, S. Wu, Y. Zhang, X. Zhang, G. Zhang, Y. Xiong, X. Wu, J. Yang and H. Xu, Adv. Mater., 2017, 29, 1702428 CrossRef PubMed.
- L. Wang, X. Zheng, L. Chen, Y. Xiong and H. Xu, Angew. Chem., Int. Ed., 2018, 57, 3454–3458 CrossRef CAS PubMed.
- D. J. Woods, R. S. Sprick, C. L. Smith, A. J. Cowan and A. I. Cooper, Adv. Energy Mater., 2017, 7, 1700479 CrossRef.
- M. Sachs, R. S. Sprick, D. Pearce, S. A. J. Hillman, A. Monti, A. A. Y. Guilbert, N. J. Brownbill, S. Dimitrov, X. Shi, F. Blanc, M. A. Zwijnenburg, J. Nelson, J. R. Durrant and A. I. Cooper, Nat. Commun., 2018, 9, 4968 CrossRef PubMed.
- R. S. Sprick, Y. Bai, A. A. Y. Guilbert, M. Zbiri, C. M. Aitchison, L. Wilbraham, Y. Yan, D. J. Woods, M. A. Zwijnenburg and A. I. Cooper, Chem. Mater., 2019, 31, 305–313 CrossRef CAS.
- Z. Hu, Z. Wang, X. Zhang, H. Tang, X. Liu, F. Huang and Y. Cao, iScience, 2019, 13, 33–42 CrossRef CAS PubMed.
- R. S. Sprick, K. J. Cheetham, Y. Bai, J. Alves Fernandes, M. Barnes, J. W. Bradley and A. I. Cooper, J. Mater. Chem. A, 2020, 8, 7125–7129, 10.1039/D0TA01200A.
- Y. Bai, L. Wilbraham, B. J. Slater, M. A. Zwijnenburg, R. S. Sprick and A. I. Cooper, J. Am. Chem. Soc., 2019, 141, 9063–9071 CrossRef CAS PubMed.
- R. S. Sprick, L. Wilbraham, Y. Bai, P. Guiglion, A. Monti, R. Clowes, A. I. Cooper and M. A. Zwijnenburg, Chem. Mater., 2018, 30, 5733–5742 CrossRef CAS.
- B. Meng, H. Song, X. Chen, Z. Xie, J. Liu and L. Wang, Macromolecules, 2015, 48, 4357–4363 CrossRef CAS.
- J. Kang, J. Jo, Y. Jo, S. Y. Lee, P. E. Keivanidis, G. Wegner and D. Y. Yoon, Polymer, 2008, 49, 5700–5704 CrossRef CAS.
- P. Blondin, J. Bouchard, S. Beaupré, M. Belletête, G. Durocher and M. Leclerc, Macromolecules, 2000, 33, 5874–5879 CrossRef CAS.
- W. Brütting, Physics of Organic Semiconductors, 2006 Search PubMed.
- C. M. Aitchison, R. S. Sprick and A. I. Cooper, J. Mater. Chem. A, 2019, 7, 2490–2496 RSC.
- A. Nistor, G. Stiubianu, C. Racles and M. Cazacu, Rev. Mater. Plast., 2011, 48, 33–37 CAS.
- P. Guiglion, C. Butchosa and M. A. Zwijnenburg, J. Mater. Chem. A, 2014, 2, 11996–12004 RSC.
- P. Guiglion, A. Monti and M. A. Zwijnenburg, J. Phys. Chem. C, 2017, 121, 1498–1506 CrossRef CAS.
- A. Schäfer, H. Horn and R. Ahlrichs, J. Chem. Phys., 1992, 97, 2571–2577 CrossRef.
- A. D. Becke, J. Chem. Phys., 1993, 98, 5648–5652 CrossRef CAS.
- C. Lee, W. Yang and R. G. Parr, Phys. Rev. B: Condens. Matter Mater. Phys., 1988, 37, 785–789 CrossRef CAS PubMed.
- P. J. Stephens, F. J. Devlin, C. F. Chabalowski and M. J. Frisch, J. Phys. Chem., 1994, 98, 11623–11627 CrossRef CAS.
- A. Klamt and G. Schüürmann, J. Chem. Soc., Perkin Trans. 2, 1993, 799–805 RSC.
- L. Guo, Y. Niu, S. Razzaque, B. Tan and S. Jin, ACS Catal., 2019, 9, 9438–9445 CrossRef CAS.
- R. S. Sprick, M. Hoyos, J. J. Morrison, I. M. Grace, C. Lambert, O. Navarro and M. L. Turner, J. Mater. Chem. C, 2013, 1, 3327–3336 RSC.
- Z. Li and R. H. Yoon, J. Colloid Interface Sci., 2013, 392, 369–375 CrossRef CAS PubMed.
- S. Xu, V. I. Klimov, B. Kraabel, H. Wang and D. W. McBranch, Phys. Rev. B: Condens. Matter Mater. Phys., 2001, 64, 193201 CrossRef.
- E. Pastor, F. Le Formal, M. T. Mayer, S. D. Tilley, L. Francàs, C. A. Mesa, M. Grätzel and J. R. Durrant, Nat. Commun., 2017, 8, 14280 CrossRef CAS PubMed.
- A. Reynal, F. Lakadamyali, M. A. Gross, E. Reisner and J. R. Durrant, Energy Environ. Sci., 2013, 6, 3291 RSC.
- A. Rodenberg, M. Orazietti, B. Probst, C. Bachmann, R. Alberto, K. K. Baldridge and P. Hamm, Inorg. Chem., 2015, 54, 646–657 CrossRef CAS PubMed.
- Y. Sasaki, H. Kato and A. Kudo, J. Am. Chem. Soc., 2013, 135, 5441–5449 CrossRef CAS PubMed.
- Q. Wang, T. Hisatomi, Q. Jia, H. Tokudome, M. Zhong, C. Wang, Z. Pan, T. Takata, M. Nakabayashi, N. Shibata, Y. Li, I. D. Sharp, A. Kudo, T. Yamada and K. Domen, Nat. Mater., 2016, 15, 611–615 CrossRef CAS PubMed.
- S. D. Dimitrov, B. C. Schroeder, C. B. Nielsen, H. Bronstein, Z. Fei, I. McCulloch, M. Heeney and J. R. Durrant, Polymers, 2016, 8, 14 CrossRef PubMed.
Footnotes |
| † Electronic supplementary information (ESI) available: Synthetic details, polymer characterization data, PXRD data, TGA data, UV-vis and PL spectra, details for (TD-)DFT calculations, SLS data, contact angle measurements, nitrogen sorption data, QCM data, PESA data, hydrogen evolution experiments, SEM data, MD calculations, TAS data, spectroelectrochemistry data, and a video of the scale-up experiment. See DOI: 10.1039/d0ee01213k |
| ‡ Both authors contributed equally. |
| This journal is © The Royal Society of Chemistry 2020 |