
 Open Access Article
 This Open Access Article is licensed under a
 Creative Commons Attribution 3.0 Unported Licence
Molecular level seasonality of dissolved organic matter in freshwater and its impact on drinking water treatment†
Anna
Andersson
 *a,
Leanne
Powers
b,
Mourad
Harir
cd,
Michael
Gonsior
e,
Norbert
Hertkorn
ac,
Philippe
Schmitt-Kopplin
cd,
Henrik
Kylin
af,
Daniel
Hellström
g,
Ämma
Pettersson
h and
David
Bastviken
a
*a,
Leanne
Powers
b,
Mourad
Harir
cd,
Michael
Gonsior
e,
Norbert
Hertkorn
ac,
Philippe
Schmitt-Kopplin
cd,
Henrik
Kylin
af,
Daniel
Hellström
g,
Ämma
Pettersson
h and
David
Bastviken
a
aDepartment of Thematic Studies – Environmental Change, Linköping University, SE-581 83 Linköping, Sweden. E-mail: anna.e.andersson@liu.se
bDepartment of Chemistry, State University of New York College of Environmental Science and Forestry, Syracuse, New York 13210, USA
cResearch Unit Analytical BioGeoChemistry, Helmholtz Munich, Ingolstaedter Landstraße 1, 85764 Neuherberg, Germany
dChair of Analytical Food Chemistry, Technical University of Munich, 85354 Freising, Germany
eUniversity of Maryland Center for Environmental Science, Chesapeake Biological Laboratory, Solomons, Maryland 20688, USA
fResearch Unit: Environmental Sciences and Management, North-West University, Potchefstroom, South Africa
gNorrvatten, Kvalitet och Utveckling, SE-169 02 Solna, Sweden
hNodra, Borgs vattenverk, SE-603 36 Norrköping, Sweden
First published on 27th June 2024
Abstract
Improved characterization of dissolved organic matter (DOM) in source waters used for drinking water treatment is necessary to optimize treatment processes and obtain high drinking water quality. In this study, seasonal differences in freshwater DOM composition and associated treatment-induced changes, were investigated at four drinking water treatment plants (DWTPs) in Sweden, during all seasons and a full-year. The objective was to understand how effectively DWTPs can adapt to seasonal changes and compare how optical and mass spectrometry methods detected these changes. In addition to bulk DOM analysis, this work focused on excitation–emission matrix (EEM) fluorescence including parallel factor (PARAFAC) analysis, and molecular level non-target analysis by Fourier transform ion cyclotron resonance mass spectrometry (FT-ICR MS). Overall, seasonal variability of raw water DOM composition was small and explained primarily by changes in the contributions of DOM with aromatic and phenolic moieties, which were more prevalent during spring in two surface water sources as indicated by absorbance measurements at 254 nm, computed specific ultraviolet absorbance (SUVA) and phenol concentrations. These changes could be balanced by coagulation, resulting in seasonally stable DOM characteristics of treated water. While EEM fluorescence and PARAFAC modelling effectively revealed DOM fingerprints of the different water sources, FT-ICR MS provided new insights into treatment selectivity on DOM composition at the molecular level. Future DOM monitoring of surface waters should target more specific seasonal DOM changes, such as features with a known impact on certain treatment processes or target certain events, like algal or cyanobacterial blooms.
Water impactIncreased variability in source water dissolved organic matter (DOM) composition might challenge drinking water quality through impaired treatment performance. Optical and non-target analysis demonstrate an intrinsic resilience of conventional treatments, including coagulation and sand filtration, against measurable seasonal changes in DOM composition, but that part of the seasonal DOM variation is still unaccounted for by typical monitoring methods. |
1. Introduction
Production of high-quality drinking water is essential for society and water treatment procedures must be adapted to the composition of water sources. Changes in the levels and characteristics of dissolved organic matter (DOM) can impact water treatment performance and thereby the final drinking water quality, including the formation of specific disinfection by-products (DBPs). In Northern European surface waters, DOM levels are rising,1 and this browning leads to technical and economic challenges for drinking water producers, including premature saturation of carbon filters, impaired UV disinfection performance, higher consumption of chemicals for coagulation and disinfection, and increased risk for microbial regrowth in distribution systems.2–4Rising levels of DOM in surface waters can be explained by either increased DOC production in terrestrial ecosystems (allochthonous DOM), or increased leaching of DOM from these systems, or a combination of both.5 Increasing concentrations of iron (note that iron may also coagulate DOM) and organic compounds that absorb light in the visible range, increase water browning and lead to changes in the composition of DOM.4 This has implications for drinking water producers. In Sweden, e.g., 75% of the drinking water supply can be influenced by browning,4 and if the trend of water browning continues, better removal of color-associated DOM during drinking water treatment might be required.
In addition to multi-year trends, there are also seasonal dependencies on DOM characteristics, as increased precipitation can lead to increased terrestrial export of DOM3 and increased temperatures can enhance mobilization and primary production of DOM in surface waters.6,7 The importance of in-lake produced, autochthonous DOM, has increased in recent years8 which might lead to larger seasonal differences in DOM composition and expected fundamental differences in required seasonal treatments. Studying seasonal differences in DOM composition and its effect on drinking water treatment requires sophisticated methods. Fluorescence spectroscopy specifically targets the subset colored or chromophoric DOM (CDOM) and specifically the fluorescent DOM (FDOM). These fluorophores are precursors of potentially toxic DBPs due to their aromatic and conjugated π-electron systems that are susceptible to electrophilic substitution. Three-dimensional, or excitation–emission matrix fluorescence spectroscopy (EEMs), is easy to operate and provides a contour plot of excitation versus emissions wavelengths versus fluorescence intensity, which is useful for discrimination of CDOM,9 and for on-line, near real-time DOM monitoring during drinking water treatment.10
By applying statistical analysis, such as parallel factor analysis (PARAFAC), underlying components in the EEM spectra can be used to describe quantitative changes in the composition of FDOM.9 Various fluorescence features can be linked to the source of origin11–13 or specific traits of DOM composition, e.g., the aromatic-rich lignin- and tannin-derived allochthonous DOM or autochthonous DOM associated with algal blooms14 or microbial contamination.15 Microbial contamination cannot be simply identified by FDOM measurements, due to complicated charge-transfer and unpredictable quenching effects in complex mixtures and specifically in the fluorescence of proteins and the specific interactions (e.g., quenching) the fluorescent amino acids have within these large molecules. FDOM classifications are not always clear, and similar fluorescence features may arise from different source materials. While autochthonous and allochthonous CDOM are expected to have different fluorescence features, recent studies have provided evidence that they can have similar fluorescence properties.16,17 Lysate from marine picocyanobacteria16 and peroxidase-mediated dimerization of tyrosine17 exhibited fluorescence with similarities to the humic-like fluorescence (i.e., absorbs in the ultraviolet to visible region and fluoresces in the visible region) of terrestrial DOM. Despite these caveats, fluorescence spectroscopy is extremely useful in monitoring fine-scale DOM changes, and has been used to study treatment-induced DOM changes,10,14,18–20 and may also be informative regarding the seasonal influence on DOM removal during water treatment.
To characterize specific DOM changes at a molecular level, non-target approaches using ultra-high resolution mass spectrometry offers insight in molecular level seasonal changes within DOM. Fourier transform ion cyclotron resonance mass spectrometry (FT-ICR MS) has successfully been used to characterize individual elemental compositions of DOM in boreal lakes21 and to connect DOM composition to precipitation, water residence time, temperature and degradation processes.22,23 This technique enables the detection of several thousands of distinct molecular formulae in complex environmental mixtures and represents a highly suitable analysis to track DOM compositional changes over time in detail.
Seasonal changes of source water DOM are challenging to predict and cannot be readily overcome but drinking water production can be better optimized with a detailed understanding of seasonal impacts on DOM and its effects on water quality due to, e.g., DOM interactions in treatments or with various chemical pollutants or the formation of by-products. To investigate the magnitude and characteristics of current seasonal DOM changes in source waters and its impact on conventional drinking water treatment, this study examines DOM composition of three surface water sources and one groundwater source in Sweden and how the DOM composition changes after individual treatment stages throughout a one-year sampling campaign by using bulk DOM measurements, EEM fluorescence spectroscopy and FT-ICR MS.
2. Methods
2.1 Description of raw waters and treatment processes
Four Swedish drinking water treatment plants (DWTPs) were investigated: Berggården, in Linköping (LIN), Borg, in Norrköping (NOR), Görvälnverket, in Stockholm (STO), and Bulltofta, in Malmö (MAL) (Fig. S1†). At LIN, a surface water source (Motala Ström River) was used, with water originating from Lake Vättern, a 128 m deep clearwater lake. NOR also took water from Motala Ström, but about 50 km downstream compared to LIN, having passed two large lakes surrounded by agricultural areas and forests, that adds organic matter to the water. STO took water from Lake Mälaren, a water source utilized by multiple DWTPs in the Stockholm area, characterized by rather high organic carbon levels. MAL used a groundwater source in a region with old marine sediments located in southern Sweden.The various treatment processes applied are summarized in Table 1. Coagulation was performed using aluminum sulphate (Al2(SO4)3) in both NOR and STO. The granular activated carbon (GAC) filters in NOR and STO reduced taste and odor and were regenerated with intervals to operate primarily as a biological filter (BAC). At MAL, that used groundwater, aeration and softening removed iron, calcium, and magnesium ions. Because UV treatment at MAL was installed after rapid sand filtration halfway into the sampling campaign, this treatment was studied at fewer (two) occasions. Additional information on the four DWTPs are available in a separate study.24
| LIN | NOR | STO | MAL | |
|---|---|---|---|---|
| Water source | River | River | Lake | Groundwater |
| Treatment stages | Rapid sand filtration | Coagulation (Al2(SO4)3) | Coagulation (Al2(SO4)3) | Aeration |
| Slow sand filtration | GAC | Rapid sand filtration | Softening | |
| UV disinfection | Slow sand filtration | GAC | Rapid sand filtration | |
| Chemical disinfection (hypochlorite) | Chemical disinfection (chloramine) | UV disinfection | UV disinfection | |
| Chemical disinfection (chloramine) | Chemical disinfection (chloramine) |
2.2 Sample collection
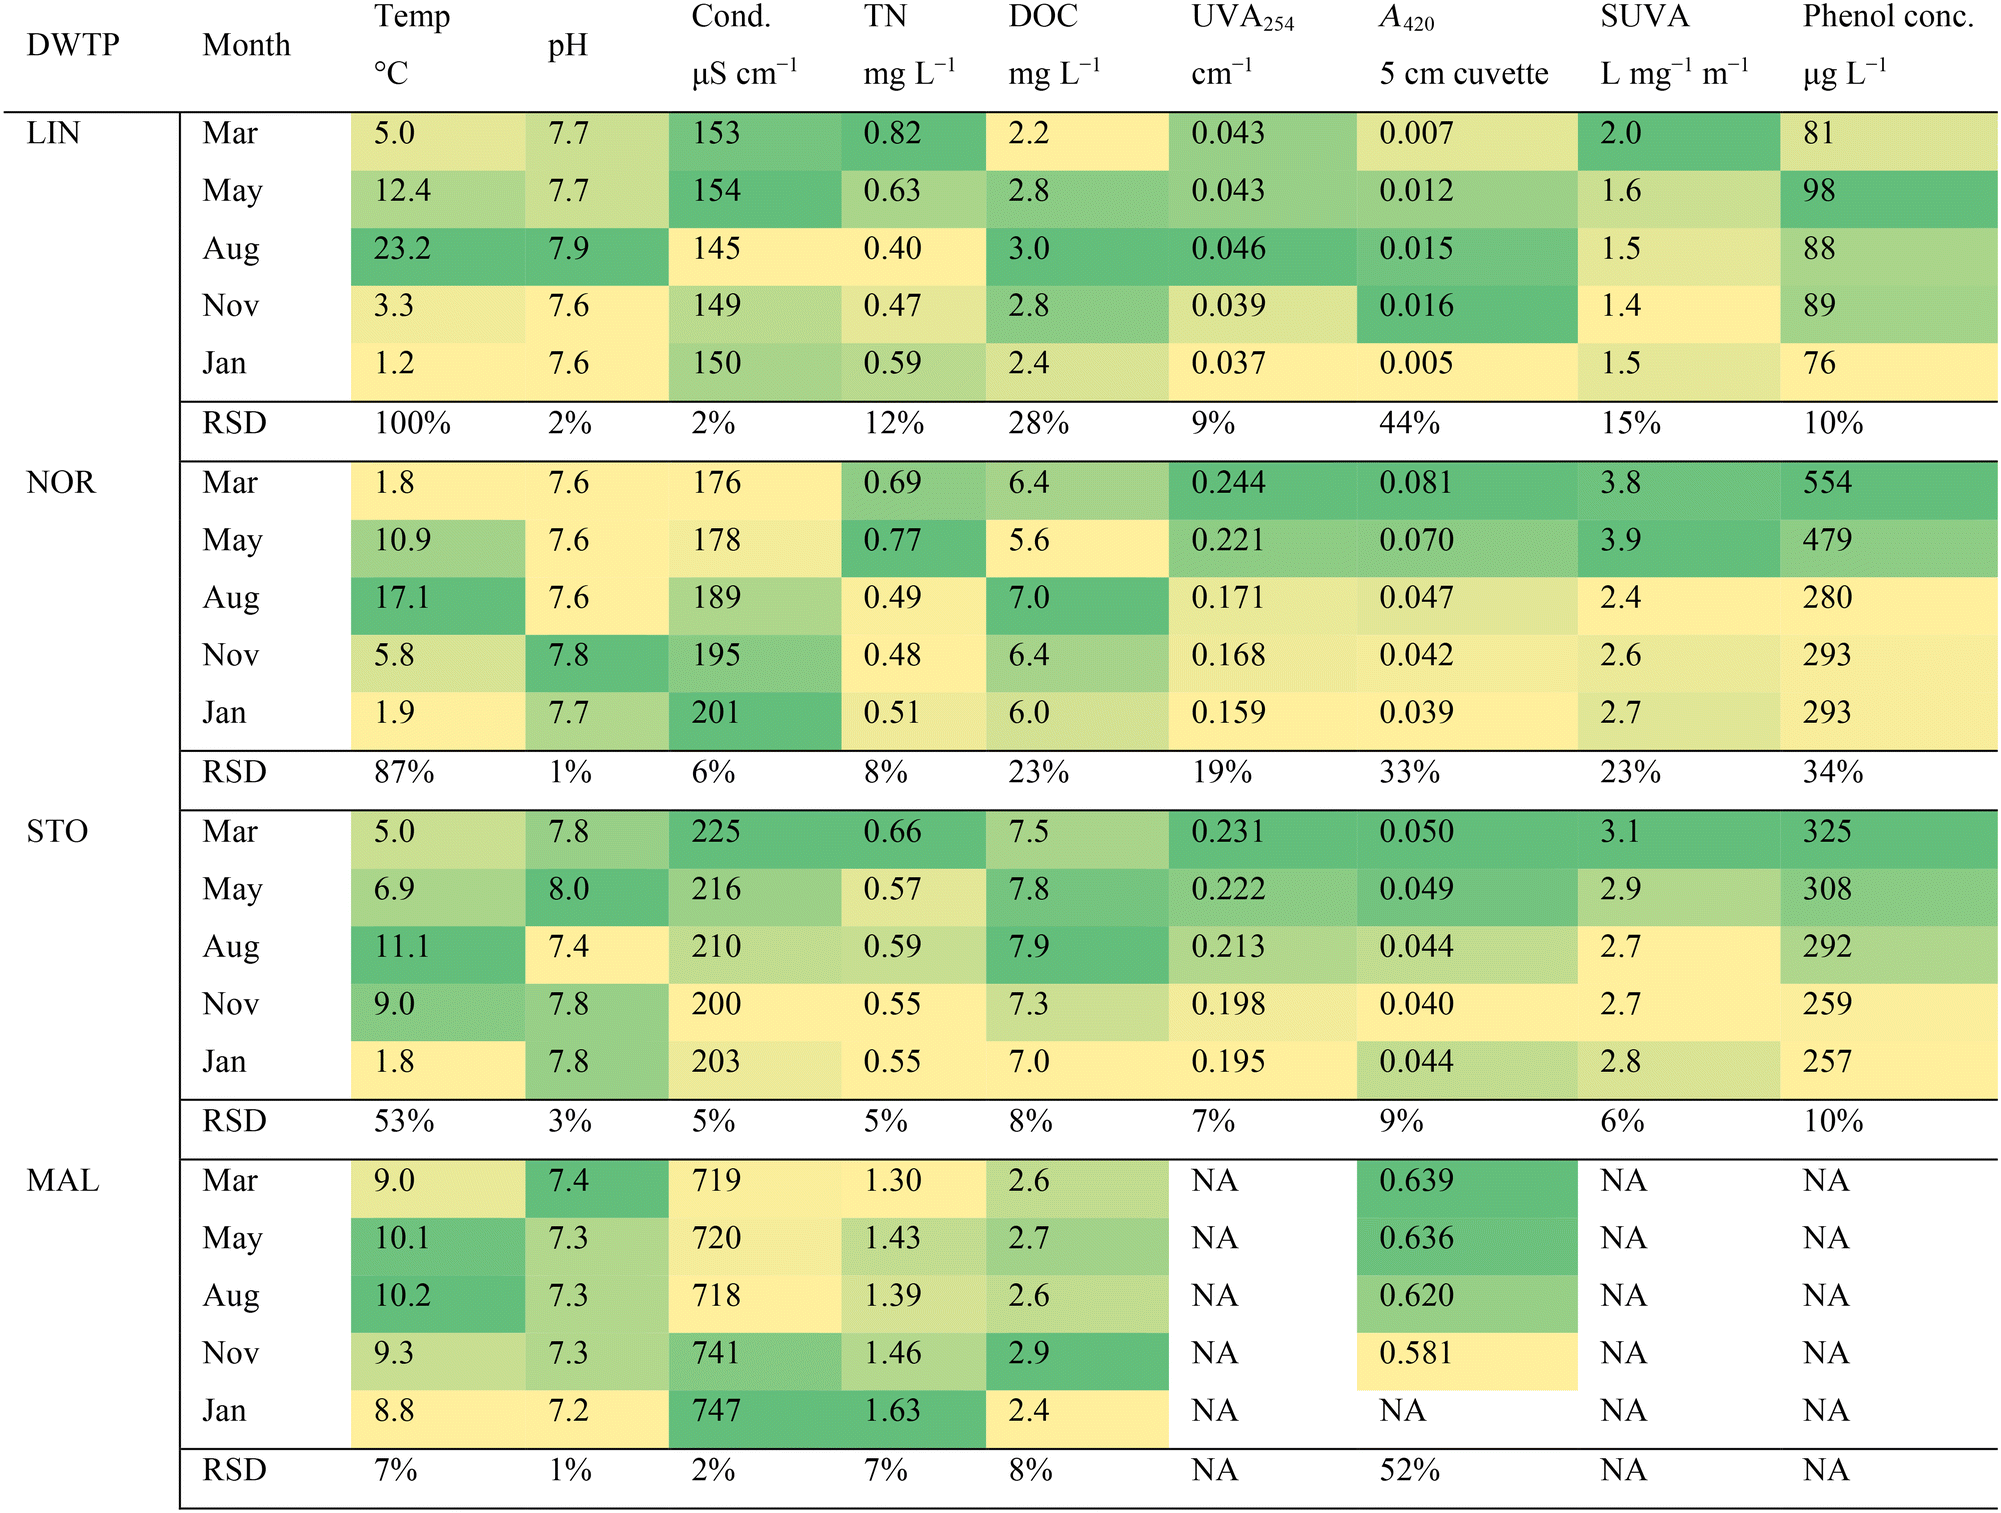
Water samples were collected at five sampling occasions, in March, May, August, and November 2016 and in January 2017. At every sampling, raw water, as well as water after each treatment step, water leaving the DWTP, and water from a tap in the distribution system were collected. To avoid interferences upon FT-ICR MS analysis, no chemicals were added to quench residual chlorine. In STO, coagulation and rapid sand filtration were considered as one combined treatment, because large amounts of flocs were still present at the point directly after coagulation. Therefore, for STO, the results reported as effects of coagulation include both coagulation and rapid sand filtration. Water from MAL was mixed with water from other DWTPs in the distribution system. Therefore, there was no sampling point in the distribution system that represented water from the MAL DWTP only. Hence, the tap water at MAL is a mix from three DWTPs. Duplicate samples were collected in pre-washed (Methanol, LICHROSOLV®, three times, followed by Milli-Q, three times) amber 5 L glass bottles.2.3 Water characteristics
Temperature was measured during sample collection, while pH and conductivity were measured at room temperature using a HACH HQ 40 (Hach, Stockholm) less than six hours after sample collection. Total nitrogen (TN) was measured on filtered water (Whatman GF/F, 0.7 μm porosity) using a Shimadzu TOC-VCSH TOC analyzer. TN is the sum of nitrate, nitrite, organic nitrogen, and ammonia. Filtered water (Whatman GF/F, 0.7 μm porosity) was used to analyze dissolved organic carbon (DOC), absorbance at 254 nm (UVA254), absorbance at 420 nm (A420) and the level of polyphenols. DOC was measured with the non-purgeable organic carbon (nPOC) method at the accredited lab of each DWTP. Absorbance was determined on an Ultrospec 2100 pro spectrophotometer (Biochrom, Cambridge) using a 5 cm quartz cuvette (raw water samples were diluted by factor 2 for all DWTPs except LIN). UVA254 was calculated as the absorbance per centimeter (cm−1) by normalizing the absorbance at 254 nm to the cell pathlength. SUVA (specific ultraviolet absorbance) (L mg−1 m−1) was computed by dividing UVA254 by the DOC concentration (mg L−1). SUVA has been used as a proxy for aromaticity and the overall aromatic content, based on correlations between percent aromaticity and SUVA values for reference DOM samples.25 Importantly, SUVA can be influenced by factors other than chromophoric DOM, such as cations of iron (Fe) that can enhance absorbance. A420 is used as a proxy for watercolor and was reported as original absorbance (not normalized to cuvette length).Polyphenol content was determined according to an established protocol.26 Sodium carbonate solution (1.5 mL, 200 g L−1) and Folin–Ciocalteu phenol reagent (0.5 mL) were added to each sample (10 mL, in 20 mL glass tubes). The tubes were left for at least 60 minutes at 20 °C for the color to develop and pH was controlled at between 9 and 10. The absorbance of the formed complex was measured at 750 nm in a glass cuvette (5 cm). A phenol reference standard was used to create calibration curves (total phenolics, calibration standard in water, Sigma-Aldrich). The reference standard was run every 20 samples for quality and matrix effect control. Thus, polyphenol content is reported here as equivalent concentrations of phenol (μg L−1).
2.4 Sample preparation for FT-ICR MS and fluorescence spectroscopy
Water samples were filtered through pre-combusted (5 hours at 450 °C) glass fibre filters (Whatman GF/F, pore size 0.7 μm, Whatman) and DOM was extracted using Bond Elut PPL cartridges (1 g, 6 mL, Agilent Technologies), which is a modified styrene and divinylbenzene co-polymer adsorbent.27 Using a single sorbent for DOM extraction does not capture all DOM present in the water, but the sorbent was chosen to extract as wide range of molecules as possible in a highly reproducible manner.27 Methanol (10 mL, LC–MS ultra CHROMASOLV®) and acidified ultrapure water (10 mL, pH 2.5, spectrophotometric grade, acidified with 32% HCl, P.A.) were used to condition the cartridges. Filtered water (2 L for NOR and STO raw waters and 4 L for the other sampling points due to differences in DOC content), adjusted to pH ∼2.5 (using 3 M HCl) flowed through the SPE cartridges at rates below 20 mL min−1. A vacuum manifold (Standard 24-port, 57![[thin space (1/6-em)]](https://www.rsc.org/images/entities/char_2009.gif) 250-U, Sigma-Aldrich) and a peristaltic pump (Vantage 3000 C S10, Svenska pump AB) were used to run the extraction. After sample extraction, cartridges were washed with 0.1% formic acid water (10 mL, LC–MS ultra CHROMASOLV®). This washing stage was performed to remove ions (e.g., chloride) that might interfere during FT-ICR MS analysis.28 After washing, the cartridges were dried (∼15 seconds) using nitrogen gas (except for STO where air and a connected hydrocarbon trap were used instead), and methanol (10 mL) was used to elute DOM. Until analysis, the extracts were stored at −20 °C.29
250-U, Sigma-Aldrich) and a peristaltic pump (Vantage 3000 C S10, Svenska pump AB) were used to run the extraction. After sample extraction, cartridges were washed with 0.1% formic acid water (10 mL, LC–MS ultra CHROMASOLV®). This washing stage was performed to remove ions (e.g., chloride) that might interfere during FT-ICR MS analysis.28 After washing, the cartridges were dried (∼15 seconds) using nitrogen gas (except for STO where air and a connected hydrocarbon trap were used instead), and methanol (10 mL) was used to elute DOM. Until analysis, the extracts were stored at −20 °C.29
2.5 Fluorescence analysis
Fluorescence was used for the analysis of optical characteristics of DOM. To allow direct comparison between fluorescence and FT-ICR MS, the extracted DOM samples were analyzed. DOC extraction efficiencies of ∼60% have been reported,27 but even higher recovery of DOM fluorescence properties is expected, especially for molecules with absorption at longer wavelengths into the visible region30 and FDOM has been shown to be extracted almost quantitatively using the described extraction procedure above. Prior to fluorescence analysis, 100 μL of the methanolic extracts were dried under N2 and re-diluted in 10 mL of ultrapure water. Absorbance spectra (A(λ)) and EEM fluorescence spectra were recorded simultaneously using a Horiba Aqualog spectrofluorometer. Excitation or (A(λ)) spectra were collected at 3 nm intervals between 230 and 600 nm and emission spectra were collected at fixed ∼3 nm intervals between 235 and 600 nm. Ultrapure water served as the absorbance and fluorescence blank, and the water Raman peak was measured daily. All EEM spectra were corrected by removing Raleigh scattering following a method established previously31 and potential inner filtering effects were corrected using the Aqualog software. EEM spectra were normalized to the area of the Raman peak (excitation = 350 nm), expressing the fluorescence intensities in Raman units (RU). The amount of redissolved DOM always produced FDOM concentrations that were not too high for the inner filtering correction threshold.To examine underlying components in the EEM dataset, corrected EEM spectra were modeled using parallel factor analysis (PARAFAC) using the Matlab toolbox DrEEM.32,33 The resulting PARAFAC components were validated33 and compared to those reported in published datasets using a 95% threshold in OpenFluor, an online database for PARAFAC components.34 For data analysis, maximum fluorescence intensities (Fmax) of individual PARAFAC components in a sample were used, including corrections for different extraction volumes. An overview of the different components is presented in Table 2 and further information on the PARAFAC model (Fig. S2†), and the different components is found in the ESI† online material. During PARAFAC analysis, the fluorescence signature of DOM was decomposed into separate components along with estimates of the relative contribution of each component to DOM fluorescence.9 All PARAFAC components are statistically derived and cannot be used to directly reflect fluorophores, but quantitative changes in the overall FDOM composition can be addressed using the depicted PARAFAC components. Historically, these components were classified and named as described in Table 2, but these classifications are misleading as statistically-derived parallel factor analysis components have no direct chemical meaning, even though they may represent specific regions within a measured EEM, hence they could represent fluorophores, but are not guaranteed to do so. However, as large amounts of literature use these classifications, we use them to put our data into perspective.
| Component | λ ex (nm) | λ em (nm) | No. of matching components in previous models | Peak name | Assignment according to previous studies (underlined references represent precise matching in OpenFluor). Note that different molecules may share optical properties |
|---|---|---|---|---|---|
| C1 | <250 | 440 | 14 | A + C | Terrestrial humic acid like, found in agricultural influenced waters.36 A mixture of humic peak A and C9,11,37 |
| C2 | <250 | 510 | 15 | A | Terrestrial fulvic-like3̲6̲ |
| C3 | 270, 390 | 470 | 1 | A + C | Humic-like1̲5̲ |
| C4 | <250, 310 | 380 | 4 | M | Low molecular weight compounds associated with marine environments, biological activity9 and in situ production.23 Also described as marine humic-like (peak M) and compounds altered by microbial reprocessing3̲7̲ |
| C5 | 270 | 340 | 1 | T | Protein-like or tryptophan-like9,11,36 |
Because MAL showed high fluorescence despite rather low DOC, the potential influence of iron on fluorescence measurements in MAL was considered. Because fluorescence measurements were performed on DOM extracts, acquired from water samples adjusted to pH 2.5, facilitating protonation of DOM functional groups otherwise capable of forming complexes with iron, the effect of iron(II) and iron(III) on the fluorescence measurements are deemed minor. Importantly, the smaller effect of iron on fluorescence measurements, compared to UVA254 and SUVA, has been highlighted as an important advantage of fluorescence in DOM water quality monitoring as some weather events, like heavy rain falls, can alter iron concentrations of raw water.35 Because UVA254 and SUVA were determined on filtered water samples, and because Fe interferes with UVA254, SUVA and polyphenol measurements, these parameters are not reported for the raw water in MAL.
2.6 FT-ICR MS analysis
A Bruker Solarix 12 T FT-ICR MS operating with electrospray ionization in negative mode, ESI(−), was used and FT-ICR MS measurements and data processing, including formula assignments and filtration, followed a protocol described previously.24 Two replicate samples were analyzed and for data analysis the replicate with highest overall amplitude of mass peaks was chosen, representing the highest level of molecular information. Various indices and elemental ratios were computed from the assigned molecular formulae, including double bond equivalences (DBE), DBE/C ratios, a modified aromaticity index (AImod), the average carbon oxidation state (COS) and modified Kendrick mass defects (−KMD/z*).21,24,38–41 By computing the ratio of individual mass peak amplitudes by the consolidated intensities of all m/z ions in a spectrum, average weighted values were acquired.To analyze the selectivity of individual water treatment processes on DOM composition, difference plots were created, highlighting formulae for which the relative abundance had been changed by more than 50%. This level was based on a test of relative peak intensity reproducibility which showed that 99% of the mass peaks detected by FT-ICR MS, had relative intensities with a relative standard deviation below 25%.42 Treatments in which more than 20 formulae changed in relative abundance by more than 50% are presented in van Krevelen diagrams (H/C ratios versus O/C ratios) and plots showing mass edited H/C ratios and the average oxidation state of carbon.41 Smaller changes than defined above, or changes other than DOM removal, may be relevant but would require additional method evaluation that is beyond the scope of this study.
3. Results and discussion
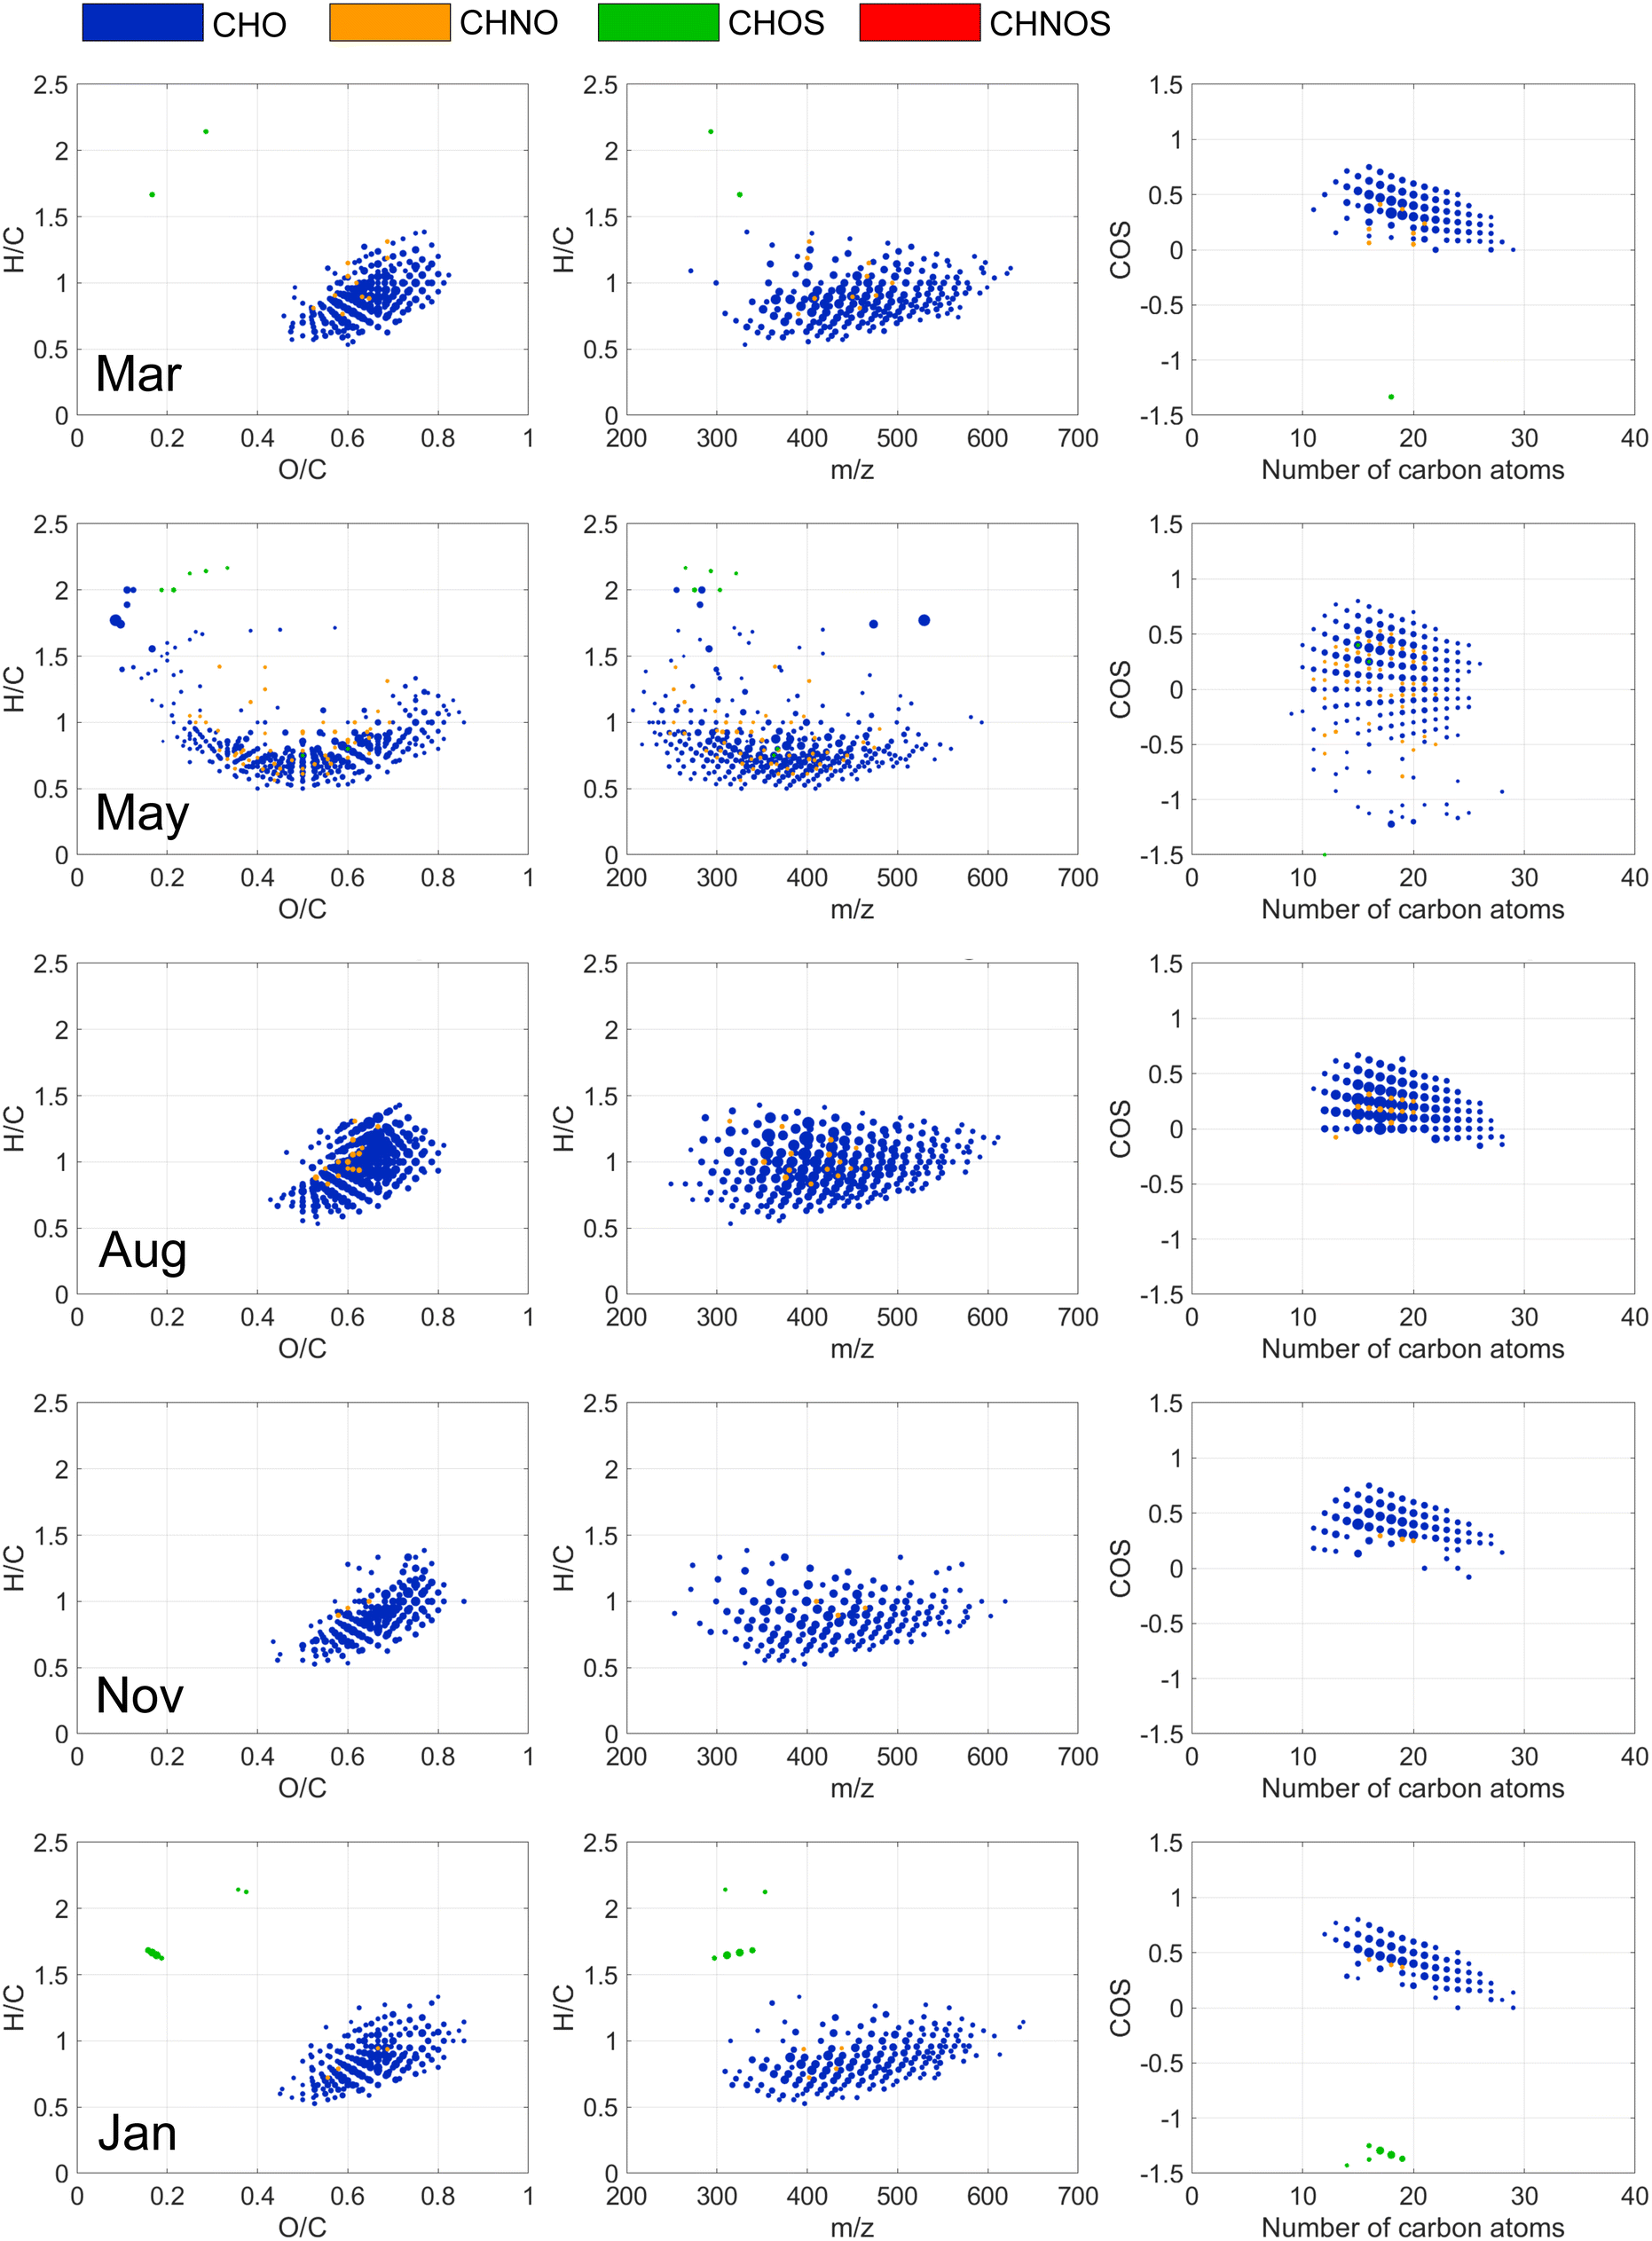
3.1 Source water seasonal changes
|
DOC concentrations peaked in the fall in the groundwater source (MAL) and its high A420 was explained by high raw water Fe-levels (∼5 mg L−1). DOC in the surface waters peaked during summer whereas UVA254, SUVA and A420 were higher in March and May (most clearly seen for NOR and STO), indicating that DOM had higher proportions of aromatic and chromophoric molecules during these months. This observation is likely explained by increased input of allochthonous DOM through run-off from snowmelt or heavy rainfalls,43 which is supported by the higher levels of polyphenols in NOR and STO (Table 3). According to Weishaar et al. (2003),25 the iron level in NOR (<190 μg L−1) had minor impact on UVA254, further suggesting that observed changes in UVA254 and SUVA were attributed to DOM composition. Computed UVA254 (cm−1) based on absorbance measurements of extracted DOM corresponded well with whole water UVA254, demonstrating that the extraction procedure successfully captured CDOM and that observed absorbance differences were connected to DOM.
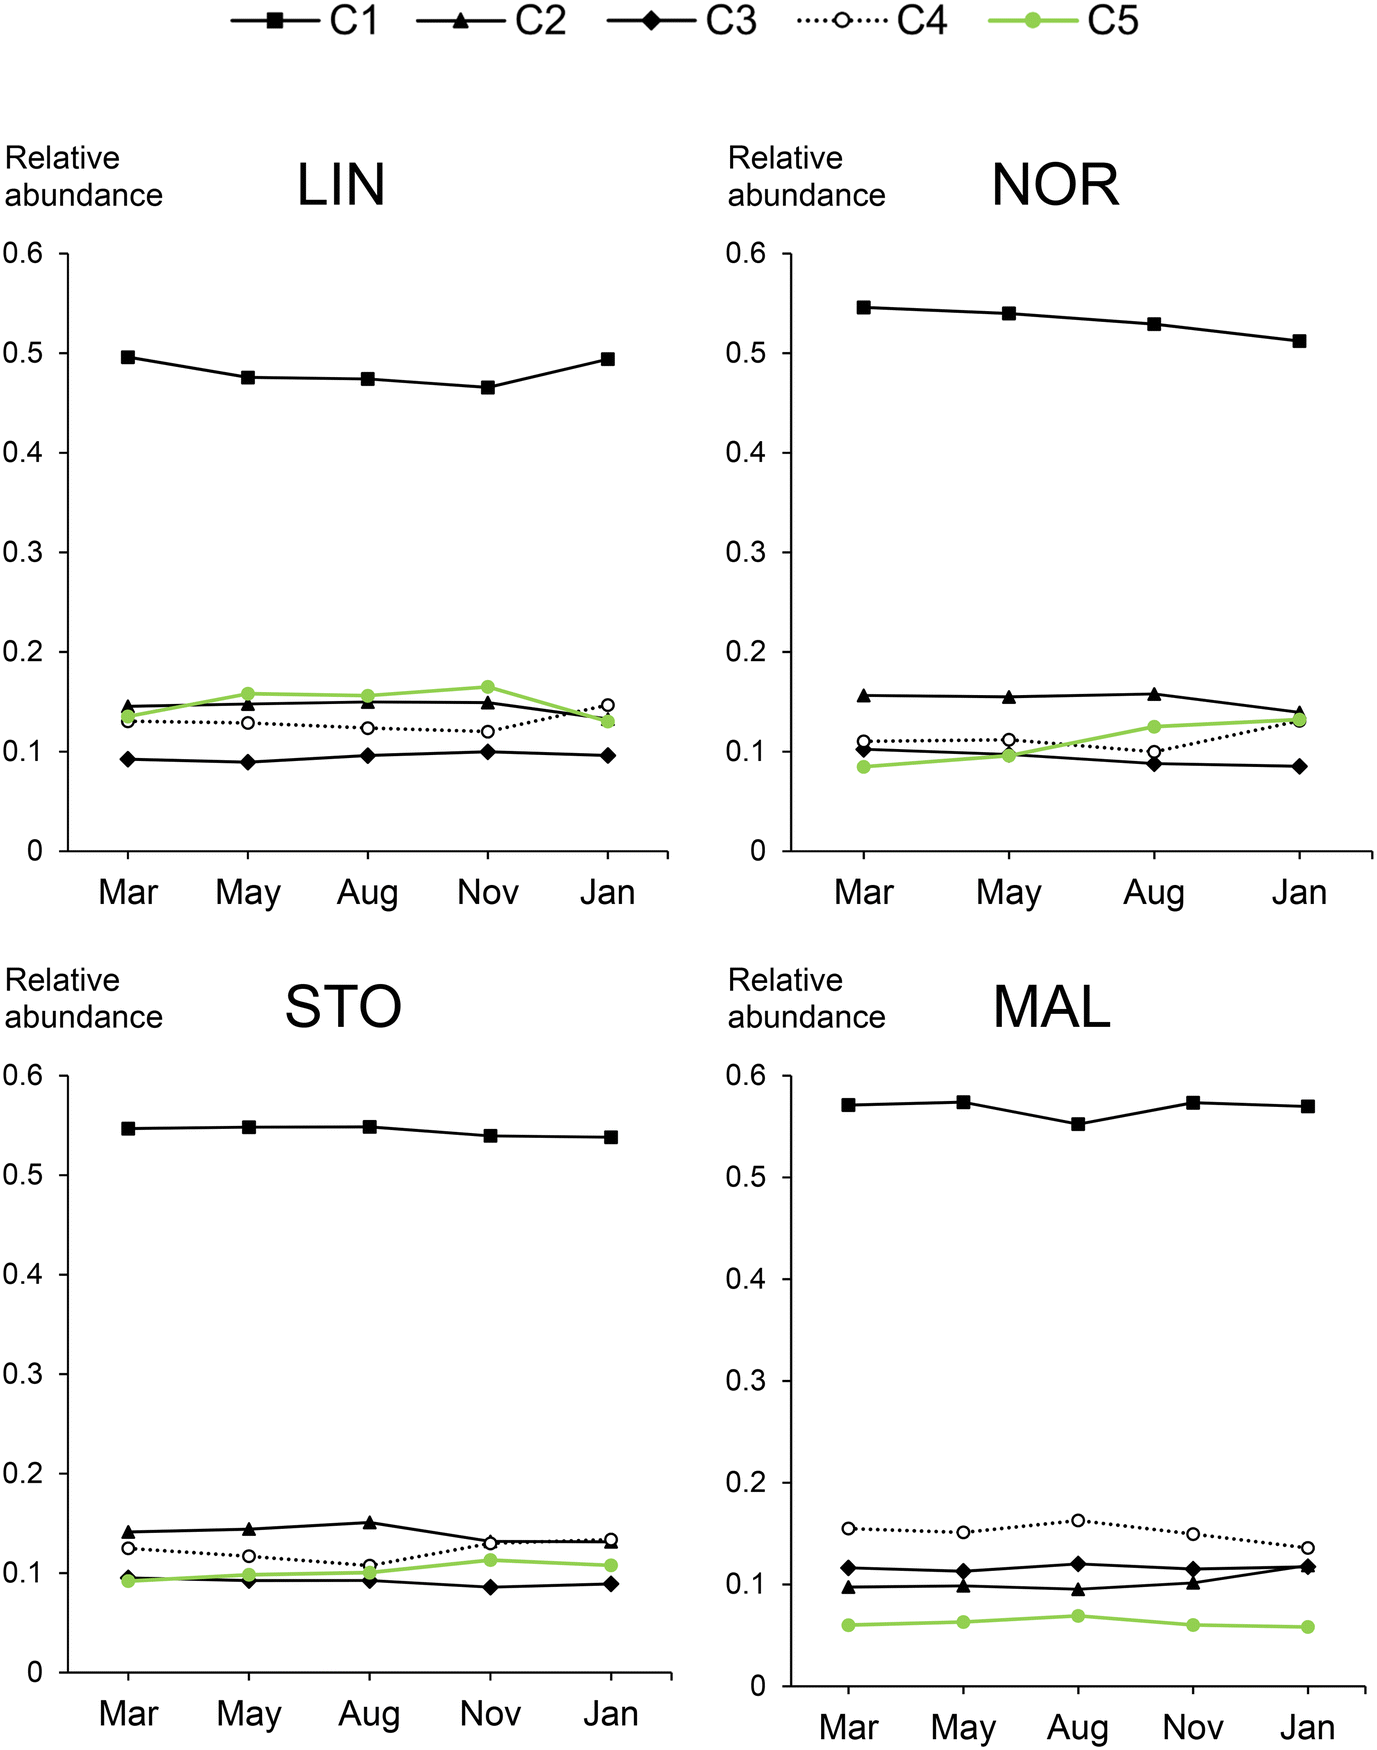 | ||
| Fig. 1 Relative abundance of the five PARAFAC components, C1–C5 (Fig. S2†) in raw waters for the DWTPs LIN, NOR, STO and MAL over five months. Average values of two replicates are presented. Data for NOR in November is missing. | ||
The most prominent seasonal changes observed through comparisons of weighted average elemental ratios and indices regarded the average oxidation state of carbon (COS) and sulfur (S) content (Tables S1–S4†). COS was typically lower in May (NOR, STO, MAL) and August (NOR, MAL), accompanied by lower sulfur content (NOR + STO). The seasonal changes in COS might be explained by variations in DOM oxidation reactions, which depend on, e.g., temperature, photochemical reactions, and biological activity. The overall seasonal consistency in DOM molecular composition of each water source is surprising, especially for the sources with short water residence time (NOR and LIN). However, it is possible that other DOM material, such as hydrophilic compounds, e.g., carbohydrates, varied more between seasons than the extractable mostly hydrophobic DOM studied here.
3.2 Seasonal DOM changes in DWTPs
|
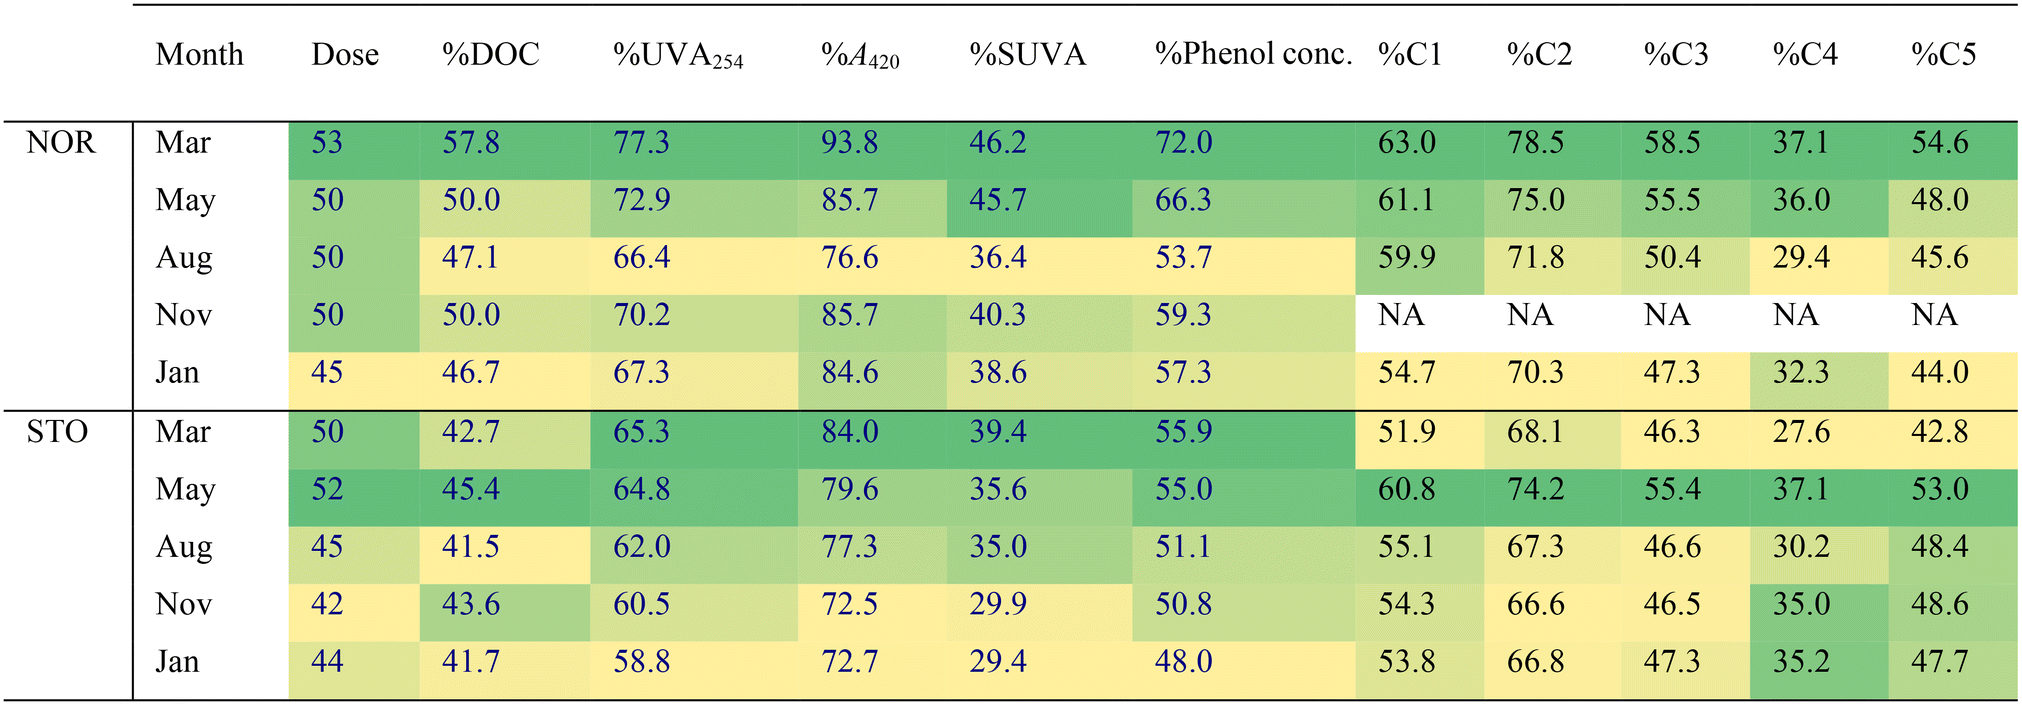
FT-ICR MS revealed coagulation selectivity for unsaturated, oxygenated compounds with COS > 0 detected in the mass range 200 to 600 m/z (Fig. 2 and 3) resulting in decreased weighted averages of double bond equivalences and O/C among NOM compositions detected after coagulation (Tables S7 and S8†). These results are consistent with previous findings44 but present a wider range of formulae (O/C: 0.1–0.85; H/C: 0.5–1.5), suggested being polyphenolic acids,29 supported by the 48–72% reduction in phenol concentrations (Table 4). The larger chemical diversity of molecules removed by coagulation is partly explained by the differences in the coagulation process in different months.
 | ||
| Fig. 2 Molecular compositions that decreased in relative abundance by more than 50% after coagulation at NOR, presented with van Krevelen (left panel), mass-edited H/C ratios (middle panel) and the average oxidation state of carbon (COS) (right panel). DOM changes for five months shown separately. Point size reflect relative mass peak intensity in a sample. | ||
 | ||
| Fig. 3 Molecular compositions that decreased in relative abundance by more than 50% after coagulation at STO, presented with van Krevelen (left panel), mass-edited H/C ratios (middle panel) and the average oxidation state of carbon (COS) (right panel). DOM changes for five months shown separately. Point size reflect relative mass peak intensity in a sample. | ||
In NOR, a seasonal trend emerged where humic-like DOM, especially, C1–C3, removal efficiency by coagulation decreased in the order March > May > August > January (Table 4, Fig. S10†). This is likely linked to the variations in raw water DOM concentrations of UV absorbing molecules, showing higher contributions of aromatic compounds, e.g., higher phenol concentrations and the highest C1–C3 fluorescence intensities in March and May (Table 3, Fig. S4†) and a peak in coagulant dose in March (Table 4). The lower variation in C1–C3 fluorescence after coagulation (Fig. S10†) highlights that coagulation can balance seasonal quantitative differences in humic-like DOM properties. Thus, the DOM components that varied seasonally were also those most effectively removed by coagulation, demonstrating a capacity of this treatment to manage seasonal differences. This has previously been observed when DOM characteristics of different source waters were compared before and after coagulation.45 Despite quite different original waters from Australia and Norway, coagulation made treated waters more similar, containing DOM escaping coagulation, e.g., the hydrophilic portion of DOM and uncharged DOM at pH ∼6.5.
For drinking water treatment, hydrophobic acids and phenols are important fractions of DOM to monitor because these are the primary DOM components quantitatively removed during treatment by coagulation. Charge density of raw water DOM has been identified as an important feature to optimize coagulation performance, e.g., through dose adjustments, and the largest proportion of total charge is found in the fulvic acid fraction.43 This is explained by the higher carboxyl content of fulvic acids and is consistent with the findings of this study where a PARAFAC component associated with fulvic-acid like DOM were most effectively removed during coagulation (Table 4).
Of individual CHO, CHNO and CHOS formulae that decreased in relative abundance by more than 50% after coagulation, 15% (NOR) and 8% (STO) were removed at all seasons, highlighting the extent of variation in removal at the molecular level. The variation can be observed as different curvature of molecular compositions in the van Krevelen diagrams (Fig. 2 and 3). For example, at NOR, a larger diversity of DOM molecules was affected by coagulation in March and August, where more saturated compounds were removed compared to other months (Fig. 2). In May, formulae with lower O/C ratios (<0.4), characterized by m/z < 400 and H/C < 1, were removed by coagulation in both NOR (Fig. 2 and S13†) and STO (Fig. 3 and S14†), indicating removal of additional aromatic DOM of low molecular weight this month, coinciding with an overall lower O/C ratio, mass weighted average and higher AImod of source water DOM in May (Tables S2 and S3†). Hence, it seems that these molecular level changes in coagulation removal partly reflects the molecular level differences in the raw water. Yet, the modified Kendrick mass defect plots for NOR and STO presented for each season (Fig. S15†), indicates overall similarity in polarity of the removed formulae.46
No or few formulae decreased in relative abundance by more than 50% after rapid sand filtration, while ∼350–450 formulae (at all five months combined for LIN and NOR respectively) decreased in relative abundance after slow sand filtration, highlighting that the different operational time scales of rapid and slow sand filtration influence DOM removal.
FT-ICR MS revealed a different discrimination of slow sand filtration (Fig. 4 and S16†), compared to coagulation (Fig. 2 and 3), selectively removing certain CHO and CHNO based DOM molecular compositions, with moderate to high saturation (H/C ratios ranging from 0.8 to 1.6), low oxygenation (O/C ratios < ∼0.4), lower mass and COS primarily < 0. These changes were also observed through increased weighted average of O/C among NOM compositions after slow sand filtration (Tables S6 and S7†). These DOM changes were primarily observed in August (LIN and NOR) and March (LIN) and correspond to previous observations,18,50 showing that aliphatic, less oxygenated molecules were more responsive to biodegradation. Apart from removal, previous studies have indicated increases in high-molecular weight molecules, released by microorganisms, post sand filtration.44
 | ||
| Fig. 4 Molecular compositions that decreased in relative abundance by more than 50% after slow sand filtration (comparison made with water collected before slow sand filtration) at LIN (March and August) and NOR (August), presented with van Krevelen (left panel), mass-edited H/C ratios (middle panel) and the average oxidation state of carbon (COS) (right panel). Point size reflect relative mass peak intensity in a sample. | ||
UV had limited effect overall, in LIN the abundance of UV-absorbing DOM was low at the point of UV treatment and at STO, coagulation had efficiently removed most of such susceptible compounds. However, in March at STO formulae with saturated H/C ratios (1.2–1.4), moderately oxygenated O/C ratios (0.4–0.55), with m/z > 600, decreased in relative abundance by more than 50% after UV (Fig. 5), indicating that the effect of UV on DOM were partly related to molecular mass, primarily affecting molecules with m/z > 580. Season-associated effects of UV treatment have been observed previously,51 and might be linked to a higher abundance of larger mass compounds in the raw water in March (Table S3†).
 | ||
| Fig. 5 van Krevelen diagrams (left panel), mass edited H/C ratios (middle panel) and average oxidation state of carbon plots (right panel) of the molecular compositions that decreased in relative abundance by more than 50% after UV treatment in STO in March. Point size reflect relative mass peak intensity in a sample. | ||
FT-ICR MS revealed DOM that changed in relative abundance by more than 50%, observed in STO in March, characterized by H/C ratios of 1–1.5, O/C ratios of 0.2–0.35 and COS < −0.5 (Fig. 6). This region of formulae affected by chloramine is well defined, comprising CHO molecules with aliphatic side chains and low oxygenation and is similar to the reactive DOM regions observed in previous studies using both chlorine and chloramine,18,53,54 and similar to DOM constituents released by algae or microorganisms forming DBPs through substitution reactions.44 DBPs formed at the four DWTPs were studied in two separate papers, focused on how DBP formation varied between the four DWTPs24 and how the mixture of DBPs changed between DWTPs and consumer taps.28
 | ||
| Fig. 6 van Krevelen diagrams (left panel), mass edited H/C ratios (middle panel) and average oxidation state of carbon plots (right panel) of the molecular compositions that decreased in relative abundance by more than 50% after the addition of monochloramine in STO in March. Point size reflect relative mass peak intensity in a sample. | ||
3.3 Overall findings
The most apparent seasonal variability in source water DOM characteristics were detected as changes in UV absorbance at 254 nm, SUVA and phenol concentration, indicating higher contribution of aromatic molecules with phenolic groups in the surface water sources in March and May. Fluorescence contributed by revealing source specific DOM fingerprints, e.g., different proportions in terrestrial and biologically derived DOM, highlighting intrinsic features of different sources.55 FT-ICR MS provided detailed information on the temporal evolution of individual DOM formulae. Weighted averages of total formulae varied little between seasons in the source waters. However, the overlap of individual compositions between seasons for each DWTP (40–53%) was comparable to the overlap of raw water CHO compositions between the four DWTPs (44–57%),24 demonstrating similar degree of specific compositional differences between investigated raw waters as between seasons for each raw water. The overlap of DOM compositions removed by coagulation at NOR and STO for the different seasons was lower (8–15%), indicating that the seasonal effect was more pronounced on actual treatment and that coagulation removed different DOM formulae at the different seasons.Methods ranging from bulk analyses to ultra-high-resolution mass spectrometry, and comparing a range of raw waters and DWTPs, provided the following findings:
1. Different methods detect distinct types of seasonal variabilities. Bulk DOC and optical analyses were often corresponding and could detect changes in coarse compositional features of raw water DOM and changes induced by sand filtration and coagulation. Signature fluorescence characteristics of raw water DOM remained despite seasonal changes in fluorescence intensities or Fmax, suggesting that seasonal differences induce quantitative changes of multiple groups of fluorescent molecules. FT-ICR MS could detect differences in treatment selectivity at the molecular level, e.g., showing opposite DOM selectivity of coagulation and sand filtration.
2. Bond Elut PPL captures a fraction of mesophilic and hydrophobic DOM that are not changing considerably between seasons.
3. Seasonal variability differed among the surface waters, and although main detected variability was related with summer months, less predictable raw water variability during other times of the year was observed.
4. Seasonal variability in raw water Fmax and effects upon treatment was observed also in the DWTP using ground water which seems related to variability in oxidation processes in the water throughout the treatments.
5. Coagulation attenuates but does not completely remove all fluorescent components in conventional drinking water treatments and could balance seasonal raw water variability in UV absorbing, chromophoric and phenol containing DOM. Both FT-ICR MS and PARAFAC demonstrated that coagulation removed highly oxygenated reduced DOM, i.e., polyphenols. Seasonal molecular level changes in coagulation removal partly reflected molecular level differences in the raw water.
6. Sand filtration removed protein-like fluorescence and DOM of low oxygen content, high saturation and low mass and the removal capacity was dependent on temperature, demonstrating potential for increased removal of autochthonous DOM during summer months.
3.4 Future DOM monitoring
Improving DOM monitoring approaches will be important to maintain drinking water quality where increased levels or higher fluctuations in raw water DOM is anticipated in the future. Also, the limited predictability in raw water variability observed through this work indicates that continuous monitoring of DOM characteristics would be superior to, e.g., modeling of variability based on autochthonous primary productivity.Techniques that provide simultaneous monitoring for multiple purposes are attractive and a growing concern regards the release of toxins during algal or cyanobacterial blooms. This is an area for which high-resolution mass spectrometry approaches present valuable tools for identification, e.g., through screening of cyanotoxins,56 while fluorescence spectroscopy can provide early-warning signals of cyanobacterial bloom initiation.57,58 The potential for multiparameter monitoring, e.g., microcystin-LR monitoring59 along with DBP formation prediction and monitoring of municipal wastewater intrusion,60 offered by both techniques is intriguing. For example, by using fluorescence spectroscopy, a humic-like component was found to correlate with the formation potential of trihalomethanes (THMs), while N-nitrosodimethylamine (NDMA) formation potential correlated to a protein-like component,61,62 demonstrating connections between fluorescent properties and the formation of DBPs of different health concern. Also, the long history of research comparing fluorescent signals from drinking water and wastewater could potentially enable discrimination of wastewater fluorescence to detect its intrusion in drinking water treatment,60 which is one of the most common reasons for waterborne outbreaks. Furthermore, impacts from human activities and release of anthropogenic compounds, such as synthetic surfactants, characterized by its substantial sulfur content,60 can be detected through the formula level assessments and heteroatom discrimination provided by mass spectrometry. Consequently, these analytical tools have the potential for improved DOM monitoring in relation to multiple emerging environmental challenges simultaneously.
Previous research has investigated relationships between the optical properties of DOM and individual DOM molecular formulae detected by FT-ICR MS in lake water,63 finding multiple associations between individual components derived from PARAFAC analysis and the compositional space of molecular formulae detected by FT-ICR MS, e.g., indicative of aquatic and terrestrial DOM. However, chemodiversity could not be adequately described by optical properties, highlighting one aspect in which these techniques complement each other. One question we put forward was: could other seasonal differences be observed if other fractions were separated through extraction, e.g., connected to biological activity? For example, to capture seasonal changes of algal- or microbially derived hydrophilic DOM that may drive microbial metabolism, optimized extraction is likely needed. Bond Elut PPL has demonstrated limited capacity to extract algae DOM64 and due to the hydrophilic nature, low SUVA and negative charge (at pH 2–10), of DOM derived from many algal and cyanobacterial species, e.g., Chlorella vulgaris, Microcystis aeruginosa, Asterionella formosa and Melosira,65 other sorbents or extraction approaches are required to capture this fraction of DOM. Even though tryptophan-like fluorescence has been associated with various algal and cyanobacterial species, the fluorescence signatures vary dramatically between different taxa, generally providing low fluorescent signals.65 Moreover, polysaccharides, one of the most abundant constituents of cyanobacterial- and algal DOM,66 cannot be detected by fluorescence. Therefore, to efficiently capture the autochthonous DOM that is expected to change seasonally, other analyses might be needed.67 Hence, future work focused on seasonal changes to hydrophilic DOM and its impact on drinking water treatment using other methods would complement the current understanding on seasonal changes of DOM. For example, other ionization techniques, such as atmospheric pressure photoionization (APPI) or ESI with positive ionization (ESI+) will extend the window of DOM compositions detected by FT-ICR MS.68 For example, ESI+ could improve detection of aliphatic DOM69 and nitrogen-containing compounds, such as proteins, originating from in-lake production and algal- or microbially derived DOM.
Fluorescence spectroscopy presents an option for DOM charge monitoring, with a potential to detect DOM compositional changes linked to charge density that can be used to optimize coagulation performance and are missed with bulk analysis. Furthermore, the application of fluorescence ratios to assess DOM composition, has demonstrated potential to optimize multiple water treatments, including coagulation, powdered activated carbon, ion exchange, ozonation and chlorination. For instance, different fluorescence ratios were used to explain DOM treatability by these different water treatments for a broad range of surface waters in Europe, USA, Asia and Africa.70 By focusing on specific excitation and emission wavelengths, the application of in situ measurements, i.e., continuous measurements online, becomes possible and such fluorimeters are commercially available.67
The sampling occasions in this study didn't coincide with any extreme weather events. Hence, the capacities of DWTPs to handle dramatic variations in raw water DOM, caused by heavy rainfall or high water levels in the surface water sources, were not addressed. However, UVA254 could detect seasonal variations in coarse DOM characteristics and could likely detect such changes caused by extreme weather events as well, guiding adaptive actions e.g., adjustment of coagulant dose, to maintain quality of treated water. If needed, UVA254 monitoring might be expanded by discriminating between phenols and acids through pH adjustments prior UV measurements. To recognize algal-derived DOM from the diatom Aulacoseira granulate, spectral slopes at 275 and 295 nm can be used,71 and a similar approach might be useful to monitor DOM from other algae or microbes as well. Furthermore, monitoring of C/N ratios through elemental analysis, provides information on relative contribution of polysaccharides and proteins from algal- or cyanobacterial derived DOM, which ratios will be different from DOM from terrestrial sources.66
Conclusions
Conventional drinking water treatment demonstrated resilience towards seasonal changes in DOM composition; coagulation could effectively remove the aromatic fraction of DOM that varied more between seasons, and sand filtration showed increased capacity to remove autochthonous DOM during summer months. It is possible that DOM other than those captured by reversed phase extraction or detected by optical measurements may vary more with season or that other ionization techniques, such as positive mode ESI, could better capture the seasonally varying fraction of DOM. Future increases in DOM composition variability due to season, as well as climate or other factors, require improved methods to target the DOM fraction changing the most. Such targeted DOM monitoring approaches could guide potential adjustment actions at DWTPs to avoid non-optimal treatment or process failures, to maintain consistent drinking water quality.Conflicts of interest
There are no conflicts of interest to declare.Acknowledgements
We thank FORMAS, the Swedish Research Council for Sustainable Development, who funded this study (grants no. 2013-1077 and 2021-01662). We recognize Kerstin Nilsson at VA SYD and Helena Stavklint at Tekniska verken i Linköping AB who contributed by practical assistance and reviewing the data interpretation from a waterworks perspective, representing Bulltofta and Berggården, respectively. We warmly thank the staff at the DWTPs, Berggården, Borg, Görväln and Bulltofta, for support during sample collection and input during data analysis. We specifically want to thank Peter Collin, Kristina Dahlberg, Lena Cedergren and Martin Sandell. We also thank Susanne Karlsson and Lena Lundman for major practical assistance and Nguyen Thanh Duc and Magnus Gålfalk for support during development of Matlab scripts.References
- H. A. De Wit, S. Valinia, G. A. Weyhenmeyer, M. N. Futter, P. Kortelainen, K. Austnes, D. O. Hessen, A. Räike, H. Laudon and J. Vuorenmaa, Current Browning of Surface Waters Will Be Further Promoted by Wetter Climate, Environ. Sci. Technol. Lett., 2016, 3, 430–435 CrossRef CAS.
- S. J. Köhler, E. Lavonen, A. Keucken, P. Schmitt-Kopplin, T. Spanjer and K. Persson, Upgrading coagulation with hollow-fibre nanofiltration for improved organic matter removal during surface water treatment, Water Res., 2016, 89, 232–240 CrossRef PubMed.
- D. Hongve, G. Riise and J. F. Kristiansen, Increased colour and organic acid concentrations in Norwegian forest lakes and drinking water – A result of increased precipitation?, Aquat. Sci., 2004, 66, 231–238 CrossRef CAS.
- E. S. Kritzberg, E. M. Hasselquist, M. Škerlep, S. Löfgren, O. Olsson, J. Stadmark, S. Valinia, L. A. Hansson and H. Laudon, Browning of freshwaters: Consequences to ecosystem services, underlying drivers, and potential mitigation measures, Ambio, 2020, 49, 375–390 CrossRef PubMed.
- N. Roulet and T. R. Moore, Environmental chemistry: Browning the waters, Nature, 2006, 444, 283–284 CrossRef CAS PubMed.
- M. B. Wallin, G. A. Weyhenmeyer, D. Bastviken, H. E. Chmiel, S. Peter, S. Sobek and L. Klemedtsson, Temporal control on concentration, character, and export of dissolved organic carbon in two hemiboreal headwater streams draining contrasting catchments, J. Geophys. Res. Biogeosci, 2015, 120, 832–846 CrossRef CAS.
- C. L. Faithfull, A. K. Bergström and T. Vrede, Effects of nutrients and physical lake characteristics on bacterial and phytoplankton production: A meta-analysis, Limnol. Oceanogr., 2011, 56, 1703–1713 CrossRef CAS.
- Y. Xiao, T. Rohrlack and G. Riise, Unraveling long-term changes in lake color based on optical properties of lake sediment, Sci. Total Environ., 2020, 699, 134388 CrossRef CAS PubMed.
- J. B. Fellman, E. Hood and R. G. M. Spencer, Fluorescence spectroscopy opens new windows into dissolved organic matter dynamics in freshwater ecosystems: A review, Limnol. Oceanogr., 2010, 55, 2452–2462 CrossRef CAS.
- S. A. Baghoth, S. K. Sharma and G. L. Amy, Tracking natural organic matter (NOM) in a drinking water treatment plant using fluorescence excitation–emission matrices and PARAFAC, Water Res., 2011, 45, 797–809 CrossRef CAS PubMed.
- P. G. Coble, Characterization of marine and terrestrial DOM in seawater using excitation–emission matrix spectroscopy, Mar. Chem., 1996, 51, 325–346 CrossRef CAS.
- M. Chen, R. M. Price, Y. Yamashita and R. Jaffé, Comparative study of dissolved organic matter from groundwater and surface water in the Florida coastal Everglades using multi-dimensional spectrofluorometry combined with multivariate statistics, Appl. Geochem., 2010, 25, 872–880 CrossRef CAS.
- P. Massicotte and J. J. Frenette, Spatial connectivity in a large river system: Resolving the sources and fate of dissolved organic matter, Ecol. Appl., 2011, 21, 2600–2617 CrossRef PubMed.
- M. Bieroza, A. Baker and J. Bridgeman, Relating freshwater organic matter fluorescence to organic carbon removal efficiency in drinking water treatment, Sci. Total Environ., 2009, 407, 1765–1774 CrossRef CAS PubMed.
- C. A. Stedmon, B. Seredyńska-Sobecka, R. Boe-Hansen, N. Le Tallec, C. K. Waul and E. Arvin, A potential approach for monitoring drinking water quality from groundwater systems using organic matter fluorescence as an early warning for contamination events, Water Res., 2011, 45, 6030–6038 CrossRef CAS PubMed.
- Z. Zhao, M. Gonsior, J. Luek, S. Timko, H. Ianiri, N. Hertkorn, P. Schmitt-Kopplin, X. Fang, Q. Zeng, N. Jiao and F. Chen, Picocyanobacteria and deep-ocean fluorescent dissolved organic matter share similar optical properties, Nat. Commun., 2017, 8, 15284 CrossRef CAS PubMed.
- R. W. Paerl, I. M. Claudio, M. R. Shields, T. S. Bianchi and C. L. Osburn, Dityrosine formation via reactive oxygen consumption yields increasingly recalcitrant humic-like fluorescent organic matter in the ocean, Limnol. Oceanogr. Lett., 2020, 5, 337–345 CrossRef CAS.
- E. E. Lavonen, D. N. Kothawala, L. J. Tranvik, M. Gonsior, P. Schmitt-Kopplin and S. J. Köhler, Tracking changes in the optical properties and molecular composition of dissolved organic matter during drinking water production, Water Res., 2015, 85, 286–294 CrossRef CAS PubMed.
- N. P. Sanchez, A. T. Skeriotis and C. M. Miller, Assessment of dissolved organic matter fluorescence PARAFAC components before and after coagulation-filtration in a full scale water treatment plant, Water Res., 2013, 47, 1679–1690 CrossRef CAS PubMed.
- Y. Shutova, A. Baker, J. Bridgeman and R. K. Henderson, Spectroscopic characterisation of dissolved organic matter changes in drinking water treatment: From PARAFAC analysis to online monitoring wavelengths, Water Res., 2014, 54, 159–169 CrossRef CAS PubMed.
- J. Valle, M. Harir, M. Gonsior, A. Enrich-Prast, P. Schmitt-Kopplin, D. Bastviken and N. Hertkorn, Molecular differences between water column and sediment pore water SPE-DOM in ten Swedish boreal lakes, Water Res., 2020, 170, 115320 CrossRef CAS PubMed.
- A. M. Kellerman, T. Dittmar, D. N. Kothawala and L. J. Tranvik, Chemodiversity of dissolved organic matter in lakes driven by climate and hydrology, Nat. Commun., 2014, 5, 3804 CrossRef CAS PubMed.
- A. M. Kellerman, D. N. Kothawala, T. Dittmar and L. J. Tranvik, Persistence of dissolved organic matter in lakes related to its molecular characteristics, Nat. Geosci., 2015, 8, 454–457 CrossRef CAS.
- A. Andersson, M. Harir, M. Gonsior, N. Hertkorn, P. Schmitt-Kopplin, H. Kylin, S. Karlsson, M. J. Ashiq, E. Lavonen, K. Nilsson, Ä. Pettersson, H. Stavklint and D. Bastviken, Waterworks-specific composition of drinking water disinfection by-products, Environ. Sci.: Water Res. Technol., 2019, 5, 861–872 RSC.
- J. L. Weishaar, G. R. Aiken, B. A. Bergamaschi, M. S. Fram, R. Fujii and K. Mopper, Evaluation of specific ultraviolet absorbance as an indicator of the chemical composition and reactivity of dissolved organic carbon, Environ. Sci. Technol., 2003, 37, 4702–4708 CrossRef CAS PubMed.
- J. D. Box, Investigation of the Folin-Ciocalteau phenol reagent for the determination of polyphenolic substances in natural waters, Water Res., 1983, 17, 511–525 CrossRef CAS.
- T. Dittmar, B. Koch, N. Hertkorn and G. Kattner, A simple and efficient method for the solid-phase extraction of dissolved organic matter (SPE-DOM) from seawater, Limnol. Oceanogr.: Methods, 2008, 6, 230–235 CrossRef CAS.
- A. Andersson, M. Gonsior, M. Harir, N. Hertkorn, P. Schmitt-Kopplin, L. Powers, H. Kylin, D. Hellstrom, K. Nilsson, A. Pettersson, H. Stavklint and D. Bastviken, Molecular changes among non-volatile disinfection by-products between drinking water treatment and consumer taps, Environ. Sci.: Water Res. Technol., 2021, 7, 2335–2345 RSC.
- M. Gonsior, P. Schmitt-Kopplin, H. Stavklint, S. D. Richardson, N. Hertkorn and D. Bastviken, Changes in Dissolved Organic Matter during the Treatment Processes of a Drinking Water Plant in Sweden and Formation of Previously Unknown Disinfection Byproducts, Environ. Sci. Technol., 2014, 48, 12714–12722 CrossRef CAS PubMed.
- A. A. Andrew, R. Del Vecchio, Y. Zhang, A. Subramaniam and N. V. Blough, Are Extracted Materials Truly Representative of Original Samples? Impact of C18 Extraction on CDOM Optical and Chemical Properties, Front. Chem., 2016, 4, 4 Search PubMed.
- R. G. Zepp, W. M. Sheldon and M. A. Moran, Dissolved organic fluorophores in southeastern US coastal waters: Correction method for eliminating Rayleigh and Raman scattering peaks in excitation–emission matrices, Mar. Chem., 2004, 89, 15–36 CrossRef CAS.
- C. A. Stedmon and R. Bro, Characterizing dissolved organic matter fluorescence with parallel factor analysis: A tutorial, Limnol. Oceanogr.: Methods, 2008, 6, 572–579 CrossRef CAS.
- K. R. Murphy, C. A. Stedmon, D. Graeber and R. Bro, Fluorescence spectroscopy and multi-way techniques. PARAFAC, Anal. Methods, 2013, 5, 6557–6566 RSC.
- K. R. Murphy, C. A. Stedmon, P. Wenig and R. Bro, OpenFluor- An online spectral library of auto-fluorescence by organic compounds in the environment, Anal. Methods, 2014, 6, 658–661 RSC.
- A. D. Pifer, S. L. Cousins and J. L. Fairey, Assessing UV- and fluorescence-based metrics as disinfection byproduct precursor surrogate parameters in a water body influenced by a heavy rainfall event, J. Water Supply: Res. Technol.--AQUA, 2014, 63, 200–211 CrossRef CAS.
- C. L. Osburn, L. T. Handsel, M. P. Mikan, H. W. Paerl and M. T. Montgomery, Fluorescence tracking of dissolved and particulate organic matter quality in a river-dominated estuary, Environ. Sci. Technol., 2012, 46, 8628–8636 CrossRef CAS PubMed.
- C. Guéguen, C. W. Cuss, C. J. Cassels and E. C. Carmack, Absorption and fluorescence of dissolved organic matter in the waters of the Canadian Arctic Archipelago, Baffin Bay, and the Labrador Sea, J. Geophys. Res.: Oceans, 2014, 119, 2034–2047 CrossRef.
- B. P. Koch and T. Dittmar, From mass to structure: An aromaticity index for high-resolution mass data of natural organic matter, Rapid Commun. Mass Spectrom., 2006, 20, 926–932 CrossRef CAS.
- S. Shakeri Yekta, M. Gonsior, P. Schmitt-Kopplin and B. H. Svensson, Characterization of dissolved organic matter in full scale continuous stirred tank biogas reactors using ultrahigh resolution mass spectrometry: A qualitative overview, Environ. Sci. Technol., 2012, 46, 12711–12719 CrossRef CAS PubMed.
- C. A. Hughey, C. L. Hendrickson, R. P. Rodgers, A. G. Marshall and K. Qian, Kendrick mass defect spectrum: A compact visual analysis for ultrahigh-resolution broadband mass spectra, Anal. Chem., 2001, 73, 4676–4681 CrossRef CAS PubMed.
- J. H. Kroll, N. M. Donahue, J. L. Jimenez, S. H. Kessler, M. R. Canagaratna, K. R. Wilson, K. E. Altieri, L. R. Mazzoleni, A. S. Wozniak, H. Bluhm, E. R. Mysak, J. D. Smith, C. E. Kolb and D. R. Worsnop, Carbon oxidation state as a metric for describing the chemistry of atmospheric organic aerosol, Nat. Chem., 2011, 3, 133–139 CrossRef CAS PubMed.
- J. Raeke, O. J. Lechtenfeld, J. Tittel, M. R. Oosterwoud, K. Bornmann and T. Reemtsma, Linking the mobilization of dissolved organic matter in catchments and its removal in drinking water treatment to its molecular characteristics, Water Res., 2017, 113, 149–159 CrossRef CAS PubMed.
- E. L. Sharp, S. A. Parsons and B. Jefferson, Seasonal variations in natural organic matter and its impact on coagulation in water treatment, Sci. Total Environ., 2006, 363, 183–194 CrossRef CAS PubMed.
- H. He, H. Xu, L. Li, X. Yang, Q. Fu, X. Yang, W. Zhang and D. Wang, Molecular transformation of dissolved organic matter and the formation of disinfection byproducts in full-scale surface water treatment processes, Sci. Total Environ., 2022, 838, 156547 CrossRef CAS PubMed.
- R. Fabris, C. W. K. Chow, M. Drikas and B. Eikebrokk, Comparison of NOM character in selected Australian and Norwegian drinking waters, Water Res., 2008, 42, 4188–4196 CrossRef CAS PubMed.
- B. P. Koch, K. U. Ludwichowski, G. Kattner, T. Dittmar and M. Witt, Advanced characterization of marine dissolved organic matter by combining reversed-phase liquid chromatography and FT-ICR-MS, Mar. Chem., 2008, 111, 233–241 CrossRef CAS.
- P. Krzeminski, C. Vogelsang, T. Meyn, S. J. Köhler, H. Poutanen, H. A. de Wit and W. Uhl, Natural organic matter fractions and their removal in full-scale drinking water treatment under cold climate conditions in Nordic capitals, J. Environ. Manage., 2019, 241, 427–438 CrossRef CAS PubMed.
- J. Sohn, G. Amy and Y. Yoon, Process-train profiles of NOM through a drinking water treatment plant, J. - Am. Water Works Assoc., 2007, 99, 145–153 CrossRef CAS.
- D. M. Moll, R. S. Summers, A. C. Fonseca and W. Matheis, Impact of temperature on drinking water biofilter performance and microbial community structure, Environ. Sci. Technol., 1999, 33, 2377–2382 CrossRef CAS.
- Z. Yuan, C. He, Q. Shi, C. Xu, Z. Li, C. Wang, H. Zhao and J. Ni, Molecular Insights into the Transformation of Dissolved Organic Matter in Landfill Leachate Concentrate during Biodegradation and Coagulation Processes Using ESI FT-ICR MS, Environ. Sci. Technol., 2017, 51, 8110–8118 CrossRef CAS PubMed.
- Y. Choi and Y. J. Choi, The effects of UV disinfection on drinking water quality in distribution systems, Water Res., 2010, 44, 115–122 CrossRef CAS PubMed.
- J. Criquet, E. M. Rodriguez, S. Allard, S. Wellauer, E. Salhi, C. A. Joll and U. von Gunten, Reaction of bromine and chlorine with phenolic compounds and natural organic matter extracts – Electrophilic aromatic substitution and oxidation, Water Res., 2015, 85, 476–486 CrossRef CAS PubMed.
- H. Zhang, Y. Zhang, Q. Shi, S. Ren, J. Yu, F. Ji, W. Luo and M. Yang, Characterization of low molecular weight dissolved natural organic matter along the treatment trait of a waterworks using Fourier transform ion cyclotron resonance mass spectrometry, Water Res., 2012, 46, 5197–5204 CrossRef CAS PubMed.
- H. Zhang, Y. Zhang, Q. Shi, J. Hu, M. Chu, J. Yu and M. Yang, Study on transformation of natural organic matter in source water during chlorination and its chlorinated products using ultrahigh resolution mass spectrometry, Environ. Sci. Technol., 2012, 46, 4396–4402 CrossRef CAS PubMed.
- J. Bridgeman, M. Bieroza and A. Baker, The application of fluorescence spectroscopy to organic matter characterisation in drinking water treatment, Rev. Environ. Sci. Biotechnol., 2011, 10, 277–290 CrossRef CAS.
- S. Bogialli, C. Bortolini, I. M. Di Gangi, F. N. Di Gregorio, L. Lucentini, G. Favaro and P. Pastore, Liquid chromatography-high resolution mass spectrometric methods for the surveillance monitoring of cyanotoxins in freshwaters, Talanta, 2017, 170, 322–330 CrossRef CAS PubMed.
- C. Hipsher, J. Barker and A. MacKay, Impact of bloom events on dissolved organic matter fluorophore signatures in Ohio waters, Sci. Total Environ., 2020, 699, 134003 CrossRef CAS PubMed.
- M. Ziegmann, M. Abert, M. Müller and F. H. Frimmel, Use of fluorescence fingerprints for the estimation of bloom formation and toxin production of Microcystis aeruginosa, Water Res., 2010, 44, 195–204 CrossRef CAS PubMed.
- M. J. Brophy, B. F. Trueman, Y. Park, R. A. Betts and G. A. Gagnon, Fluorescence Spectra Predict Microcystin-LR and Disinfection Byproduct Formation Potential in Lake Water, Environ. Sci. Technol., 2019, 53, 586–594 CrossRef CAS PubMed.
- W. Shi, W. E. Zhuang, J. Hur and L. Yang, Monitoring dissolved organic matter in wastewater and drinking water treatments using spectroscopic analysis and ultra-high resolution mass spectrometry, Water Res., 2021, 188, 116406 CrossRef CAS PubMed.
- L. Yang, D. Kim, H. Uzun, T. Karanfil and J. Hur, Assessing trihalomethanes (THMs) and N-nitrosodimethylamine (NDMA) formation potentials in drinking water treatment plants using fluorescence spectroscopy and parallel factor analysis, Chemosphere, 2015, 121, 84–91 CrossRef CAS PubMed.
- T. Maqbool, J. Zhang, Y. Qin, Q. V. Ly, M. B. Asif, X. Zhang and Z. Zhang, Seasonal occurrence of N-nitrosamines and their association with dissolved organic matter in full-scale drinking water systems: Determination by LC-MS and EEM-PARAFAC, Water Res., 2020, 183, 116096 CrossRef CAS PubMed.
- A. M. Kellerman, Molecular-level dissolved organic matter dynamics in lakes: Constraints on reactivity and persistence, Uppsala Universitet, 2015 Search PubMed.
- M. Chen, S. Kim, J. E. Park, H. S. Kim and J. Hur, Effects of dissolved organic matter (DOM) sources and nature of solid extraction sorbent on recoverable DOM composition: Implication into potential lability of different compound groups, Anal. Bioanal. Chem., 2016, 408, 4809–4819 CrossRef CAS PubMed.
- R. K. Henderson, A. Baker, S. A. Parsons and B. Jefferson, Characterisation of algogenic organic matter extracted from cyanobacteria, green algae and diatoms, Water Res., 2008, 42, 3435–3445 CrossRef CAS PubMed.
- Q. V. Ly, T. Maqbool and J. Hur, Unique characteristics of algal dissolved organic matter and their association with membrane fouling behavior: a review, Environ. Sci. Pollut. Res., 2017, 24, 11192–11205 CrossRef CAS PubMed.
- E. M. Carstea, C. L. Popa, A. Baker and J. Bridgeman, In situ fluorescence measurements of dissolved organic matter: A review, Sci. Total Environ., 2020, 699, 134361 CrossRef CAS PubMed.
- A. Andersson, M. Harir and D. Bastviken, Extending the potential of Fourier transform ion cyclotron resonance mass spectrometry for the analysis of disinfection by-products, TrAC, Trends Anal. Chem., 2023, 167, 117264 CrossRef CAS.
- T. Ohno, R. L. Sleighter and P. G. Hatcher, Comparative study of organic matter chemical characterization using negative and positive mode electrospray ionization ultrahigh-resolution mass spectrometry, Anal. Bioanal. Chem., 2016, 408, 2497–2504 CrossRef CAS PubMed.
- M. Philibert, S. Luo, L. Moussanas, Q. Yuan, E. Filloux, F. Zraick and K. R. Murphy, Drinking water aromaticity and treatability is predicted by dissolved organic matter fluorescence, Water Res., 2022, 220, 118592 CrossRef CAS PubMed.
- J. Hur, Microbial changes in selected operational descriptors of dissolved organic matters from various sources in a watershed, Water, Air, Soil Pollut., 2011, 215, 465–476 CrossRef CAS.
Footnote |
| † Electronic supplementary information (ESI) available. See DOI: https://doi.org/10.1039/d4ew00142g |
| This journal is © The Royal Society of Chemistry 2024 |