 Open Access Article
Creative Commons Attribution 3.0 Unported Licence
Single-atom catalysts for CO2 electroreduction with significant activity and selectivity improvements†
Seoin
Back
 a,
Juhyung
Lim
a,
Na-Young
Kim
a,
Juhyung
Lim
a,
Na-Young
Kim
 b,
Yong-Hyun
Kim
 b and
Yousung
Jung
 *a
*a
aGraduate School of EEWS, Korea Advanced Institute of Science and Technology (KAIST), 291 Daehakro, Daejeon 34141, Korea. E-mail: ysjn@kaist.ac.kr
bGraduate School of Nanoscience and Technology, Korea Advanced Institute of Science and Technology (KAIST), 291 Daehakro, Daejeon 34141, Korea
First published on 19th September 2016
Abstract
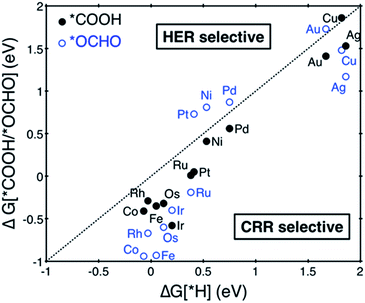
A single-atom catalyst (SAC) has an electronic structure that is very different from its bulk counterparts, and has shown an unexpectedly high specific activity with a significant reduction in noble metal usage for CO oxidation, fuel cell and hydrogen evolution applications, although physical origins of such performance enhancements are still poorly understood. Herein, by means of density functional theory (DFT) calculations, we for the first time investigate the great potential of single atom catalysts for CO2 electroreduction applications. In particular, we study a single transition metal atom anchored on defective graphene with single or double vacancies, denoted M@sv-Gr or M@dv-Gr, where M = Ag, Au, Co, Cu, Fe, Ir, Ni, Os, Pd, Pt, Rh or Ru, as a CO2 reduction catalyst. Many SACs are indeed shown to be highly selective for the CO2 reduction reaction over a competitive H2 evolution reaction due to favorable adsorption of carboxyl (*COOH) or formate (*OCHO) over hydrogen (*H) on the catalysts. On the basis of free energy profiles, we identified several promising candidate materials for different products; Ni@dv-Gr (limiting potential UL = −0.41 V) and Pt@dv-Gr (−0.27 V) for CH3OH production, and Os@dv-Gr (−0.52 V) and Ru@dv-Gr (−0.52 V) for CH4 production. In particular, the Pt@dv-Gr catalyst shows remarkable reduction in the limiting potential for CH3OH production compared to any existing catalysts, synthesized or predicted. To understand the origin of the activity enhancement of SACs, we find that the lack of an atomic ensemble for adsorbate binding and the unique electronic structure of the single atom catalysts as well as orbital interaction play an important role, contributing to binding energies of SACs that deviate considerably from the conventional scaling relation of bulk transition metals.
1. Introduction
Due to a limited reservoir of fossil fuels and an increase in atmospheric CO2 concentration, there is an urgent need to develop a renewable solution to convert waste CO2 into valuable chemicals and fuels. Considerable efforts have been devoted to electrochemical reduction of CO2 since this method operates at ambient and mild conditions and can potentially produce various useful hydrocarbons.1,2 Transition metal catalysts have been extensively investigated both theoretically and experimentally,3–9 and general understanding at present is that a strong correlation between binding energies of various reaction intermediates on transition metals and a lack of ability to independently control them poses a significant intrinsic limitation in developing suitable catalysts for large-scale commercialization of the CO2 reduction reaction. For example, for efficient production of CO, the binding energy of *COOH (* meaning adsorbed species on the catalysts) should be strong for facile activation of CO2, whereas the binding of *CO and *H should be weak for easy desorption of products and to suppress the unwanted hydrogen evolution reaction (HER), respectively. However, due to a well-known scaling relation, the binding behaviors of *H, *COOH, and *CO all have the same tendency for transition metals in general.3,7 Therefore, there is a great interest in developing strategies for deviating from the scaling relation to achieve high selectivity and activity for the CO2 reduction reaction (CRR).Recently, single-atom catalysts (SACs) have been investigated as a promising type of catalyst for various reactions as they surpass conventional catalysts in terms of having a high specific activity with a significantly reduced amount of noble metals used.10–16 Pt1/FeOx was firstly synthesized and utilized as a single atom catalyst for CO oxidation with extremely high activity and stability.17 Recently, a single Ni atom was successfully doped at lattice defects of graphene and showed exceptional activity for electrochemical hydrogen production12 due to electronic interactions18 between the metal and graphene. SACs also offer an intriguing opportunity to alter product selectivity. Single-atom Pt deposited on TiN produced H2O2 (2 e− pathway) as a major product over H2O (4 e− pathway) during the electrochemical O2 reduction reaction.13
In this work, we investigate a series of single transition metal atoms anchored on defective-graphene as CO2 electroreduction catalysts, and report a few catalysts that exhibit a remarkable reduction in overpotentials for CH3OH and CH4 production. In particular, Pt@dv-Gr is identified as a promising candidate for CH3OH production with a substantially reduced limiting potential. The origin of the unusually low overpotentials for SACs is understood using the lack of an atomic ensemble for adsorbate binding and specific metal–support interactions that break the scaling relation for SACs.
2. Computational details
Structure relaxation and density of states (DOS) calculations were performed using spin-polarized density-functional theory (DFT) calculations implemented in the Vienna Ab initio Simulation Package (VASP)19,20 with projector-augmented wave (PAW) pseudopotential.21 Calculated spin moments are summarized in ESI note 1.† We used the RPBE exchange functional,22,23 and the van der Waals (vdW) correction24 which were previously shown to yield a good agreement with experiments in terms of energetics and electronic structure for similar gas adsorption on an organometallic system.25 A cut-off energy for the plane wave basis set was set to 500 eV and k-points were sampled using a 4 × 4 × 1 Monkhorst–Pack mesh.26To determine the most stable configuration of a metal atom–graphene complex, we compared binding energies of a metal atom on graphene with single or double vacancies. Binding energies of each metal atom at defective graphenes are calculated following the expression EB[M] = EM/Gr − EGr − EM, where EM/Gr, EGr and EM denote the calculated electronic energies of the metal–graphene complex, defective graphene and metal atom referenced to their metallic states (fcc, bcc, and hcp), respectively. To model the defective graphenes, we firstly used a periodic supercell containing 24 carbon atoms with a vacuum set to 15 Å in a z-direction, and then one or two carbon atoms were removed to create the single (sv) or double vacancies (dv) and to provide a site for metal adsorption, referred to as “M@sv-Gr” or “M@dv-Gr”, respectively (Fig. 1A and B). Various transition metal atoms (M = Ag, Au, Co, Cu, Fe, Ir, Ni, Os, Pd, Pt, Rh and Ru) were anchored at the vacant sites of the graphene. We note that our computational unit cell enables us to efficiently calculate various reaction intermediates and it represents high coverage of a single metal atom.
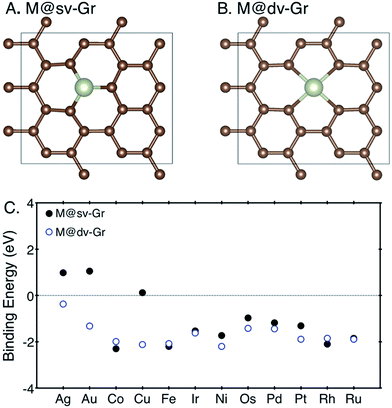 | ||
| Fig. 1 The top view of (A) M@sv-Gr and (B) M@dv-Gr, and (C) binding energies of various transition metal atoms with the sv-Gr (filled black circles) and dv-Gr (open blue circles) defective sites. | ||
A computational hydrogen electrode (CHE) was used to establish a free energy profile for electrochemical reduction reactions, as pioneered by Nørskov and co-workers.27 The limiting potential (UL) of the reaction is obtained from the free energy change (ΔGMAX) by using the relation UL = −ΔGMAX/e. For additional calculation details, we referred to our previous publications.3,4 Briefly, to convert electronic energies to free energies, zero-point energy, enthalpy and entropy corrections of adsorbates were calculated using a harmonic oscillator approximation at 298.15 K. For molecules, free energy corrections are taken from ref. 6. We also employed an approximate solvation correction to account for the effect of water, where *COOH, *CO and *OH are stabilized by 0.25, 0.1 and 0.5 eV, respectively.6 All correction values can be found in the ESI (Table S2).†
3. Results
3.1. Adsorption of metal atoms at the vacancy site of graphene
For SACs to maintain their catalytic activity for long-term uses, strong binding of a metal atom with a support is a prerequisite to prevent aggregation of metal atoms. Weak binding energies imply that the metal atoms are prone to diffusion with low diffusion barriers, resulting in aggregation to form metal nanoclusters, which usually happens when the metal atom is adsorbed on defect-free graphene.28,29 We thus first calculated the binding energies of the metal atoms at the sv-Gr or dv-Gr sites, and the results are summarized in Fig. 1C. Most of the metals have favorable and sufficiently strong binding with the aforementioned defect sites of graphene. In detail, for Co, Fe and Rh, the sv-Gr binding is more favorable than the dv-Gr binding, but for all other cases, the dv-Gr binds the metals more strongly. Therefore, for the rest of this paper, we will consider CO2 electrochemical reduction reactions for M = Co, Fe and Rh using the M@sv-Gr model, and M = Ag, Au, Cu, Ir, Ni, Os, Pd, Pt and Ru using the M@dv-Gr model. In conjunction with the strong binding energies of the metal atoms, Bader charge analysis30,31 indicates that, as expected, significant amounts of electrons in the metal atoms are transferred to the graphene in all cases, confirming the strong covalent interactions between the partially positively charged metal atom and the graphene (Table S1†).29,323.2. CO2 electroreduction reaction on the SACs
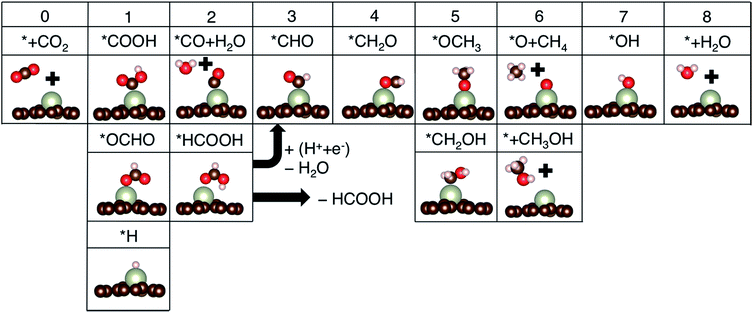
Additional protonation of *CHO can form either *OCH3 (known to determine the selectivity between CH4 and CH3OH)4 or *CH2OH (which only yields CH3OH upon further protonation since that is more favorable than the formation of *CH2 + H2O in all cases). Free energy profiles for a few promising candidate materials are summarized in Fig. S1,† and the potential determining step (PDS) and limiting potential (UL) toward the most favorable products are summarized in Table 1.
| Metal | PDS | U L |
|---|---|---|
| a HCOOH production. b CH4 production. c CH3OH production. | ||
| Aga | CO2 → *OCHO | −1.17 |
| Aua | CO2 → *COOH | −1.41 |
| Cob | *OCHO → *HCOOH | −0.56 |
| Cuc | CO2 → *OCHO | −1.48 |
| Feb | *HCOOH → *CHO | −0.73 |
| Irc | *CH2OH → CH3OH | −0.57 |
| Nic | CO2 → *COOH | −0.41 |
| Osb | *OH → *+H2O | −0.52 |
| Pdc | *CO → *CHO | −0.62 |
| Ptc | *CO → *CHO | −0.27 |
| Rhc | *OCH3 → CH3OH | −0.57 |
| Rub | *HCOOH → *CHO | −0.52 |
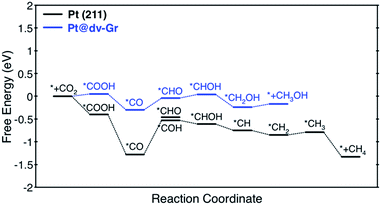
Among the considered SACs, Ni@dv-Gr and Pt@dv-Gr showed a UL of −0.41 and −0.27 V, respectively, for CH3OH production, while Os@dv-Gr and Ru@dv-Gr both showed a UL of −0.52 V for CH4 production. To put these theoretical predictions into perspective, it is useful to make links to previous theoretical and experimental results. For example, the theoretical limiting potentials for CH4 production on Ni (211), Pt (211) and Cu (211) surfaces are −0.7 to −0.8 V vs. RHE.4 However, in an experiment for the CO2 reduction reaction, polycrystalline Ni and Pt produced H2 gas as a major product almost exclusively and only a trace of CH4 with a total current density of 5 mA cm−2 at −1.08 V and −0.67 V vs. RHE, respectively, while Cu produced CH4, C2H4, and H2 in similar amounts with a total current density of 5 mA cm−2 at −1.05 V vs. RHE.35 It is thus noteworthy that the experimental product selectivity is significantly different for Ni, Pt and Cu, even though their theoretical limiting potentials for the CO2 reduction reaction are similar. The origin of the dominant H2 production during the CO2 reduction reaction has been suggested to be that for strong *CO binding catalysts such as Ni and Pt, the *H binding energies shift toward being weaker as the coverage of *CO increases due to a repulsive interaction between *CO and *H. This then makes Ni and Pt catalysts more active for the HER (shifting from the left leg to the top of a HER volcano, therefore reducing the limiting potentials for the HER).8,36 On the other hand, the increasing *CO coverage negatively affects the HER on moderate or weak *CO binding catalysts such as Cu (shifting more to the right leg of the HER volcano, therefore increasing the limiting potential for the HER). Therefore, to achieve high activity and selectivity for the CO2 reduction reaction, the catalysts should have less negative limiting potentials and bind *CO moderately at the same time if the coverage effects are expected to be considerable. However, since all the active sites of the SACs are isolated, we suppose that there are no such coverage effects as in conventional metal catalysts, which leads to the conclusion that the aforementioned SACs can produce the desired reduction products over H2 with considerably reduced limiting potentials. In particular, as in the free energy diagram shown in Fig. 4 in detail, the predicted theoretical limiting potential (UL) for CH3OH production using Pt@dv-Gr is significantly less negative than any catalysts that produce CH4 or CH3OH in the literature, synthesized (−0.5 to −1.0 V)35,37,38 or predicted (−0.3 V to −1.0 V).4,6,39,40
3.3. Origin of large activity improvement on the SACs
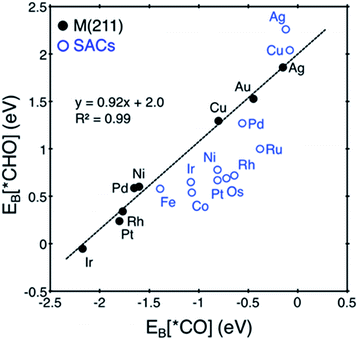
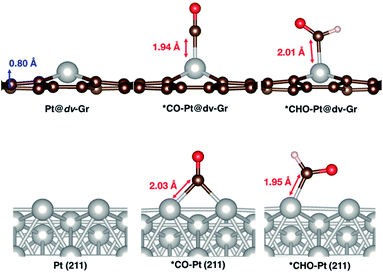
Here, we focus on Pt@dv-Gr to investigate the origin of the activity improvement on SACs compared to their transition metal counterparts. Notably, as shown in Fig. 4, the PDS of CO2 reduction on Pt@dv-Gr vs. Pt (211) is the protonation of *CO to form *CHO (ΔG = 0.27 eV) vs. *COH (ΔG = 0.75 eV). In Fig. 4, it is visually clear that, with the Pt@dv-Gr catalyst, all reaction intermediates are destabilized compared to those on Pt (211), but most importantly, the destabilization of *CO (0.98 eV) is much more noticeable than that of *CHO (0.42 eV), leading to a 0.49 V reduction in the limiting potential. Therefore, understanding the origin of the different stabilities of *CO and *CHO (or *COH) on Pt@dv-Gr vs. Pt (211) surfaces is key to explaining the activity improvements of the Pt-based SAC. As the free energy of *CHO and *COH on the Pt (211) is similar, we will discuss the relative stabilities of *CO and *CHO in order to directly compare with those on Pt@dv-Gr.In Fig. 5, we also observe that with SACs, the conventional scaling relation between *CO binding and *CHO binding, that is well established for the bulk transition metal catalysts, significantly deviates from linearity. In the following, we thus discuss features of SACs which contribute to the breakdown of this scaling relation between *CO and *CHO, namely, a lack of atomic ensemble for adsorbate binding and metal–support interactions that lead to electronic structures conducive to catalysis.
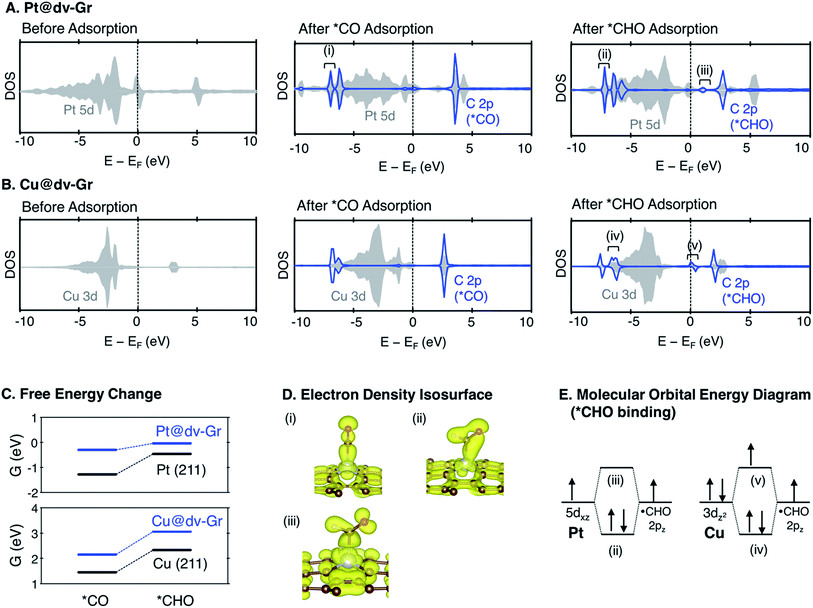
In understanding the poor scaling relation between the *CO and *CHO bindings in SACs (Fig. 5), we focus on Pt and Cu as representative cases since Pt shows a negative deviation (below the usual scaling trend line) and Cu shows a positive deviation (above the trend line).
As shown in Fig. 7 and S3,† the major bonding interaction between *CO and Pt@dv-Gr is the Pt(dz2)–C(pz) σ bond along the z-direction at around −7 eV (denoted (i) in Fig. 7A). The next sharp peak at around −6 eV corresponds to a covalent C–O bond (denoted (ii) in Fig. S3†) without much mixing with the single metal atom. For *CHO binding, three overlapping peaks are noticeable below the Fermi level. The first sharp peak corresponds to the bonding interaction between C(pz) and a hybridized orbital of Pt(dxz) and Pt(dz2) (denoted (ii) in Fig. 7A). The second peak corresponds to the bonding interaction between C(px), C(pz) and Pt(dz2) (denoted (iv) in Fig. S3†). The third peak corresponds to the localized bonding interaction between C and O since the DOS of C does not change upon adsorption (denoted (v) in Fig. S3†).
For Cu@dv-Gr, on the other hand, the orbital contribution for *CO binding is also the σ bonding interactions along the z-direction similar to Pt@dv-Gr, yet there is a much weaker overlap than that of Pt@dv-Gr (Fig. S3 and S4†), giving a *CO binding energy on Cu@dv-Gr (−0.08 eV) that is substantially weaker than that on Pt@dv-Gr (−0.81 eV). In addition, a more important feature distinctive of Cu compared to Pt appears in *CHO binding (see Fig. S4†); the orbital (v) in Fig. 7B that is an antibonding counterpart of the σ(Pt(dz2)–C(pz)) bond ((iv) in Fig. 7B) is partially occupied unlike the similar state that is completely unfilled in Pt ((iii) in Fig. 7A). This partial occupancy of the antibonding orbital in Cu@dv-Gr weakens the metal–*CHO binding strength, and with a lack of such antibonding occupancy for *CO binding, the relative *CO vs. *CHO free energy difference that determines the limiting potential significantly increases for Cu@dv-Gr compared to Pt@dv-Gr. This weakening of *CHO binding for Cu@dv-Gr can be schematically understood as in Fig. 7E since the Cu atom in the almost square-planar symmetry has a completely filled d8 electron configuration to begin. By contrast, Pt only fills the bonding orbital via orbital mixing due to a single occupancy in the dxz orbital that can interact with the C(pz) orbital of *CHO. To further validate this interpretation, we performed the same analysis for Ag@dv-Gr and Au@dv-Gr, and confirmed the same completely filled d8-block elements as in Cu. Indeed, we observe that the antibonding states originating from the interaction of metal dz2 and C(pz) are partially filled (Fig. S5†) in these elements also, leading to the destabilization of *CHO, and eventually the positive deviation from the usual *CO vs. *CHO scaling relation shown in Fig. 5. To extend our understanding to other metals, we additionally analyzed the DOS for *CHO adsorption on metals in other SACs (Fig. S7 and ESI note 3†), and it was observed that the antibonding states are partially filled only for metals in group 11 (Ag, Au and Cu).
4. Conclusions
In this paper, we investigated single atom catalysts (SACs) as promising CO2 electroreduction catalysts using DFT calculations. The main findings of this work are as follows.(i) By comparing free energies of the initial protonation steps for the CRR and HER, we found that all the candidate SACs are capable of selectively reducing CO2 rather than producing hydrogen gas. Among the considered SACs, Ni@dv-Gr and Pt@dv-Gr showed a UL of −0.41 and −0.27 V for CH3OH production, while Os@dv-Gr and Ru@dv-Gr both showed a UL of −0.52 V for CH4 production. In particular, the predicted limiting potential for Pt@dv-Gr (−0.27 V) for CH3OH production is considerably less negative than for conventional transition metal catalysts (−0.7 to −0.8 V).
(ii) To understand the origin of the activity improvements using SACs, we investigated two aspects (the atomic ensemble and the electronic structure) of Pt@dv-Gr that affect the relative stability of *CO vs. *CHO. A one-fold bonding of *CO on Pt@dv-Gr due to a lack of atomic ensemble, as compared to the two-fold *CO bonding on Pt (211), is responsible for the significant weakening of the *CO binding on Pt@dv-Gr.
(iii) We investigated the electronic structure of a Pt atom in the SAC to find the origin of the deviation of SACs from the conventional scaling relation of transition metals, which arises from the d-band center theory. We suggest that the strong electronic interaction between the d-orbital of the metal atom and the p-orbital of graphene is responsible for the different behavior from the transition metal surfaces, as evidenced by the electron transfer and the overlap in the DOS. We particularly noticed a difference in the direction of the latter deviation for Ag and Cu-based SACs vs. other SACs. By analyzing the decomposed density of states, we found that the completely filled d8 electron configuration leads to the partial occupation of antibonding orbitals during the *CHO binding for the Ag, Au, and Cu based SACs, weakening the *CHO binding and increasing the limiting potential.
Acknowledgements
We acknowledge support through the National Research Foundation of Korea from the Korean Government (NRF-2015R1A2A1A15055539, NRF-2016M3D1A1021147), and support from Climate Change Research Hub Project of the KAIST EEWS Research Center (EEWS-2016-N11160016) as well as Agency for Defense Development (UD140047GD). S. B. acknowledges the Global PhD Fellowship Program through NRF funded by the Ministry of Education (NRF-2014H1A2A1016055).References
- M. Gattrell, N. Gupta and A. Co, J. Electroanal. Chem., 2006, 594, 1–19 CrossRef CAS.
- M. Gattrell, N. Gupta and A. Co, Energy Convers. Manage., 2007, 48, 1255–1265 CrossRef CAS.
- S. Back, Y. Jung and M. S. Yeom, ACS Catal., 2015, 5, 5089–5096 CrossRef CAS.
- S. Back, H. Kim and Y. Jung, ACS Catal., 2015, 5, 965–971 CrossRef CAS.
- H. Mistry, R. Reske, Z. Zeng, Z.-J. Zhao, J. Greeley, P. Strasser and B. Roldan Cuenya, J. Am. Chem. Soc., 2014, 136, 16473–16476 CrossRef CAS PubMed.
- A. A. Peterson, F. Abild-Pedersen, F. Studt, J. Rossmeisl and J. K. Nørskov, Energy Environ. Sci., 2010, 3, 1311–1315 CAS.
- A. A. Peterson and J. K. Nørskov, J. Phys. Chem. Lett., 2012, 3, 251–258 CrossRef CAS.
- C. Shi, H. A. Hansen, A. C. Lausche and J. K. Nørskov, Phys. Chem. Chem. Phys., 2014, 16, 4720–4727 RSC.
- W. Zhu, Y.-J. Zhang, H. Zhang, H. Lv, Q. Li, R. Michalsky, A. A. Peterson and S. Sun, J. Am. Chem. Soc., 2014, 136, 16132–16135 CrossRef CAS PubMed.
- X.-F. Yang, A. Wang, B. Qiao, J. Li, J. Liu and T. Zhang, Acc. Chem. Res., 2013, 46, 1740–1748 CrossRef CAS PubMed.
- S. Liang, C. Hao and Y. Shi, ChemCatChem, 2015, 7, 2559–2567 CrossRef CAS.
- H. J. Qiu, Y. Ito, W. Cong, Y. Tan, P. Liu, A. Hirata, T. Fujita, Z. Tang and M. Chen, Angew. Chem., 2015, 127, 14237–14241 CrossRef.
- S. Yang, J. Kim, Y. J. Tak, A. Soon and H. Lee, Angew. Chem., Int. Ed., 2015, 55, 2058–2062 CrossRef PubMed.
- X. Li, W. Bi, L. Zhang, S. Tao, W. Chu, Q. Zhang, Y. Luo, C. Wu and Y. Xie, Adv. Mater., 2016, 28, 2427–2431 CrossRef CAS PubMed.
- J. Lin, A. Wang, B. Qiao, X. Liu, X. Yang, X. Wang, J. Liang, J. Li, J. Liu and T. Zhang, J. Am. Chem. Soc., 2013, 135, 15314–15317 CrossRef CAS PubMed.
- J.-X. Liang, J. Lin, X.-F. Yang, A.-Q. Wang, B.-T. Qiao, J. Liu, T. Zhang and J. Li, J. Phys. Chem. C, 2014, 118, 21945–21951 CAS.
- B. Qiao, A. Wang, X. Yang, L. F. Allard, Z. Jiang, Y. Cui, J. Liu, J. Li and T. Zhang, Nat. Chem., 2011, 3, 634–641 CrossRef CAS PubMed.
- E. Yoo, T. Okata, T. Akita, M. Kohyama, J. Nakamura and I. Honma, Nano Lett., 2009, 9, 2255–2259 CrossRef CAS PubMed.
- G. Kresse and J. Furthmüller, Comput. Mater. Sci., 1996, 6, 15–50 CrossRef CAS.
- G. Kresse and D. Joubert, Phys. Rev. B: Condens. Matter Mater. Phys., 1999, 59, 1758 CrossRef CAS.
- P. E. Blöchl, Phys. Rev. B: Condens. Matter Mater. Phys., 1994, 50, 17953 CrossRef.
- B. Hammer, L. B. Hansen and J. K. Nørskov, Phys. Rev. B: Condens. Matter Mater. Phys., 1999, 59, 7413 CrossRef.
- J. P. Perdew, K. Burke and M. Ernzerhof, Phys. Rev. Lett., 1996, 77, 3865 CrossRef CAS PubMed.
- S. Grimme, J. Antony, S. Ehrlich and H. Krieg, J. Chem. Phys., 2010, 132, 154104 CrossRef PubMed.
- H. Kim, Y. H. Chang, W.-J. Jang, E.-S. Lee, Y.-H. Kim and S.-J. Kahng, ACS Nano, 2015, 9, 7722–7728 CrossRef CAS PubMed.
- H. J. Monkhorst and J. D. Pack, Phys. Rev. B: Condens. Matter Mater. Phys., 1976, 13, 5188 CrossRef.
- J. K. Nørskov, J. Rossmeisl, A. Logadottir, L. Lindqvist, J. R. Kitchin, T. Bligaard and H. Jonsson, J. Phys. Chem. B, 2004, 108, 17886–17892 CrossRef.
- A. Krasheninnikov, P. Lehtinen, A. S. Foster, P. Pyykkö and R. M. Nieminen, Phys. Rev. Lett., 2009, 102, 126807 CrossRef CAS PubMed.
- H. Wang, Q. Feng, Y. Cheng, Y. Yao, Q. Wang, K. Li, U. Schwingenschlögl, X. X. Zhang and W. Yang, J. Phys. Chem. C, 2013, 117, 4632–4638 CAS.
- W. Tang, E. Sanville and G. Henkelman, J. Phys.: Condens. Matter, 2009, 21, 084204 CrossRef CAS PubMed.
- G. Henkelman, A. Arnaldsson and H. Jónsson, Comput. Mater. Sci., 2006, 36, 354–360 CrossRef.
- Y. Tang, Z. Yang and X. Dai, Phys. Chem. Chem. Phys., 2012, 14, 16566–16572 RSC.
- M. Evans and M. Polanyi, J. Chem. Soc., Faraday Trans., 1938, 34, 11–24 RSC.
- J. Bronsted, Chem. Rev., 1928, 5, 231–338 CrossRef CAS.
- K. P. Kuhl, T. Hatsukade, E. R. Cave, D. N. Abram, J. Kibsgaard and T. F. Jaramillo, J. Am. Chem. Soc., 2014, 136, 14107–14113 CrossRef CAS PubMed.
- Y.-J. Zhang, V. Sethuraman, R. Michalsky and A. A. Peterson, ACS Catal., 2014, 4, 3742–3748 CrossRef CAS.
- K. Manthiram, B. J. Beberwyck and A. P. Alivisatos, J. Am. Chem. Soc., 2014, 136, 13319–13325 CrossRef CAS PubMed.
- D. A. Torelli, S. A. Francis, J. C. Crompton, A. Javier, J. R. Thompson, B. S. Brunschwig, M. P. Soriaga and N. S. Lewis, ACS Catal., 2016, 6, 2100–2104 CrossRef CAS.
- Y. Li, H. Su, S. H. Chan and Q. Sun, ACS Catal., 2015, 5, 6658–6664 CrossRef CAS.
- K. Chan, C. Tsai, H. A. Hansen and J. K. Nørskov, ChemCatChem, 2014, 6, 1899–1905 CrossRef CAS.
- F. Abild-Pedersen, J. Greeley, F. Studt, J. Rossmeisl, T. Munter, P. G. Moses, E. Skulason, T. Bligaard and J. K. Nørskov, Phys. Rev. Lett., 2007, 99, 016105 CrossRef CAS PubMed.
- B. Hammer and J. Norskov, Nature, 1995, 376, 238–240 CrossRef CAS.
Footnote |
| † Electronic supplementary information (ESI) available. See DOI: 10.1039/c6sc03911a |
| This journal is © The Royal Society of Chemistry 2017 |

