
Nanosilver-loaded metal–organic framework UiO-66 with strong fungicidal activity†
Carolina
Chiericatti
 a,
Luis A.
Lozano
b and
Juan M.
Zamaro
*b
a,
Luis A.
Lozano
b and
Juan M.
Zamaro
*b
aCátedra de Microbiología, Facultad de Ingeniería Química, Universidad Nacional del Litoral, Santiago del Estero 2829 (3000), Santa Fe, Argentina
bInstituto de Investigaciones en Catálisis y Petroquímica, INCAPE (FIQ, UNL, CONICET), Santiago del Estero 2829 (3000), Santa Fe, Argentina. E-mail: zamaro@fiq.unl.edu.ar; Fax: +54 0342 4536861; Tel: +54 0342 4536861
First published on 23rd January 2023
Abstract
Molds are microorganisms capable of both contaminating different food matrices, leading to their organoleptic deterioration, and causing risks to humans due to the development of mycotoxins. To control this type of contamination process, silver nanoparticles are an effective alternative, particularly if they are applied through hosting in carriers that allow their gradual dosage. In this work, a green functionalization strategy of the metal–organic framework UiO-66 with dispersed cationic silver species was analyzed and optimized, obtaining a nanomaterial with a remarkable performance in fungal control. First, the MOF was obtained under an eco-sustainable protocol and, afterwards, the incorporation of silver with sodium citrate as additive was analyzed. The physicochemical properties of the obtained Ag/UiO-66 solids were analyzed through several characterization techniques such as XRD, FTIR, UV-DRS, TGA-SDTA, SEM-EDS, TEM and XPS. Then, the materials were evaluated in the growth control of the mold P. roqueforti isolated from contaminated food of industrial origin which was taken as a model microorganism. It is shown that Ag/UiO-66 has a strong antifungal action, reducing the growth of the colonies of P. roqueforti by a magnitude of 5![[thin space (1/6-em)]](https://www.rsc.org/images/entities/char_2009.gif) log after 72 h, and positioning it as a promising nanomaterial towards the control of fungal contamination.
log after 72 h, and positioning it as a promising nanomaterial towards the control of fungal contamination.
Design, System, ApplicationMolds contaminate food matrices leading to their organoleptic deterioration and causing risks to humans due to the development of mycotoxins. To control this type of contamination process we propose and optimize a green and simple functionalization strategy of the metal–organic framework UiO-66, stabilizing a high loading of dispersed cationic silver species. It is shown that the Ag/UiO-66 nanomaterial has an outstanding antifungal action, being a promising nanomaterial for the control of fungal contamination. |
1. Introduction
Fungal contamination is an important problem in industry since it deteriorates food matrices, thus causing important economic losses and health risks since many mold species are producers of mycotoxins.1,2 The control of this type of contamination is quite challenging since the environmental fungal load is generally high in addition to the fact that mold spores are transported through the air to the surface of the food and once there, these substrates rich in nutrients allow molds to proliferate easily. P. roqueforti is a common polluting mold since it is a ubiquitous microorganism in the environment and its fungal spores are adapted for an easy dissemination. It can be considered as a model mold of fungal contamination since it tolerates anaerobic conditions, it is psychrophilic, it grows vigorously even under refrigeration conditions3 and, on top of that, many species have acquired resistance to chemical preservatives.4 This problem has led to the study of different alternatives for the control of contamination by this type of microorganisms, for example, through the development of nanomaterials with antifungal properties. An alternative is that of those materials that use transition metals with antimicrobial properties in their composition, such as Cu, Co, Zn or Ag.5 Among these, solids based on silver nanoparticles (Ag-NPs) are the ones that have shown the greatest effectiveness, but most studies have focused mainly on bacterial contamination control.6 The efficient application of the above mentioned Ag-NPs requires their delivery because in free form they lose the effectiveness given their tendency to aggregate.7 For this reason, the dispersion of silver in matrices has been proposed which would also facilitate their recovery and reuse. To this purpose, some inorganic solids have been investigated like titania, silica, titanium phosphate and zeolites.8–10 Even these types of matrices have shown effectiveness when immobilized on structured supports such as cotton or polymers.11,12In recent years, a family of hybrid inorganic–organic solids named metal–organic frameworks (MOFs) has emerged arousing increasing interest in several applied fields and, recently, in microbiological control.13 MOF-based materials with antimicrobial properties have been obtained either using the MOF as a reservoir of metal ions, employing bioactive molecules as linkers, or as a carrier for the administration of different antimicrobial molecules.13 In a pioneering work, it was shown that HKUST-1 is effective against the growth of several types of molds, thanks to the action of copper ions released from their own structure towards the mold walls.14 A MOF with attractive qualities to be used in this type of application is UiO-66 since it has hydrophilic characteristics, resists low pH,15 has good thermal, chemical, and mechanical stability and low toxicity.16 In addition, it has shown the ability to disperse transition metals in its structure, such as copper, cobalt, iron17,18 and silver,16,19–21 while preserving its connectivity and structural integrity. These qualities have promoted the study of UiO-66 for microorganism control applications. For example, its post-metalation with silver has been studied and has given rise to a highly strong bactericide material.21 Another example is the inclusion of Ag-NPs in the framework to treat foodborne pathogenic bacteria contamination in water.16 Moreover, the UiO-66 linker has been modified in order to obtain bioactive molecules as active chlorine atoms bond to the amine-functionalized linker.22 In addition, this MOF has also been used to encapsulate bactericide molecules that generate reactive oxygen species as gentamicin.23 Antibacterial dual MOF heterostructure composite has also been obtained with a porphyrin-doped UiO-66 as a shell.24
UiO-66 is made up of zirconium clusters linked by benzenedicarboxylate molecules in a crystalline structure with cages of 8 Å and 11 Å25 and has been obtained in a sustainable way as nanocrystals with a large specific surface area.26 On the other hand, controlling the size and shape of dispersed silver species is of utmost importance taking into account that these properties impact the way that silver is released, determining its antimicrobial ability.7 In relation to this aspect, the use of sodium citrate to improve the dispersion of silver, both in solution and on the surface of inorganic materials, has been reported.27,28 In the described context, the objective of this work is to analyze the immobilization of cationic silver species in the UiO-66 framework through an easy impregnation methodology employing sodium citrate as dispersion agent. The goal is to achieve a high loading of dispersed silver species in the MOF in order to obtain a new nanomaterial with antifungal properties. The preparation methodology and physicochemical properties of the materials were analyzed and then they were evaluated in their ability to control the growth of P. roqueforti mold.
2. Experimental
2.1. Reactives
For the synthesis of UiO-66 benzene dicarboxylic acid (BDC, Aldrich, 98.0%), ZrCl4 (Aldrich, 98.0%) and acetone (Cicarelli, 99.5%) were used. For the incorporation of silver, Ag(NO3)2·3H2O (Aldrich, 98–103% RT) and sodium citrate (Cicarelli, 99.0%) were used. Malt extract broth (MEB) (Biokar 2.0%), peptone (Merk 0.1%), glucose (Cicarelli, 2.0%) and distilled water were used in the microbiological assays.2.2. Synthesis of UiO-66
UiO-66 nanocrystals were obtained following a DMF-free protocol previously reported by the authors employing a microwave assisted synthesis.17 Briefly, 70 ml of a mixture containing BDC:ZrCl4:acetone in a molar ratio of 1:1:1622 were prepared and kept under stirring for 25 min, after which it was placed in an autoclave and treated in a Milestone flexiWAVE microwave oven (220 V, 50 Hz). Synthesis was carried out under stirring for 6 h at 80 °C, after which UiO-66 nanocrystals were recovered by centrifugation (13078 rcf, 10 min, Hermle Z 326, Germany), washed twice with ethanol and dried in a stove (80 °C).
2.3. Preparation of Ag/UiO-66
The incorporation of silver was carried out by wet impregnation using silver nitrate as a precursor and sodium citrate as an additive so that the nominal silver loading in the solids would be of 10 wt%. The procedure consisted in preparing an aqueous mixture of Ag(NO3)2·3H2O and sodium citrate, placing it in an ultrasonic bath for 1 h and then adding UiO-66 crystals (previously evacuated at 120 °C for 15 h) and finally keeping the mixture under stirring for 2 h at room temperature. Then, the solids were recovered by filtration, intensively washed with distilled water and dried at 120 °C overnight. In this way, solids using different molar ratios of Ag(NO3)2·3H2O/sodium citrate (2.5, 1.0, 0.75, 0.62, 0.5) were prepared. Subsequently, the materials underwent a heat treatment in He to decompose the precursors and immobilize the silver species in the MOF. The samples were named as Ag/U(R)T, where U refers to UiO-66, R indicates the precursor/dispersant molar ratio and T, when applicable, that the sample underwent a heat treatment.2.4. Preparation of the inoculum suspension
For the microbiological tests, Penicillium roqueforti from the strain collection of our laboratory (LMFIQ 287) was employed. The mold was initially isolated from a food industry located in the province of Santa Fe, Argentina. After reactivating the strain, its identity was confirmed according to certain characteristics, as indicated by Pitt and Hocking.1 For the preparation of the inoculum suspension, an abundant quantity of spores was collected with an eyelet loop from cultures incubated at 28 °C for 5–7 days (exponential growth phase) with malt extract agar (MEA). From these cultures, the spore suspension was prepared adjusting the concentration to 105–106 fungal propagules per mL in sterile tubes containing 5 mL of Tween 20 (0.1% v/v in sterile water). Tween 20 is a non-ionic surfactant used to improve the dispersion of conidia in water by reducing the surface tension, thus favoring the homogenization of the fungal suspension.2.5. Microbiological assays
To evaluate the antifungal activity, the solid (0.1 g) was dispersed in 100 mL of MEB (malt extract broth) under ultrasound for 10 min to homogenize the suspension and remove the air trapped inside the pores of the MOF. Then, it was distributed in sterile tubes containing 9 mL of MEB and 1 mL of the inoculum suspension, and afterwards covered with a screw cap to ensure low oxygen tension conditions and incubated at 28 °C between 0 to 72 h. For each test with the different samples, controls without the addition of solid were carried out while the activity of UiO-66 was also evaluated. After the stipulated incubation times, the colony-forming units (CFU mL−1) were counted using the serial dilution method by taking 1 mL of the suspension from the incubated tubes and seeded in depth in MEA. Plates thus seeded were incubated at 28 °C for 5 days and finally counts of the colony forming units (CFU mL−1) were performed in triplicate.2.6. Physicochemical characterizations
Materials were analyzed by X-ray diffraction (XRD) with an Empyrean PANalytical equipment by scanning the 2θ angle between 5° and 50° (2° min−1; Cu Kα λ = 1.542 Å, 40 kV, 45 mA). The relative crystallinity of the MOF was calculated by the integrated peak areas of the diffraction peaks at 2θ = 7.4°, 10.4°, 12.7° and 18.06°, considering 100% crystallinity for the pristine MOF. The mean crystallite size (d) was calculated by the Scherrer equation: d = 0.9 λ/(Bcosθ), where B2 = B2sample − B2standard. The intrinsic broadening of the diffraction signals (Bstandard) was measured using a Si single crystal wafer. Infrared spectra (FTIR) of solids diluted in KBr were acquired with a Shimadzu Prestige-21 instrument equipped with a DTGS detector (400–4000 cm−1; 40 scans; 2 cm−1). The silver content in the solids was determined by X-ray fluorescence (XRF) with a Shimadzu EDX-720 spectrometer. Ultraviolet diffuse reflectance spectroscopy (UV-DRS) measurements were performed using a Varian Cary 5000 UV/VIS double-beam spectrometer equipped with a diffuse reflectance sphere accessory and a photomultiplier type detector (200–900 nm, 200 nm min−1). Thermogravimetric analysis (TGA) and single differential thermal analysis (SDTA) were carried out with a Hi-Res TGA Q500 equipment from TA Instruments (30 to 800 °C, 10 °C min−1, N2), detecting the eluted gases by coupled mass spectroscopy (MS) with a TA Discovery instrument. Adsorption–desorption isotherms of N2 at 77 K were acquired with a Micromeritics ASAP 2020 instrument after degassing the solids (4 h, 200 °C, dynamic vacuum). Then, the specific surface area (BET) and micropore volume (t-plot) were determined. Images were acquired with a Hitachi S-4700 cold cathode field emission scanning electron microscope (FE-SEM) (10 kV) and elemental microanalyses were performed with an EDS equipment coupled to the SEM (20 kV). A PhenomWorld ProX (15 kV) equipment was also used for EDS elemental analyses. The samples were dispersed onto a sample holder with a graphite adhesive tape for a more precise quantification. Images were also taken by high-resolution transmission electron microscopy (HR-TEM) with a JEOL 2100 Plus field emission microscope. Selected area electron diffraction (SAED) patterns were analyzed with Gatan Digital Micrograph software, obtaining the characteristic reflections and from these the interplanar distances of the phases. The sample surface was examined by X-ray photoelectron spectroscopy (XPS) with a Multitechnique Specs module with a hemispherical analyzer PHOIBOS 150. The spectra were obtained with Al Kα monochromatic radiation (300 W, pass energy 30 eV, analyzer in FAT mode). The samples were supported on the sample holder, subjected to vacuum (10−3 mbar) dehydration (393 K, 10 min) in the loading chamber and then evacuated 2 h in ultra-high vacuum (<2.10−9 mbar) prior to the readings. The peak of C 1s at 284.8 eV was taken as internal reference and the binding energies (BE) of O 1s, N 1s, Zr 3d and Ag 3d were analyzed. The data processing and peak deconvolution were performed using the Casa XPS software, adjusting the peaks by means of a Gaussian:Lorentzian waveform (70:30) after subtracting a Shirley-type baseline and determining the area by integration.
3. Results and discussion
3.1. Incorporation of silver in UiO-66
The structure of UiO-66 was successfully synthesized, obtaining a material with high crystallinity that exhibited all the indexed reflections for this MOF25,26 (Fig. S1†). Silver-doped solids were prepared with these crystals employing various molar ratios of silver nitrate/sodium citrate (R) as shown in Table 1. This table summarizes the qualities of the materials after the impregnation, obtained from their XRD patterns (Fig. S1†) as well as the mass of solids recovered and the pH of the impregnation solution. A preservation of the MOF structure was observed but with a certain loss of crystallinity depending on the R value, as well as the appearance of the main signals from the cubic Ag2O phase (JCPDS 76-1393) at 2θ 27.9° (110), 32.3° (111) and 46.2° (211), respectively. Silver oxide deposited on UiO-66 was produced during the impregnation process because the silver precursor in the medium slightly alkalinized by sodium citrate reacts with OH− species,29 which are then deposited at the MOF surface. Moreover, the hydroxyls of the zirconium nodes of the MOF intervene in this process which was evidenced by the XRD pattern of the sample obtained without citrate (Fig. S1†) and by the TGA as will be later shown. This mechanism of Ag2O generation is similar to that observed in solids containing OH− groups in their structure which in contact with a silver nitrate solution form Ag+OH− adducts and produce Ag2O at the surface.27| Sample | C (%) | d (nm) Ag2O | Massc (%) | pH |
|---|---|---|---|---|
| a Relative crystallinity considering the sum of the integrated areas of the main XRD signals: planes (111), (200) and (600) and taking 100% crystallinity for UiO-66 with neither silver nor citrate. b Crystallite size calculated with the Scherrer equation. The average of the values calculated with the main Ag2O signals (2θ = 27.9°, 32.3° and 46.2°) is reported. c Mass percentage of solid recovered after impregnation, with respect to the initial mass of MOF. | ||||
| Ag/U(2.5) | 88 | 41.2 | 95.5 | 7.15 |
| Ag/U(1.0) | 68 | 41.2 | 95.0 | 7.56 |
| Ag/U(0.75) | 58 | 35.0 | 83.2 | 7.75 |
| Ag/U(0.62) | 56 | 37.2 | 83.4 | 7.78 |
| Ag/U(0.5) | 47 | 36.2 | 62.2 | 7.86 |
| Ag/U | 84 | 55.2 | 95.3 | 5.10 |
The silver-impregnated UiO-66 obtained with citrate showed a smaller Ag2O crystallite size (Table 1), while as R decreased the pH of the impregnation solution progressively increased thus originating a decrease in the relative crystallinity of the MOF as well as in the mass of the recovered solid. This is because when the pH of the solution became higher than 7.7, a destabilization of the UiO-66 structure began.30,31 Notably, an optimal value of citrate was found (R = 0.75) for which the smallest Ag2O crystallite size was obtained with a high proportion of recovered solids (>83%) and MOF crystallinity. This is due to an optimal balance between the dispersant action on the Ag2O species without significantly altering the MOF structure.
The FTIR spectra of impregnated Ag/UiO-66 samples (Fig. 1) showed the typical vibrational modes of the UiO-66 skeleton with the stretching modes of carboxylates at 1578 and 1400 cm−1,25,26 indicating that the overall bond architecture of the MOF was preserved. In addition, stretching signals from free nitrate ions were noted at 1385 cm−1 as well as a shoulder at 1635 cm−1 due to the stretching of the carbonyl from the carboxylate groups of adsorbed citrate.32 To confirm this, a sample of UiO-66 impregnated with citrate, Cit/U, was analyzed and the said signal can be clearly distinguished (Fig. 1). In addition, the carbonyl stretching mode of free COOH terminal groups coming from partially disconnected linkers of the MOF (1705 cm−1) which are present in the synthesized UiO-66,17,21,33 decreased for the silver loaded samples and suggests a coordination between such groups and silver species.21
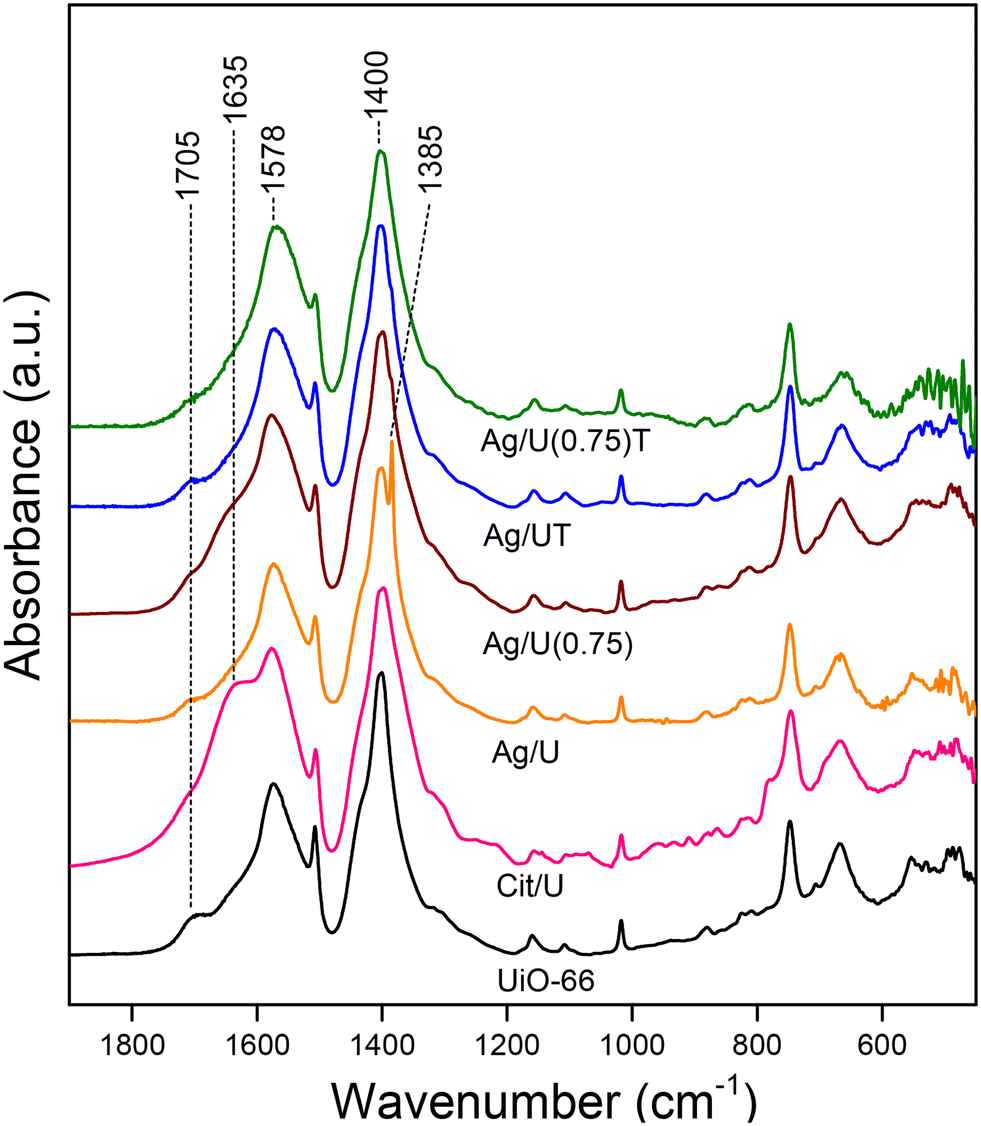 | ||
| Fig. 1 FTIR spectra of Ag/UiO-66 solids prepared with different silver precursor/dispersant ratios (R). Spectra of some samples after heat treatment (T) are included. | ||
The IR spectra showed that after silver impregnation, small amounts of nitrate and citrate remained at the UiO-66 structure which must be removed through a post-impregnation treatment. For simplicity, a thermal treatment in inert flow was analyzed through TGA-mass in order to find the optimal activation conditions, compromising the structural stability of the MOF as little as possible.
3.2. Thermal treatment of silver-loaded UiO-66
Fig. 2 shows the derivative of TGA curves (dTGA) obtained from the respective thermogravimetric analyses (Fig. S2†). UiO-66 showed a characteristic profile26 with a first step due to physisorbed water (ending at 100 °C) followed by another (ending at 225 °C) due to a dehydroxylation of the cluster (Fig. 2a), whereas the MOF collapse started at 410 °C. These evolutions were verified through mass spectrometry, and a release of H2, O2, OH, CO2 and benzene could be observed at those temperatures (Fig. S2†). Bulk silver nitrate (Fig. 2a) showed a single decomposition step (starting at 350 °C) whereas sodium citrate (Fig. 2a) showed a loss of water of crystallization (max. 170 °C) followed by the degradation of citrate (max. 300 °C) forming Na2CO3, after which (above 400 °C) it decomposed giving Na2O.34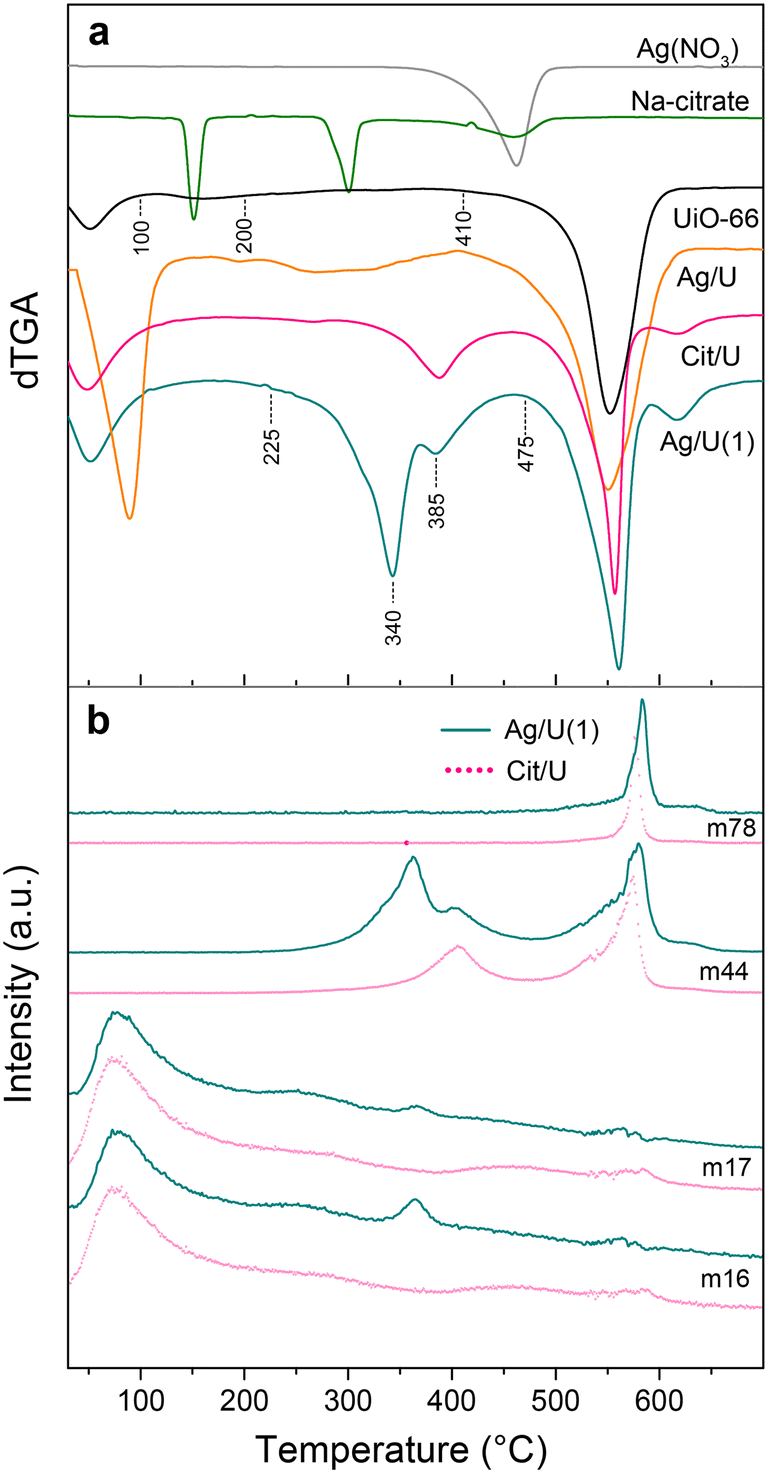 | ||
| Fig. 2 a) TGA derivative profiles (dTGA); b) TGA-MS for Ag/U(1) (solid line) and Cit/U (dotted line). Note: m16 (O2, H2O); m17 (OH, H2O); m44 (CO2); m78 (C6H6). | ||
In the Ag/U sample, after the cluster dihydroxylation, an evolution started at 225 °C due to the release of nitrate35 (Fig. 2a) and then, before the MOF collapse (∼400 °C), the Ag2O species formed during the impregnation decomposed into metallic silver,36 in agreement with an endothermic SDTA peak (Fig. S2†). On the other hand, the Cit/U sample (Fig. 2a) exhibited a broad signal which starts at 265 °C and ends at 430 °C due to the complete citrate degradation that formed carbonates, followed by their degradation giving Na2O. The latter was confirmed by a CO2 evolution in the said temperature range (Fig. 2b). Finally, in this sample, after the MOF collapse a reduction of Na2O to Na0 was observed (max. 620 °C). When comparing the decomposition temperature of bulk nitrate and citrate precursors with those species in the impregnated MOF, it can be observed that in these latter case were highly dispersed due to the lower decomposition temperatures. A similar effect has been observed for UiO-66 impregnated with other transition metal precursors.18
In the case of the Ag/U(1) sample, it exhibited a release of both nitrate and citrate from 225 °C (Fig. 2a) whereas Ag2CO3 was formed by the thermal decomposition of silver–citrate complex.37 The formation of silver carbonates was also confirmed by the signal at 340 °C and the corresponding CO2 and O2 evolutions (Fig. 2b) which are due to its decomposition to give Ag0.36 Subsequently, Na2O was formed by decomposition of the remaining Na2CO3 (max. 385 °C) with the respective evolution of CO2 (Fig. 2b). In addition, above 400 °C part of the Ag2O species formed during the impregnation decomposes into Ag0. It is important to highlight that in the TGA of this Ag/U(1) sample, the characteristic dehydroxylation and evolution of mass 16 and 17 (Fig. 2b) were not observed as in the case of UiO-66 (Fig. S2†). In line with the FTIR results, this suggests that part of the hydroxyls of the MOF nodes are involved in the formation of Ag2O during impregnation.
Based on the TGA results a thermal treatment of the impregnated samples was established at 275 °C in He flow and kept for 4 h, whereby all nitrate and citrate were removed while preserving the overall MOF structure.
3.3. Physicochemical characteristics of thermal-treated Ag/UiO-66
The heat treatment of silver-impregnated solids did not substantially modify the structure of UiO-66 (Fig. 1 and 3) while nitrate and citrate signals disappeared, confirming the effectiveness of the treatment (Fig. 1). The broad IR signals from the MOF structure of these solids in the 1400–1500 cm−1 region (Fig. S3†) did not allow distinguishing the bands of silver and sodium carbonates at 1373 cm−1 (ref. 38) and 1426 cm−1,39 respectively. The normalized FTIR spectra clearly showed how in Ag/UiO-66 solids the intensity of the signal of the free monocarboxylic group from the partially disconnected framework, decreased (Fig. S3†).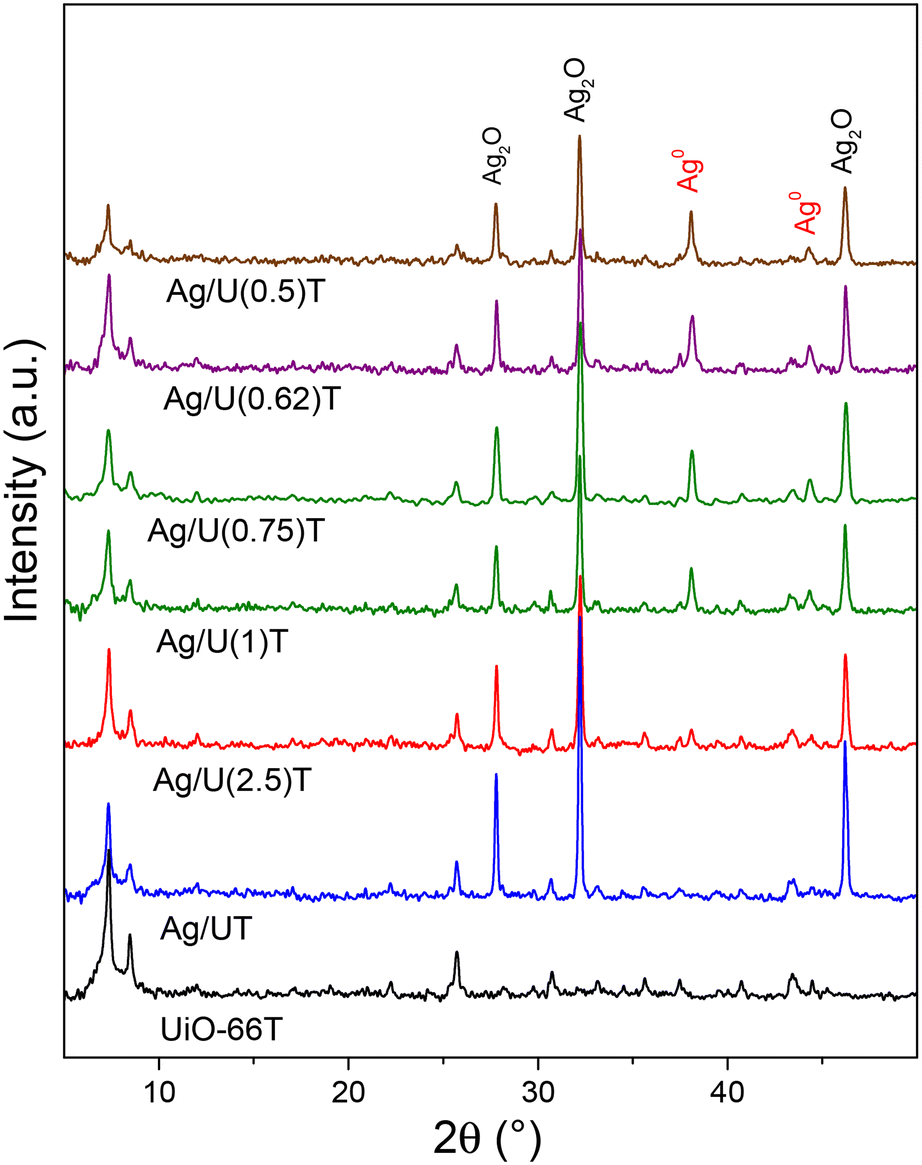 | ||
| Fig. 3 XRD patterns of thermally-treated Ag/UiO-66 solids. | ||
In the thermally-treated solids which were obtained with citrate, the main XRD peaks of Ag2O were observed added to signals from Ag0 (JCPDS 4-783) at 2θ 38.1° and 44.3°, respectively (Fig. 3). Moreover, the MOF crystallinity maintained the same trend as in the impregnated samples (Table 2) while the relative proportion of Ag2O decreased at the expense of an increase in Ag0 as R was reduced (i.e. the higher the initial citrate content the higher the metallic silver proportion). The crystallite size of Ag2O also kept the same trend as in the impregnated solids, with a smaller size when citrate was used and with an optimum for R = 0.75. It is important to remember that the appearance of metallic silver was due to the decomposition of the Ag2CO3 formed during the thermal treatment (by the total decomposition of the citrates), as verified by TGA. On the other hand, XRF analyses indicated that the amount of silver incorporated in the solids ranged from 8.2 to 10.8 wt% (Table 2), i.e. values very close to those theoretically impregnated. This implies that, despite having used a wet impregnation process with filtration and washing steps, all the silver load in the solution was fixed in the MOF which reflects the high interaction between these species and the UiO-66 structure.
| Sample | C (%) | d (nm) | Ag speciesc (%) | [Ag]d (wt%) | ||
|---|---|---|---|---|---|---|
| Ag2O | Ag0 | Ag2O | Ag0 | |||
| a Relative crystallinity considering the sum of the integrated areas of the main XRD signals: planes (111), (200) and (600) and taking 100% crystallinity for UiO-66 without silver or citrate. b Crystallite size calculated with the Scherrer equation. The average of the values calculated with the main Ag2O signals (27.9°, 32.3° and 46.2°) and Ag0 (38.1°) is reported. c Calculated with the integrated areas of the XRD signals of Ag2O (27.9°, 32.3°, 46.2°) and Ag0 (38.1°). d Average wt% of silver after several X-ray fluorescence (XRF) measurements on the same sample. | ||||||
| Ag/U(2.5)T | 67 | 42.1 | 22.8 | 92.2 | 7.8 | 8.2 |
| Ag/U(1.0)T | 72 | 38.9 | 27.3 | 83.6 | 16.4 | 9.0 |
| Ag/U(0.75)T | 55 | 36.0 | 24.7 | 81.9 | 18.1 | 10.8 |
| Ag/U(0.75)pH-T | 65 | 49.2 | — | 100 | 0 | — |
| Ag/U(0.75)T-mc | 63 | 33.6 | 25.7 | 75.3 | 24.7 | — |
| Ag/U(0.62)T | 69 | 40.6 | 25.0 | 75.5 | 24.5 | — |
| Ag/U(0.5)T | 48 | 35.7 | 37.8 | 76.2 | 23.8 | — |
| Ag/UT | 73 | 49.4 | — | 100 | 0 | 9.1 |
| Ag/UDMF | 63 | — | 30.5 | 0 | 100 | — |
Sodium citrate has been shown to be efficient in obtaining small Ag2O or Ag0 particles which some authors have attributed to electrostatic effects of the citrate anion that improves the dispersion of the said species in suspension.27 Other authors have claimed that the improvement is due to the change in pH of the medium which modifies the electrical charges of the silver species in suspension and facilitates their deposition on a surface.40 To analyze this point, UiO-66 was impregnated with a NaOH alkalinized silver nitrate solution to obtain the same pH (7.75) as the Ag/U(0.75) sample impregnation solution. After the thermal treatment, this Ag/U(0.75)pH-T solid did not exhibit a decrease in the Ag2O crystallite size (Fig. S3,†Table 2), or the appearance of Ag0. This confirms, on the one hand, that citrate has a chelate effect on the Ag2O particles in suspension causing their improved dispersion on the MOF surface, and on the other hand, that it contributes to the generation of Ag0 during the thermal treatment.
The UV-DRS spectrum of UiO-66 (Fig. 4) showed an intense peak centered at 240 nm due to a ligand to metal charge transfer (LMCT) processes from the Zr–O oxoclusters of UiO-6641,42 and a peak associated to the linker adsorption at 290 nm, in line with the one reported for this MOF.43–45 In the solids containing silver, modified UiO-66 spectra were observed in which the intensity of the signal at 290 nm decreased. This fact demonstrates an electronic modification of UiO-66 by silver species at the environment of Zr–O oxoclusters, because the 290 nm linker-based adsorption signal is strongly influenced by the nearby metal centers.46,47 Furthermore, for all the silver containing solids a signal at 260 nm, superimposed over the intense peak of the MOF, was clearly distinguished. Said signal is consistent with the presence of low dimensional silver oxide nanoparticles in these solids.48,49
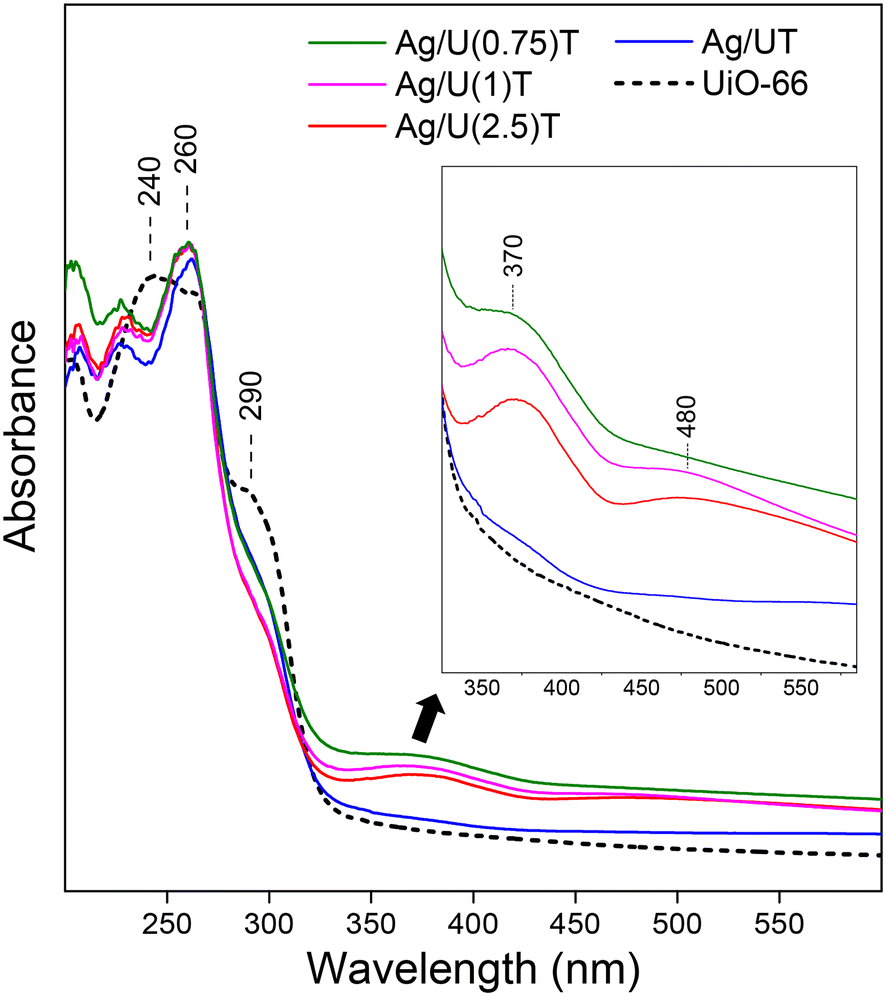 | ||
| Fig. 4 UV-DRS spectra of thermally-treated Ag/UiO-66 solids obtained with different proportions of silver/citrate. The dotted line shows the spectrum of UiO-66. | ||
In Ag/UiO-66 samples obtained using citrate, very weak signals at 370 nm and 480 nm were also distinguished as can be better seen in the close view of the inset in the Fig. 4. These absorptions can be attributed to a small fraction of silver carbonate species remaining in the solids50,51 in agreement with what was observed by TGA. It should be noted that previous XRD studies of these samples did not allow distinguishing Na2CO3 and Ag2CO3 phases given their low amount and high dispersion. However, as mentioned above, both TGA and UV-DRS were able to show the presence of these species which were also confirmed by HR-TEM studies, as discussed later.
3.4. Antifungal behavior of Ag/UiO-66
In the first instance, a test with UiO-66 crystals was carried out to evaluate if the MOF have antifungal activity. As it can be observed (Fig. 5a), after incubation for different periods there appeared a fungal growth equivalent to that obtained without the addition of MOF. This is shown quantitatively in the curves of Fig. 6 where it is shown that the CFU mL−1 increased from about 5log to 6log after 72 h accounting for the intrinsic inactivity of UiO-66. It is important to note that the UiO-66 structure was stable in the culture medium during the assay period, preserving its crystallinity (Table 2, Fig. S3†) and bond structure (Fig. S4†). As expected, new IR vibrational modes at 1675, 1560, 1075 cm−1 were observed due to organic compounds of MEB, mainly peptones, adsorbed on the MOF.
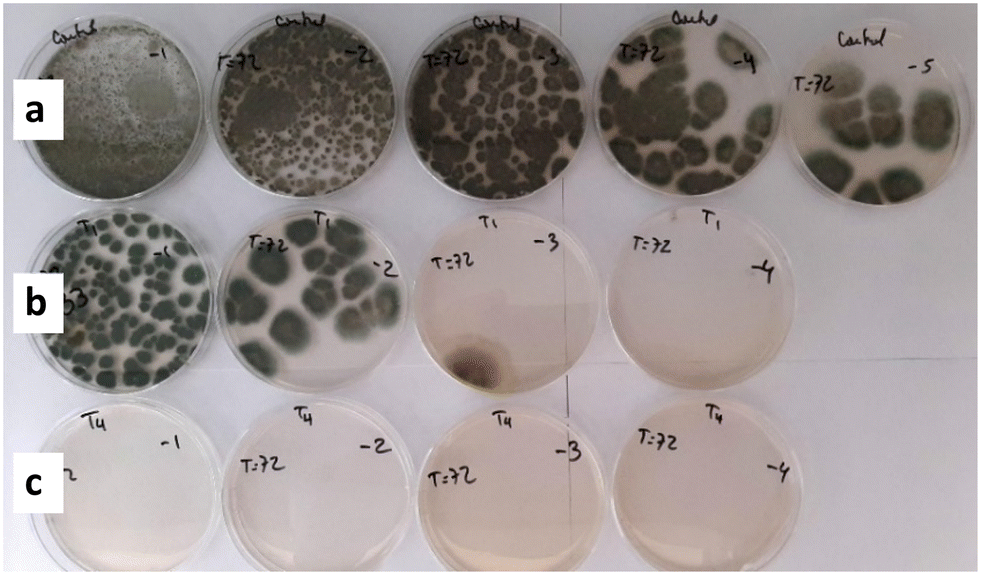 | ||
| Fig. 5 Picture of plates for colony counts using the serial dilution method, after P. roqueforti growth tests at 72 h incubation for: a) control, b) Ag/U(1)T sample, c) Ag/U(0.75)T sample. | ||
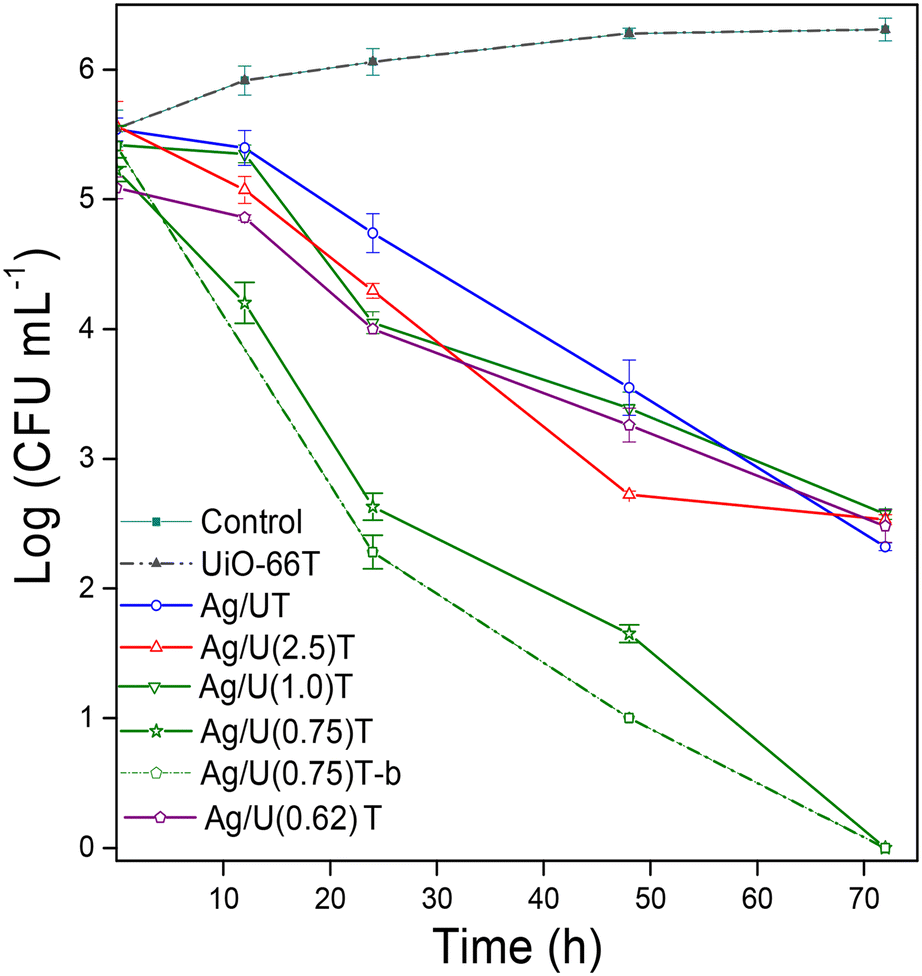 | ||
| Fig. 6 Colony growth curves (CFU mL−1) of P. roqueforti at different incubation times, using Ag/UiO-66 solids. | ||
Next, the antifungal evaluations were carried out with Ag/U(R)T samples (Fig. 6). The solid obtained without citrate, Ag/UT, exhibited a moderate antifungal activity with a reduction of the CFU mL−1 of 3.3log after 72 h. Meanwhile, the solids obtained with citrate having R values of 2.5 and 1 showed a slight improvement in the first 24 h but later their activity buffered and reached values similar to Ag/UT. By contrast, the Ag/U(0.75)T solid showed a remarkable performance in the inhibition of the fungal growth, as can be seen in the images of Fig. 5b. This solid allowed reducing the CFU mL−1 of the mold by a magnitude of 5log after 72 h of incubation (Fig. 6), which implies an excellent antifungal activity. To confirm this, as well as the reproducibility of the preparation method, a new batch was synthesized under identical conditions. The obtained solid, Ag/U(0.75)T-b, showed a similar behavior to the previous one (Fig. 6) which confirms both the reproducibility of the preparation method and the efficacy of this nanomaterial. It should be noted that in the field of food fungal control, a material is considered to have good antifungal action when it can reduce the colony growth by magnitude of 4log.52 This solid, after being incubated in the culture medium for 72 h, Ag/U(0.75)T-cm showed adsorbed compounds from the culture broth (Fig. S4†) but the MOF structure did not show destabilization or modification of the crystallinity. The Ag2O crystallite size was not altered either (Fig. S3†) and only a slight increase in the proportion of Ag0 was noted (Table 2), which may be due to a reducing action by the sugars present in this culture medium.14
The outstanding performance of the Ag/U(0.75)T sample is linked to its unique physicochemical characteristic with a high proportion of dispersed silver oxide species (Table 2). Its antifungal action is associated with a gradual and effective dosage of bioactive Ag+ ions towards the walls of the microorganism, thanks to the small particle size of the silver oxide in this solid. As the particle size decreases, the surface area to volume ratio increases and accelerated the release of Ag+ ions. This type of behavior has been observed in other materials containing Ag2O or Ag2CO3 species, as layered double hydroxides,27 polyethylene terephthalate40 or metal oxides as silica or titania.53 In addition, in previous publications of our group it has been verified that cationic silver species exert a strong effect of suppressing the growth of molds thanks to its direct dosage towards the walls of this type of microorganisms.10 To confirm this behavior, a solid with similar characteristics to Ag/U(0.75)T but containing only dispersed Ag0 species was synthesized. To do this, 10 wt% of Ag in UiO-66 was incorporated by incipient wetness impregnation with silver nitrate and then a reduction treatment was carried out in DMF (180 °C, 3 h).54 The said solid, Ag/UDMF, exhibited a MOF crystallinity comparable to that of the sample obtained with citrate (Fig. S3†) but with an exclusive contribution of Ag0 species which have a crystallite size of 30 nm (Table 2). Despite the similar structural qualities with Ag/U(0.75)T the microbiological assay of this solid showed the worst performance, decreasing the CFU mL−1 by less than 1log after 72 h (Fig. S5†). The lower capacity of Ag0 to inhibit the growth of P. roqueforti is due to the fact that these species are insoluble in water so fewer silver ions can be oxidatively released from the Ag0 NPs surface,55 requiring a previous stage of oxidation to be more efficient.56
3.5. Surface characteristics of Ag/UiO-66
In view of the outstanding antifungal performance of the Ag/U(0.75)T solid its surface was further analyzed by FE-SEM and HR-TEM. Elemental mapping by EDS (Fig. 7b) was performed on a large region of this sample as presented in the SEM image of Fig. 7a, showing a homogeneous spatial distribution of dispersed silver throughout the MOF crystals, as can be seen in the elemental mappings of silver and zirconium (Fig. 7b and c), respectively. EDS analyses in several regions of this sample (Fig. S6†), showed an average Zr/Ag atomic ratio of 10.8, consistent with the presence of a high proportion of silver in these solids in agreement with the XRF analyses (Table 2). In addition, the said elemental ratio was similar to that of the sample before the thermal treatment (Fig. S7†), confirming the immobilization of silver after the impregnation process. It should also be pointed out that the EDS analyses performed on the other Ag/UiO-66 solids, which were obtained with different proportions of citrate and thermally treated (Fig. S8†), showed similar Zr/Ag atomic ratios.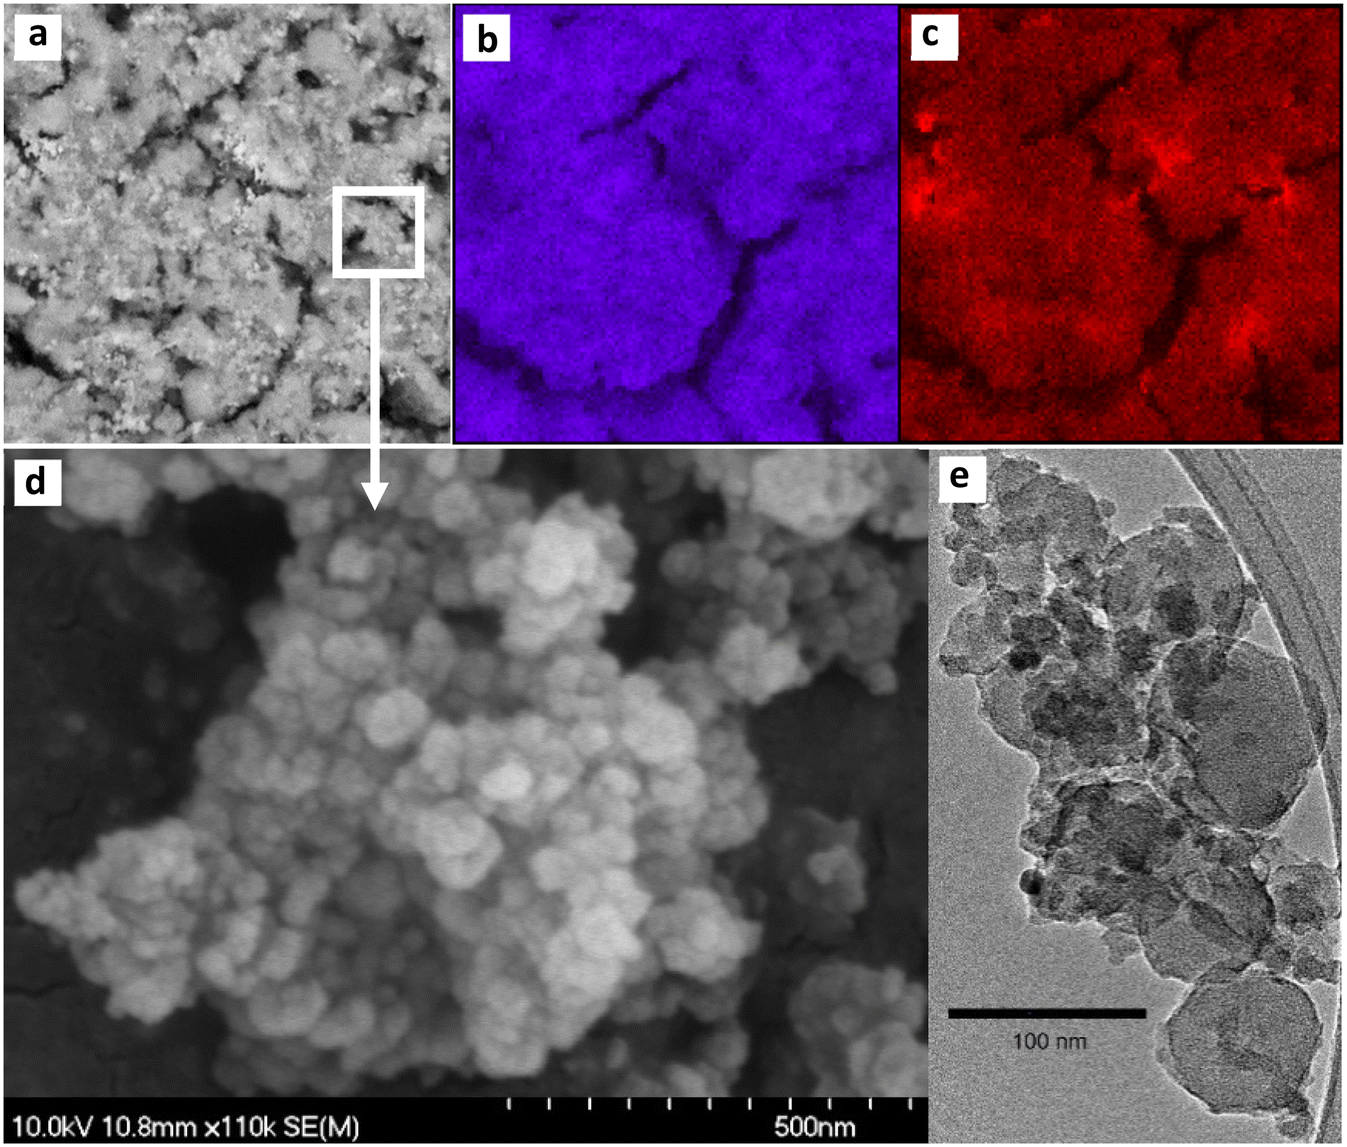 | ||
| Fig. 7 SEM micrographs of Ag/U(0.75)T sample: a) SEM image of a wide region of the solid; b) mapping of silver by EDS in the selected region; c) mapping of zirconium by EDS in the selected region; d) high magnification image by FE-SEM; e) TEM image. | ||
The FE-SEM image of the Ag/U(0.75)T sample (Fig. 7d) indicated that the material was made up of UiO-66 nanocrystals smaller than 100 nm in size forming globular aggregates. The TEM image (Fig. 7e) exposed the typical polyhedral morphology of such crystals, with a size of about 80 nm on which dispersed nanoclusters were deposited. The latter were further analyzed by HR-TEM (Fig. 8). Fig. 8a shows the image of a cluster deposited on UiO-66 and the regions where selected area electron diffraction (SAED) analyses were performed. Fig. 8b shows, for example, the determination of the interplanar distance obtained from the analysis of one region in which the (031) plane of the Ag2CO3 phase was determined (JCPDS 01-070-2184). Similarly, the analyses carried out in the other regions allowed us to conclude that some clusters are made up of nanocrystalline domains of Ag2CO3 and Na2CO3. The study of the SAED patterns in another sectors of the solid, such as the one presented in Fig. 8c, revealed the existence of clusters constituted by another mixture of nano-crystalline phases.
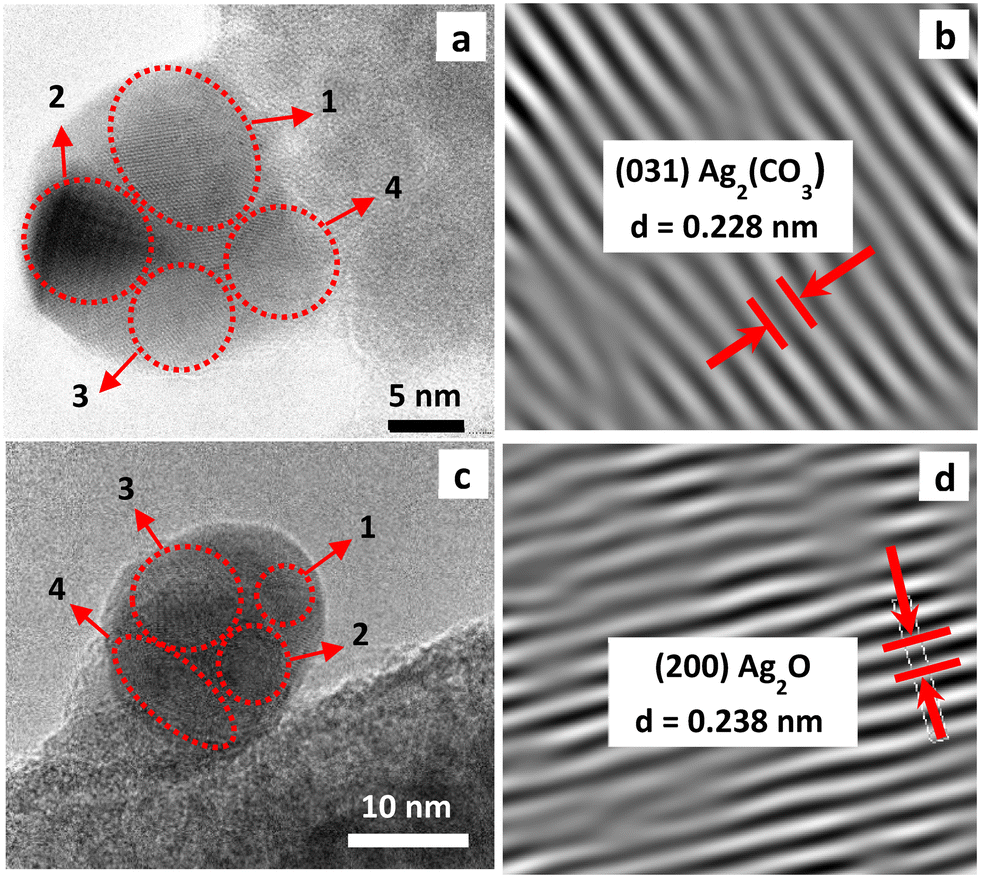 | ||
| Fig. 8 HR-TEM analysis of the Ag/U(0.75)T solid: a) cluster onto a UiO-66 crystal and the different sectors where the selected area electron diffraction (SAED) analyses were performed; b) reconstruction in the reciprocal space of the crystalline planes in the analysis of region 1, showing a Ag2CO3 phase; c) another cluster onto a UiO-66 crystal and the sectors where the SAED analyses were carried out; d) reconstruction in the reciprocal space of the crystalline planes in region 1 showing a Ag2O phase. | ||
The interplanar distances of the diffraction patterns such as the one presented for region 1 (Fig. 8d), showed the (200) planes of Ag2O. In other regions of these clusters, Ag2CO3 and Ag0 were also detected. In brief, from all the SAED analyses it is concluded that the clusters are made up of mixtures of nanocrystalline phases of Ag2O, Ag0, Ag2CO3 and Na2CO3 deposited on the surface of the UiO-66 crystals, which is consistent with previous results by TGA, XRD and UV-DRS.
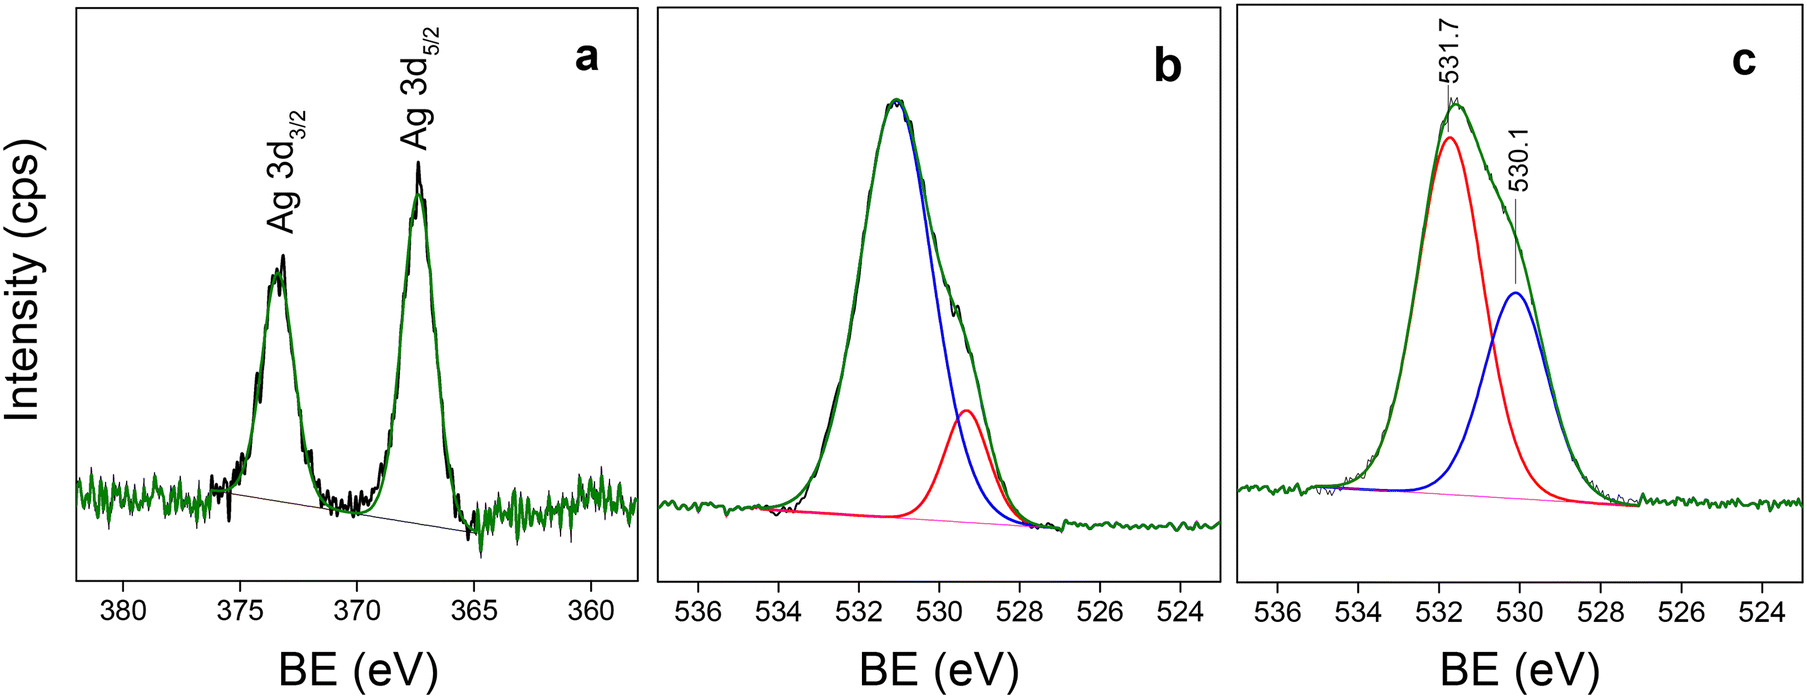
The outermost surface of the Ag/U(0.75)T sample was analyzed through monochromatic XPS. The spectrum in the Zr 3d region showed typical Zr4+ signals for this MOF17,47 with a Zr 3d5/2 component at a binding energy (BE) of 182.6 eV and a Zr 3d3/2 component at 185.0 eV which were practically not modified with respect to the original UiO-66 (Table 3). In addition, an Ag 3d signal (Fig. 9a) with an Ag 3d5/2 component at 367.4 eV typical of oxidized silver species,10,27 was observed. Further relevant information of the XPS analyses came from the spectrum in the O 1s region (Fig. 9b). The signal at 532 eV corresponds to oxygen from the COO− groups of the ligands in the MOF structure while the signal at 530 eV is from oxygen of oxide, present in the zirconium nodes. In the Ag/U(0.75)T sample the relative proportion of oxygen at 530 eV was almost twice that of the original structure (Table 3) and is consistent with surface Ag2O. It is noteworthy that CO32− was not observed, since the signals of C1s and O1s were not modified with respect to those of UiO-66. This suggests that on the surface of the nanoclusters deposited on the outside of the UiO-66 crystals, Ag2O species predominated.
| Element | UiO-66 | Ag/U(0.75)T |
|---|---|---|
| Zr 3d5/2 | 182.7 (1.6) | 182.6 (1.7) |
| Zr 3d3/2 | 185.1 (1.5) | 185.0 (1.6) |
| C 1s | 284.8 (1.7) | 284.8 (1.8) |
| C 1s | 288.7 (1.7) | 288.7 (1.8) |
| O 1s (532) | 531.9 (1.9) | 531.7 (1.9) |
| O 1s (530) | 530.2 (1.6) | 530.1 (1.9) |
| O532/O530 | 3.5 | 1.8 |
| Ag 3d5/2 | — | 367.4 (1.6) |
| Ag 3d3/2 | — | 373.4 (1.6) |
 | ||
| Fig. 9 XPS spectra: a) Ag 3d region in the Ag/U(0.75)T sample; b) O 1s region in UiO-66; c) O 1s region in the Ag/U(0.75)T sample. | ||
The quantification, considering the response factors of each element, showed a Zr/Ag atomic surface ratio close to 12 (Table 3) which is similar to that obtained by EDS for the bulk of the material. Considering that UiO-66 has pores of 3.7 and 11 nm and that TEM studies showed clusters with sizes between 5 and 40 nm, part of the silver could have remained inside the pores of the MOF leaving the rest as clusters at the outside of the crystals, as observed in Fig. 8. To further analyze this point, N2 adsorption–desorption isotherms of the thermally-treated MOF with and without silver were acquired (Fig. S9†). In the first case, an Ib-type profile was observed with an abrupt increase in the adsorption at low pressures and then a plateau with a slight slope, typical of this microporous MOF. The specific surface area (BET) was 357 m2 g−1 and the micropore volume was 0.113 cm3 g−1, being lower than those of the pristine MOF.26 However, the solid Ag(0.75)/UT exhibited an isotherm with similar characteristics to the previous one (Fig. S9†) and did not show substantial modifications in the specific surface area (BET of 330 m2 g−1) nor in the micropore volume (0.108 cm3 g−1). Taking into account the high silver loading in UiO-66 and that the porosity of this MOF was made up of 3D interconnected cages which were accessible to the nitrogen molecules, it follows that most of the silver remained on the outer surface of the MOF crystals, as observed in Fig. 7.
4. Conclusions
This study shows that through a simple impregnation method that uses sodium citrate as an additive and applies a thermal treatment with inert gas an Ag/UiO-66 nanomaterial with a powerful antifungal action is obtained. It is possible to incorporate in UiO-66 a high loading of silver species, from 8.2 to 10.8 wt%, with a high interaction with the MOF structure which is largely preserved. Moreover, there is an optimal silver nitrate/sodium citrate molar ratio of 0.75 for which the smallest Ag2O crystallite and the best antifungal performance is obtained. The silver species are as clusters made up of nanocrystalline phases mixtures of Ag2O, Ag0 and Ag2CO3 deposited on UiO-66 crystals, whereas Ag2O species predominated on the surface of such clusters. The unique physicochemical characteristics of Ag/UiO-66 caused its strong antifungal action, which is associated with an effective dosage of silver cations towards the microorganism walls. The material allows killing all the colonies of the mold P. roqueforti with a drop in the colony forming units (CFU mL−1) by a magnitude of 5log after 72 h of incubation. Moreover, after such incubation conditions the MOF structure did not show destabilization or modification of its crystallinity or in the Ag2O crystallite size. It is shown that Ag/UiO-66 is an effective biocide nanomaterial that can be applied as an antifungal for the control of contaminating molds common in the food industry.
Author contributions
Carolina Chiericatti: investigation, visualization, writing – review & editing. Luis Alejandro Lozano: formal analysis, investigation, visualization, methodology, writing – original draft, writing – review & editing. Juan Manuel Zamaro: conceptualization, methodology, funding acquisition, project administration, resources, visualization supervision, writing – original draft, writing – review & editing.Conflicts of interest
The authors declare that they have no conflict of interest.Acknowledgements
The authors wish to express their gratitude to Consejo Nacional de Investigaciones Científicas y Técnicas (CONICET). Thanks are given to Agencia Nacional de Promoción Científica y Tecnológica of Argentina (Project PICT 1880) and Universidad Nacional del Litoral (Project CAI+D 0168) for their financial support. Special thanks to ANPCyT for the purchase of the UHV Multi Analysis System (PME 8-2003), to M. F. Mori for the XPS analyses and to Prof. José L. Fernández for his kind contribution with the EDS analyses.References
- J. Pitt and A. Hocking, Fungi and Food Spoilage, Blackie Academic & Professional, London, 3rd edn, 2009, p. 519 Search PubMed.
- C. Fente-Sampayo, B. Vazquez-Belda, J. Rodríguez-Otero, C. Franco-Abuin, E. Quinto-Fernández and A. Cepeda-Saez, Micoflora predominante en las queserias de Arzúa (España), Cienc. Tecnol. Aliment., 2002, 3, 271–276 CrossRef.
- J. C. Frisvad, B. Andersen and R. A. Samson, Association of moulds to foods, Food Mycology, A multifaceted approach to fungi and food, Taylor and Francis, Boca Raton, 1st edn, 2007, pp. 199–239 Search PubMed.
- D. Dalie, A. Deschamps and F. Richard-Forget, Lactic acid bacteria–Potential for control of mould growth and mycotoxins: A review, Food Control, 2009, 21, 370–380 CrossRef.
- N. Arora, K. Thangavelu and G. N. Karanikolos, Bimetallic Nanoparticles for Antimicrobial Applications, Front. Chem., 2020, 8, 412 CrossRef CAS PubMed.
- T. Bruna, F. Maldonado-Bravo, P. Jara and N. Caro, Silver Nanoparticles and Their Antibacterial Applications, Int. J. Mol. Sci., 2021, 22, 7202–7223 CrossRef CAS PubMed.
- V. K. Sharma, R. A. Yngard and Y. Lin, Silver nanoparticles: green synthesis and their antimicrobial activities, Adv. Colloid Interface Sci., 2009, 145, 83–96 CrossRef CAS PubMed.
- M. Kawashita, S. Tsuneyama, F. Miyaji, T. Kokubo, H. Kozuka and K. Yamamoto, Antibacterial silver-containing silica glass prepared by sol-gel method, Biomaterials, 2000, 21, 393–398 CrossRef CAS PubMed.
- Q. Wang, H. Yu, L. Zhong, J. Liu, J. Sun and J. Shen, Incorporation of Silver Ions into Ultrathin Titanium Phosphate Films: In Situ Reduction to Prepare Silver Nanoparticles and Their Antibacterial Activity, Chem. Mater., 2006, 18, 1988–1994 CrossRef CAS.
- C. Chiericatti, J. C. Basílico, M. L. Zapata and J. M. Zamaro, Antifungal activity of silver ions exchanged in mordenite, Microporous Mesoporous Mater., 2014, 188, 118–125 CrossRef CAS.
- Q. Xu, P. Wang, Y. Zhang and C. Li, Durable Antibacterial and UV Protective Properties of Cotton Fabric Coated with Carboxymethyl Chitosan and Ag/TiO2 Composite Nanoparticles, Fibers Polym., 2022, 23, 386–395 CrossRef CAS.
- C. A. Chiericatti, L. A. Lozano and J. M. Zamaro, Composite Films Based on Silver-Zeolite/Polymer as Efficient Antifungals, ChemistrySelect, 2020, 5, 10391–10400 CrossRef CAS.
- C. Pettinari, R. Pettinari, C. Di Nicola, A. Tombesi, S. Scuri and F. Marchetti, Antimicrobial MOFs, Coordin, Chem. Rev., 2021, 446, 214121–214189 CAS.
- C. Chiericatti, J. C. Basílico, M. L. Zapata and J. M. Zamaro, Novel application of HKUST-1 metal–organic framework as antifungal: Biological tests and physicochemical characterizations, Microporous Mesoporous Mater., 2012, 162, 60–63 CrossRef CAS.
- C. Piscopo, A. Polyzoidis, M. Schwarzer and S. Loebbecke, Stability of UiO-66 under acidic treatment: Opportunities and limitations for post-synthetic modifications, Microporous Mesoporous Mater., 2015, 208, 30–35 CrossRef CAS.
- H. Chen, C. Qiu, Y. Jiang, X. Liao, D. Wu, M. Shen and T. Ding, Silver nanoparticles on UiO-66 (Zr) metal-organic frameworks for water disinfection application, Food Sci. Hum. Wellness, 2022, 11, 269–276 CrossRef CAS.
- L. A. Lozano, A. Devard, M. A. Ulla and J. M. Zamaro, Cu/UiO-66: a novel nanocatalyst obtained by a microwave-assisted protocol in DMF-free media for the efficient phenol removal via catalytic wet peroxide oxidation, J. Environ. Chem. Eng., 2020, 8, 104332–104342 CrossRef CAS.
- L. A. Lozano, B. M. C. Faroldi, M. A. Ulla and J. M. Zamaro, Metal–organic framework based sustainable nanocatalysts for CO oxidation, Nanomaterials, 2020, 10, 165–180 CrossRef CAS PubMed.
- C. Han, J. Yang and J. Gu, Immobilization of silver nanoparticles in Zr-based MOFs: induction of apoptosis in cancer cells, J. Nanopart. Res., 2018, 20, 77–87 CrossRef.
- R. S. Salama, E. M. El-Sayed, S. M. El-Bahy and F. S. Awad, Silver nanoparticles supported on UiO-66 (Zr): as an efficient and recyclable heterogeneous catalyst and efficient adsorbent for removal of Indigo Carmine, Colloids Surf., A, 2021, 626, 127089–127102 CrossRef CAS.
- B. Mortada, T. Abou Matar, A. Sakaya, H. Atallah, Z. Kara Ali, P. Karam and M. Hmadeh, Postmetalated Zirconium Metal Organic Frameworks as a Highly Potent Bactericide, Inorg. Chem., 2017, 56, 4739–4744 CrossRef PubMed.
- Y. H. Cheung, K. Ma, H. C. van Leeuwen, M. C. Wasson, X. Wang, K. B. Idrees, W. Gong, R. Cao, J. J. Mahle, T. Islamoglu, G. W. Peterson, M. C. de Koning, J. H. Xin and O. K. Farha, Immobilized regenerable active Chlorine within a Zirconium-Based MOF textile composite to eliminate biological and chemical threats, J. Am. Chem. Soc., 2021, 143, 16777–16785 CrossRef CAS PubMed.
- X. Unamuno, E. Imbuluzqueta, F. Salles, P. Horcajada and M. J. Blanco-Prieto, Biocompatible porous metal-organic framework nanoparticles based on Fe or Zr for gentamicin vectorization, Eur. J. Pharm. Biopharm., 2018, 132, 11–18 CrossRef CAS PubMed.
- Y. Luo, J. Li, X. Liu, L. Tan, Z. Cui, X. Feng, X. Yang, Y. Liang, Z. Li, S. Zhu, Y. Zheng, K. W. K. Yeung, C. Yang, X. Wang and S. Wu, Dual Metal-Organic Framework Heterointerface, ACS Cent. Sci., 2019, 5, 1591–1601 CrossRef CAS PubMed.
- J. H. Cavka, S. Jakobsen, U. Olsbye, N. Guillou, C. Lamberti, S. Bordiga and K. P. Lillerud, A new Zirconium inorganic building brick forming metal organic frameworks with exceptional stability, J. Am. Chem. Soc., 2008, 130, 13850–13851 CrossRef PubMed.
- L. A. Lozano, C. Iglesias, B. M. C. Faroldi, M. A. Ulla and J. M. Zamaro, Efficient solvothermal synthesis of highly porous UiO-66 nanocrystals in dimethylformamide free media, J. Mater. Sci., 2018, 53, 1862–1873 CrossRef CAS.
- D. G. Jeung, M. Lee, S. M. Paek and J. M. Oh, Controlled Growth of Silver Oxide Nanoparticles on the Surface of Citrate Anion Intercalated Layered Double Hydroxide, Nanomaterials, 2021, 11, 455 CrossRef CAS PubMed.
- K. Ranoszek-Soliwoda, E. Tomaszewska, E. Socha, P. Krzyczmonik, A. Ignaczak, P. Orlowski, M. Krzyzowska, G. Celichowski and J. Grobelny, The role of tannic acid and sodium citrate in the synthesis of silver nanoparticles, J. Nanopart. Res., 2017, 19, 273–287 CrossRef PubMed.
- O. A. Douglas-Gallardo, R. Moiraghi, M. A. Macchione, J. A. Godoy, M. A. Pérez, E. A. Coronado and V. A. Macagno, Silver oxide particles/silver nanoparticles interconversion: susceptibility of forward/backward reactions to the chemical environment at room temperature, RSC Adv., 2012, 2, 2923–2929 RSC.
- D. Bůžek, J. Demel and K. Lang, Zirconium Metal−Organic Framework UiO-66, Stability in an Aqueous Environment and Its Relevance for Organophosphate Degradation, Inorg. Chem., 2018, 57, 14290–14297 CrossRef PubMed.
- J. B. DeCoste, G. W. Peterson, H. Jasuja, T. G. Glover, Y. Huang and K. S. Walton, Stability and degradation mechanisms of metal–organic frameworks containing the Zr6O4(OH)4 secondary building unit, J. Mater. Chem. A, 2013, 1, 5642–5650 RSC.
- Z. Bai, L. Yang, J. Zhang, L. Li, C. Hu, J. Lv and Y. Guo, High-efficiency carbon-supported platinum catalysts stabilized with sodium citrate for methanol oxidation, J. Power Sources, 2010, 195, 2653–2658 CrossRef CAS.
- J. Y. Song, I. Ahmed, P. W. Seo and S. H. Jhung, UiO-66-type Metal-Organic Framework with Free Carboxylic Acid: Versatile Adsorbents via H-bond for Both Aqueous and Non-aqueous Phases, ACS Appl. Mater. Interfaces, 2016, 8, 27394–27402 CrossRef CAS PubMed.
- A. Marcilla, A. Gómez-Siurana, M. Beltrán, I. Martínez-Castellanos, I. Blasco and D. Berenguer, TGA/FTIR study of the pyrolysis of sodium citrate and its effect on the pyrolysis of tobacco and tobacco/SBA-15 mixtures under N2 and air atmospheres, J. Sci. Food Agric., 2018, 98, 5916–5931 CrossRef CAS PubMed.
- X. Zhang, H. He, H. Gao and Y. Yu, Experimental and theoretical studies of surface nitrate species on Ag/Al2O3 using DRIFTS and DFT, Spectrochim. Acta, Part A, 2008, 71, 1446–1451 CrossRef PubMed.
- G. D. Nagy, J. B. Vergette and J. P. Connoly, Differential Thermal Analysis Studies on Ag2CO3, Can. J. Chem., 1971, 49, 3986–3993 CrossRef CAS.
- S. Djokic, Synthesis and Antimicrobial Activity of Silver Citrate Complexes, Bioinorg. Chem. Appl., 2008, 2008, 7 Search PubMed.
- H. Zeng, Z. Yu, L. Shao, X. Li, M. Zhu, Y. Liu, X. Feng and X. Zhu, Ag2CO3@UiO-66-NH2 embedding graphene oxide sheets photocatalytic membrane for enhancing the removal performance of Cr(VI) and dyes based on filtration, Desalination, 2020, 491, 114558 CrossRef CAS.
- J. Zhu, Q. Li, Y. Che, X. Liu, C. Dong, X. Chen and C. Wang, Effect of Na2CO3 on the microstructure and macroscopic properties and mechanism Analysis of PVA/CMC composite film, Polymer, 2020, 12, 453–465 CAS.
- A. Rajabi, M. J. Ghazali, E. Mahmoudi, A. H. Baghdadi, A. W. Mohammad, N. M. Mustafah, H. Ohnmar and A. S. Naicker, Synthesis, characterization, and antibacterial activity of Ag2O-Loaded Polyethylene Terephthalate fabric via ultrasonic method, Nanomaterials, 2019, 9, 450–461 CrossRef CAS PubMed.
- L. Valenzano, B. Civalleri, S. Chavan, S. Bordiga, M. H. Nilsen, S. Jakobsen, K. P. Lillerud and C. Lamberti, Disclosing the Complex Structure of UiO-66 Metal Organic Framework: A Synergic Combination of Experiment and Theory, Chem. Mater., 2011, 23, 1700–1718 CrossRef CAS.
- A. De Vos, K. Hendrickx, P. Van Der Voort, V. Van Speybroeck and K. Lejaeghere, Missing Linkers: An Alternative Pathway to UiO-66 Electronic Structure Engineering, Chem. Mater., 2017, 29, 3006–3019 CrossRef CAS PubMed.
- K. Hendrickx, D. E. P. Vanpoucke, K. Leus, K. Lejaeghere, A. De Deyne, V. Van Speybroeck, P. Van Der Voort and K. Hemelsoet, Understanding Intrinsic Light Absorption Properties of UiO-66 Frameworks: A Combined Theoretical and Experimental Study, Inorg. Chem., 2015, 54, 10701–10710 CrossRef CAS PubMed.
- L. Shen, R. Liang, M. Luo, F. Jing and L. Wu, Electronic effects of ligand substitution on metal–organic framework photocatalysts: the case study of UiO-66, Phys. Chem. Chem. Phys., 2015, 17, 117–121 RSC.
- Y. Wang, S. Zhang, Y. F. Zhao, J. Bedia, J. J. Rodriguez and C. Belver, UiO-66-based metal organic frameworks for the photodegradation of acetaminophen under simulated solar irradiation, J. Environ. Chem. Eng., 2021, 9, 106087 CrossRef CAS.
- A. Wang, Y. Zhou, Z. Wang, M. Chen, L. Sun and X. Liu, Titanium incorporated with UiO-66(Zr)-type Metal–Organic Framework (MOF) for photocatalytic application, RSC Adv., 2016, 6, 3671–3679 RSC.
- L. A. Lozano, L. A. Salazar, B. M. C. Faroldi and J. M. Zamaro, Enhancement in the CO2 uptake of UiO-66 by a simple exposure to ultraviolet light, Mater. Today Commun., 2022, 31, 103540–103546 CrossRef CAS.
- U. Chakraborty, G. Bhanjana, G. Kaur, A. Kaushik and G. R. Chaudhary, Electro-active silver oxide nanocubes for label free direct sensing of bisphenol A to assure water quality, Mater. Today Chem., 2020, 16, 100267 CrossRef CAS.
- C. Ashokraja, M. Sakar and S. Balakumar, A Perspective on the Hemolytic Activity of Chemical and Green-Synthesized Silver and Silver Oxide Nanoparticles, Mater. Res. Express, 2017, 4, 105406 CrossRef.
- Z. Sha, H. S. O. Chan and J. Wu, Ag2CO3/UiO-66(Zr) composite with enhanced visible-light promoted photocatalytic activity for dye degradation, J. Hazard. Mater., 2015, 299, 132–140 CrossRef CAS PubMed.
- H. Zeng, Z. Yua, L. Sha, X. Li, M. Zhu, Y. Liu, X. Feng and X. Zhu, Ag2CO3@UiO-66-NH2 embedding graphene oxide sheets photocatalytic membrane for enhancing the removal performance of Cr(VI) and dyes based on filtration, Desalination, 2020, 491, 114558 CrossRef CAS.
- G. Sapers, Efficacy of Washing and Sanitizing Methods for Disinfection of Fresh Fruit and Vegetable Products, Food Technol. Biotechnol., 2001, 39(4), 305–311 Search PubMed.
- M. A. Isaacs, B. Barbero, L. J. Durndell, A. C. Hilton, L. Olivi, C. M. A. Parlett, K. Wilson and A. F. Lee, Tunable Silver-functionalized porous frameworks for antibacterial applications, Antibiotics, 2018, 7, 55–67 CrossRef CAS PubMed.
- I. Pastoriza-Santos and L. M. Liz-Marzán, Formation and stabilization of Silver nanoparticles through reduction by N,N-Dimethylformamide, Langmuir, 1999, 15, 948–951 CrossRef CAS.
- S. Sohrabnezhad, A. Pourahmad, M. J. Mehdipour Moghaddam and A. Sadeghi, Study of antibacterial activity of Ag and Ag2CO3 nanoparticles stabilized over montmorillonite, Spectrochim. Acta, Part A, 2015, 136, 1728–1733 CrossRef CAS PubMed.
- D. Lončarević, I. Vukoje, J. Dostanić, A. Bjelajac, V. Đorđević, S. Dimitrijević and J. M. Nedeljković, Antimicrobial and photocatalytic abilities of Ag2CO3 Nano-rods, ChemistrySelect, 2017, 2, 2931–2938 CrossRef.
Footnote |
| † Electronic supplementary information (ESI) available: Complementary results of characterization related to this article by XRD, TGA-MS, FTIR, EDS, N2 isotherms and antifungal assay are provided. See DOI: https://doi.org/10.1039/d2me00233g |
| This journal is © The Royal Society of Chemistry 2023 |