DOI:
10.1039/D2TC02011D
(Paper)
J. Mater. Chem. C, 2022,
10, 10396-10403
Dual-emission luminescence thermometry using LaGaO3:Cr3+, Nd3+ phosphors
Received
16th May 2022
, Accepted 22nd June 2022
First published on 23rd June 2022
Abstract
A series of La1−xGa0.99O3:Cr0.01, Ndx phosphors (where x = 0.005, 0.01, 0.02) for luminescence thermometry was synthesised by the solid-state method, structurally characterised using powder X-ray diffraction data, and investigated by ambient and variable-temperature optical measurements. The design principle relies on the use of a combination of transition metal and rare earth activator ions such that the excitation and emission wavelengths fall within the near infra-red spectral region, notably in the ‘first biological window’ that is attractive for potential in vivo applications. The photoluminescence spectra of the compounds feature the characteristic 2E phosphorescence of Cr3+ at 729 nm and the 4F3/2 → 4I9/2 emission of Nd3+ around 890 nm. The Nd3+ emission is quenched at a higher rate than that of Cr3+ with increasing temperature. Thermometric analysis by monitoring the luminescence intensity ratio (LIR) between the emissions of Cr3+ and Nd3+ from 300 K to 650 K shows a quasi-Boltzmann trend, with a maximum relative sensitivity of ∼2% K−1, high absolute sensitivity values over this entire temperature range, excellent temperature resolution of 0.04 K at room temperature, and high stability.
1. Introduction
The development of novel ways to accurately monitor small temperature changes is important in numerous applications, including in biomedical systems. Luminescence thermometry is a non-contact method for monitoring temperature changes through their effect on the light-emitting properties of a material, for example, on the intensity of the emission, its decay time, or the profile of the spectrum.1–3 The use of a luminescence intensity ratio (LIR) method is particularly attractive. Here, the ratio of emission at two distinct wavelengths is monitored, rendering the system self-referencing and less dependent on fluctuations in the efficiency of delivery and collection of light.4 This approach can allow temperature measurements to be recorded with high accuracy and sensitivity. Most commonly, LIR is observed in systems that can emit from two thermally coupled excited states, according to the following equation:5,6| |  | (1) |
where IH and IL are the intensities of the higher- and lower-energy excited states, B is a pre-exponential factor, ΔE is the energy difference between the thermally coupled states, kB = 0.695 cm−1 K−1 is the Boltzmann constant, and T is the temperature in K. The phosphorescence of one or more activator metal ions doped into a suitable host material offers a potential for luminescence thermometry using such a strategy. Selection of the host material for a solid-state phosphor is critical in providing both stability and control over many of the luminescence properties of the activators.7 Perovskite-type lanthanum gallate (LaGaO3) has been studied for potential applications in fuel cells, solar cells, and light-emitting displays, amongst others.8–10 Several LaGaO3-based materials have been reported as hosts for LIR luminescence thermometers that exploit either single or dual emissions from activator ions. For example, LaGaO3:Cr3+ was shown by Mondal et al. to have a relative sensitivity of 2.07% K−1 at 150 K.11 Back et al. demonstrated that LaGaO3:Nd3+ – which has a distinct temperature marker at 417 K corresponding to the structural phase transition from orthorhombic to rhombohedral – showed a relative sensitivity of 1.59% K−1 at 300 K.12 Meanwhile, materials of composition LaGaO3:Vn+, Nd3+ were reported by Kniec et al. to offer relative sensitivities of 1.0% K−1 at 268 and 363 K, 0.49% K−1 at 253 K, and 1.44% K−1 at 348 K for the V5+, V4+, and V3+ doped samples respectively.13 Most recently, Li et al. reported Sm3+, Mn4+-doped LGO phosphors with a maximum relative sensitivity of 2.09% K−1 at 456 K.14 Our own recent work has shown that deconvolution of the overlapped temperature-invariant, sharp 2E emission from the temperature-dependent, broadband 4T2 emission of Cr3+ in LaGaO3 gives a relative sensitivity of ∼2.50% K−1 at 300 K and a temperature resolution that is as good as 0.05 K.15
Lanthanide ions (Ln3+) are in some respects well-suited to luminescence thermometry, owing to their narrow-band emission.16–21 However, the requirement for thermally coupled excited states restricts the choice of Ln3+ dopant.4 Moreover, Ln3+ ions suffer from low absorption coefficients such that the population of their excited states by light absorption is inefficient. Transition metal ions typically have broader absorptions and, usually, higher extinction coefficients, reflecting the greater extent to which the Laporte selection rule is relaxed for d–d as opposed to f–f transitions. LIR thermometers based on Cr3+, Mn4+, and Ni2+ have been investigated, both as single and dual-doped systems.11,22–25 The Boltzmann equilibrium between the closely separated 2E and 4T2 excited states of d3 ions such as Cr3+ underpins them.26–29
The aim of the present study was to combine the complementary advantages of lanthanide and transition metal ions in the design of a luminescent thermometer that would function in the near-infrared (NIR) region. The neodymium(III) ion was selected for investigation with Cr3+, as Nd3+ not only emits in the NIR but also has a number of excited states of energies that overlap with the emission of Cr3+, allowing for Cr3+-to-Nd3+ energy transfer.10 The narrow-band nature of the 2E emission of Cr3+, as well as that of the lanthanide ion, and their separation of >200 nm ensures good discrimination for luminescence thermometry readout. The characteristic Nd3+ line emissions fall into the part of the NIR region known as the ‘first biological window’ (biological tissue being relatively transparent to this part of the spectrum), allowing for potential applications in biomedical imaging, including in vivo temperature sensing.30 Marciniak et al. have reported phosphors utilising the Cr3+, Nd3+ combination; for example, the material LiLaP4O12:Cr3+0.01, Nd3+0.10 shows thermometric properties in the physiological temperature range with a relative sensitivity of 4.89% K−1 at 323 K.31,32 Here, we report the solid-state synthesis, structural characterisation, and photoluminescence (PL) properties of a series of Cr3+ and Nd3+-doped LGO phosphors. Variable-temperature photoluminescence measurements were performed to investigate excitation, emission, and energy transfer of the system. Extensive thermometric analysis – including sensitivities, temperature resolution and repeatability – was undertaken to characterise the luminescent thermometry performance.
2. Experimental methods
2.1 Synthesis
All samples were synthesised by conventional solid-state reaction methods from stoichiometric quantities of reactants to prepare 2 g of product.12 La2O3 powder (Aldrich, ≥ 99.99%) was pre-heated to 900 °C for 10 h to remove moisture. The pre-dried La2O3, Ga2O3 (Aldrich, ≥99.99%), Cr2O3 (Aldrich, 99.9%), and Nd2O3 (Aldrich, 99.9%) powders were ground for approximately 30 min with an agate mortar and pestle, pressed into 10 mm pellets, and placed into alumina crucibles with lids. Samples were sintered in a muffle furnace at 1200 °C in air for 60–100 h with intermittent grinding.
2.2 Powder X-ray diffraction (PXRD)
PXRD was used to monitor the progress of the reactions and to determine the purity of the products. All measurements were carried out at room temperature using a Bruker AXS d8 Advance diffractometer utilising CuKα radiation and a Lynx-Eye detector. Patterns were recorded in a range of 10° < 2θ < 90° with a step size of 0.02° and step time of 0.5 s. All patterns were analysed by Rietveld fitting in TOPAS academic software.33,34 Refined parameters included background polynomial terms, zero-point, pseudo-Voigt peak shape function terms, unit cell parameters, and an overall isotropic atomic displacement parameter.
2.3 Photoluminescence spectroscopy
The PL properties of La1−xGa0.99O3:Cr0.01, Ndx (x = 0.005, 0.01, 0.02) were studied using a Horiba Jobin-Yvon Fluorolog-3 spectrometer. The excitation source was a 450W xenon lamp. The emitted light was detected using either a red-sensitive photomultiplier tube (Hamamatsu R928) or a CCD detector (Horiba Synapse back-illuminated deep depletion) offering good sensitivity up to 1000 nm. NIR emission at λ > 1000 nm was monitored using a Hamamatsu NIR photomultiplier tube. Samples were analysed either in 3 mm o.d. quartz capillary tubes within the instrument's sample compartment, or externally using a Quanta-phi integrating sphere coupled to the instrument with optical fibres. Long-pass 400 nm and 850 nm filters were utilised to remove harmonic peaks in RT excitation and emission spectra. Lifetime data were acquired using an Edinburgh Instruments OB920 following excitation of the samples in 3 mm o.d. quartz capillaries with a microsecond-pulsed flashlamp. Emitted light was detected at right angles using an R928 detector operating in multichannel scaling mode. The variation in PL intensity with temperature over the range 300–650 K was investigated for all Cr3+, Nd3+ doped compounds using an Ocean Insight FX spectrometer with bifurcated fibre-optics and a custom-built thermometry apparatus.35 Samples were excited at 473 nm using a 150 mW high-stability laser.
3. Results and discussion
3.1 Structural characterisation
All PXRD patterns were fitted using orthorhombic LaGaO3 as the initial structural model.36Fig. 1 shows the final Rietveld fits obtained and Table 1 summarises main crystallographic parameters.
 |
| | Fig. 1 Rietveld fits of the XRD data collected on La1−xGa0.99O3:Cr0.01, Ndx – (a) x = 0.005, (b) x = 0.01, and (c) x = 0.02 samples. In each case the red curve represents the calculated pattern; the green, purple, and blue represents the observed data, whilst the difference curve is depicted in grey. | |
Table 1 Refined unit cell parameters for the La1−xGa0.99O3:Cr0.01, Ndx (x = 0.005, 0.01, 0.02) series
| Sample |
R
wp (%) |
a (Å) |
b (Å) |
c (Å) |
Cell volume (Å3) |
| La0.995Nd0.005Ga0.99Cr0.01O3 |
5.52 |
5.4924(1) |
7.7747(1) |
5.5241(1) |
235.895(8) |
| La0.99Nd0.01Ga0.99Cr0.01O3 |
5.35 |
5.49259(9) |
7.7745(1) |
5.52399(9) |
235.890(7) |
| La0.98Nd0.02Ga0.99Cr0.01O3 |
5.75 |
5.4923(1) |
7.7745(1) |
5.5227(1) |
235.828(8) |
Fig. 2 shows the perovskite-type structure of LaGaO3, made up of a network of corner-sharing GaO6 octahedra with interspersed La3+ ions. Having a Goldschmidt tolerance factor t = 0.973, LaGaO3 is orthorhombic, crystallising in space group Pnma (no. 62). The departure from the cubic symmetry is due to the tilting of the GaO6 octahedra – in Glazer notation, from a0a0a0 to a+b−b−/a+a−a− - resulting in the change of the La3+ environment and a lowering of the La3+ coordination number (CN) from 12 to 8.37 In space group Pnma, La3+ and Ga3+ are located on Wyckoff sites 4c and 4a, with site symmetry m and ![[1 with combining macron]](https://www.rsc.org/images/entities/char_0031_0304.gif) , respectively. Given the ionic radii of the species involved, it can be expected that Nd3+ (1.109 Å, CN = 8) will readily substitute for La3+ (1.160 Å, CN = 8), and that Cr3+ (0.615 Å, CN = 6) will substitute for Ga3+ (0.620 Å, CN = 6).38
, respectively. Given the ionic radii of the species involved, it can be expected that Nd3+ (1.109 Å, CN = 8) will readily substitute for La3+ (1.160 Å, CN = 8), and that Cr3+ (0.615 Å, CN = 6) will substitute for Ga3+ (0.620 Å, CN = 6).38
 |
| | Fig. 2 Unit cell of LaGaO3:Cr0.01, Nd0.02 viewed down the crystallographic c-axis. La3+ is shown in purple, Ga3+ in green, and O2− in red. | |
3.2 Room temperature photoluminescence analysis
The emission spectra of all three samples upon the excitation at 590 nm (i.e., in the region of the spin-allowed 4A2g → 4T2g absorption of Cr3+) show two well-defined sets of bands: one set in the 700–750 nm region attributable to the 2E emission of Cr3+ and the other in the 860–930 nm range due to the 4F3/2 → 4I9/2 transitions of the Nd3+ ion (Fig. 3c). The absence of broadband fluorescence corresponding to the strongly field-dependent, spin-allowed 4T2g to 4A2g transition of Cr3+ indicates that the Cr3+ ions in the CrO6 octahedra experience a strong-field local environment, such that the 4T2g state lies at significantly higher energy than the 2E. The peak at 739 nm for all three samples is indicative of an exchange-coupled Cr3+–Cr3+ pair N-line.39,40 The contribution of the N-line to the spectrum should be concentration-dependent but, as all three samples contain 1.0% Cr3+, the N-line peaks are of approximately equal relative intensity in this instance. Stokes and anti-Stokes sidebands are seen for each sample on either side of the 2E R-line emission.41
 |
| | Fig. 3 Normalised spectra of La1−xGaO3:Cr0.01, Ndx (a) excitation spectra of Cr3+ monitored at λem = 729 nm, normalised at 622 nm; (b) excitation spectra of Nd3+ monitored at λem = 1071 nm, normalised at 622 nm; (c) normalised emission spectra of the three members of the LaGaO3:Cr, Nd series normalised at 729 nm, λex = 590 nm; (d) emission spectra in the NIR region >1000 nm, λex = 590 nm. | |
The distinct line-like emission of the Nd3+ 4F3/2 → 4I9/2 transition centred at about 890 nm increases with increasing Nd3+ concentration relative to the Cr3+ 2E emission (Fig. 3c). As the Nd3+ concentration increases, there is also evidence of an increasing contribution from the 4F5/2 → 4I9/2 transition at around 800 nm (Fig. 3c). The 4F5/2 excited state is thermally coupled to the 4F3/2 at room temperature due to the small difference in energy between them.42Fig. 3d gives the NIR emission spectrum of the samples, showing the 4F3/2 to 4I11/2 emission centred at 1070 nm, and 4F3/2 to 4I11/2 emission centred at 1360 nm. The observed Nd3+ emissions could arise, at least in part, from direct excitation of the 4I9/2 → 4G5/2 transition at the excitation wavelength used, although the 4F5/2 state could also be populated indirectly by energy transfer from Cr3+, given the overlap of the Cr3+ 2E emission with excitations of Nd3+ to the 4F7/2, 4S3/2, and 4F9/2 states.
Excitation spectra can help to determine whether or not such energy transfer is significant. The excitation spectra of the samples monitored for the Cr3+ 2E emission at 729 nm and for the 4F3/2 → 4I9/2 of Nd3+ at 905 nm are shown in Fig. 3a and b, respectively. The Cr3+ excitation spectrum shows two broad bands at 624 and 444 nm attributed to the Cr3+ 4A2g → 4T2g and 4A2g → 4T1g transitions, respectively. There is also some evidence of sharper line-like excitations at 665, 584, 537, 444, and 354 nm, superimposed on the broad Cr3+ bands, most evident for the x = 0.02 sample with the highest Nd3+ concentration. The wavelengths of these peaks correspond well to the energies of the 4F9/2; 4G5/2 and 2G7/2; 4G7/2, 4G9/2 and 2K13/2; 2D5/2 and 2P1/2; and 4D3/2 and 4D5/2 excited states of Nd3+. Their appearance in the excitation spectrum of the Cr3+ ions suggests that some Nd3+ → Cr3+ energy transfer is occurring. The Nd3+ excitation spectrum, Fig. 3b, shows sharp peaks for excitation to the 4F3/2 at 880 nm; 2H9/2 and 4F5/2 at 810 nm; 4F7/2 and 4S3/2 at 740 nm; 4F9/2 at 680 nm; 4G5/2 and 2G7/2 at 590 nm; 4G7/2, 2G9/2, and 2K13/2 at 520 nm; 2D5/2, and 2P1/2 at 440 nm; and 4D3/2, and 4D5/2 states at 350 nm.42 Notably, the excitation spectrum of the Nd3+ emission does also prominently feature the broad bands associated with Cr3+, suggesting that some Cr3+ → Nd3+ energy transfer is occurring for these materials at room temperature. Energy transfer between activator ions is illustrated schematically in Fig. 4 showing the relative energies of pertinent states on Cr3+ and Nd3+. The decline in the relative intensity of the Nd3+ relative to the Cr3+ excitations with increasing Nd3+ content may be indicative of a degree of quenching between Nd3+ ions.
 |
| | Fig. 4 Energy level diagram showing energy transfer between Cr3+ and Nd3+ ions, with filled straight lines showing emission/excitation, and dashed lines denoting energy transfer from Cr3+ to Nd3+ in red, and Nd3+ to Cr3+ in black, respectively. | |
The lifetimes of the Cr3+ emission at 729 nm were measured for LaGa0.99O3:Cr0.01 and the Nd3+-doped samples at room temperature, Fig. 5. The data fitted well to a bi-exponential decay with a y offset for dark-count, giving an average lifetime of 4.2 ms for the –Cr3+-only sample, compared to values of 3.6, 3.0, and 2.5 ms for the x = 0.005, 0.01 and 0.02 samples. The trend of decreasing lifetime of the Cr3+ 2E state with increasing Nd3+ doping supports the conclusion above that Cr3+ → Nd3+ energy transfer is occurring. The energy transfer efficiency, ηET, was calculated to be 14%, 28%, and 40% respectively using eqn (2), where τCr is the lifetime of the chromium-only sample and τCr–Nd that of the dual-doped sample.43
| |  | (2) |
 |
| | Fig. 5 Lifetime data (circles) and bi-exponential fits (lines) of LaGaO3:Cr0.01 (x = 0.00) and of La1−xGa0.99O3:Cr0.01, Ndx (x = 0.005, 0.01, and 0.02). | |
3.3 Luminescence thermometry
Temperature-dependent spectra of La1−xGa0.99O3: Cr0.01, Ndx phosphors (where x = 0.005, 0.01, 0.02) are presented in Fig. 6a–c. As sample La0.98Ga0.99O3:Cr0.01, Nd0.02 showed comparable intensities from the Cr3+ and Nd3+ ions, it was selected for thermometric evaluation. The 808 nm emission band of Nd3+ overlaps with the tail of the broad emission from the 4T2 level of Cr3+ and was therefore excluded from the analysis. The pure Cr3+ and Nd3+ emissions are considered at λ < 790 nm (N-lines, 2E) and λ > 850 nm, respectively. The Cr3+ emission experiences simultaneous increase of emissions from the 4T2 level and decrease of intensity of emissions from 2E level and N-lines with increasing temperature, such that the overall Cr3+ emission intensity is quenched more slowly than the 4F3/2 → 4I9/2 emission of Nd3+. The intensities were fitted to eqn (1), where IH = I(Cr3+), and IL = I(Nd3+), and the resultant LIR is presented in Fig. 6d. The energy gap used in eqn (1) does not represent the gap between the thermalised levels, but instead the two emission centres – the Cr3+ and Nd3+ activator ions. The quasi-Boltzmann relation to which the experimental data are fitted is given by:| |  | (3) |
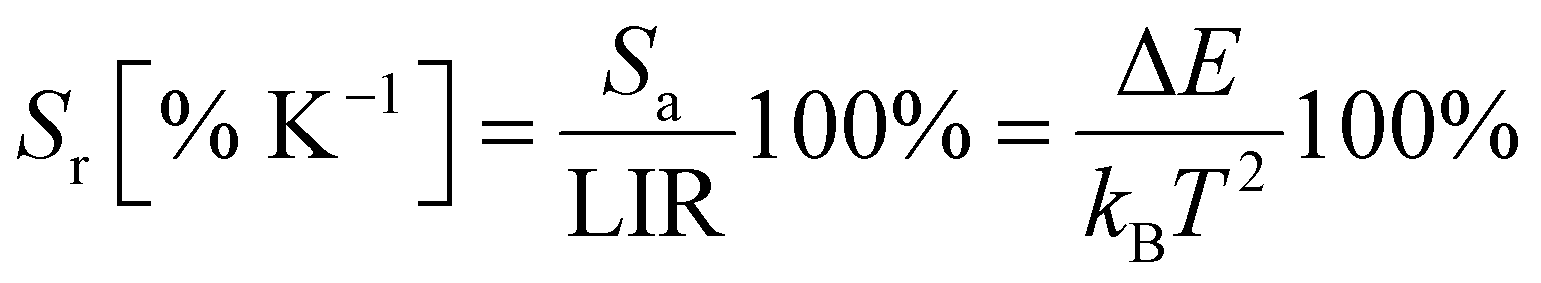
with a high quality of fit of adj. R2 = 0.997. The fitted energy gap is larger than that between the thermalised levels of all the lanthanides but Eu3+, meaning that the relative sensitivity will have a relatively high value. The high value of the temperature-invariant parameter B in eqn (1) is an indication of the high absolute sensitivity of this probe. The absolute and relative sensitivities respectively (Fig. 5e) were obtained by:| |  | (4) |
| | 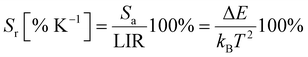 | (5) |
 |
| | Fig. 6 Emission spectra of (a) Nd3+x = 0.005 sample, (b) x = 0.01, and (c) Nd3+x = 0.02 all excited at 473 nm. (d) Fitted LIR of the x = 0.02 sample. (e) Absolute (red) and relative (black) sensitivities of the x = 0.02 sample. (f) Repeatability of the x = 0.02 sample's LIR by cycling between 350 and 500 K. Distribution curve of LIR after 30 consecutive measurements at (g) 300 K, and (h) 435 K. | |
The relative sensitivity, Sr, was calculated as ∼2.0% K−1 at 300 K, which is, as predicted, a value higher than achieved with most of the lanthanides (see Table 2 in ref. 4).
Table 2 Comparison of thermometric performance of Cr3+ or Nd3+ doped LGO, Cr3+,Nd3+ co-doped systems, or other prominent probes with LGO:Cr3+,Nd3+, by the LIR method
| Host |
Activator |
T range [K] |
S
r [% K−1] @ 310 K |
Max (Sr) [% K−1] |
S
a [K−1] @ 310 K |
ΔT [K] @310 K |
Min (ΔT) [K] |
Ref. |
| ZnS |
Mn2+,Eu3+ |
303–423 |
NA |
1.1 @ 303 K |
NA |
NA |
0.02 |
44
|
| YF3 |
Er3+,Yb3+ |
293–473 |
1.8 |
2 @ 293 K |
4.2 × 10⁻³ |
1.1 |
1 |
45
|
| ZnSe/CdSe |
Mn2+ |
200–370 |
1.2 |
1.2 @ 310 K |
NA |
NA |
NA |
46
|
| MgAl2O4 |
Cr3+ |
300–540 |
3.4 |
3.5 @ 300 K |
4.0 × 10⁻³ |
0.3 |
0.3 |
26
|
| ZnGa2O4 |
Cr3+ |
300–700 |
2.8 |
3.2 @ 300 K |
1.4 × 10⁻³ |
0.4 |
0.4 |
47
|
| Bi2Ga4O9 |
Cr3+ |
150–450 |
0.7 |
0.75 @ 300 K |
NA |
1.5 |
1.5 |
48
|
| Sr2MgAl22O36 |
Cr3+ |
298–523 |
1.7 |
2 @ 300 K |
4.5 × 10⁻¹ |
NA |
NA |
49
|
| YVO4 |
Eu3+ |
300–850 |
3.9 |
4.2 @ 300 K |
5.8 × 10⁻⁷ |
NA |
NA |
50
|
| La2O3 |
Yb3+,Nd3+ |
290–1230 |
2.9 |
3 @ 300 K |
1.4 × 10⁻⁴ |
0.7 |
0.6 |
51
|
| Al2O3 |
Sm2+ |
298–648 |
4.7 |
4.8 @ 298 K |
3.3 × 10⁻³ |
0.04 |
0.04 |
52
|
| YAB |
Pr3+,Gd3+ |
30–800 |
0.8 |
10 @ 30 K |
NA |
0.6 |
0.6 |
53
|
| LiLuF4 |
Er3+,Yb3+ |
300–525 |
1.2 |
1.3 @ 300 K |
NA |
0.09 |
0.08 |
54
|
| NaYF4 |
Er3+,Yb3+ |
300–900 |
1.1 |
1.1 @ 300 K |
3.6 × 10⁻³ |
1 |
1 |
55
|
| Ga2S3:La2O3 |
Er3+,Yb3+ |
293–493 |
1.0 |
1.1 @ 293 K |
NA |
0.3 |
0.3 |
56
|
| LGO |
Cr3+ |
150–300 |
0.7 |
2.07 @ 150 K |
1.9 × 10⁻² |
0.7 |
0.2 |
11
|
| LGO |
Nd3+ |
280–830 |
1.5 |
1.8 @ 280 K |
NA |
1.2 |
1.6 |
12
|
| LGO |
Vn+,Nd3+ |
123–573 |
1.0 |
1.5 @ 350 K |
NA |
NA |
NA |
13
|
| LGO |
Cr3+ |
300–600 |
2.4 |
2.5 @ 300 K |
NA |
0.05 |
0.05 |
15
|
| Gd3Al5GaO12 |
Cr3+,Nd3+ |
123–573 |
1.2 |
1.9 @ 123 K |
NA |
NA |
NA |
24
|
| LaScO3 |
Cr3+,Nd3+ |
123–573 |
0.2 |
1.3 @ 400 K |
NA |
NA |
NA |
25
|
| LiLaP4O12 |
Cr3+,Nd3+ |
113–473 |
3.6 |
3.9 @ 323 K |
NA |
NA |
NA |
31
|
| LiLaP4O12 |
Cr3+,Nd3+ |
300–420 |
NA |
4.9 @ 323 K |
NA |
NA |
0.05 |
32
|
| YAG |
Cr3+,Nd3+ |
100–850 |
3.3 |
3.5 @ 200 K |
NA |
NA |
NA |
57
|
| YAGG |
Cr3+,Nd3+ |
123–573 |
1.1 |
2.16 @ 220 K |
NA |
NA |
NA |
58
|
| LGO |
Cr3+,Nd3+ |
300–625 |
1.8 |
1.9 @ 300 K |
4.9 × 10⁻³ |
0.04 |
0.04 |
This work |
The sensor stability was tested and confirmed by estimating LIR while cycling between two temperatures in 10 periods (see Fig. 5f). The LIR values at those temperatures remained unchanged after each cycle. The repeatability was estimated according to:59
| |  | (6) |
where
i denotes the measurement count. For the measurements presented in
Fig. 5f, the repeatability is 99.92% and 99.88% at 350 K and 500 K, respectively.
Finally, the relative uncertainties (σr) were estimated from 30 consecutive measurements at 300 K and 435 K, with values of 0.07% and 0.09%, respectively (see Fig. 5g and h). Corresponding temperature resolutions of 0.04 K and 0.1 K were estimated using eqn (7).
| |  | (7) |
Although our material does not exhibit the same sensitivity as some other Cr3+, Nd3+-containing luminescence thermometers in the literature, it provides high precision and therefore excellent temperature resolution. The reason behind the low uncertainties in temperature measurements using this probe is that both emissions utilised for LIR have high intensities. Swieten et al.60 recently demonstrated that signal strength is directly proportional to the precision of the temperature measurement. As already mentioned, Cr3+ emission in the strong crystal field is comprised of the 4T2 and 2E bands, with opposite trends with change in temperature. These bands overlap, but as the 4T2 band is broader, there is always a spectral region which comprises only of the 4T2 band. The emission of the entire Cr3+ emission, comprised of 4T2 and 2E bands, changes more slowly with temperature than each individual band. By taking a narrow spectral range for LIR, containing only 4T2 emission, the larger uncertainty is introduced than by observing the entire Cr3+ emission as it is obvious that the entire emission is more intense than any of its individual parts. Thus, the higher sensitivity that can be obtained by employing only 4T2 emission in LIR does not necessarily mean that the temperature resolution is improved, as the increased relative sensitivity can be compensated by the increased uncertainty. The analogous demonstration is presented in our previous work where we showed that by deconvolution of 4T2 and 2E bands the relative sensitivity can be significantly increased, but the temperature resolution stays invariant to the numerical method employed for LIR.61 In a YAG matrix, a high temperature sensitivity of 3.48% K−1 was observed, but only a fraction of Cr3+ emission was employed for the integration used for the LIR calculation.57 In a Cr3+, Nd3+ doped Y3Al2Ga3O12 host, a relative sensitivity of 2.2% K−1 was observed with even narrower integrated areas.58 An investigation of Gd3Ga5O12 gave a relative sensitivity of 1.90% K−1 by LIR, using only the ratio of the broad-band of Cr3+ to the Nd3+ emission.24 An outstanding relative sensitivity of 4.89% K−1 was reported for a Cr3+, Nd3+ co-doped system in LiLaP4O12 host, but using 20 nm-wide integration windows for both Cr3+ and Nd3+, and with high emission intensities only at lower temperatures.32 Thus, in Cr3+, Nd3+ co-doped systems, the sensitivity of LIR requires a compromise between the precision of the measurement and the sensitivity. A robust comparison of the most important figure of merit in thermometry – the temperature resolution – in different materials would necessitate measuring all the materials under the same experimental conditions. For comparison of the most prominent and highly performing probes for luminescence thermometry by the LIR method with our sensor, please see Table 2.
Conclusions
Phosphors of composition La1−xGa0.99O3:Cr0.01, Ndx (x = 0.005, 0.01, 0.02) were successfully synthesised by the solid-state method and structurally characterised by PXRD using Rietveld refinement. The excitation into the spin-allowed absorption bands of Cr3+ at 590 nm gives rise to both the narrow-band, spin-forbidden 2E emission of Cr3+ at 729 nm and the 4F3/2 → 4I9/2 line-like emissions of Nd3+ at around 890 nm. At room temperature, energy transfer both from Cr3+ → Nd3+ and from Nd3+ → Cr3+ was evident by examination of excitation spectra registered at the well-separated Nd3+ and Cr3+ emission wavelengths.
It is demonstrated that La0.98Ga0.99O3:Cr0.01, Nd0.02 can be used as an efficient NIR thermometer. This binary probe follows the Boltzmann relation, with good sensitivity values. Due to the high intensities of both the Nd3+ and Cr3+ emissions, the absolute sensitivity has high values (Sr ∼ 2.0% K−1 at 300 K) and the uncertainties in measurement are low, leading to an excellent temperature resolution (0.04 K at 300 K), even for inexpensive non-state-of-the-art equipment. Demonstrating this low uncertainty, and therefore high temperature resolution, whilst employing instrumentation that is closer to that utilised in industry, gives this probe the unique advantage of authenticity in testing for potential real-world applications. The sensor also shows potential to be used for temperature measurements of biological samples in vivo, as both the excitation and emission can be reached within the first biological window.
Conflicts of interest
There are no conflicts to declare.
Acknowledgements
The authors acknowledge funding by NATO grant SPS.MYP G5751 (The Optical Nose Grid for Large Indoor Area Explosives Vapours Monitoring) and from the Ministry of Education, Science and Technological Development of the Republic of Serbia. ALM thanks EPSRC for a PhD studentship from the Doctoral Training Programme. We thank Peter Rodger and Gary Ostwald for preliminary exploratory synthesis and PXRD data collection during the covid-19 pandemic.
Notes and references
-
C. D. S. Brites, A. Millan and L. D. Carlos, Lanthanides in luminescent thermometry Handbook on the Physics and Chemistry of Rare Earths, 2016.
- C. D. S. Brites, P. P. Lima, N. J. O. Silva, A. Millán, V. S. Amaral, F. Palacio and L. D. Carlos, Nanoscale, 2012, 4, 4799–4829 RSC.
- M. D. Dramićanin, J. Appl. Phys., 2020, 128, 040902 CrossRef.
- M. D. Dramićanin, Methods Appl. Fluoresc., 2016, 4, 042001 CrossRef PubMed.
- S. F. Collins, G. W. Baxter, S. A. Wade, T. Sun, K. T. V. Grattan, Z. Y. Zhang and A. W. Palmer, J. Appl. Phys., 1998, 84, 4649–4654 CrossRef CAS.
-
G. Greg Baxter, S. Wade, S. Collins, G. Monnom and E. Maurice, Proceedings of SPIE - The International Society for Optical Engineering.
-
G. Blasse and B. C. Grabmaier, Luminescent Materials, Springer-Verlag, 1994 Search PubMed.
- C. S. Kamal, T. K. V. Rao, T. Samuel, P. V. S. S. S. N. Reddy, J. B. Jasinski, Y. Ramakrishna, M. C. Rao and K. R. Rao, RSC Adv., 2017, 7, 44915–44922 RSC.
- T. Ishihara, H. Matsuda and Y. Takita, J. Am. Chem. Soc., 1994, 116, 3801–3803 CrossRef CAS.
- L. Zhang, L. Dong, B. Shao, S. Zhao and H. You, Dalton Trans., 2019, 48, 11460–11468 RSC.
- A. Mondal and J. Manam, Ceram. Int., 2020, 46, 23972–23984 CrossRef CAS.
- M. Back, J. Ueda, J. Xu, D. Murata, M. G. Brik and S. Tanabe, ACS Appl. Mater. Interfaces, 2019, 11, 38937–38945 CrossRef CAS PubMed.
- K. Kniec and L. Marciniak, Phys. Chem. Chem. Phys., 2018, 20, 21598–21606 RSC.
- Z. Li, X. Yu, T. Wang, S. Wang, L. Guo, Z. Cui, G. Yan, W. Feng, F. Zhao, J. Chen, X. Xu and J. Qiu, J. Am. Ceram. Soc., 2022, 105, 2804–2812 CrossRef CAS.
- A. L. Mullins, A. Ćirić, Z. Ristić, J. A. Gareth Williams, I. R. Evans and M. D. Dramićanin, J. Lumin., 2022, 246, 118847 CrossRef CAS.
- V. Lojpur, S. Ćulubrk, M. Medić and M. Dramicanin, J. Lumin., 2016, 170, 467–471 CrossRef CAS.
- S. Ćulubrk, V. Lojpur, S. P. Ahrenkiel, J. M. Nedeljković and M. D. Dramićanin, J. Lumin., 2016, 170, 395–400 CrossRef.
- L. R. Đačanin, S. R. Lukić-Petrović, D. M. Petrović, M. G. Nikolić and M. D. Dramićanin, J. Lumin., 2014, 151, 82–87 CrossRef.
- S. Balabhadra, M. L. Debasu, C. D. S. Brites, L. A. O. Nunes, O. L. Malta, J. Rocha, M. Bettinelli and L. D. Carlos, Nanoscale, 2015, 7, 17261–17267 RSC.
- V. K. Rai, D. K. Rai and S. B. Rai, Sens. Actuators, A, 2006, 128, 14–17 CrossRef CAS.
- Y. Shen, X. Wang, H. He, Y. Lin and C.-W. Nan, Compos. Sci. Technol., 2012, 72, 1008–1011 CrossRef CAS.
- D. K. Amarasinghe and F. A. Rabuffetti, Chem. Mater., 2019, 31, 10197–10204 CrossRef CAS.
- C. Matuszewska, K. Elzbieciak-Piecka and L. Marciniak, J. Phys. Chem. C, 2019, 123, 18646–18653 CrossRef CAS.
- K. Elzbieciak, A. Bednarkiewicz and L. Marciniak, Sens. Actuators, B, 2018, 96–102 CrossRef CAS.
- K. Elzbieciak-Piecka, M. Suta and L. Marciniak, Chem. Eng. J., 2021, 421, 129757 CrossRef CAS.
- A. Ćirić, Z. Ristić, J. Periša, Ž. Antić and M. D. Dramićanin, Ceram. Int., 2021, 47, 27151–27156 CrossRef.
- Z. Ristić, V. Đorđević, M. Medić, S. Kuzman, M. Sekulić, Ž. Antić and M. D. Dramićanin, Meas. Sci. Technol., 2021, 32, 054004 CrossRef.
- M. Back, E. Trave, J. Ueda and S. Tanabe, Chem. Mater., 2016, 28, 8347–8356 CrossRef CAS.
- E. Glais, M. Pellerin, V. Castaing, D. Alloyeau, N. Touati, B. Viana and C. Chanéac, RSC Adv., 2018, 8, 41767–41774 RSC.
- A. N. Bashkatov, E. A. Genina, V. I. Kochubey and V. V. Tuchin, J. Phys. D, 2005, 38, 2543–2555 CrossRef CAS.
- L. Marciniak, A. Bednarkiewicz, D. Kowalska and W. Strek, J. Mater. Chem. C, 2016, 4, 5559–5563 RSC.
- L. Marciniak, A. Bednarkiewicz and W. Strek, Sens. Actuators, B, 2017, 238, 381–386 CrossRef CAS.
- A. A. Coelho, J. Evans, I. Evans, A. Kern and S. Parsons, Powder Diffr., 2011, 26, S22–S25 CrossRef CAS.
- H. M. Rietveld, J. Appl. Crystallogr., 1969, 2, 65–71 CrossRef CAS.
- A. Ćirić, S. Stojadinović and M. D. Dramićanin, Meas. Sci. Technol., 2019, 30, 045001 CrossRef.
- M. Lerch, H. Boysen and T. Hansen, J. Phys. Chem. Solids, 2001, 62, 445–455 CrossRef CAS.
- A. M. Glazer, Acta Crystallogr., Sect. B: Struct. Crystallogr. Cryst. Chem., 1972, 28, 3384–3392 CrossRef CAS.
- R. D. Shannon, Acta Crystallogr., 1976, 751–767 CrossRef CAS.
- W. Mikenda and A. Preisinger, J. Lumin., 1981, 26, 53–66 CrossRef CAS.
- H. Hua, J. Ueda, J. Xu, M. Back and S. Tanabe, Inorg. Chem., 2021, 60, 19253–19262 CrossRef CAS PubMed.
-
W. Ryba-Romanowski, S. Golab, G. Dominiak-Dzik, I. Sokolska and M. Berkowski.
- M. J. Weber and T. E. Varitimos, J. Appl. Phys., 1971, 42, 4996–5005 CrossRef CAS.
- P. I. Paulose, G. Jose, V. Thomas, N. V. Unnikrishnan and M. K. R. Warrier, J. Phys. Chem. Solids, 2003, 64, 841–846 CrossRef CAS.
- S. Wang, S. Westcott and W. Chen, J. Phys. Chem. B, 2002, 106, 11203–11209 CrossRef CAS.
- A. Ćirić, J. Aleksić, T. Barudžija, Ž. Antić, V. Đorđević, M. Medić, J. Periša, I. Zeković, M. Mitrić and M. D. Dramićanin, Nanomaterials, 2020, 10, 627 CrossRef PubMed.
- V. A. Vlaskin, N. Janssen, J. van Rijssel, R. Beaulac and D. R. Gamelin, Nano Lett., 2010, 10, 3670–3674 CrossRef CAS PubMed.
- J. Ueda, M. Back, M. G. Brik, Y. Zhuang, M. Grinberg and S. Tanabe, Opt. Mater., 2018, 85, 510–516 CrossRef CAS.
- M. Back, J. Ueda, M. G. Brik, T. Lesniewki, M. Grinberg and S. Tanabe, ACS Appl. Mater. Interfaces, 2018, 10, 41512–41524 CrossRef CAS PubMed.
- Q. Wang, Z. Liang, J. Luo, Y. Yang, Z. Mu, X. Zhang, H. Dong and F. Wu, Ceram. Int., 2020, 46, 5008–5014 CrossRef CAS.
- A. Ćirić, Ł. Marciniak and M. D. Dramićanin, J. Appl. Phys., 2022, 131, 114501 CrossRef.
- G. Gao, D. Busko, S. Kauffmann-Weiss, A. Turshatov, I. A. Howard and B. S. Richards, J. Mater. Chem. C, 2018, 6, 4163–4170 RSC.
- A. Ćirić, S. Stojadinović, Z. Ristić, I. Zeković, S. Kuzman, Ž. Antić and M. D. Dramićanin, Adv. Mater. Technol., 2021, 6, 2001201 CrossRef.
- D. Yu, H. Li, D. Zhang, Q. Zhang, A. Meijerink and M. Suta, Light: Sci. Appl., 2021, 10, 236 CrossRef CAS.
- A. M. Kaczmarek, M. Suta, H. Rijckaert, T. P. van Swieten, I. V. Driessche, M. K. Kaczmarek and A. Meijerink, J. Mater. Chem. C, 2021, 9, 3589–3600 RSC.
- R. G. Geitenbeek, P. T. Prins, W. Albrecht, A. van Blaaderen, B. M. Weckhuysen and A. Meijerink, J. Phys. Chem. C, 2017, 121, 3503–3510 CrossRef CAS PubMed.
- P. V. Dos Santos, M. T. De Araujo, A. S. Gouveia-Neto, J. A. M. Neto and A. S. B. Sombra, IEEE J. Quantum Electron., 1999, 35, 395–399 CrossRef CAS.
- L. Marciniak, A. Bednarkiewicz, J. Drabik, K. Trejgis and W. Strek, Phys. Chem. Chem. Phys., 2017, 19, 7343–7351 RSC.
- K. Elzbieciak and L. Marciniak, Front. Chem., 2018, 6, 424 CrossRef PubMed.
- J. Rocha, C. D. S. Brites and L. D. Carlos, Chem. – Eur. J., 2016, 22, 14782–14795 CrossRef CAS PubMed.
- T. P. van Swieten, A. Meijerink and F. T. Rabouw, ACS Photonics, 2022, 9, 1366–1374 CrossRef CAS PubMed.
- A. Ćirić, Z. Ristić, Ž. Antić and M. D. Dramićanin, Phys. B, 2022, 624, 413454 CrossRef.
|
| This journal is © The Royal Society of Chemistry 2022 |
Click here to see how this site uses Cookies. View our privacy policy here. 
 Open Access Article
 This Open Access Article is licensed under a
  b,
Ivana
Zeković
b,
J. A. Gareth
Williams
b,
Ivana
Zeković
b,
J. A. Gareth
Williams