On the validity of rapid optical sensing of dioxygen by means of sensitivity, stability, and reversibility for archetype MOFs post-synthetically modified with Eu3+†
Thomas
Kasper
*a,
Matilde
Pavan
a and
Klaus
Müller-Buschbaum
 ab
ab
aInstitute of Inorganic and Analytical Chemistry, Justus Liebig University Giessen, Heinrich-Buff-Ring 17, 35392, Giessen, Germany. E-mail: kmbac@uni-giessen.de
bCenter for Materials Research (LAMA), Justus Liebig University Giessen, Heinrich-Buff-Ring 16, 35392, Giessen, Germany
First published on 17th October 2023
Abstract
Pressure dependent optical dioxygen sensing was studied by a comparison of six archetype metal–organic frameworks (MOFs: UiO-66(Zr), UiO-67(Zr), UiO-67(Zr)-bipy, MIL-68(In), MIL-100(In) and DUT-5(Al)) based on the quenching of the photoluminescence emission of the MOFs post-synthetically modified with Eu3+ in the pore systems. MOF-76(Eu) as an example of a luminescent LnMOF with Eu3+ ions as coordinative centers of the framework was included in the comparison. Pressure dependence was investigated starting with high vacuum (10−7 bar) to ambient pressure by quantitatively analyzing the response of the Eu3+ photoluminescence emission towards oxygen. The MOFs show fast response, leading to reversible “turn-off” and “turn-on” effects most prominent for Eu3+@MIL-68 directly observable by a luminescence emission quenching efficiency of 93.8% within 2 s. Intensity changes were already measured at oxygen pressures of 10−5 bar, indicating high sensitivity. Furthermore, the sensing process follows the Stern–Volmer relationship, although a certain pressure dependence also affects the kinetics especially in the low-pressure region, so that applying only Stern–Volmer is not valid over the whole pressure range, as the quenching rate increases with decreasing pressure. In addition, the process is reversible and robust, which was elaborated by multiple sorption/desorption studies including cycling over ten sensing cycles. Selectivity of the processes were evaluated for other atmospheric gases N2, CO2 indicating only minor quenching that still allows oxygen detection for a pO2 of 10−5 bar. Altogether, this work presents analysis-based proof on the validity of broad and rapid sensitive on-the-fly optical oxygen sensing with lanthanide-loaded MOFs.
Introduction
Optical sensing is a field widely investigated for the detection of various different parameters, e.g. gases,1–6 humidity,7,8 temperature,7,9 metal ions10,11 or volatile organic compounds.12,13 The greatest advantage of optical sensors is the ability to observe the sensing process with the bare eye and spectroscopically for quantification. Accordingly, most optical sensors allow quantification of the analyte.14,15 Applications in which the sensor needs to be placed in a closed chamber or system can benefit from the feature of an optical detection, because the sensor does not need to be contacted by wires and signal can be recorded from outside through a window.6Oxygen sensing itself is widely investigated and an important topic in the field of gas sensing due to the major presence of oxygen in the atmosphere. Small amounts of oxygen or even slight deviations from a specific concentration influence vital functions of organisms and the oxidizing nature leads to degradation of sensitive compounds like drugs, food, etc. Low oxygen concentrations can favor the growth of tumors,16 while high oxygen concentrations lead to cell death due to formation of reactive oxygen species.17 The most common oxygen sensor probably is yttria-stabilized zirconia, which is used to measure the exhaust gas concentration of oxygen in combustion engines. Due to the oxygen-conductivity of zirconia at higher temperatures, the difference in oxygen concentration between the exhaust and outside gas can be determined as potential difference.18 In some cases, also titania sensors are used, which work on a resistive base and therefore do not need a reference gas.19 However, the resistance of semiconductors depends on the amount of adsorbed oxygen, which is also changed by other oxidizing or reducing gases in the atmosphere.20 On the other hand, some work show that lanthanide-doped titania can act as an optical sensor for oxygen, too.21,22 In medicine pulse oximetry is a common and non-invasive way for monitoring the oxygen concentration in blood. This optical method is based on the different absorption spectra between deoxygenated and oxyhemoglobin.23 Luminescence-based oxygen sensing is also relevant for application and can be used either for detection of gaseous or dissolved oxygen.24 This process is based on luminescence quenching due to triplet–triplet energy transfer between the probe and oxygen, which is highly selective and does not consume oxygen. In medicine, this type of sensing is used to detect dissolved oxygen next to several other blood parameters, such as dissolved carbon dioxide or pH.
Luminescent metal–organic frameworks (MOFs) are a material class, which possess some advantageous properties for gas sensing. Firstly, the high porosity of MOFs results in a large surface area that gives a large interaction site for analytes. Furthermore, adjustment of the pore size and hydrophilicity (or hydrophobicity) allow to adapt to the investigated analyte by steric or interaction properties.1,3 Moreover, the luminescence properties of MOFs are tunable. MOFs that do not possess intrinsic luminescence can be made luminescent by loading luminophores to the pores. This approach also enables different luminescence colors, and ratiometric sensors can be achieved by mixing of different luminophores.25–28 Lanthanides are an example for luminophores, which were also chosen for oxygen sensing in MOFs.14,27,29–32 Excitation of lanthanide ions occurs via a sensitizer effect, thus the organic linker is excited by UV radiation followed by an energy transfer from linker to the lanthanide ion (Scheme 1), from where emission occurs.33 In presence of oxygen, a competing path for the energy transfer is opened as oxygen is able to absorb the energy via triplet–triplet transfer from the excited linker reducing the emission intensity of the respective Ln-ions.30 Thereby, an increased oxygen concentration also increases the quenching rate of the luminescence emission, since the energy transfer to oxygen interrupts the energy transfer to the lanthanide ions. Removal of oxygen reverses the quenching, enabling such a material as a suitable reversible and potentially sensitive optical oxygen sensor.
 | ||
| Scheme 1 Schematic depiction of the oxygen gas sensing mechanism via triplet–triplet energy transfer in lanthanide-containing MOFs shown for the crystal structure of MIL-68(In)46 (Hydrogen omitted for clarity). | ||
Results and discussion
In the present study, an optical sensing of dioxygen gas via a change of the luminescence intensity of an europium-based light emission was investigated as a comparison of six archetype MOFs (UiO-66(Zr), UiO-67(Zr), UiO-67(Zr)-bipy, MIL-68(In), MIL-100(In) and DUT-5(Al)) post-synthetically modified by impregnation with Eu3+ ions and one MOF system in which Eu3+ ions act as coordinative centers of the framework structure (MOF-76(Eu); for clarity of the structural relation of the archetype MOFs selected for this study, images of the MOF structures are provided in ESI, Fig. S1–S6†). Previous work showed that optical oxygen sensing can be achieved by post-synthetically modified MOFs impregnated with luminophores, such as complexes29,34–36 or lanthanide ions.27,30,31 In both cases, sensing occurred due to the mechanism described in Scheme 1. While Bio-MOF-1 firstly was impregnated with trivalent lanthanide ions to investigate the concentration of dissolved oxygen in water,27 two other groups impregnated Bio-MOF-1 to show its capability for oxygen gas sensing in oxygen/nitrogen-mixtures.30,31 Both demonstrated the reversibility of the process and further showed a detection limit of 0.4%.30 Other publications35,37–39 proved that even lower quantities of oxygen can be measured with this method, e.g. UiO-67(Zr) impregnated with Ir- & Ru-complexes showed sensitivity to oxygen at 0.001 bar.35 For some systems, at such low pressures, the kinetics already differed from Stern–Volmer behavior and needed to be adjusted by “two-site models”.35,38 Lanthanide-impregnated MOFs were not investigated at such low pressures, yet, and here for, Eu3+ was chosen in this work to be post-synthetically implemented into the pore systems of various archetype MOFs, as it also possesses some unique luminescence properties beneficial for further characterization and understanding of the sensing process. Archetype MOFs like UiO-66 were selected, because they are well-characterized in literature and allow to tune the pore size (UiO-67) or contain open ligand coordination sites (UiO-67-bipy). MIL-68(In) and DUT-5(Al) were chosen as systems with different coordinative centers, while MIL-100(In) served as a reference to literature since it was investigated in a work on Tb3+-impregnated MOF thin films.30 And MOF-76(Eu) was selected as example with Eu3+ as coordinative center without post-synthetic modification. Altogether, a wider picture on the validity of this type of sensing of oxygen and the broadness of the applicable photophysical process was to be achieved.Impregnation and photoluminescence properties
The altogether seven MOFs were successfully synthesized according to procedures from the literature30,40–45 (syntheses of the two UiO-67(Zr) derivatives were slightly modified), which are described in the experimental section, as proven by powder X-ray diffraction (PXRD; see ESI, Fig. S7–S13†). The obtained MOFs were post-synthetically modified by impregnation to achieve luminescence and therefore rinsed in an Eu(NO3)3 solution, followed by an activation step with heating in active vacuum at 150 °C to obtain a higher surface area and pore accessibility and therefore higher interface for interaction with gases. Subsequent to impregnation with Eu3+, the MOFs were further characterized to investigate the influence of impregnation on structural and optical properties. Therefore, also PXRD was repeated after the respective impregnation procedure. As shown in Fig. 1, there is no indication for the presence of other crystalline phases, such as Eu(NO3)3·6H2O in the impregnated products. This also excludes measurable surface contamination with precipitated reagent by crystallization of Eu(NO3)3·6H2O on the outer surface of the respective MOFs instead of pore loading. Location in the pores rather than crystallizing on the outer surface of the respective MOFs is also supported by the following observations that MOFs are known for changes in their powder diffractograms due to different pore fillings by guests.48 This can be seen in the individual reflection intensities in the PXRDs shown in Fig. 1, as some reflections are weaker (e.g. UiO-67(Zr)-bipy at 9.5°) and others are stronger (e.g. UiO-67(Zr)-bipy at 11.5°) compared to the as-synthesized MOFs without indicating additional reflections. This points at Eu3+ not being positioned in crystallographically defined positions inside the MOF pores for all examples. Of the MOFs selected in this work, DUT-5(Al) shows the strongest response to loading of the pores in PXRD, e.g. the reflection at 8.0° and all reflections above 23.0° disappeared, while the reflection at 18.0° appears much stronger after impregnation.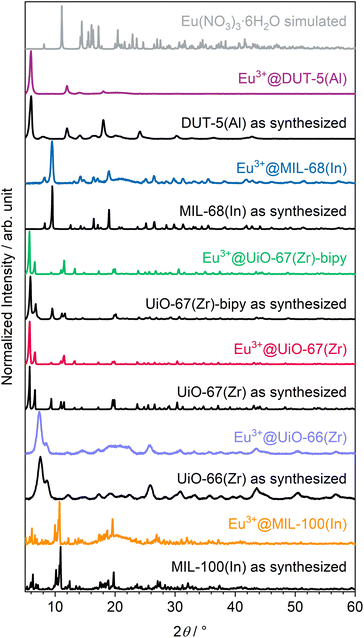 | ||
| Fig. 1 Powder diffractograms of as-synthesized and Eu3+-impregnated MOFs as well as a comparison with simulated diffractogram of the reagent Eu(NO3)3·6H2O.47 | ||
Since powder X-ray diffraction does not indicate the presence of Eu(NO3)3·6H2O in the products, and to identify the counter anions for the Ln-cations loaded into the pores, Raman spectra (Fig. 2) were recorded. Due to the neutral nature of the selected MOFs, nitrate anions are possible candidates to be found in the samples to compensate for the charge of Eu3+ as result of the impregnation process. For the impregnated MOFs, the stretching modes of the nitrate anion can be successfully assigned proving its role in charge compensation.49 However, for Eu3+@UiO-67-bipy, the Raman spectra were too weak in intensity to clearly show Raman modes of the nitrate anion. A reason for this could be that the linker possesses nitrogen atoms that could act as coordination or interaction sites to Eu3+ or the nitrate anion and result in a lower intensity. For Eu3+@MIL-100(In), a direct coordination of Eu3+ due to vacancies/defects could result in similar observations. A direct coordination of Tb3+ to the carboxylate linker in MIL-100(In) was reported before.30
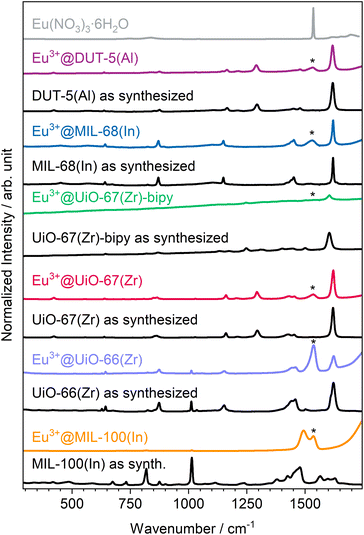 | ||
| Fig. 2 Comparison between Raman spectra of as-synthesized and impregnated MOFs in comparison to Eu(NO3)3·6H2O (position of its maximum intensity marked with * in the other spectra). | ||
For quantification of the Eu3+ content, MP-AES (microwave plasma atomic emission spectroscopy) measurements were carried out (Table S2†). The results show that the MOFs were successfully impregnated with Eu3+. Furthermore, the mass fraction of Eu3+ within the samples is low with only 1 wt% (Eu3+@DUT-5(Al) & Eu3+@UiO-66(Zr)) or lower (all other MOFs) showing that the impregnation procedure leads to nearly the same results for all of the MOFs investigated.
The intense, red luminescence under UV excitation is the first observation for successful impregnation, which can already be observed by the eye without any analysis instrumentation. Red luminescence is typical for Eu3+ and is caused by its parity forbidden 4f–4f transitions that are also visible in the photoluminescence emission spectra (Fig. 3a). Since the 4f orbitals are well shielded, they show almost no influence of the chemical surrounding, and therefore, luminescence emission always appears at an almost similar wavelength in all compounds. This is also evident in the sharp and defined emission peaks compared to the broad emission bands of the linker.50,51 Due to the parity forbidden nature of the 4f–4f transitions a direct excitation leads only to weak light uptake and consequently a more favorable excitation path is chosen via the ligand (the so called antenna effect).52 The linker molecule is excited by UV radiation, followed up by a ligand to metal charge transfer to the Eu3+ ion. As this energy transfer has a different efficiency depending on the specific linker and MOF structure, there is also ligand emission possible in the UV/blue region of the spectrum for some of the MOFs (e.g. Eu3+@MIL-68(In)).
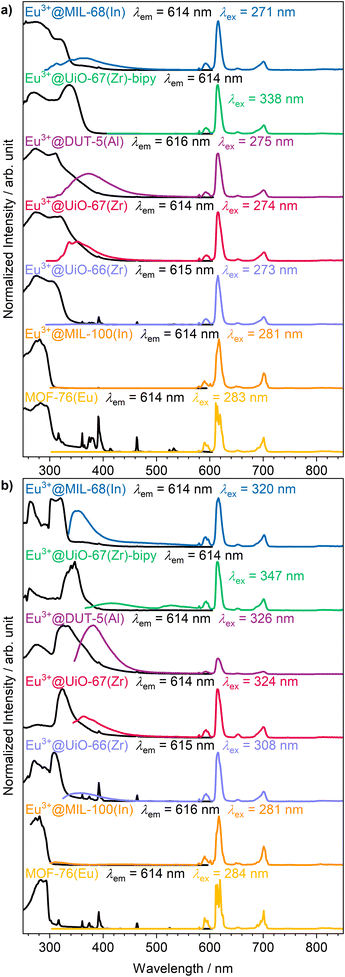 | ||
| Fig. 3 Photoluminescence excitation (black) and emission spectra (colored) of the set of MOFs impregnated with Eu3+ at (a) room temperature and (b) 77 K. | ||
Further photoluminescence spectra were recorded at 77 K (Fig. 3b) to further clarify whether Eu3+ is occupying defined positions or if it is randomly distributed within the pores. For crystallographically fixed positions, the line width in the photoluminescence spectra should be reduced at lower temperature due to decreased thermal effects like vibrations, as is observed for MOF-76(Eu). In the impregnated MOFs, this is not the case. Instead, the peak width is caused to stay broader due to small energy differences by different surroundings, and therefore, no reduction of peak width is observed at 77 K. Although the 4f orbitals are well shielded, some transitions are sensitive to the chemical surrounding and called hypersensitive transitions. In order to utilize this circumstance, Eu3+ was initially selected, as the 5D0 → 7F2 transition of Eu3+ is of such type resulting in a splitting of the corresponding peak.33 In case of MOF-76(Eu) the 5D0 → 7F2 transition is split due to two different crystallographic positions of Eu3+ in the structure. At lower temperature, reduction of the line width should make the splitting of the respective transition better observable, if Eu3+ occupies multiple defined positions. However, again, this is not the case for the impregnated MOFs. Therefore, it can be assumed that Eu3+ is distributed within the pores without defined crystallographic position or chemical surrounding. This corroborates the findings of PXRD, described before.
Quantitative oxygen gas sensing
Qualitative investigation of oxygen gas sensing was done by flushing oxygen in an evacuated glass vessel and showing impressively the efficiency of the quenching process (see Fig. 4 and ESI Video V1† for visible support). Under vacuum (here: 1 × 10⁻⁶ bar), the sample shows bright luminescence, which is almost entirely quenched in pure oxygen atmosphere (1 bar). Furthermore, the quenching occurs fast and is finished within 2 s. The speed of this kind of optical sensing is enabled by the speed of the energy transfer processes and lifetimes of the luminescence. As even the latter is on the ms scale, the speed of the sensing process only depends on the diffusion of oxygen gas into the MOF pores. Since it also takes some time until the atmosphere in the previously evacuated vial is equilibrated, it can be assumed that the actual sensing speed is even faster. Re-evacuation of the oxygen flushed glass vessel (ESI Video V2†) shows reversibility of the quenching process. The response of this process is slower, as it takes about 15 s to observe no further intensity change, which is quite different from the sensing step. This reflects binding of dioxygen to the MOF, also this process is limited by the capacity of the pump. Taking this into consideration, removing traces of oxygen is hardly achievable, and considerably more time is required to reach nearly anoxic conditions, whereas most of the quenching already occurs at low oxygen pressure, e.g., 89.5% intensity quenching at 0.1 bar (Eu3+@MIL-68(In)). Altogether, both observations indicate that the sensing is reversible with the sensors being reusable and not for one-time use only. | ||
| Fig. 4 Luminescence intensity of Eu3+@MIL-68(In) in vacuum (left) is higher than in oxygen atmosphere (right). Images were recorded within a timeframe of 2 s. | ||
The visual impression is broadly supported by quantitative measurements (Fig. 5) that corroborate the previous findings. Eu3+@MIL-68(In) shows the strongest quenching with 93.8%, followed by Eu3+@DUT-5(Al), which is the first example for impregnation and oxygen-based luminescence quenching for an aluminum MOF, and Eu3+@UiO-67(Zr)-bipy with 92.2% and 88.1% respectively. Overall, the selected, impregnated MOFs are quenched comparably strong (at least 86.0%, Fig. 6), indicating a high suitability of this kind of optical oxygen sensing including a “turn-off” process. In contrast, for MOF-76(Eu), the only MOF possessing intrinsic Eu-luminescence, the luminescence intensity is quenched only by 68.9%, not suitable for a sensing utilizing a “turn-off”. This can be related to both, a lower accessibility of the pores (or surface area in general) and a lower interaction possibility of the MOF constituents to the oxygen molecules in comparison to the other MOFs resulting in a reduced quenching. This is also supported by the fact that MOF-76(Eu) shows a much higher quenching after activation and impregnation in methanol compared to DMF (Fig. 5h), whereas the post-synthetically modified MOFs can be used as sensitive sensors without further activation.
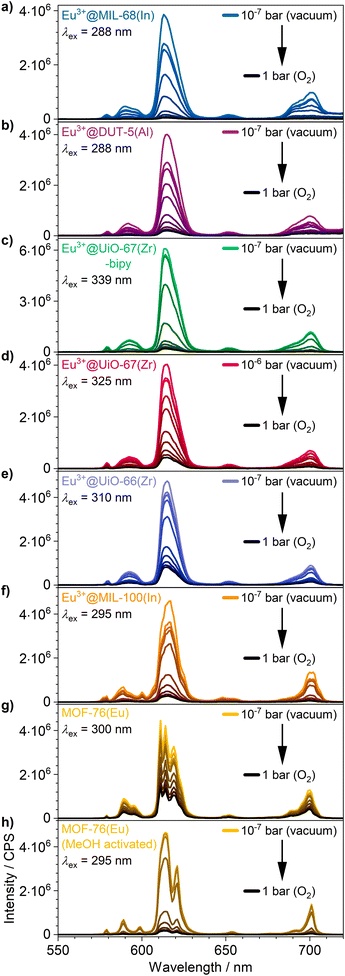 | ||
| Fig. 5 Luminescence emission quenching by intensity decrease of (a–f) the impregnated MOFs and (g) as synthesized and (h) methanol-exchanged MOF-76(Eu) under different oxygen pressures: 10−5 bar, 10−4 bar, 10−3 bar, 10−2 bar, 10−1 bar, 0.25 bar, 0.5 bar, 0.75 bar and 1 bar. Enlarged version of spectra is shown in Fig. S14.† | ||
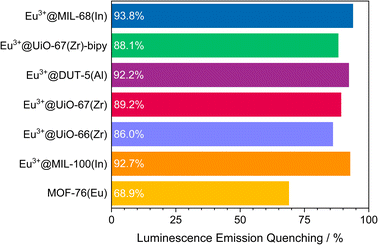 | ||
| Fig. 6 Quenching rate of luminescence emission in an oxygen atmosphere of 1 bar for the selected MOF systems. | ||
Furthermore, for all MOFs investigated, changes in the luminescence intensity can already be observed at a very low oxygen pressure of 1 × 10⁻⁵ bar demonstrating the high sensitivity of the sensors. The MOFs with the highest quenching do also show the largest intensity change at low pressures, which is shown well by a comparison of Eu3+@MIL-68(In) and Eu3+@UiO-67(Zr)-bipy in Fig. 5. For the investigated archetype MOFs, there is no simple correlation between the quenching rate and the specific linkers given that are directly involved into the energy transfer to oxygen. Moreover, it can be assumed that besides different triplet–triplet energy transfer efficiencies, e.g. differences in the pore accessibility are also playing a role.
In addition, the high degree of quenching of the luminescence intensity at low pressures (87.1% for Eu3+@MIL-68(In) at an oxygen pressure of 0.2 bar) underlines that the intensity change can easily be observed by the eye. This allows to use the impregnated MOFs as sensor for applications, where it is necessary to detect oxygen without an external sensor “on-the-fly” and possibly as a “turn-off” effect, e.g. in packaging materials of oxygen sensitive compounds.
Lower emission intensity usually correlates with shorter lifetimes of the photoluminescence process and therefore quenching of emission intensity is also expected to result in a shortened lifetime. Thus, the photoluminescence emission lifetimes in vacuum (1 × 10⁻⁶ bar) and in an oxygen atmosphere (1 bar) were determined. Two of the strongest quenched samples were chosen, Eu3+@MIL-68(In), which shows the strongest quenching, and Eu3+@UiO-67(Zr)-bipy, in which the bipyridine linker allows for potential coordination. The overall process lifetimes (Table 1), which roughly decrease by one half in an oxygen atmosphere of 1 bar, are further supporting the photoluminescence emission quenching data. In case of Eu3+@MIL-68(In), this is reflected by a decrease of 59%, while it is 42% for Eu3+@UiO-67(Zr)-bipy and thus also corresponding to the quenching data.
| Sample | Vacuum | O2 atmosphere | ||
|---|---|---|---|---|
| τ 1/ms | τ 2/ms | τ 1/ms | τ 2/ms | |
| a λ ex = 295 nm, λem = 614 nm. b λ ex = 339 nm, λem = 616 nm. c Due to use of borosilicate glass, a higher λex was chosen for a best compromise between strong excitation and weakest possible absorption by the glass. | ||||
| Eu3+@MIL-68(In)a,c | 74.1(5) | — | 31.0(3) | — |
| Eu3+@UiO-67(Zr)-bipyb | 37.0(3) | 95.4(4) | 24.9(3) | 62.7(3) |
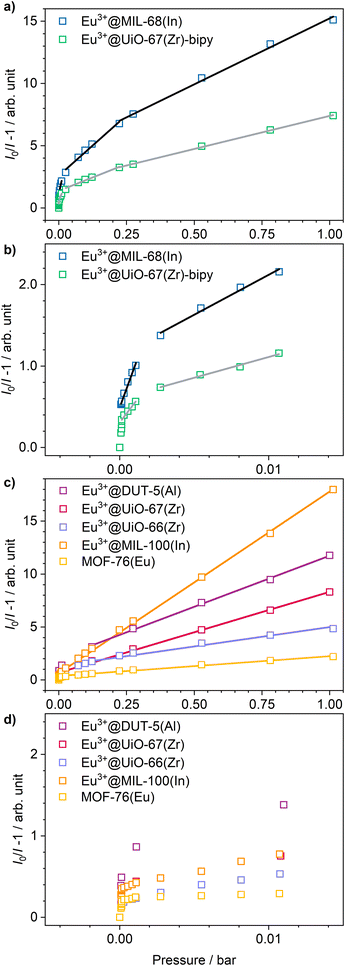
Understanding the kinetics of a sensor helps to also understand the underlying chemical and/or physical interactions and to further comprehend properties like cross-sensitivity or possible sensing limitations. Since the Stern–Volmer relationship was observed to be valid for other luminescent compounds in the literature,30,35,53 it was also checked for the MOFs in this study. The Stern–Volmer relationship describes the influence of the gas pressure or a foreign gas on the luminescence intensity based on molecule collision:54
 | (1) |
I 0 describes the luminescence intensity in the absence of a quencher, I is the intensity at a given quencher concentration [Q] (or partial pressure p(Q)) and KSV is the Stern–Volmer constant. KSV is the product of the quenching constant kq and the emission lifetime in absence of the quencher τ0. Therefore, KSV can be seen as a value for the strength of the quenching in an oxygen gas atmosphere. In case there is only one quencher present, and just one quenching process is occurring, eqn (1) gives a linear correlation. Since the quenching in case of the MOFs is expected to happen via triplet–triplet energy transfer between the linker and oxygen, such a linear correlation should also be observed here.
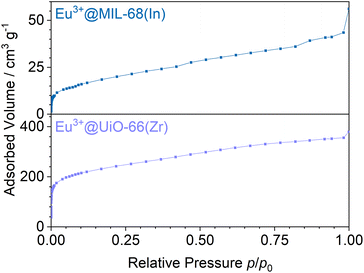
Stern–Volmer plots were calculated for all impregnated MOFs, and to get a better understanding of the behavior at low pressures, Eu3+@MIL-68(In) and Eu3+@UiO-67(Zr)-bipy were exemplary analyzed at pressures below 0.1 bar due to their comparably large response to oxygen, but different strength of response at low pressures. For calculation of the Stern–Volmer plots depicted in Fig. 7, the integrated intensity was used to consider the entire photoluminescence emission. All samples show a behavior fitting to Stern–Volmer kinetics for pressures above 1 × 10⁻³ mbar, although it is not ideally linear. This behavior was also observed in literature35,38 and was explained with an inhomogeneous environment of the impact centers. The linker molecules possess a different accessibility depending if they are located at the outer surface of the particle or inside the pores. When the Stern–Volmer plots are compared to the nitrogen adsorption isotherms in Fig. 8 (exemplarily for Eu3+@MIL-68(In) and Eu3+@UiO-66(Zr)), a similar progression is observed due to presence of micropores, which account for a large part of the surface area. For gas sensing, this explains the strong degree of quenching at low pressures, at which the accessibility of the pores is higher and therefore oxygen can more easily reach the linker molecules inside the pores. Since the majority of the surface area is inside the pores, the quenching efficiency is higher at low pressures. Furthermore, trapping molecules in small pores can lead to an increased number of collisions leading to annihilation of luminescence emission. Moreover, at higher pressure, the increasing number of collisions amongst oxygen molecules leads to a lower increase in the quenching rate as well as the observation of a steeper slope at low pressure. In the literature, this quenching behavior is typically considered by fitting with a “two-site model”.35,38,55 In our study, such a fit gave only partly satisfying results (Fig. S15–S21†). Especially, the data points below 1 × 10⁻³ mbar (1 × 10⁻² mbar in case of Eu3+@DUT-5(Al)) are problematic to be fitted with the same linear correlation as the majority of the pressure range, although R2-values close to 1 can be obtained. Apparently, this is the result of stronger quenching at lower pressures. Therefore, the different pressure regions were fitted separately giving a linear correlation to each and allowing to compare the quenching rate at different pressures (Table 2; Eu3+@MIL-68(In) and Eu3+@UiO-67(Zr)-bipy as exemplary, for other MOFs, see Table S1†). KSV is increasing with decreasing pressure and is nearly 50 times larger at the lowest measured pressure than in the pressure region closer to ambient pressure and further agreeing with the observations above.
| Eu3+@MIL-68(In) | Eu3+@UiO-67(Zr)-bipy | ||||
|---|---|---|---|---|---|
| p/bar | K SV/bar−1 | R 2 | p/bar | K SV/bar−1 | R 2 |
| 1 × 10⁻⁵ until 1.5 × 10⁻³ | 501 | 0.9841 | 1.345 × 10⁻⁴ until 2.5 × 10⁻³ | 240 | 0.9801 |
| 1.5 × 10⁻³ until 2.5 × 10⁻² | 98.2 | 0.9868 | 2.5 × 10⁻³ until 2.5 × 10⁻² | 51.0 | 0.9903 |
| 2 × 10⁻² until 0.2 | 19.4 | 0.9846 | 2.5 × 10⁻² until 0.2 | 8.64 | 0.9868 |
| 0.2 until 1.02 | 10.6 | 0.9953 | 0.2 until 1.02 | 5.32 | 0.9991 |
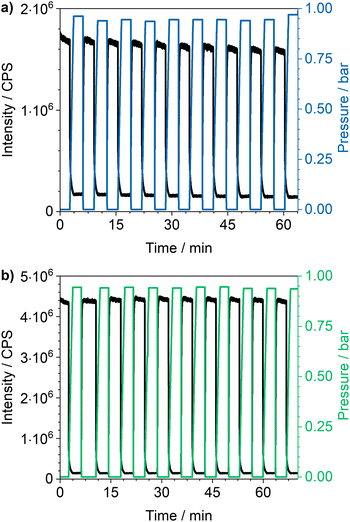
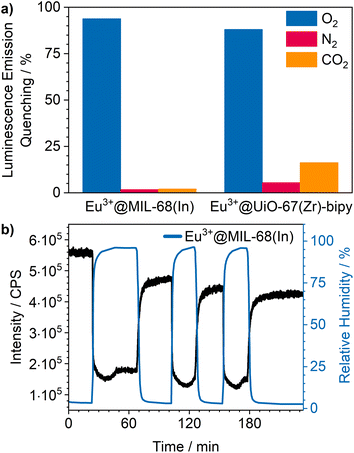
Cycling investigations over ten cycles and 65 min show almost no change between the starting emission intensities and the result of the last cycle for Eu3+@MIL-68(In) and Eu3+@UiO-67(Zr)-bipy. The same high reversibility is observed for the quenching efficiency (Fig. 9). This demonstrates high reversibility of the process and thus high stability and suitability of such sensors for reversible optical on-the-fly sensing. By means of optical processes, the cyclability fits to the assumed quenching process via triplet–triplet energy transfer between the exited linker and oxygen. In the tenth cycle, Eu3+@UiO-67(Zr)-bipy still reached 99.7% of its initial emission intensity in vacuum, while Eu3+@MIL-68(In) shows a decreasing maximum intensity, but still recovers to 90.9% of the origin value. The other MOFs (Fig. S22–S25†) are quenched stronger during cycling with Eu3+@DUT-5(Al) showing the lowest cyclability. Further differences between the investigated MOFs are observed for Eu3+@MIL-100(In) and Eu3+@UiO-67(Zr), which show fluctuating and increasing intensities during relaxation, indicating that the different MOFs require different relaxation times to reach optimal cyclability (for comparison, all MOFs were treated identically). PXRD measurements after sensing (Fig. S26†) do not indicate degradation of the MOF systems under the given conditions. The selectivity of the impregnated MOF systems vs. other atmospheric gases was exemplarily investigated for Eu3+@MIL-68(In) and Eu3+@UiO-67(Zr)-bipy as most-promising candidates from the other parts of this study. The results are depicted in Fig. 10a on the sensitivity of the samples towards nitrogen and carbon dioxide as abundant gases in the atmosphere besides oxygen. The results show that nitrogen hardly influences the emission intensity, and low quenching values may be due to low amounts of contaminants. Since the quenching due to oxygen is so strong, and despite its lower quantity in the atmosphere, this effect can be considered by proper calibration of the sensor, which is also shown by examples in literature, where sensing measurements were carried out in mixtures of oxygen and nitrogen.14,29,30 The luminescence emission quenching by carbon dioxide is also much weaker compared to oxygen with 2.1% (Eu3+@MIL-68(In)) and 16.3% (Eu3+@UiO-67(Zr)-bipy) and can therefore be neglected due to its low abundance in the atmosphere.
Besides these two gases, humidity also needs to be considered, since water is abundant in the atmosphere and further known as a strong vibronic quencher towards lanthanides.56 Since our physisorption device is not able to set different humidity values, we used a different setup8 to evaluate the influence of humidity on Eu3+@MIL-68(In). The results are shown in Fig. 10b. A stream of dry argon passed over the sample and, at a specific point, was diverted through wash battles filled with water to receive a humid atmosphere (96% ± 2%). Further, it was cycled between dry and humid argon stream to check the reversibility. The results show a luminescence emission quenching of 74.5% for a humidity of 96% for Eu3+@MIL-68(In). After reaching this value, the quenching settled in at 66.7%. When changing back to dry argon atmosphere, the intensity instantly started to increase, but did not reach the initial intensity. In the next humid cycles the intensity dropped again, but stayed at values slightly lower than observed in the first cycle and therefore indicating accumulation of water inside the pores of the MOF. This also clearly demonstrates that, for practical use, this sensitivity to water needs to be worked around, e.g., by using conditions of dried air.
Experimental
Synthetic procedures
![[thin space (1/6-em)]](https://www.rsc.org/images/entities/char_2009.gif) 565g, 5 min) and washed thrice with DMF. Lastly, the powder was dried in active vacuum (1 × 10⁻³ mbar) for 10 h.
565g, 5 min) and washed thrice with DMF. Lastly, the powder was dried in active vacuum (1 × 10⁻³ mbar) for 10 h.
![[thin space (1/6-em)]](https://www.rsc.org/images/entities/char_2009.gif) 565g, 10 min), washed with DMF thrice and dried in active vacuum (1 × 10⁻³ mbar) for 4 h.
565g, 10 min), washed with DMF thrice and dried in active vacuum (1 × 10⁻³ mbar) for 4 h.
![[thin space (1/6-em)]](https://www.rsc.org/images/entities/char_2009.gif) :
:![[thin space (1/6-em)]](https://www.rsc.org/images/entities/char_2009.gif) 3
3![[thin space (1/6-em)]](https://www.rsc.org/images/entities/char_2009.gif) :
:![[thin space (1/6-em)]](https://www.rsc.org/images/entities/char_2009.gif) 2) solution (72 mL). The latter was transferred to a pressure tube (Ace Glass 8648-27, 120 mL. Front Seal Plug) and heated to 120 °C (heating/cooling ramp: 2 h/4 h) for 24 h with a heating jacket (Horst MA03078 with HT MC11 controller). The colorless solid was centrifuged (5188g, 5 min) and washed twice with DMF and once with ethanol. Finally, it was dried in active vacuum (1 × 10⁻³ mbar) for 3 h.
2) solution (72 mL). The latter was transferred to a pressure tube (Ace Glass 8648-27, 120 mL. Front Seal Plug) and heated to 120 °C (heating/cooling ramp: 2 h/4 h) for 24 h with a heating jacket (Horst MA03078 with HT MC11 controller). The colorless solid was centrifuged (5188g, 5 min) and washed twice with DMF and once with ethanol. Finally, it was dried in active vacuum (1 × 10⁻³ mbar) for 3 h.
![[thin space (1/6-em)]](https://www.rsc.org/images/entities/char_2009.gif) :
:![[thin space (1/6-em)]](https://www.rsc.org/images/entities/char_2009.gif) 1, 60 mL). After addition of 0.5 mL hydrochloric acid (conc.) the solution was transferred to a pressure tube (Ace Glass 8648-27, 120 mL. Front Seal Plug) and heated to 80 °C (heating/cooling ramp: 2 h/4 h) for 12 h with a heating jacket (Horst MA03078 with HT MC11 controller). The colorless needles were vacuum-filtrated over a fritted glass crucible (Por. 4) and washed three times.
1, 60 mL). After addition of 0.5 mL hydrochloric acid (conc.) the solution was transferred to a pressure tube (Ace Glass 8648-27, 120 mL. Front Seal Plug) and heated to 80 °C (heating/cooling ramp: 2 h/4 h) for 12 h with a heating jacket (Horst MA03078 with HT MC11 controller). The colorless needles were vacuum-filtrated over a fritted glass crucible (Por. 4) and washed three times.
Analytical investigations
![[thin space (1/6-em)]](https://www.rsc.org/images/entities/char_2009.gif) 565g, 5 min). A part of the obtained solution was separated and diluted to half the concentration to exclude matrix effects on the results. The analyte concentration was determined by recording the characteristic wavelengths of Eu (381.967 nm and 412.973 nm). The instrument required 90 min for sample uptake, followed by 30 min for rinsing and 15 min for flow stabilization. This process was repeated after each dilution.
565g, 5 min). A part of the obtained solution was separated and diluted to half the concentration to exclude matrix effects on the results. The analyte concentration was determined by recording the characteristic wavelengths of Eu (381.967 nm and 412.973 nm). The instrument required 90 min for sample uptake, followed by 30 min for rinsing and 15 min for flow stabilization. This process was repeated after each dilution.
For photoluminescence emission lifetime measurements in different atmospheres, the samples were filled into NMR tubes with Young valve (Norell). The tubes were evacuated (1 × 10⁻⁶ bar) and flushed with helium (Nippon gases, 5.0) three times before measuring under vacuum and then filled with 1 bar oxygen (Nippon gases, 5.0). Emission intensity decays were recorded with a Horiba Jobin Yvon Fluorolog 3 spectrometer using the DataStation software and fitted with mono- or biexponential decay with Decay Analysis Software 6.
At first, the sample cell was flushed with helium three times and evacuated to 10−7 bar to measure a reference emission spectrum. Then a physisorption analysis was started containing p/p0 points from 1 × 10⁻⁵ to 0.99. This measurement was carried out at room temperature and p0 was set to 760 mmHg manually to ensure that the points to be collected at the desired absolute pressures. The two measurement PCs were connected in a local network and the program AutoHotkey was used to read out the Autosorb logfile from the Fluorolog PC and automatically start collection of emission spectra when oxygen was dosed to the sample cell. An edge filter (Newport, cutoff wavelength: 395 nm) was used.
Cycling measurements were carried out in the manual mode of the Autosorb and automated with help of some AutoHotkey scripts to log the cell pressure (every 0.5 s) and control the vacuum and O2 valves. The pressure was cycled between a pressure of 1 × 10⁻⁵ bar and about 900 mbar and the corresponding pressures were held for 150 s. The photoluminescence emission intensity at the maximum was logged every 0.1 s with the Fluorolog.
Conclusions
In this work, we present a wide comparison of seven luminescent MOFs illuminating the pros and cons of reversible, optical oxygen sensing based on luminescence quenching by O2. Six archetype MOFs (UiO-66(Zr), UiO-67(Zr), UiO-67(Zr)-bipy, MIL-68(In), MIL-100(In) and DUT-5(Al)) were post-synthetically impregnated with Eu(NO3)3 and compared with a MOF containing Eu3+ as connectivity center (MOF-76(Eu)). Subsequent to impregnation, the MOFs are able to sensitize the parity-forbidden f–f transitions-based emission of Eu3+. The Eu3+ ions are loaded into the pores and statistically distributed within the latter, which was shown by a combined analysis approach of PXRD, Raman and Photoluminescence spectroscopy.All impregnated MOFs show strong quenching in oxygen atmosphere resulting in almost complete luminescence quenching at a pressure of 1 bar. Furthermore, the quenching is already strong at a reduced pressure of 0.2 bar (87.1% for Eu3+@MIL-68(In)) demonstrating the ability to be used as “on-the-fly” sensors due to a “turn-off” effect with no need for an additional detector. Among the investigated samples, DUT-5(Al) was, to the best of our knowledge, the first aluminum-based MOF showing response towards oxygen. Besides the strong quenching, which allows detection of oxygen by the eye, the impregnated MOFs even showed response to an oxygen pressure of only 10−5 bar marking them as highly sensitive. The MOFs with the highest quenching also show the strongest response and therefore highest sensitivity at low pressures. The investigation of the mechanism of the oxygen response starting from high vacuum reveals a quenching behavior indicated by triplet–singlet transfer of dioxygen differing from the usually observed Stern–Volmer kinetics and the already more complex “two site model”. For the first time, different pressure regions were successfully fitted separately. This mechanistic difference is caused by an increase of the quenching rate at lower pressures due to a higher accessibility of the pores. Cycling measurements over ten cycles and >65 min with Eu3+@MIL-68(In) and Eu3+@UiO-67(Zr)-bipy prove excellent reversibility of the process and stability of the selected MOFs as sensors. Investigations for nitrogen and carbon dioxide showed a low cross-sensitivity to both that can be attributed to by sensor calibration, whereas humidity showed a stronger effect marking a limit for humid air investigations. Altogether, this study shows a high overall versatility of the studied archetype MOFs post-synthetically impregnated with Eu3+ ions for a reversible, rapid and robust optical sensing of dioxygen for normal pressure as well as for very low pressures requiring no further activation of the MOF systems.
Conflicts of interest
There are no conflicts to declare.Acknowledgements
The authors gratefully acknowledge the Deutsche Forschungsgemeinschaft for supporting this work within the priority program SPP1928 and the project MU-1562/13-1 “Optical Sensing and Energy Transfer in Luminescent and Conductive COORNET Mixed-Matrix Membranes”. Elisa Monte is gratefully acknowledged for designing the graphical abstract.Notes and references
- S. N. Nangare, A. G. Patil, S. M. Chandankar and P. O. Patil, J. Nanostruct. Chem., 2023, 13, 197–242 CrossRef CAS.
- I. Dalfen and S. M. Borisov, Anal. Bioanal. Chem., 2022, 414, 4311–4330 CrossRef CAS.
- F. Y. Yi, D. Chen, M. K. Wu, L. Han and H. L. Jiang, ChemPlusChem, 2016, 81, 675–690 CrossRef CAS PubMed.
- E. A. Dolgopolova, A. M. Rice, C. R. Martin and N. B. Shustova, Chem. Soc. Rev., 2018, 47, 4710–4728 RSC.
- G. Lan, K. Ni, E. You, M. Wang, A. Culbert, X. Jiang and W. Lin, J. Am. Chem. Soc., 2019, 141, 18964–18969 CrossRef CAS PubMed.
- F. Schönfeld, L. V. Meyer, F. Mühlbach, S. H. Zottnick and K. Müller-Buschbaum, J. Mater. Chem. C, 2018, 6, 2588–2595 RSC.
- Y. Li, Polyhedron, 2020, 179, 114413 CrossRef CAS.
- J. M. Stangl, D. Dietrich, A. E. Sedykh, C. Janiak and K. Müller-Buschbaum, J. Mater. Chem. C, 2018, 6, 9248–9257 RSC.
- Y. Zhang, S. Yuan, G. Day, X. Wang, X. Yang and H. C. Zhou, Coord. Chem. Rev., 2018, 354, 28–45 CrossRef CAS.
- T. K. Pal, Mater. Chem. Front., 2023, 7, 405–441 RSC.
- T. Rasheed and F. Nabeel, Coord. Chem. Rev., 2019, 401, 213065 CrossRef CAS.
- Y. Shen, A. Tissot and C. Serre, Chem. Sci., 2022, 13, 13978–14007 RSC.
- G.-L. Yang, X.-L. Jiang, H. Xu and B. Zhao, Small, 2021, 17, 2005327 CrossRef CAS.
- T. Xia, L. Jiang, J. Zhang, Y. Wan, Y. Yang, J. Gan, Y. Cui, Z. Yang and G. Qian, Microporous Mesoporous Mater., 2020, 305, 110396 CrossRef CAS.
- S.-Y. Liu, X.-L. Qi, R.-B. Lin, X.-N. Cheng, P.-Q. Liao, J.-P. Zhang and X.-M. Chen, Adv. Funct. Mater., 2014, 24, 5866–5872 CrossRef CAS.
- S. Pennacchietti, P. Michieli, M. Galluzzo, M. Mazzone, S. Giordano and P. M. Comoglio, Cancer Cell, 2003, 3, 347–361 CrossRef PubMed.
- L. L. Mantell and P. J. Lee, Mol. Genet. Metab., 2000, 71, 359–370 CrossRef CAS.
- E. Ivers-Tiffée, K. H. Härdtl, W. Menesklou and J. Riegel, Electrochim. Acta, 2001, 47, 807–814 CrossRef.
- P. T. Moseley, Sens. Actuators, B, 1992, 6, 149–156 CrossRef CAS.
- S. R. Morrison, Sens. Actuators, 1987, 12, 425–440 CrossRef CAS.
- M. Eltermann, K. Utt, S. Lange and R. Jaaniso, Opt. Mater., 2016, 51, 24–30 CrossRef CAS.
- T. Tikk, T. Paara, M. Eltermann, A. Krumme, R. Jaaniso, V. Kiisk and S. Lange, Proc. Est. Acad. Sci., 2017, 66, 450–454 CrossRef.
- I. Yoshiya, Y. Shimada and K. Tanaka, Med. Biol. Eng. Comput., 1980, 18, 27–32 CrossRef CAS PubMed.
- X. Wang and O. S. Wolfbeis, Chem. Soc. Rev., 2014, 43, 3666–3761 RSC.
- X. Wang, K. Batra, G. Clavier, G. Maurin, B. Ding, A. Tissot and C. Serre, Chem.–Eur. J., 2023, 29, e202203136 CrossRef CAS PubMed.
- R. Xu, Y. Wang, X. Duan, K. Lu, D. Micheroni, A. Hu and W. Lin, J. Am. Chem. Soc., 2016, 138, 2158–2161 CrossRef CAS PubMed.
- J. An, C. M. Shade, D. A. Chengelis-Czegan, S. Petoud and N. L. Rosi, J. Am. Chem. Soc., 2011, 133, 1220–1223 CrossRef CAS PubMed.
- J. Lehr, M. Tropiano, P. D. Beer, S. Faulkner and J. J. Davis, Chem. Commun., 2015, 51, 15944–15947 RSC.
- X. Qiao, Z. Ma, L. Si, W. Ding and G. Xu, Sens. Actuators, B, 2019, 299, 126978 CrossRef CAS.
- Z. Dou, J. Yu, Y. Cui, Y. Yang, Z. Wang, D. Yang and G. Qian, J. Am. Chem. Soc., 2014, 136, 5527–5530 CrossRef CAS PubMed.
- H. Weng, X. Y. Xu and B. Yan, J. Colloid Interface Sci., 2017, 502, 8–15 CrossRef CAS.
- L. V. Meyer, F. Schönfeld, A. Zurawski, M. Mai, C. Feldmann and K. Müller-Buschbaum, Dalton Trans., 2015, 44, 4070–4079 RSC.
- K. Binnemans, Coord. Chem. Rev., 2015, 295, 1–45 CrossRef CAS.
- X. L. Qi, S. Y. Liu, R. B. Lin, P. Q. Liao, J. W. Ye, Z. Lai, Y. Guan, X. N. Cheng, J. P. Zhang and X. M. Chen, Chem. Commun., 2013, 49, 6864–6866 RSC.
- S. M. Barrett, C. Wang and W. Lin, J. Mater. Chem., 2012, 22, 10329–10334 RSC.
- T. O. Knedel, S. Buss, I. Maisuls, C. G. Daniliuc, C. Schlüsener, P. Brandt, O. Weingart, A. Vollrath, C. Janiak and C. A. Strassert, Inorg. Chem., 2020, 59, 7252–7264 CrossRef CAS PubMed.
- T. Burger, M. V. Hernández, C. Carbonell, J. Rattenberger, H. Wiltsche, P. Falcaro, C. Slugovc and S. M. Borisov, ACS Appl. Nano Mater., 2023, 6, 248–260 CrossRef CAS.
- T. Burger, C. Winkler, I. Dalfen, C. Slugovc and S. M. Borisov, J. Mater. Chem. C, 2021, 9, 17099–17112 RSC.
- X. Y. Dong, Y. Si, J. S. Yang, C. Zhang, Z. Han, P. Luo, Z. Y. Wang, S. Q. Zang and T. C. W. Mak, Nat. Commun., 2020, 11, 1–9 CrossRef PubMed.
- Y. Zhao, Q. Zhang, Y. Li, R. Zhang and G. Lu, ACS Appl. Mater. Interfaces, 2017, 9, 15079–15085 CrossRef CAS PubMed.
- B. Hosseini Monjezi, B. Sapotta, S. Moulai, J. Zhang, R. Oestreich, B. P. Ladewig, K. Müller-Buschbaum, C. Janiak, T. Hashem and A. Knebel, Chem. Ing. Tech., 2022, 94, 135–144 CrossRef CAS.
- I. Senkovska, F. Hoffmann, M. Fröba, J. Getzschmann, W. Böhlmann and S. Kaskel, Microporous Mesoporous Mater., 2009, 122, 93–98 CrossRef CAS.
- N. L. Rosi, J. Kim, M. Eddaoudi, B. Chen, M. O'Keeffe and O. M. Yaghi, J. Am. Chem. Soc., 2005, 127, 1504–1518 CrossRef CAS PubMed.
- M. J. Katz, Z. J. Brown, Y. J. Colón, P. W. Siu, K. A. Scheidt, R. Q. Snurr, J. T. Hupp and O. K. Farha, Chem. Commun., 2013, 49, 9449–9451 RSC.
- L. Li, S. Tang, C. Wang, X. Lv, M. Jiang, H. Wu and X. Zhao, Chem. Commun., 2014, 50, 2304–2307 RSC.
- C. Volkringer, M. Meddouri, T. Loiseau, N. Guillou, J. Marrot, G. Férey, M. Haouas, F. Taulelle, N. Audebrand and M. Latroche, Inorg. Chem., 2008, 47, 11892–11901 CrossRef CAS PubMed.
- T. Stumpf and M. Bolte, Acta Crystallogr., Sect. E: Struct. Rep. Online, 2001, 57, i10–i11 CrossRef CAS.
- J. Hafizovic, M. Bjørgen, U. Olsbye, P. D. C. Dietzel, S. Bordiga, C. Prestipino, C. Lamberti and K. P. Lillerud, J. Am. Chem. Soc., 2007, 129, 3612–3620 CrossRef CAS.
- J. G. Bünzli, E. Moret and J. -R Yersin, Helv. Chim. Acta, 1978, 61, 762–771 CrossRef.
- W. T. Carnall, G. L. Goodman, K. Rajnak and R. S. Rana, J. Chem. Phys., 1989, 90, 3443–3457 CrossRef CAS.
- A. J. Freeman and R. E. Watson, Phys. Rev., 1962, 127, 2058–2075 CrossRef CAS.
- J.-C. G. Bünzli, S. Comby, A.-S. Chauvin and C. D. B. Vandevyver, J. Rare Earths, 2007, 25, 257–274 CrossRef.
- H. Nakai, J. Seo, K. Kitagawa, T. Goto, T. Matsumoto and S. Ogo, Dalton Trans., 2016, 45, 9492–9496 RSC.
- O. Stern and M. Volmer, Phys. Z., 1919, 20, 183–188 CAS.
- E. R. Carraway, J. N. Demas, B. A. DeGraff and J. R. Bacon, Anal. Chem., 1991, 63, 337–342 CrossRef CAS.
- F. Gao, F. Luo, X. Chen, W. Yao, J. Yin, Z. Yao and L. Wang, Microchim. Acta, 2009, 166, 163–167 CrossRef CAS.
- Z. Zhang, Y. Huang, H. Gao, J. Hang, C. Li and P. Liu, J. Membr. Sci., 2020, 598, 117800 CrossRef CAS.
Footnote |
| † Electronic supplementary information (ESI) available: Videos, images of crystal structures, additional powder X-ray diffraction, and photoluminescence emission quenching spectra. See DOI: https://doi.org/10.1039/d3ta05209e |
| This journal is © The Royal Society of Chemistry 2024 |

