 Open Access Article
A robust data analytical method to investigate sequence dependence in flow-based peptide synthesis†
Bálint
Tamás‡
 ,
Pietro Luigi
Willi‡
 ,
Héloïse
Bürgisser
 and
Nina
Hartrampf
 *
*
Department of Chemistry, University of Zurich, Winterthurerstrasse 190, 578057 Zurich, Switzerland. E-mail: nina.hartrampf@chem.uzh.ch
First published on 3rd January 2024
Abstract
Computer-assisted methods, which hold the promise to transform synthetic organic chemistry, are often limited by experimental data lacking in quality, diversity, and quantity. In solid-phase peptide synthesis (SPPS), automated flow chemistry is well-suited to deliver such data, which is key for prediction and optimization of sequence-dependent “difficult couplings”, and insights obtained in flow-SPPS can be transferred to batch-SPPS. The current data analysis techniques rely on the height and the width of fluorenylmethoxycarbonyl (Fmoc) deprotection peaks and perform well under standard conditions. Yet any deviation in parameters (e.g. temperature, flow rate, resin loading) leads to incomplete capture of information and exclusion from the dataset. Here, we present a flexible and robust processing and analysis method that is based on the Gaussian shape of the deprotection peaks to overcome these challenges, which drastically increases the interpretable size of our data set. Using this straightforward method retains the full information and data quality while the generation of hazardous dimethylformamide solvent waste is reduced by 50%. Overall, this work highlights how the interplay between synthetic and computational analysis enables the collection of high-quality data even under non-ideal, non-standard conditions.
Introduction
Peptides are currently experiencing a renaissance in drug discovery,1 and their efficient, high-yielding production by solid-phase peptide synthesis (SPPS) is therefore of interest to both academia and the pharmaceutical industry. While batch-SPPS has been extensively optimized over the past decades to produce peptides of 30–50 amino acids in length,2 the sequence-dependent occurrence of “difficult couplings” requires labor-intensive optimization of synthesis strategies to obtain the desired peptide.3–6 The commonly accepted hypothesis is that those “difficult peptides” form β-sheets and aggregate on resin (Fig. 1A), thus impairing reaction kinetics and diffusion of reagents through the resin (mass transfer).5–8 Efficiency of all successive couplings and deprotections decreases, resulting in side-product formation (truncations and deletions) and low synthesis yields.3,4 Currently, little is known about the relationship between peptide sequence, amino acid protecting groups, synthesis conditions, and aggregation.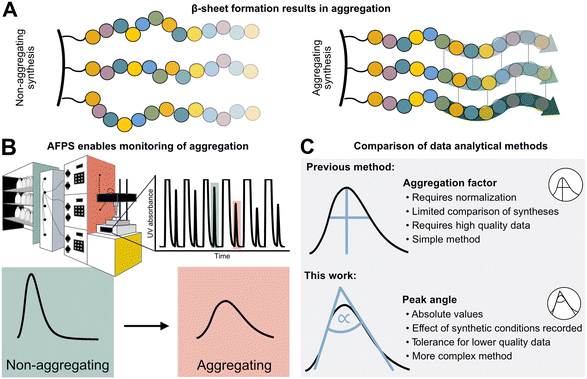 | ||
| Fig. 1 Sequence-dependent aggregation leads to “difficult couplings”, which severely impact solid-phase peptide synthesis (SPPS). A) Aggregation occurs through the formation of β-sheets between growing peptide chains.5,18 B) In-line UV–vis analysis in flow-SPPS allows for monitoring of reaction efficiency and kinetics. C) Aggregation factor analysis of in-line collected UV data based on subtraction of normalized height from normalized width versus peak angle based on the exploitation of the asymmetry and Gaussian character of the peak. | ||
The phenomenon of “difficult sequences” has hampered SPPS since its conception in 1986, and flow chemistry allows for its monitoring (Fig. 1B):3,7,9 while UV–vis monitoring of fluorenylmethyloxycarbonyl (Fmoc)-deprotection steps in batch-SPPS gives indirect information about the coupling success itself (absolute amount of Fmoc removed), flow-SPPS allows to additionally detect aggregation, which is characterized by a broadening of the Fmoc-deprotection peak (deprotection peak shape).10–12 The systematic study of aggregation, however, is impeded by the sheer number of possible sequences. For example, a short 10-mer peptide made up from the 20 naturally occurring amino acids already results in ∼1013 unique sequences. Additionally, 12 of the 20 amino acids carry sidechain protecting groups, required for SPPS, which can be modified without altering the final amino acid sequence itself. Finally, non-canonical amino acids can expand the sequence space in SPPS even further. The features of each building block (functional groups, protecting groups, stereocenters)13 as well as their position in the peptide sequence may impact aggregation during SPPS. A more detailed understanding and prediction of synthesis conditions or preferred building blocks to circumvent aggregation would therefore require a larger data set and advanced data analysis methods.12
High-throughput data analysis is becoming a powerful tool in organic chemistry, especially when coupled with automated reaction setups and in-line data collection.14,15 The latter is crucial for capturing both positive and negative results on automated synthesis platforms,16 and can even be used for the optimization of multistep reactions.17,18 For peptides, an automated fast-flow peptide synthesis (AFPS) platform developed by Pentelute and co-workers allows for the collection of in-line UV–vis data to analyze aggregation (Fig. 1B).19,20 With rapid reaction times enabled by elevated temperatures, AFPS is ideally suited to collect ample analytical data to ultimately decipher the cause of aggregation.12 Current data processing methods use the height and the width of the Fmoc-deprotection signals. However, this method is best suited to data sets showing defined UV-trace baseline resolution—without peak oversaturation—and using standardized synthesis conditions (e.g., flow rate and coupling temperature). Any data collected under non-standard synthesis conditions, or showing non-ideal raw data (e.g., saturated and non-baseline resolved peaks) therefore cannot be analyzed, leading to significant shrinking of the interpretable data set.12 Washing steps with excessive amounts of hazardous dimethylformamide (DMF) solvent are, for example, required to obtain interpretable data with baseline-resolved peaks, even though these steps are likely not required for SPPS itself. New data processing methods are therefore needed to handle non-standard and non-ideal data sets, in order to maximize workflow and solvent efficiency.
We now report the development of a new and robust data processing and analysis method for in-line UV data collected in flow-SPPS (Fig. 1C). Previous methods to analyze these data are characterized by two major limitations: (1) a normalization step is required, which leads to information loss (e.g., on the impact of temperature, solvent volume, resin, and linker) as well as error propagation, and (2) analyzing the difference between peak height and width at half maximum (“aggregation factor”) requires exact knowledge and determination of peak baseline and height, leading to exclusion of many “saturated” or unresolved peaks using previous processing methods. To overcome these limitations, we based our new method on the Gaussian shape of the deprotection peaks, rather than their height and width. Using this method, we investigate the resin loading- and temperature-dependence of aggregation and “difficult sequences” in flow-SPPS, and demonstrate that these findings also directly translate to batch-SPPS.3,4,7 The robustness of our new method furthermore enables analysis of saturated and non-baseline resolved peaks, which ultimately results in a 50% reduction of hazardous DMF used in flow-SPPS without losing analytical information.
Results
The Gaussian character of the deprotection peak can be used to determine the peak angle
We first set out to develop a processing method based on the Gaussian character of the deprotection peak to eliminate the need for normalization and to capture absolute information on aggregation during SPPS. For this purpose, individual asymmetric peaks were first isolated, then split at their maxima, and both halves were mirrored to form corresponding Gaussian-like peaks (Fig. 2). The mirrored peaks, representing the front and tail of the deprotection peak, were trimmed at their minima and set to zero. Afterwards, a Gaussian function A was fitted separately on both the front and the tail mirror peaks (Fig. 2i). The fitting had an average R2 of 0.97 over the data set used (all the data collected in our laboratory), demonstrating accurate approximation of the peak shape. Next, its inflection point was calculated from the maximum of the derivative (Fig. 2ii). At the inflection point, the arctangent of the reciprocal of the derivative was calculated and the angle at the top of the peak was obtained. This was done for both front and tail mirrored peaks, the sum of which gave the peak angle to describe the Fmoc-deprotection peak shape (Fig. 2iii). This fitting captures the broadening of the deprotection peak independent of its height and width.
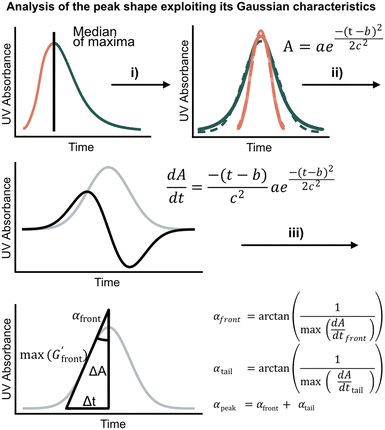 | ||
Fig. 2 Analyzing the peak angle to obtain absolute values on Fmoc-deprotection peak broadening. i) The peak front and tail are separated at the median of its maxima. Both are mirrored and a parameterized Gaussian function (A = recorded UV absorption, t = time, and a, b, c = fitted parameters) is fitted on them separately (dashed line). ii) The function is differentiated with respect to time  to give the first derivative (black line) of the fitted Gaussian (grey line). iii) The gradient is determined at the inflection point (maximum of the derivative) and the peak angles are calculated as shown in the formula. The angle belonging to the front and tail of the peak are summed to obtain the peak angle describing the full peak. For a more detailed description of peak angle fitting see ESI† chapter 2. to give the first derivative (black line) of the fitted Gaussian (grey line). iii) The gradient is determined at the inflection point (maximum of the derivative) and the peak angles are calculated as shown in the formula. The angle belonging to the front and tail of the peak are summed to obtain the peak angle describing the full peak. For a more detailed description of peak angle fitting see ESI† chapter 2. | ||
Standardization enables improved comparison between different syntheses
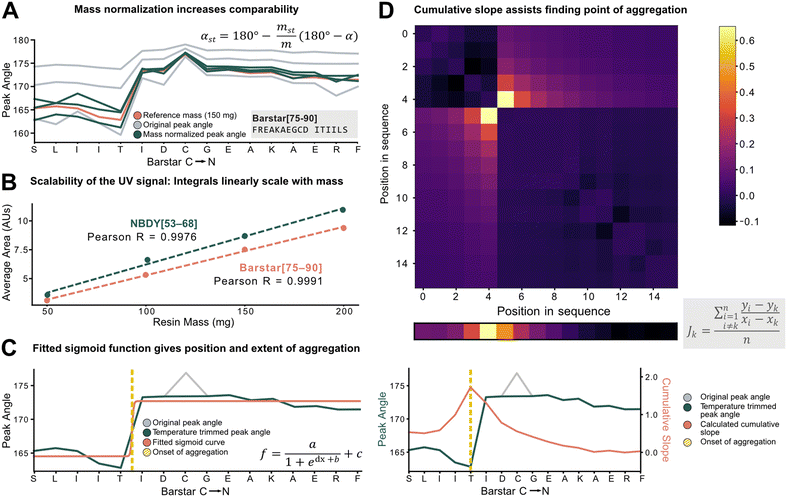
To characterize aggregation, analytical methods need to capture the point at which large and sustained peak broadening starts (onset of aggregation), and to quantify the severity of aggregation. For the development of these methods, however, the data set must be unified and standardized without losing absolute information on aggregation.The total amount of resin with a given loading has a major effect on the Fmoc-deprotection peak area and angle but should not have an impact on aggregation itself. Therefore, to standardize across a data set with varying resin amounts, we investigated the introduction of a mass correction factor. To confirm that the absolute resin mass (with identical loading) does not impact aggregation, Barstar[75–90] (aggregating) and NBDY[53–68] (non-aggregating) were synthesized on various resin masses (50, 100, 150, 200 mg, resin loading = 0.41 mmol g−1). By in-line UV–vis analysis, an excellent linear correlation between resin mass, the integral of the deprotection peak, as well as the peak angle was observed with no impact on crude peptide purity from each experiment (see ESI3.1.1†). Owing to the peak angle's (α) approximate linear scaling with mass (m), an arbitrary “standard mass” (mst) of 150 mg resin was chosen, and all other syntheses were scaled accordingly. The calculated mass correction factor was then implemented into the peak angle function, giving a “resin mass-independent peak angle” (αst) (see Fig. 3A). In addition to the definition of a mass correction factor, the linear correlation of deprotection integral by in-line UV–vis and the resin mass (Fig. 3B) allows for the indirect determination of resin loading and the prediction of truncation and deletion side-products (see ESI2.7†).
Next, individual outlier peaks from temperature differences, originating from tailored synthesis conditions for the coupling of sensitive or racemization–prone amino acids (e.g., cysteine and histidine couplings) had to be filtered out to improve the detection of permanent increases in peak angle. These isolated “spikes” in the UV–vis data can mislead aggregation detection methods as they introduce a point with increased peak angle owing to the reduced reaction rate and diffusion. For couplings and deprotections performed outside of a ±20% window of the mean temperature of the whole synthesis, the value of the peak angle was therefore replaced by the mean of the two closest neighbors within the temperature range (see ESI2.4†). After applying the developed standardization functions, the unified data set was used to investigate analytical methods to define and characterize aggregation (e.g., point of onset and severity). Two methods were developed, both with different scopes and limitations: method A involves fitting of a sigmoid function onto the peak angle trace (Fig. 3C). The sigmoid was implemented because of its monotonically increasing characteristic whereby its point of inversion would be fitted onto the onset of aggregation. Its advantage and disadvantage both lie in its simplicity: outliers throughout the synthesis are ignored, avoiding their influence on the aggregation detection, and a relative value is assigned to the extent of aggregation. However, it is not suitable to detect multiple aggregation events within the same synthesis and is also misled by gradually increasing peak angles. Method B (Fig. 3D) is a pointwise summation of the slope of a peak angle with respect to all other peak angles divided by the peptide length. The major advantage of this method lies in its capability to detect multiple aggregation events, while its disadvantage is increased sensitivity to sharp non-permanent increases in angle, leading to false aggregation detection.
The ideal choice of aggregation detection method is dependent on the envisaged application: method A performs better for smaller, noisier datasets with simpler peptides, whereas higher-quality datasets with longer peptides could be preferably analyzed using method B. In the next step, the developed methods were applied to investigate the impact of various reaction parameters on aggregation.
Peak angle gives additional insights into the effect of resin loading and volume on aggregation
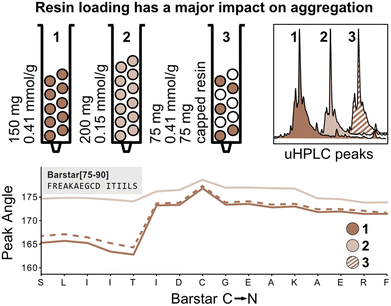
The peak angle function eliminates the need for normalization with the first deprotection peak and can therefore be used to capture absolute information on aggregation during peptide synthesis. We therefore next investigated the absolute effect of resin loading and volume on aggregation.3,4 It is presumed that lower resin loading generally leads to reduced β-sheet formation by increasing the distance between growing peptide strands, thereby hindering aggregation. To confirm this hypothesis, Barstar[75–90] was synthesized on high-loading (0.41 mmol g−1, 150 mg resin, 61.5 mmol) (Fig. 4; reactor 1) and low-loading resin (0.15 mmol g−1, 150 mg resin, 22.5 mmol) (Fig. 4; reactor 2). As expected, synthesis on low-loading resin showed reduced aggregation confirming correlation of increased resin loading with increased aggregation, likely due to interactions between neighboring peptide strands. Analysis of UHPLC after resin cleavage and global deprotection of the peptides confirmed that synthesis on low-loading resulted in cleaner peptide crude purities than synthesis on high-loading resin (see Fig. 4).Next, we investigated the impact of the total resin volume and the total number of deprotected sites on peak broadening. We previously determined that different amounts of resin (same resin loading) lead to a linear increase of the peak angle, however, it was not clear if this increase originates from an increased amount of Fmoc from the high-loading resin or from increased diffusion through the larger resin volume (see Fig. 3). We therefore synthesized Barstar[75–90] on a 1![[thin space (1/6-em)]](https://www.rsc.org/images/entities/char_2009.gif) :
:![[thin space (1/6-em)]](https://www.rsc.org/images/entities/char_2009.gif) 1 mixture of SPPS resin with an unreactive, capped resin to give an average loading of ≈0.20 mmol g−1 (150 mg resin, 30.0 mmol) (Fig. 4; reactor 3). Reactors 1 and 3 have the same loading on individual resin particles and the same resin volume, but a different number of “reactive sites”. Interestingly, the peak angle determined by in-line UV–vis analysis shows identical results for high-loading and “mixed” loading resin, indicating that the total number of reactive sites with the same loading does not have a significant impact on peak broadening, whereas resin volume does. As determined during the development of the mass correction factor, this effect is only observed by in-line UV–vis analysis and has no impact on aggregation.
1 mixture of SPPS resin with an unreactive, capped resin to give an average loading of ≈0.20 mmol g−1 (150 mg resin, 30.0 mmol) (Fig. 4; reactor 3). Reactors 1 and 3 have the same loading on individual resin particles and the same resin volume, but a different number of “reactive sites”. Interestingly, the peak angle determined by in-line UV–vis analysis shows identical results for high-loading and “mixed” loading resin, indicating that the total number of reactive sites with the same loading does not have a significant impact on peak broadening, whereas resin volume does. As determined during the development of the mass correction factor, this effect is only observed by in-line UV–vis analysis and has no impact on aggregation.
Aggregation during SPPS is dependent on temperature, and independent of the synthesis method (e.g., in batch or flow)
Using the absolute peak angle values, the effect of temperature on aggregation was explored, through synthesis of Barstar[75–90] at 60, 75, and 90 °C. While the onset of aggregation was similar across all syntheses, peak sharpness decreased at lower temperatures during synthesis (Fig. 5A). Coupling efficiency, represented by deprotection peak integrals, is comparable until the onset of aggregation, where integrals decrease more significantly at lower temperatures. This correlates with peptide crude purity according to UHPLC analysis (see ESI3.3†). While non-aggregating peptides show less dependence on synthesis temperature, for aggregating peptides every coupling past the onset of aggregation is significantly impacted, leading to an increased accumulation of side-products (truncations and deletions) at decreased temperature. Extrapolating these results further, high coupling temperatures should have a positive impact on crude purity of aggregating peptides, and little impact on non-aggregating peptide sequences.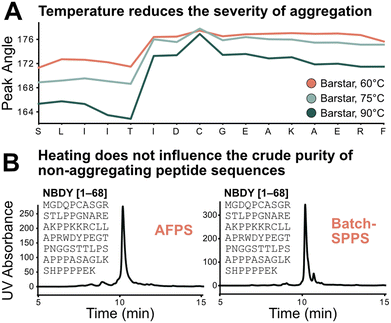 | ||
| Fig. 5 Test of the sequence vs. parameter dependence of the aggregation characteristics of peptides. A) Temperature does not change the point of aggregation but alters its synthetic effect: the lower the temperature the more significant the drop in coupling efficiency after onset of aggregation; this also translates to synthetic purity (see ESI3.3†). B) Demonstration of sequence dependence of aggregation: 68 amino acid-long non-aggregating microprotein NBDY was synthesized on AFPS and batch-SPPS. Both syntheses show similar side-product profiles by LCMS and UHPLC. | ||
The transferability of results from flow-SPPS to batch-SPPS (at room temperature) was investigated next. To this end, a non-aggregating protein (NBDY, 68 amino acids, see Fig. 5B)21 and a short aggregating sequence (Barstar[75–90], see ESI†)20 were prepared by both AFPS and batch-SPPS. As expected, AFPS synthesis of NBDY results in high crude purity (63%, see ESI3.4†) due to the lack of aggregation. Strikingly, batch-SPPS of NBDY using standard methods (coupling conditions: 5 eq. amino acid, 23 °C, 30 min) also showed excellent crude purity (66%). For the aggregating peptide Barstar[75–90], both batch-SPPS and AFPS syntheses show almost identical side-product profiles (see ESI3.4†), resulting in crude purities of ∼55%. Overall, these results support the notion that the onset of aggregation mostly depends on the sequence, and not on the synthesis method (batch vs. flow).3,4,7 Insights obtained from in-line UV analysis in the AFPS can therefore directly be translated to the more common method of batch-SPPS.
New data processing method allows halving solvent consumption without loss of information
The peak angle can be used to analyze data previously categorized “low quality”, which significantly increases the size of the interpretable dataset. It allows for extrapolation of oversaturated peaks because it still yields acceptable accuracy when fitted on the lower section of a deprotection peak. As a showcase, a Barstar[75–90] synthesis was “artificially saturated”: the UV–vis trace of was gradually trimmed from the highest recorded UV absorbance values of the deprotection peaks to introduce the saturation in silico. Upon removing 20% of the tallest peak, the aggregation factor starts to sharply decrease in accuracy, reaching an R2 of 0 at approximately 25% of the peak removed. The peak angle still shows an R2 of 0.8 at 40% oversaturation. Here, 60% of the peak can be removed before an R2 of 0 is reached. This method expands the synthesis scale that can be used on AFPS without losing valuable analytical data (Fig. 6A).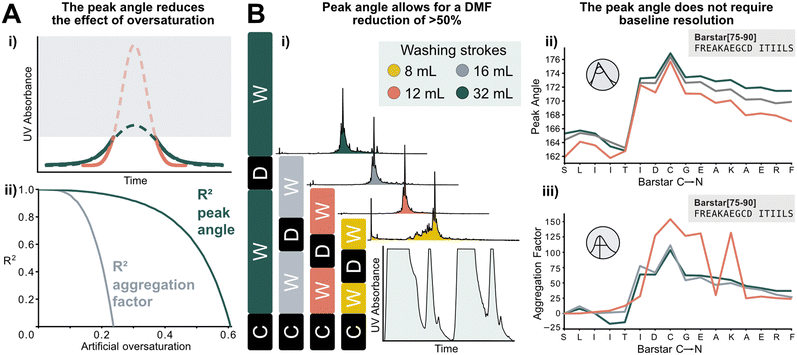 | ||
| Fig. 6 New data processing method tolerates saturated and non-baseline resolved signals. A) i) Method for extrapolating oversaturated UV signals: the maximum value is removed, and mirrored at its median, and similarly to non-saturated peaks a Gaussian function is fitted. All following steps are identical to peaks shown in Fig. 1. ii) Difference between analysis of increasingly oversaturated deprotection peaks: in-line collected UV–vis is artificially trimmed at gradually decreasing percentages of the tallest peak. R2 is computed between the peak angle and the aggregation factor of original and oversaturated UV signal. At only 20% oversaturation, R2 of the aggregation factor is significantly decreased compared to the unsaturated signal. See ESI2.8† for an artificially oversaturated signal example ESI2.8.† B) Reduction of washing volume: i) reduced washing volume results in decreased baseline resolution, as indicated by the gray areas on the smaller plot (C: coupling, W: washing, D: deprotection). Effect of DMF washing volumes on peptide purity (measured by UHPLC@214 nm): reduction to 16 or 12 mL does not affect crude purity. The plot in the bottom right corner shows the significant change in the baseline resolution of the deprotection which is the source of the data loss. ii) The peak angle shows consistent result across all applicable volumes; iii) despite similar synthetic efficiency at 12 mL washing volumes/coupling cycle, aggregation factor fails to reliably detect aggregation owing to the unresolved baseline. | ||
Using the peak angle also removes the requirement for baseline resolution, which significantly reduces the amount of solvent used in AFPS and decreases total synthesis time. In the past, excessive quantities of DMF (32 mL) were required in the washing steps between couplings and deprotections to maintain good data quality. It was unclear, however, if these extended washing steps were required for synthesis success. Before comparing the two data processing methods, the effect of washing volume reduction on the purity of the synthesized peptide was tested: reducing the washing volume by 50% (to 16 mL DMF) and even 63% (to 12 mL DMF) during aggregating test peptide Barstar[75–90] synthesis does not impact purity, this occurs only at 75% (8 mL DMF) (Fig. 6Bi). We next compared the peak angle and aggregation factor's capability of capturing peak broadening during these syntheses. At 50% solvent reduction, both peak angle and aggregation factor have sufficient accuracy. With 12 mL of washing volume the aggregation factor could not capture aggregation accurately anymore, (Fig. 6Biii), while the peak angle retains similar trends as observed with higher washing volume quantities (Fig. 6Bii). Through these reduced washing steps, overall DMF consumption of a synthetic cycle was decreased by 50%, and the synthesis time by approximately 33%, while retaining peptide crude purity and efficiency of UV analysis.
Conclusions
The described data processing method can recover information about syntheses previously considered lost or unusable. As opposed to existing methods, the fitting of a Gaussian function and the derived peak angle allow accurate data extraction even under non-standard synthesis conditions that cause oversaturation or lack of baseline resolution (Fig. 3). This enables more sustainable synthesis by reducing solvent usage by 50% and synthesis time by 33% while still returning interpretable, reliable data. In addition, the non-normalized nature of the peak angle allowed investigating the absolute impact of specific parameters on synthesis, particularly at the beginning of the sequence. This, while being one of the peak angle's advantages, can also exaggerated the effect of parameters such as resin mass. Therefore, a correction factor was introduced to reduce its impact on the peak angle. Furthermore, analytical methods to consistently and robustly detect the onset of aggregation—which is characterized by sudden, sustained broadening of the peak angles—were developed. One method is based on the average of slopes between the angles, the other on the fitting of a sigmoid on the peak angles. Both methods allow for a compression of the peak angle data into position and magnitude of aggregation, which will be required for large-scale data analysis efforts.A systematic investigation of parameters provides additional insight into their effect on aggregation. We were not only able to transfer the statements published by Kent4 and Milton3 on aggregation from batch- to flow-SPPS but also gained additional insights. Aggregation decreases coupling efficiency, resulting in lower crude purity: the non-aggregating NBDY[53–68] had a 10–15% decline in the deprotection peak integrals, but aggregating peptide Barstar[75–90] showed a decline of 30–40%, which directly translates to their crude purity (see ESI†). It was furthermore determined that aggregation is independent of synthetic strategy, conditions, or used amino acid equivalents but mainly sequence- and loading dependent (Fig. 5B). We finally also determined that synthesis temperature (in addition to accelerating reaction kinetics) almost exclusively had an impact on coupling efficiency past the onset of aggregation. Taking these results into consideration, the largest impact on solving “difficult sequences” in SPPS is expected from understanding the contribution of individual amino acid building blocks, however, owing to the large sequence space, this will require a large amount of data.
Organic chemistry data sets for large-scale analysis are scarce, and there is currently a disconnect between the collection of data by synthetic organic chemists and computational scientists using these analytical data. While experimental chemists optimize their workflows for ideal reaction outcomes (minimized reagents and reaction times, non-standardized analytics, lack of negative data), computational scientists require standardized, “interpretable” analytical data. Advanced data analysis methods that make use of seemingly low-quality data are therefore needed to collect a dataset that is sufficient in diversity and size. We demonstrated the importance of processing and analysis methods for the improvement of reaction time, reagent consumption, and the identification of challenging couplings. In the future, several potential applications can be envisaged: 1) expansion to other analytical techniques such as resin volume monitoring,22 IR,23 or refractive index24 for peptide chemistry, as these are either yet to be adapted or widely used. 2) Investigation of other sequence-defined polymer synthesis methods (e.g., for polysaccharides or oligonucleotides). Once established, advanced in-line analytical methods furthermore hold the potential for real-time optimization in flow thus eliminating the need for sequence-dependent trial and error optimization campaigns.
Author contributions
The project was conceptualized by N. H. and B. T.; experimental data was collected by B. T., P. L. W. and H. B.; the program for data analysis was written by P. L. W.; data curation and validation of the program was carried out by B. T. and P. L. W.; formal analysis was carried out by P. L. W.; the manuscript was written by N. H., B. T., and P. L. W. with input from H. B.Conflicts of interest
There are no conflicts to declare.Acknowledgements
We are grateful for funding from the Swiss National Science Foundation (grant no. 200021_200865) and the University of Zurich. We would like to thank E. T. Williams, K. Schiefelbein, and V. E. Freiburghaus for proofreading of the manuscript and helpful discussions. All past and present members of the Hartrampf group are acknowledged for the accumulated synthesis data that was used in this project. We would furthermore like to thank K. Bodroghy for helping to clean up the code.Notes and references
- T. K. Sawyer, Renaissance in peptide drug discovery: the third wave, Royal Society of Chemistry, 2017, vol. 59 Search PubMed.
- S. B. H. Kent, Chem. Soc. Rev., 2009, 38, 338–351 RSC.
- R. C. de L. Milton, S. C. F. Milton and P. A. Adams, J. Am. Chem. Soc., 1990, 112, 6039–6046 CrossRef CAS.
- S. B. Kent, Annu. Rev. Biochem., 1988, 57, 957–989 CrossRef CAS PubMed.
- T. Wöhr, F. Wahl, A. Nefzi, B. Rohwedder, T. Sato, X. Sun and M. Mutter, J. Am. Chem. Soc., 1996, 118, 9218–9227 CrossRef.
- M. Paradís-Bas, J. Tulla-Puche and F. Albericio, Chem. Soc. Rev., 2016, 45, 631–654 RSC.
- S. B. H. Kent, Peptides, Structure and Function. Proceedings of the Ninth American Peptide Symposium, Pierce Chemical Company, Rockford, Illinois, US, 1985, pp. 407–414 Search PubMed.
- C. Hyde, T. Johnson, D. Owen, M. Quibell and R. C. Sheppard, Int. J. Pept. Protein Res., 1994, 43, 431–440 CrossRef CAS PubMed.
- W. S. Hancock, D. J. Prescott, P. R. Vagelos and G. R. Marshall, J. Org. Chem., 1973, 38, 774–781 CrossRef CAS.
- T. J. Lukas, M. B. Prystowsky and B. W. Erickson, Proc. Natl. Acad. Sci. U. S. A., 1981, 78, 2791 CrossRef CAS PubMed.
- E. Atherton and R. C. Sheppard, Peptides, Structure and Function. Proceedings of the Ninth American Peptide Symposium, Pierce Chemical Company, Rockford, Illinois, US, 1985, pp. 415–418 Search PubMed.
- S. Mohapatra, N. Hartrampf, M. Poskus, A. Loas, R. Gómez-Bombarelli and B. L. Pentelute, ACS Cent. Sci., 2020, 6, 2277–2286 CrossRef CAS PubMed.
- E. Atherton, V. Woolley and R. C. Sheppard, J. Chem. Soc., Chem. Commun., 1980, 970–971 RSC.
- C. W. Coley, N. S. Eyke and K. F. Jensen, Angew. Chem., Int. Ed., 2020, 59, 22858 CrossRef CAS PubMed.
- C. W. Coley, N. S. Eyke and K. F. Jensen, Angew. Chem., Int. Ed., 2020, 59, 23414 CrossRef CAS PubMed.
- E. Shim, J. A. Kammeraad, Z. Xu, A. Tewari, T. Cernak and P. M. Zimmerman, Chem. Sci., 2022, 13, 6655–6668 RSC.
- C. W. Coley, D. A. Thomas, J. A. M. Lummiss, J. N. Jaworski, C. P. Breen, V. Schultz, T. Hart, J. S. Fishman, L. Rogers, H. Gao, R. W. Hicklin, P. P. Plehiers, J. Byington, J. S. Piotti, W. H. Green, A. J. Hart, T. F. Jamison and K. F. Jensen, Science, 2019, 365, eaax1566 CrossRef CAS PubMed.
- A.-C. Bédard, A. Adamo, K. C. Aroh, M. G. Russell, A. A. Bedermann, J. Torosian, B. Yue, K. F. Jensen and T. F. Jamison, Science, 2018, 361, 1220 CrossRef PubMed.
- A. J. Mijalis, D. A. Thomas III, M. D. Simon, A. Adamo, R. Beaumont, K. F. Jensen and B. L. Pentelute, Nat. Chem. Biol., 2017, 13, 464 CrossRef CAS PubMed.
- N. Hartrampf, A. Saebi, M. Poskus, Z. P. Gates, A. J. Callahan, A. E. Cowfer, S. Hanna, S. Antilla, C. K. Schissel, A. J. Quartararo, X. Ye, A. J. Mijalis, M. D. Simon, A. Loas, S. Liu, C. Jessen, T. E. Nielsen and B. L. Pentelute, Science, 2020, 368, 980 CrossRef CAS PubMed.
- Z. Na, Y. Luo, J. A. Schofield, S. Smelyansky, A. Khitun, S. Muthukumar, E. Valkov, M. D. Simon and S. A. Slavoff, Biochemistry, 2020, 59, 4131–4142 CrossRef CAS PubMed.
- E. T. Sletten, M. Nuño, D. Guthrie and P. H. Seeberger, Chem. Commun., 2019, 55, 14598–14601 RSC.
- B. D. Larsen, D. H. Christensen, A. Holm, R. Zillmer and O. F. Nielsen, J. Am. Chem. Soc., 1993, 115, 6247–6253 CrossRef CAS.
- B. G. de la Torre, S. Ramkisson, F. Albericio and J. Lopez, Org. Process Res. Dev., 2021, 25, 1047–1053 CrossRef.
Footnotes |
| † Electronic supplementary information (ESI) available. See DOI: https://doi.org/10.1039/d3re00494e. The python code is available at: https://github.com/Hartrampf-Lab/AggregationAnalysis. |
| ‡ These authors contributed equally to the project. |
| This journal is © The Royal Society of Chemistry 2024 |

