 Open Access Article
Creative Commons Attribution 3.0 Unported Licence
Cooperative small molecule activation by apolar and weakly polar bonds through the lens of a suitable computational protocol
Diego
Sorbelli
 *a,
Leonardo
Belpassi
 *b and
Paola
Belanzoni
 *bc
*bc
aPritzker School of Molecular Engineering, University of Chicago, 5640 South Ellis Avenue, Chicago, IL 60637, USA. E-mail: dsorbelli@uchicago.edu
bCNR Institute of Chemical Science and Technologies “Giulio Natta” (CNR-SCITEC), Via Elce di Sotto, 8 – 06123, Perugia, Italy. E-mail: leonardo.belpassi@cnr.it
cDepartment of Chemistry, Biology and Biotechnology, University of Perugia, Via Elce di Sotto, 8 – 06123, Perugia, Italy. E-mail: paola.belanzoni@unipg.it
First published on 15th December 2023
Abstract
Small molecule activation processes are central in chemical research and cooperativity is a valuable tool for the fine-tuning of the efficiency of these reactions. In this contribution, we discuss recent and remarkable examples in which activation processes are mediated by bimetallic compounds featuring apolar or weakly polar metal–metal bonds. Relevant experimental breakthroughs are thoroughly analyzed from a computational perspective. We highlight how the rational and non-trivial application of selected computational approaches not only allows rationalization of the observed reactivities but also inferring of general principles applicable to activation processes, such as the breakdown of the structure–reactivity relationship in carbon dioxide activation in a cooperative framework. We finally provide a simple yet unbiased computational protocol to study these reactions, which can support experimental advances aimed at expanding the range of applications of apolar and weakly polar bonds as catalysts for small molecule activation.
Introduction
Activation of inert and abundant small molecules is a central topic in chemical research. These processes are critical for a variety of pressing issues, such as production of fuels, energy storage and conversion, removal of environmentally hazardous and toxic gases from the atmosphere and their use as synthetic building blocks.1Notably, the design and implementation of efficient and sustainable strategies to target small molecule activation is challenging, particularly because these substrates can be relatively inert. This has engaged researchers for decades: a multitude of successful approaches have been developed over the years, resulting in a myriad of strategies to activate small molecules both in heterogeneous and homogeneous phase. The latter processes, especially, are highly desirable since they usually enable high selectivity towards these substrates, as well as allowing the implementation of flexible design rules for improving the activity of the species. In this context, well-established and successful approaches encompass (among others) frustrated Lewis pairs,2,3 main group ambiphiles,4 low-valent main group species,5–7 transition metal complexes with redox-active ligands8 and homo- or heterobimetallic compounds.9–11 Particularly, for CO2 capture and conversion, attempts by photochemical activation in catalytic transformations deserve to be mentioned.12–15
Bimetallic species have received a lot of attention in this scenario since the introduction of a second metal moiety implements an additional tunable parameter that makes the design of these compounds even more flexible. In fact, cooperative reactivity in metal–metal bonds can be also finely modulated by tuning the degree of cooperativity between the two centres (single-site vs. multi-site reactivity) and the metal–metal bond order and polarity.9,10
When dealing with such activation processes, there is an intricate relationship between the structure and the electronic properties of the bimetallic compound and their matching with the electronic properties of the small molecule substrate. In this context, a synergic effort between experiments and theoretical calculations is essential to sketch such a complex picture. Computational endeavours aim at providing not only an accurate description of the possibly unusual and intricate reaction mechanisms that occur in this environment, but also an unbiased description of the electronic properties of the species involved – both the small molecule and the active species – so that they can reinforce and drive experimental discovery.
In this Contribution we report relevant recent breakthroughs in the cooperative activation processes mediated by either weakly polar or apolar bonds in electron rich bimetallic compounds. By discussing the activation of relevant small molecules separately (carbon dioxide, dihydrogen, nitrous oxide, alkynes, water, ammonia), we illustrate the main experimental advances together with detailed theoretical insights, highlighting findings that subvert previously established paradigms both in small molecule activation and in traditional catalytic processes mediated by a single metal moiety. Ultimately, we provide, based on our recent findings, a combined computational protocol that should help the readership navigate through the intricate realm of cooperative activation processes by relying on the ad hoc application of popular and available electronic structure analysis tools.
Carbon dioxide activation
The activation of carbon dioxide is a central and urgent matter in chemical research. CO2 is, indeed, on one hand a hazardous greenhouse gas (its atmospheric concentration increased dramatically in the last few years over 400 ppm).16 On the other hand, it is, from a thermodynamical standpoint, an extremely stable molecule (
![[thin space (1/6-em)]](https://www.rsc.org/images/entities/char_2009.gif) 17), thus its activation, capture and eventual use as a C1 building block are mostly hindered by its inertness.
17), thus its activation, capture and eventual use as a C1 building block are mostly hindered by its inertness.
Several cooperative CO2 activation processes have been reported. Most of these reactions feature the presence of homobimetallic compounds in homogeneous phase, where the apolar M–M bond (M = block s, p or d metal) acts to capture and/or reduce carbon dioxide. A couple of relevant and representative examples are given in Scheme 1, consisting in the cooperative reactivity towards CO2 of two Mg(I) units in a Mg–Mg complex (1, Scheme 1), that results in the high yield formation of the Mg(II) carbonate complex 2,18 and the reductive oxygenation of CO2 by a Ti–Ti double bond in the dititanium complex 3.19
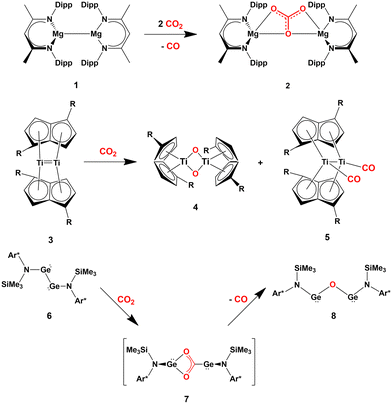 | ||
| Scheme 1 Relevant examples of cooperative CO2 activation with s- (1), d- (3) and p-block (6) homobinuclear compounds featuring apolar E–E bonds. (R = SiiPr3; Ar* = C6H2{C(H)Ph2}2Me-2,6,4). | ||
These examples are instructive since, in both cases, computational studies have followed experimental findings to elucidate the central role of the M–M (M = Mg, Ti) σ non-polar bonds serving as an electron reservoir populating the LUMO of carbon dioxide and driving its activation.20,21
Further evidence in this direction comes from the extensive experimental and computational insights into the activation of carbon dioxide mediated by apolar bonds that has been obtained upon the study of CO2 capture and reduction by p-block cooperation in Group 14 dimetallenes and dimetallynes featuring apolar E–E (E = Si, Ge, Sn) bonds.22 One of the first examples is the reactivity of a sterically hindered digermyne 6 (Scheme 1), which has been reported to insert CO2 into the Ge–Ge bond (intermediate 7) and to further reduce it to CO at temperatures as low as −40 °C (8).23
In the pivotal work by Frenking and coworkers, the mechanism of this reduction has been thoroughly explored using spectroscopic and computational techniques. Subsequently, various examples of the reactivity of CO2 with apolar bonds in the field of homodinuclear main-group element species have been reported. For instance, pincer-ligand supported dimetallynes [ArNEt2E]2 (E = Ge, Sn, ArNEt2 = C6H3(CH2NEt2)2-2,6) have been shown to reversibly react with CO2 under mild conditions to generate insertion compounds of the type [ArNEt2E(CO2)EArNEt2].24 Analogous to digermynes, the products are not stable at ambient temperature and, after uptaking of a second CO2 molecule, they convert into the corresponding carbonate compounds with accompanying generation of CO.
Only very recently, a few examples of unconventional heterobimetallic compounds featuring weakly polar M–M′ bonds, i.e. metal–aluminyls, have been reported to insert CO2 into their M–Al bonds (see 9–14 in Scheme 2).
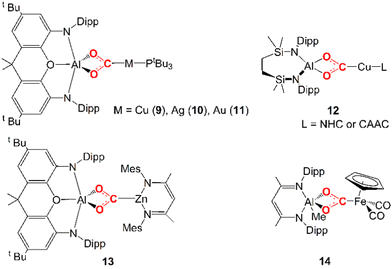 | ||
| Scheme 2 Experimentally reported examples of complexes derived from CO2 insertion into Al–M (M = Cu, Ag, Au, Zn, Fe) bonds. | ||
In 2019, Hicks and coworkers reported the CO2 insertion into an Al–Au bond in the [tBu3PAuAl(NON)] (NON = 4,5-bis(2,6-diisopropylanilido)-2,7-di-tert-butyl-9,9-dimethylxanthene) complex (11 in Scheme 2).25 Subsequently, in 2021, Aldridge and coworkers disclosed analogous reactivity of the Al–Cu and Al–Ag bonds in the [tBu3PMAl(NON)] (M = Cu, Ag) analogues (9 and 10 in Scheme 2).26 A closely related set of Al–Cu bond reactions with CO2 were reported by Liu and coworkers (12 in Scheme 2).27 In 2021, Roy and coworkers reported CO2 insertion into an Al–Zn bond (13 in Scheme 2).28 Finally, in 2022, Mankad and coworkers reported CO2 insertion into an Al–Fe bond by a [Ldipp(Me)AlFeCp(CO)2] (Ldipp = HC{(CMe)(2,6-i-Pr2C6H3N)}2, Cp = η5-C5H5) complex (14 in Scheme 2).29
In these examples, the CO2 insertion into M–Al bonds occurs in mild conditions, always yielding an insertion product where the CO2 carbon atom is coordinated to M and the two oxygen atoms are bonded to the aluminyl moiety. For coinage metal aluminyl complexes (9, 10, 11 in Scheme 2), depending on the Group 11 metal nature, the product of carbon dioxide insertion is stable to further reaction for the [tBu3PAuAl(NON)] complex, whereas for the silver analogue [tBu3PAgAl(NON)] the insertion product leads to the corresponding carbonate complex (and CO), and for the copper system [tBu3PCuAl(NON)] it proceeds rapidly to the carbonate and CO even at low temperatures.
Assessing the polarity of these M–Al bonds is not as trivial as in the previously discussed E–E homobinuclear compounds for obvious reasons. Notably, however, some experimental evidence here suggests that we are dealing with low-polar M–Al bonds. For instance, compounds 9–11 exhibit a very similar reactivity despite the different electronegativities of Cu, Ag and Au, while the formation of 13via a covalent Zn–Al bond was discussed in close relationship with its ionic Li–Al counterpart. Furthermore, a thorough mechanistic investigation via EPR spectroscopy for the formation of 14 highlighted that CO2 is activated by initial formation of AlII and FeI metalloradicals, as a result of the homolytic dissociation of the weak low-polar Al–Fe bond.
Further characterization of the features of these peculiar M–Al bonds came after our recent computational exploration of the mechanistic pathway for CO2 insertion into the Au–Al bond in [tBu3PAuAl(NON)], where we found striking analogies between the Au–Al and Ge–Ge reactivity for the reduction of CO2 to CO by [LGe-GeL] (see Fig. 1).30
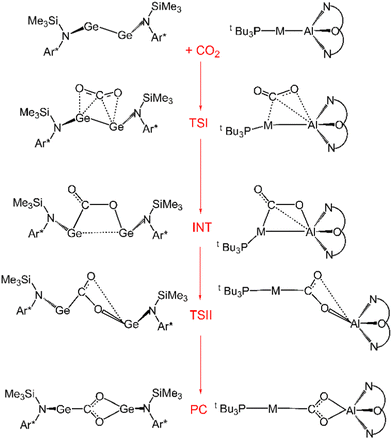 | ||
| Fig. 1 Sketched structures of the stationary points along the reaction profile calculated for the CO2 insertion into the Ge–Ge bond leading to 7 (left)23 and into the Au–Al bond leading to 11 (right).30 TSI = transition state for step I, INT = intermediate, TSII = transition state for step II, PC = product complex. | ||
For both [LGe–GeL] and [tBu3PAuAl(NON)], the reaction mechanism is a two-step process, where the nucleophilic attack to the CO2 carbon atom (rate-determining step) has a relatively low free energy activation barrier (well below 20 kcal mol−1), a stable intermediate is formed and a second transition state is located with a lower activation barrier associated with the CO2 rearrangement leading to the thermodynamically stable insertion product.
Such analogies hold even stronger in terms of electronic structure of these compounds. In the case of digermynes, it is often accepted that their high reactivity can be attributed to their nonnegligible biradical character.31–33 Furthermore, computational studies on their reactivity suggest a central role of their electron-sharing Ge–Ge bond acting as a nucleophilic site, supported by the presence of empty p orbitals on the Ge atoms acting as electrophiles.34
To shed light into the nature of the [tBu3PAuAl(NON)]–CO2 interaction, we used the energy decomposition analysis (EDA)35 and natural orbitals for chemical valence (NOCV)36,37 methods, revealing striking analogies with digermynes, as shown in Fig. 2.
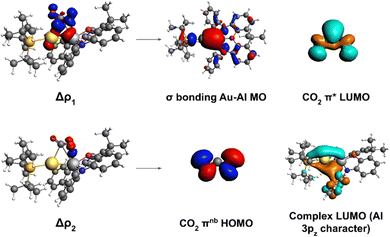 | ||
| Fig. 2 Left: Isodensity surfaces associated with the Δρ1 and Δρ2 NOCV deformation densities for the transition state structure TSI. The charge flux is red-to-blue. The isodensity value is 5 me a0−3 for both surfaces. Right: Most significant contributions from the [tBu3PAuAl(NON)] and CO2 fragments molecular orbitals (MOs) to the interactions described by the NOCV deformation densities. Isodensity values for all MO isosurfaces is 30 me a0−3. All isosurfaces are taken and adapted with permission from ref. 30 Copyright 2021, American Chemical Society. | ||
For [tBu3PAuAl(NON)] complex, we have in fact demonstrated that the nucleophilic behaviour of the electron-sharing, weakly polarized Au–Al bond combined with Al acting as electrophile is the driving force for the CO2 insertion reactivity occurring via a cooperative radical-like mechanism. To help the readership to understand the concept of “radical-like mechanism”: with this term we refer to a singlet closed-shell pathway, along which, upon homolitic dissociation of the electron-sharing bond, the substrate insertion (and/or dissociation) is stabilized by the two resulting fragments behaving as radicals would. The main interaction in the CO2 insertion process has been shown by us to be electron donation from the Au–Al σ bond towards the CO2 LUMO, assisted by a secondary interaction where electron donation occurs from the CO2 HOMO towards the Al centre (mostly an empty 3pz orbital). Notably, a later study employing high-level multireference ab initio calculations further confirmed the low polarity and high covalency of the Au–Al bond as a driving force for the reactivity.38
In the same context, we have also analysed the Cu–Al bond in [tBu3PCuAl(NON)] and Ag–Al bond in [tBu3PAgAl(NON)], which have been found to have a similar electron-sharing nature, explaining the qualitatively analogous mechanism, in agreement with the experimental features for the CO2 activation with M–Al (M = Cu, Ag, Au) compounds.
These metal–aluminyl heterobimetallic complexes, in analogy with main-group homonuclear E–E compounds, do not present intrinsic polarization at the M–Al bond, although exhibiting cooperative reactivity towards CO2 (and other small molecules) in a way that may resemble heterobimetallic polarized M–M′ bonds. These compounds thus represent a unique and particularly interesting playground to learn more about how to assess bond polarization and its effects on the reactivity of heterobimetallic compounds. The simplest way to evaluate bond polarity in such compounds would be resorting in descriptors as simple and effective as atomic electronegativity and atomic charges which, however, may be too simple for some systems. If we think of the gold–aluminyl complex, Au has a much higher electronegativity than Al (2.54 vs. 1.61 on the Pauling scale), thus suggesting a strong Au(δ−)–Al(δ+) polarization. However, some inconsistencies become immediately clear from Fig. 3a: Cu and Ag, for instance, are much less electronegative than Au but a practically identical reactivity is observed for the corresponding Cu/Ag–Al complexes; the comparison between Zn and Al electronegativities (1.65 vs. 1.61, respectively) suggests no bond polarization, yet an analogous reactivity of Zn–Al compounds has been reported experimentally (and similarly for Fe–Al). Likewise, the computation of QTAIM charges on the gold–aluminyl complex reveals an exceptional −0.83 e charge on Au, which would fully support the Au(δ−)–Al(δ+) bond polarization. Yet, as shown in Fig. 3b, the charge on Au spans an extremely wide range of values depending on the approach used for their computation (−0.83/+ 0.22 e), because of, as we demonstrated, the diffuse nature of the aluminyl anion that makes the atomic charge assessment particularly challenging in this context.
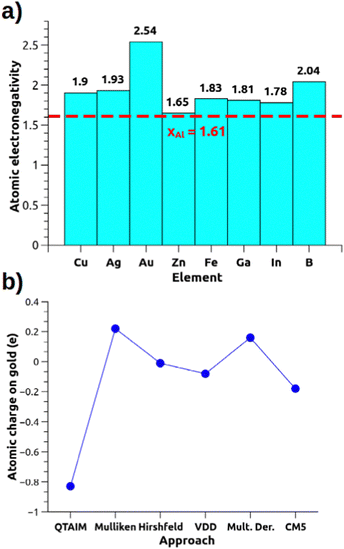 | ||
| Fig. 3 (a) Pauling electronegativities for relevant elements of the periodic table. (b) Atomic charge on the Au atom for the [tBu3PAuAl(NON)] complex calculated with different approaches (data taken from ref. 30). | ||
The computational design of metal–aluminyl compounds for carbon dioxide insertion further assesses and confirms the central role of the weak bond polarity in this type of reactivity. For instance, switching from Au–Al to Au–Ga and Au–In bonds, we expect, according to Fig. 3a, no relevant changes in the reactivity: there is no reason not to expect Au(δ−)–Ga(δ+) and Au(δ−)–In(δ+) polarization based on atomic electronegativities (1.81 for Ga and 1.78 for In). We demonstrated, however, that a kinetically and thermodynamically favourable reactivity with CO2 should only be expected for the gold–aluminyl complex.39 Upon further analysis with several computational approaches, we demonstrated that the Au–Al bond features the most (non-polar) electron-sharing character among the Group 13 anions, which is, in turn, responsible for its highest efficiency and analogous conclusions can be drawn for boryl compounds as well.40
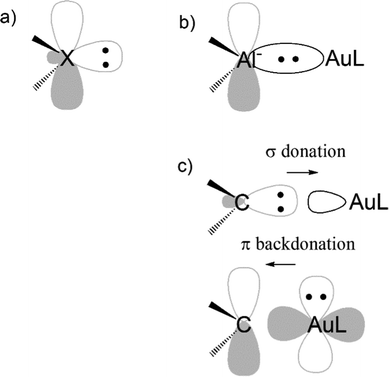
Another evidence for the uniqueness of metal–aluminyl compounds (and, again, for the importance of critical bond polarity assessment) comes from a comparison between aluminyl and carbene coordination bonds. It has been extensively reported that there is a strong isolobal analogy between aluminyls and carbenes, both featuring (i) a lone pair on the Al/C atom, respectively, associated with their donating ability, which is responsible for their nucleophilic behaviour and (ii) an empty p orbital (3p for Al and 2p for C), associated with their acceptor capability, which is, in turn, responsible for their electrophilicity (see Scheme 3a).41
We quantitatively compared the two ligands in terms of bonding with gold and reactivity towards CO2, resulting in two clear different trends. While all aluminyls feature non-tunable Au–Al bonds and a similarly exergonic and kinetically accessible CO2 insertion, Au–C bonds are of dative nature and tunable via carbene structural modification and, therefore, no insertion reactivity can be expected thermodynamically.42
These facts highlight the first important take home message of this Feature Article. In these systems the weak (or absent) bond polarity is the key ingredient for an efficient and feasible CO2 activation process and thus the unbiased assessment of bond polarization is critical for their understanding, as will be more extensively discussed from a computational perspective in the last section of this article.
In this framework, the shortcomings of other paradigms related to carbon dioxide activation emerge. For instance, the feasibility and efficiency of CO2 activation is conventionally described in terms of a merely structural and/or electrostatic perspective i.e. (i) bending of the OCO angle from 180°, (ii) elongation of at least one of the two CO bonds, and (iii) polarization of the charge on C and O, including the charge transfer to or from the outside. The first type of CO2 activation through the bending of the OCO angle is what is more commonly considered as a good indicator of the nature and extent of the metal–CO2 interaction.43
Scheme 4 displays a partial Walsh diagram for CO2, which clearly shows how the molecule can be activated by its geometrical (bending) modification. This schematic diagram depicts the energy levels of the most important CO2 frontier molecular orbitals as a function of the OCO angle. The most stable state is the linear shape. As the angle decreases, the frontier orbitals change their energy levels, followed by the orbital topological mixture of each other. It is known that when the angle becomes close to 90°, the HOMO and LUMO orbital energies become almost the same value, i.e. the molecule is so activated that theoretically electrons can be accepted and released without barrier. The degree of activation of CO2 is thus often monitored by following its bending distortion along the reaction path. The interpretative framework lies exactly on Walsh diagram, which shows that, upon reduction, gas-phase CO2 accepts electron charge in its LUMO, which is of antibonding (π*) character and becomes energetically more favoured in a bent structure.
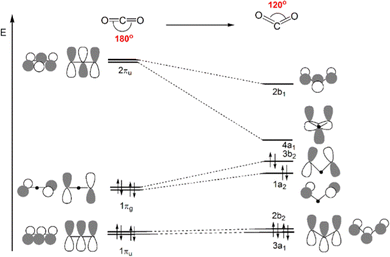 | ||
| Scheme 4 Qualitative Walsh diagram for the OCO angle bending from 180° to 120°. Most important frontier molecular orbitals of CO2 are depicted. | ||
This simplified interpretative scheme unfortunately neglects one very important factor involved in the activation process, that is the substrate mode of activation. In the presence of apolar or weakly polar M–M′ bonds, the cooperative activation equally involves two centres (M and M′) through the electron-sharing M–M′ bond that serves as a nucleophilic site for the reaction, possibly leading to non-trivial topologies of the potential energy surfaces (PESs). This is exactly the case for [tBu3PAuAl(NON)], as shown in Fig. 4.
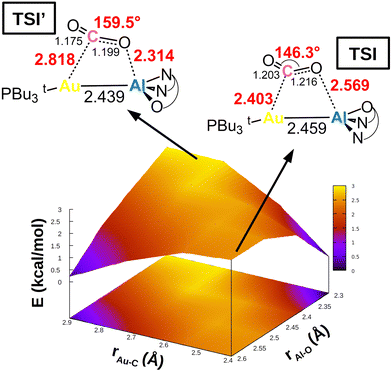 | ||
| Fig. 4 Potential energy surface (PES) in the region surrounding transition state TSI for complex [tBu3PAuAl(NON)]. Insets: Position on the PES and schematic structure of TSI and TSI′. Energy has been shifted in each case according to the minimum energy structure. Reproduced with permission from ref. 39 Copyright 2022, American Chemical Society. | ||
In a work by us, we explored the potential energy surface around TSI (see Fig. 1), revealing that the Au–Al bimetallic CO2 activation occurs in a PES which is extremely flat in a wide range of interfragment distances, indicating that similar energies correspond to very different structures.39 Remarkable changes in the structural parameters characterizing the coordination of carbon dioxide to the complex (i.e. Au–C and Al–O distances, as well as the CO2 bending angle) correspond to almost negligible changes in their energies (all structures in Fig. 4 are located within a 3 kcal mol−1 range). The PES is so flat (Fig. 4) that two different transition states (TSI and TSI′) could be located along the same reaction coordinate. The two TSs have very different structures: TSI features shorter Au–C (2.403 Å) and longer Al–O (2.569 Å) contacts with respect to TSI′ (2.818 and 2.314 Å, respectively). Most importantly, TSI’ features a much larger OCO bending angle (159.5°) with respect to TSI (146.3°), which, according to discussion of Scheme 4, would suggest a more efficient activation pathway through TSI′. Instead, the two transition states lie extremely close in energy (TSI’ is 0.9 kcal mol−1 higher than TSI in terms of Gibbs’ free energy), meaning that CO2 activation is equally efficient from a kinetic standpoint along both pathways, despite the remarkable structural differences. Thorough exploration reveals that, along the PES, the cooperative nature of the process induced by the weakly polar nucleophilic Au–Al acts so that the orbital interactions between [tBu3PAuAl(NON)] and CO2 always efficiently counterbalance the variable and increasing distortion penalty of CO2, leading to an efficient activation along multiple directions.
These findings reveal how, generally, in the framework of cooperative activation processes, using simple structural descriptors to monitor and/or design new activation processes may lead to an erroneous interpretation of the results (notably similar conclusions on the OCO bonding angle have been drawn recently for activation processes mediated by semiconductor oxides44).
Dihydrogen activation
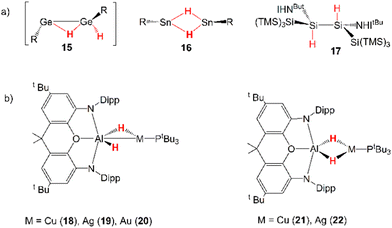
Dihydrogen is a promising alternative fuel source due to its potential to provide energy with minimal environmental impact.45 One of the drawbacks for its large-scale use as a fuel is its difficult storage and transportation. Thus, the possibility of relying on cooperative activation processes to reversibly capture H2 is surely attractive, but its high kinetic and thermodynamic inertness make such processes particularly complicated to implement.46Several examples of cooperative activation mediated by apolar E–E bonds have been reported and, notably, very early examples of such reactivity involve aryl- and amido-digermynes analogous to 6. In the pivotal work by Power and coworkers, Ar′GeGeAr′ (Ar′ = [C6H3-2,6(C6H3-2,6iPr2)2]) has been reported to easily activate H2 under mild experimental conditions (1 atm, 25 °C) in solution (hexane) delivering H–H bond dissociation on the apolar Ge–Ge bond.47 Following this pioneering contribution, Jones and coworkers reported on a dihydrogen facile activation by a RGeGeR compound (R = [N(SiMe3)(C6H2Me{C(H)Ph2}2-4,2,6)]), which occurs both in solution (toluene or d6-benzene, 1 atm, 20 °C) and the solid state at temperatures as low as −10 °C.48 Later on, the amido digermyne RGeGeR (R = [N(SiiPr3)(2,6-[C(H)Ph2]2-4-iPrC6H2)]) has also been shown to easily activate H2 in solution in mild conditions (toluene, 20 °C).49 For all compounds, experiments and theoretical investigations outline a reaction mechanism that proceeds via a singly-bridged intermediate [RGe(μ-H)GeHR] species (see 15 in Scheme 5), which subsequently, upon isomerization, yields different hydrogenation products, experimentally revealed depending on the steric hindrance of the substituents.34 Since then, several examples of analogous reactivity have been reported for Group 14 dimetallenes and dimetallynes, performing H2 activation mediated by apolar Si–Si and Sn–Sn bonds (see 16 and 17 in Scheme 5 for two relevant examples).18
Computational studies on these compounds and their reactivity have shed light on the features of the dihydrogen activation. EDA-NOCV-based analysis by Frenking and coworkers highlighted that the reactivity towards H2 is induced by the population of the antibonding σ* LUMO of H2 by the Ge–Ge centred HOMO of the digermyne, supported by population of the LUMO of the digermyne by the bonding σ HOMO of H2. The reaction mechanism has been described as a two-step H atom abstraction from H2 followed by radical pair recombination induced by the substantial diradical character of digermynes.34
Inspired by this experimental evidence and by the strong analogy between the apolar Ge–Ge and weakly polar M–Al (M = Cu, Ag, Au) bonds, very recently we reported that analogous H2 activation by [tBu3PMAl(NON)] complexes may be in principle feasible and ideal for the use of [tBu3PAuAl(NON)] as hydrogenation catalyst.50 In our computational work, we predicted that [tBu3PMAl(NON)] (M = Cu, Ag, Au) complexes should indeed react with dihydrogen, with a very similar mechanism to that computed by Frenking and coworkers for digermynes. The first hydrogenation was reported to occur in a single step which leads to the formation of the singly bridged [tBu3PM(μ-H)AlH(NON)] species (18–20, Scheme 5), with a relatively low energy barrier. Calculations have predicted the experimentally accessible formation of a singly-bridged [tBu3PM(μ-H)Al(H)(NON)] species for all the metal–aluminyl complexes and an additional and preferred doubly-bridged [tBu3PM(μ-H)2Al(NON)] product for copper and silver (21–22, Scheme 5).
The striking resemblance with digermynes appears even more evident in terms of electronic structure. We analyzed the nature of the complex–H2 interaction along the reaction path, revealing that it consists in (i) the depletion from the Au–Al σ bonding orbital (HOMO) to the empty σ* MO of H2 and (ii) the population of the LUMO of the complex (mainly of Al 3pz character) from the HOMO of H2, consistent with digermyne–H2 interactions as described earlier. Notably, interactions between [tBu3PMAl(NON)] (M = Cu, Ag) at the corresponding transition states are of analogous nature, with NOCV results showing analogous depletion/accumulation patterns.
These analogies lead to two notable implications. The first is of a more practical nature and concerns possible usage of these compounds as catalysts for a combined H2 activation and subsequent substrate hydrogenation. The role of gold molecular complexes in catalysis is mainly known in the π-activation of unsaturated substrates,51 and therefore this catalytic application would be clearly novel. In particular, the H2 cleavage with gold–aluminyl complex has been calculated to be thermoneutral (ΔG = 3.3 kcal mol−1): this is ideal for its use as catalyst in hydrogenation reactions. In our work, by selecting ethylene as a substrate, we have modelled the alkene hydrogenation process catalysed by [tBu3PAuAl(NON)], which has been found to occur in a single, exergonic step (ΔG = −25.6 kcal mol−1), via a concerted transition state, where both hydrogens are simultaneously transferred to the substrate, forming ethane and regenerating the gold–aluminyl catalyst, with a kinetically accessible barrier (ΔG# = 21.7 kcal mol−1).
Secondly, this computational exploration allows to further characterize this type of reactivity mediated by weakly polar bonds compared to polarized dative bonds. Bourissou and coworkers experimentally and computationally characterized the reactivity of a Pt(0)–Al(III) compound featuring a dative Pt → Al bond towards H2 (Fig. 5a).52
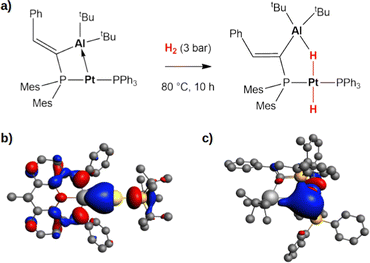 | ||
| Fig. 5 (a) Experimentally reported reactivity of a Pt → Al complex with H2.52 (b) and (c) Isosurfaces of the HOMO of the gold–aluminyl complex (b) and platinum–aluminium complex (c). The isovalue is 3 me a0−3. The isosurfaces have been taken and adapted with permission from ref. 50 Copyright 2023, Royal Society of Chemistry. | ||
In their work, a two-step mechanism for the formation of the product, which strongly resembles complex 20 (Fig. 5), with a bridging hydrogen between Al and Pt and a hydride on Pt, is reported. These analogies prompted us to compare the complex–H2 interaction in the two complexes, revealing that the apparent similarities arise from substantial differences in the electronic structure of the two complexes.
At a first sight, the complex–H2 interaction is analogous: we find it to be mainly driven by the population of the σ* antibonding LUMO of H2 by the bonding HOMO of the Pt–Al complex. However, at a qualitative level, the nature of the MO is different, being mainly located on the Pt moiety of the complex in Al–Pt and almost equally shared between the two metals in Al–Au (Fig. 5b and c). The atomic orbital contributions to the MO corroborate this picture, showing a mostly Pt-centered MO (72.2%) with negligible contributions from Al (3.0%), consistent with a dative bond and a Pt(δ−) polarization. In the case of the gold–aluminyl complex, instead, the HOMO is centred on both Au and Al, contributing almost equally (19.5% and 15.9%, respectively), consistent with the electron-sharing bond described above. Consequently, while the former reactivity can be formally described as an oxidative activation at the Pt(0) centre, the latter is most likely a radical pair stabilization reactivity, similar to digermynes. An unusual picture of the reactivity with heterobimetallic compounds clearly emerges from these results, that can be exploited to discover new routes for cooperative homogeneous activation processes.
Nitrous oxide activation
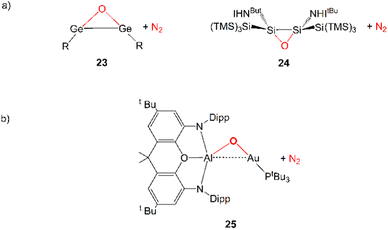
Nitrous oxide (N2O) is a greenhouse gas with a global warming potential of more than 300 CO2 equivalents,53 with extensive anthropogenic emissions mainly due to agricultural activities.53,54 It is currently the main responsible for ozone depletion,55,56 so clearly efficient strategies for its activation are highly desirable, also because it is a valuable synthetic tool behaving as an oxygen-atom transfer agent, with release of non-hazardous N2 as by-product.57,58 The main drawback regarding its activation and reduction to N2 (which is highly exergonic) is that this process is kinetically hindered, with an associated activation barrier of more than 60 kcal mol−1.59–61Notably, kinetically favourable N2O reduction ubiquitously occurs in nature mediated by metalloenzymes equipped with multiple metal centres acting cooperatively, such as the four copper sites in nitrous oxide reductase (N2OR).59,62 Inspired by them, several biomimetic and multicopper compounds, as well as homo- and heterobimetallic (and -trimetallic) species, have been reported to efficiently reduce N2O cooperatively11 and notably, efficient reduction mediated by Group 14 dimetallenes and dimetallynes has been extensively explored,22 as shown in Scheme 6.
In a very recent computational work by us, we reported that analogous N2O activation with weakly polar, electron-sharing Au–Al bond in [tBu3PAuAl(NON)] complex may be feasible, resulting in the formation of the [tBu3PAuOAl(NON)] oxo-species (see 25 in Scheme 6) and N2 extrusion.63 This reaction has been predicted to be accessible from a kinetic point of view in mild conditions (Gibbs’ free energy activation barrier of 15.2 kcal mol−1). The reaction mechanism is qualitatively different from those illustrated so far for coinage metal–aluminyl reactions with CO2 and H2. In this case, the reaction is reported to occur through a one-step mechanism with a concerted transition state, where N2O coordinates to the two active Au and Al sites with a μ-1,2-O,N binding mode.
A thorough analysis of the electronic structure and interactions occurring along this reaction pathway has been carried out within a similar approach as previously discussed for the other substrates. The analysis revealed, once again, that the main driving force of such favourable predicted activation lies in the electron-sharing Au–Al bond serving as a nucleophilic site for the reaction and populating the π* LUMO of N2O, assisted by the population of the 3pz orbital of Al by the terminal 1,O-coordination of N2O. Furthermore, computational catalytic modelling indicates that the resulting Au–O–Al complex may serve in this context as a catalyst for several oxidation processes, including the challenging oxidation of phosphines.
Interestingly, the μ-1,2-O,N coordination mode we reported for the activation is highly unusual. Generally, there has been an effort in the literature to try to understand the various N2O binding modes occurring at bi- or multimetallic centres.11 For instance, the mechanism of action of nitrous oxide reductase has been studied thoroughly, suggesting that the reduction proceeds with an η2-1,3-N2O binding at the two active copper centres (Scheme 7a).64
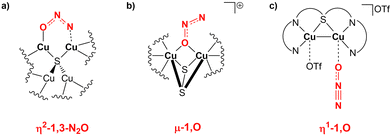 | ||
| Scheme 7 (a) Proposed N2O binding mode at the two copper centres of the nitrous oxide reductase enzyme. (b) and (c) Observed N2O binding modes over copper centres in biomimetic dicopper compounds. | ||
The same reactivity with a biomimetic multicopper assembly has been proposed to proceed via a μ-1,O binding (Scheme 7b),65 while the reactivity of a biomimetic mixed-valence dicopper complex has been proposed to proceed via an η1-1,O coordination (Scheme 7c).66 The μ-1,2-O,N binding mode at the transition state unveiled by our calculations appears to be really uncommon in this framework. For this reason, in analogy with carbon dioxide activation, we explored the PES around the concerted transition state. As shown in Fig. 6 (and in analogy with carbon dioxide) the topology of the PES is particularly flat around this transition state.
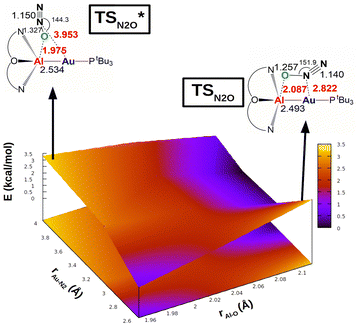 | ||
| Fig. 6 Potential energy surface (PES) in the region neighbouring the transition state TS for the reaction of complex [tBu3PAuAl(NON)] with N2O. Insets: Position on the PES and schematic structure of TS and TSI*. Energy has been shifted in each case according to the minimum energy structure. Reproduced with permission from ref. 63 Copyright 2023, Wiley-VCH GmbH. | ||
Our calculations show indeed a flat topology of the PES in a wide range of Au–N and Al–O distances around the transition state, leading eventually to locate an alternative almost isoenergetic transition state  along the same reaction coordinate where, however, nitrous oxide is coordinated to the complex with a more common μ-1,O binding mode. Notably, electronic structure analyses unravel that, despite the structural difference, the main interaction between nitrous oxide and the complex remains the charge transfer from the Au–Al bond towards the N2O LUMO, supported by the population of the vacant 3pz orbital of Al by N2O HOMO.
These findings further highlight that, while inspection of N2O binding modes has been often subject of study since considered to be revealing of the nature of the complex-N2O interaction, in the case of such bimetallic cooperative reactivity, the topology of the PES allows different binding modes to coexist towards the same reaction coordinate.
Other small molecule activation processes
As mentioned in the Introduction, one of the advantages of using bimetallic compounds in the framework of small molecule activation processes is that the addition of a second metal moiety modifies the properties of the first, paving the way for unconventional reactivity patterns. In the case of gold, for instance, examples of reactivity of mononuclear gold complexes towards carbon dioxide are scarce,67 in sharp contrast with the facile CO2 capture by the bimetallic Au/Al complex.An even more striking example of this paradigm breakdown involves the reactivity of coinage metal compounds with alkynes. Coinage metal (and particularly gold) complexes are widely used in organometallic chemistry as powerful π-acid catalysts, with their soft Lewis acid behaviour enabling the facile activation of alkynes (and generally unsaturated substrates) towards nucleophilic attack.51
A recent work by Aldridge and coworkers showed how the [tBu3PCuAl(NON)] complex reacts with internal alkynes leading to the formation of syn alkyne insertion products under kinetic control, with following formation of the thermodynamic anti insertion product (Scheme 8).68
 | ||
| Scheme 8 Experimental insertion of internal 3-hexyne in the Cu–Al bond of the [tBu3PCuAl(NON)] complex.68 | ||
In a following computational work by us, we have both rationalized the experimental results for the copper–aluminyl complex, which more favourably forms the syn insertion product than the anti, and also predicted a similar, although less efficient, reactivity with gold–aluminyl.69 The reaction mechanism for 3-hexyne insertion into Al–M (M = Cu, Au) bonds has been reported to be qualitatively very similar to those illustrated for coinage metal–aluminyl reactions with CO2, H2 and N2O. Despite a different geometrical rearrangement of both the complex and alkyne moieties, the analysis of the substrate-complex interaction at relevant transition states along the reaction path has revealed that analogous alkyne-complex interaction occurs. Namely, (i) the electron sharing M–Al bond acts as a nucleophile by donating electron charge to the π* LUMO of the alkyne in a radical-like mechanism and (ii) a second significant component of the interaction is represented by a reverse alkyne HOMO-to-complex (mainly empty Al 3pz orbital) charge transfer.
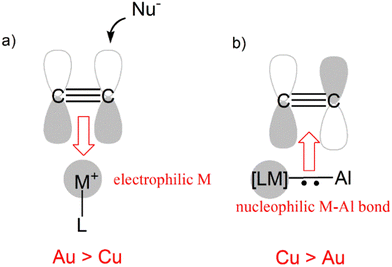
While perfectly consistent with the previously reported reactivity of metal–aluminyl complexes, this type of reactivity is in striking contrast with the “classical” reactivity of mononuclear coinage metal complexes towards alkynes. In fact, while the more electrophilic and soft gold centers are more efficient than copper ones in the π-activation of alkynes, in this context we observed an inverted trend, where the copper–aluminyl complex is more efficient towards alkyne insertion, consistent with experimental results. As shown in Scheme 9, this can be rationalized by the remarkable difference in the electronic structure of the bimetallic complexes induced by the aluminyl moiety.
The electronic structure analysis we carried out has highlighted that the difference has a common origin, namely the relativistically stabilized 6s atomic orbital of gold. In fact, it has been extensively discussed – and widely accepted – that the exceptional reactivity of gold towards alkynes is related to the stabilization of the 6s orbital of gold induced by relativistic effects (Scheme 9a).51 The atomic ns (n = 4, 6 for Cu and Au, respectively) orbital is involved in the formation of the empty [LM]+ fragment orbital, and the exceptionally stable 6s orbital of Au makes it more suitable for accepting electron density from a substrate, thus enhancing the electrophilic power of gold [LAu]+-type complexes.
This becomes, however, a detrimental feature in the case of the nucleophilic reactivity of M–Al compounds (Scheme 9b). In these compounds, the ns atomic orbital is involved in the M–Al bonding, but in the case of Au, the 6s orbital is less engaged in the bonding with respect to the 4s orbital of Cu, leading to a lowered contribution to the bond from the gold fragment with respect to copper. As a result, the Au–Al bond is less nucleophilic than the Cu–Al bond and, consequently, a less efficient alkyne insertion should be expected.
Such trend inversion in standard reactivity paradigms can be also expected beyond small molecule insertion into M–M′ bonds. One interesting example is the activation of the N–H bond in ammonia. A few examples of N–H bond activation processes mediated by apolar bonds, such as Group 14 dimetallenes and dimetallynes are available.22 On the other hand, examples of such activation mediated by mononuclear transition metal complexes are scarce, due to the strong coordinating ability of NH3 that prevents the activation process to occur.70
Our computational studies on gold–aluminyl compounds revealed that the introduction of the aluminyl moiety and the subsequent low polarity of the resulting Au–Al bond could create an ideal scenario for using transition metal compounds for this scope. We demonstrated that the [tBu3PAuAl(NON)] complex could, in principle, activate the N–H bond in ammonia in mild conditions, through a kinetically and thermodynamically favourable one-step process (Scheme 10).63
The N–H bond activation has been found to be exergonic by 9.3 kcal mol−1, with an activation barrier of 13.3 kcal mol−1. We also computed the O–H bond activation process of water finding an even more favourable process, that is exergonic by 20.8 kcal mol−1, with an even smaller activation barrier of 5.5 kcal mol−1. The H2O- and NH3-complex interactions have been shown to arise from the same components of the CO2-, H2-, N2O- and alkyne-complex ones, i.e. the electron donation from the Au–Al covalent bond towards the O–H/N–H antibonding molecular orbital is the driving force of the reaction, combined with a sizable electron donation from the lone pair on the O/N atom towards the LUMO of the complex.
All these examples provide interesting evidence for a scenario in which the introduction of a second metal moiety and subsequent formation of a low-polar M–M′ bond can induce changes in established paradigms for the reactivity of mononuclear transition metal compounds. This means that previously inaccessible reactivity of coinage metal mononuclear compound can become feasible, paving a new direction for the molecular design of these compounds towards small molecule activation.
Theoretical tools for cooperative small molecule activation
At this point, we have hopefully convinced the reader that computational insights on cooperative small molecule activation processes are essential to provide a proper rationalization of the observed reactivity, as well as to give valuable insights into the molecular design of multicentre compounds with improved reactivity. However, a black-box use of computational tools in this framework may lead to pitfalls and, eventually, to an erroneous picture of the interactions at play. For this reason, in this last section, we would like to illustrate a composite computational setup to use in these situations that may help the readership in rationally characterizing these reactions.The steps of the proposed computational protocol are reported in Fig. 7. We divide the scheme in three major blocks, being (1) bond nature/polarity assessment, (2) reaction mechanism and (3) complex–substrate interaction analysis. We discuss below the computational tools which are of invaluable use across each block in more detail, focusing on the reaction of the gold–aluminyl complex [tBu3PAuAl(NON)] with carbon dioxide as a case study.
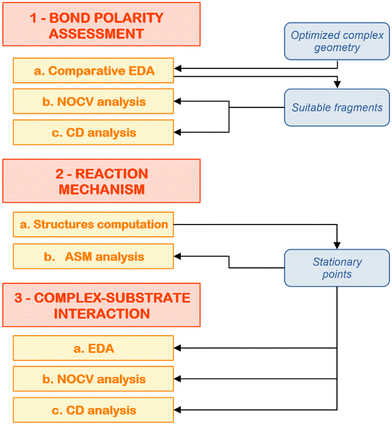 | ||
| Fig. 7 Schematic workflow for the application of the composite protocol for the theoretical analysis of cooperative small molecule activation processes. | ||
(1) Bond nature/polarity assessment
In general, the EDA scheme aims to provide a simple yet effective description of chemical bonds. For the bond between two generic E and E′ fragments, their interaction energy (ΔEint) at their in-adduct geometry can be decomposed within the EDA framework as follows:
| ΔEint = ΔEPauli + ΔVelst + ΔEoi + ΔEdisp | (1) |
One crucial step for the analysis of a generic E–E′ bond is the definition of the separate E and E′ fragments (and the overall complex) in terms of charge and spin multiplicity. While for the overall complex this is straightforward, in the case of the fragments, their definition requires caution. As previously discussed by Frenking, Schwerdtfeger and coworkers, the least biased way to describe the fragments in an EDA calculation is to empirically test the EDA results with different possible fragmentation schemes, i.e. starting either from closed shell [E]+/− and [E′]−/+ or open shell doublet [E]˙ and [E′]˙ fragments.76 They showed that the most suitable E–E′ bond fragmentation is the one with an associated less stabilizing ΔEoi value, corresponding to the fragments with an electronic structure which more closely resembles that they acquire upon bond formation.
Taking the previously discussed [tBu3PAuAl(NON)] complex as an example, the most obvious choice for describing the formation of the gold-aluminyl bond would be choosing singlet closed shell cationic gold ([tBu3PAu]+) and anionic aluminyl ([Al(NON)]−) fragments. As shown in Table 1, this fragmentation results in a ΔEoi value of −105.3 kcal mol−1. If we choose the [tBu3PAu]− and [Al(NON)]+ fragments, as expected, we get a more unlikely fragmentation scheme, with an associated orbital interaction energy of −225.6 kcal mol−1.
| Fragmentation scheme | ΔEoi (kcal mol−1) |
|---|---|
| [tBu3PAu]+ + [Al(NON)]− | −105.3 |
| [tBu3PAu]− + [Al(NON)]+ | −225.6 |
| [tBu3PAu]˙ + [Al(NON)]˙ | −71.5 |
Instead, starting from doublet open-shell gold and aluminyl fragments, [tBu3PAu]˙ and [Al(NON)]˙, respectively, we get a much less stabilizing ΔEoi value (−71.5 kcal mol−1), clearly indicating that the Au–Al bond in this complex is best described by open-shell fragments, i.e. as an electron-sharing bond.
Briefly, the NOCV approach is based on the rearrangement of the electron density occurring when a chemical bond is formed (Δρ′). This deformation density can be brought into diagonal contributions in terms of NOCVs. In the NOCV scheme, the charge rearrangement taking place upon bond formation is obtained from the occupied orbitals of the two fragments suitably orthogonalized to each other and renormalized (promolecule). The resulting electron density rearrangement can be expressed in terms of NOCV pairs which are defined as the eigenfunctions of the so-called “valence operator”78–80 as follows:
 | (2) |
The NOCV approach can be coupled with the EDA decomposition within the ETS-NOCV framework.81 With this tool, the EDA orbital interaction term ΔEoi can be further decomposed into NOCV pairwise orbital contributions  which associate an energy contribution (ΔEkoi) to each NOCV deformation density
  . NOCV calculations can be easily carried out using ORCA, BERTHA or ADF softwares and we refer the reader to a detailed tutorial on how to setup NOCV calculations.75
In practice, following the gold–aluminyl example, after applying the EDA for the Au–Al bond formation starting from [tBu3PAu]˙ and [Al(NON)]˙ fragments, we compute the NOCV deformation densities and employ the ETS-NOCV decomposition of the orbital interaction energy term (Fig. 8).
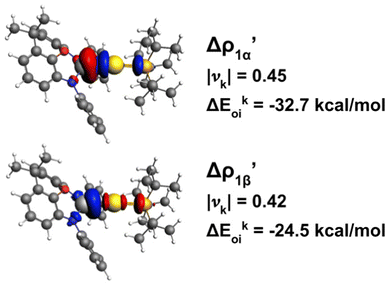 | ||
Fig. 8 Isodensity surfaces (1 me a0−3) of the two main NOCV deformation densities  (top) and (top) and  (bottom) (charge flux is red → blue) for the Au–Al bond in [tBu3PAuAl(NON)] together with the corresponding eigenvalue (|νk|) and associated orbital interaction energy contribution (ΔEkoi) adapted and reprinted with permission from ref. 30 Copyright 2021, American Chemical Society. (bottom) (charge flux is red → blue) for the Au–Al bond in [tBu3PAuAl(NON)] together with the corresponding eigenvalue (|νk|) and associated orbital interaction energy contribution (ΔEkoi) adapted and reprinted with permission from ref. 30 Copyright 2021, American Chemical Society. | ||
The application of the NOCV approach yields one main component (k = 1) of the Au–Al interaction in the complex (which in this case, since we are starting from open shell fragments, consists of two components, i.e. α and β). At first, a qualitative inspection of the associated isosurfaces is needed, revealing that the two components are of analogous nature (accumulation/depletion regions are mainly localized on Au and Al and have a σ cylindrical symmetry) but describe charge fluxes in opposite directions.  is an aluminium-to-gold charge flux, while
  represents a gold-to-aluminium charge transfer. A first semi-quantitative perspective on the bond nature and polarity can be obtained by inspecting the eigenvalues (|νk|, see eqn (2)) and the orbital interaction energy contribution (ΔEkoi) associated to each. In this case, similar values are associated to both
  and
and  (|νk| = 0.45 and 0.42 e, respectively), while ΔEkoi is −32.7 and −24.5 kcal mol−1, respectively, (see Fig. 8) suggesting that the two opposite charge fluxes may result in a weak bond polarization.
 | (3) |
 and therefore one is able to quantify the charge transfer (CT) associated to each different component. It must be noted that only few of the NOCV pairs contributes to the chemical bond. Therefore, when the CD-NOCV analysis is carried out, usually only the first
  components are investigated in order to understand which significant chemical contribution to the bond they represent. In eqn (3), the integration axis is usually conveniently chosen as the bond axis between the two fragments constituting the adduct and usually, we choose to evaluate the charge transfer between E and E′ by taking the CD value at the “isodensity boundary”, i.e. the z-point where equally valued isodensity surfaces of the isolated fragments become tangent.77,83 The application of CD-NOCV scheme is quite straightforward, consisting in the orientation of the bond of interest along the integration axis and subsequent integration of the NOCV components calculated in the previous step. All can be done by printing the NOCV deformation densities on cube files and then proceeding with integration (and/or manipulation) with a set of publicly available tools.84
As a result, one obtains CD-NOCV curves, as shown for the gold–aluminyl complex in Fig. 9. The CD-NOCV curves reflect what could be qualitatively inferred from the NOCV isosurfaces. The curve associated to  (red curve in Fig. 9) is positive over the whole molecular region, indicating an aluminium-to-gold charge transfer, while the
  curve (blue curve in Fig. 9) is entirely negative, consistent with an opposite gold-to-aluminium charge transfer. In this case, however, we can associate a charge transfer (CT) value to each component by evaluating its extent at the isodensity boundary. As a result, we find a CT1α value of 0.30 e and CT1β value of −0.27 e, confirming that the two charge fluxes are quantitatively close. To definitively assess bond polarization, we can compute the CD curve associated to the overall deformation density (grey curve in Fig. 9), which indicates the overall amount of charge transferred between the two fragments. The curve approaches zero in the bond region and the associated CT value is 0.05 e, definitively confirming that the net polarization of the Au–Al bond is extremely weak, consistent with a poorly polarized electron-sharing bond.
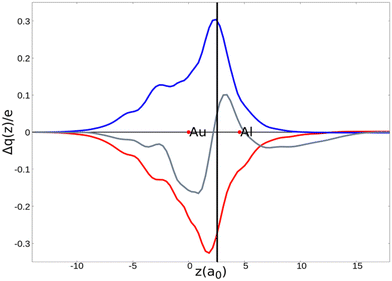 | ||
Fig. 9 CD-NOCV curves associated to the first two NOCV deformation densities ( , in red and , in red and  , in blue) for the analysis of the Au–Al bond in the [tBu3PAuAl(NON)] complex. The grey curve is associated to the overall deformation density Δρ′. The red dots indicate the position of the nuclei along the z axis. The vertical solid line marks the isodensity boundary between the fragments. Positive (negative) values of the curve indicate right-to-left (left-to-right) charge transfer. Adapted and reprinted with permission from ref. 30 Copyright 2021, American Chemical Society. , in blue) for the analysis of the Au–Al bond in the [tBu3PAuAl(NON)] complex. The grey curve is associated to the overall deformation density Δρ′. The red dots indicate the position of the nuclei along the z axis. The vertical solid line marks the isodensity boundary between the fragments. Positive (negative) values of the curve indicate right-to-left (left-to-right) charge transfer. Adapted and reprinted with permission from ref. 30 Copyright 2021, American Chemical Society. | ||
2 Reaction mechanism
Note that there are some automated tools that can be helpful to assess the proper reaction coordinate, but we advise that they should be used with extreme caution in the case of cooperative activation processes mediated by apolar or weekly polar bonds. One of these tools is the intrinsic reaction coordinate (IRC) approach.85 The minimum energy reaction path can be in general defined as the steepest-descent path from a transition state to the neighbouring local minima. The IRC approach uses a similar definition, but it relies on mass-weighted coordinates, following the maximum instantaneous acceleration to determine the features of the reaction path.86 In practice, the IRC approach uses as input a transition state (or a structure that is reasonably close to it) and determines the energy profile and its length, shape and curvature automatically.
While particularly attractive, the IRC approach can fail in circumstances where the potential energy surface has a complex topology around the transition state. It has been discussed in the literature that a single IRC cannot define a particular preferred reaction pathway when the potential energy surface is flat87 and we already encountered the same issue before when studying computationally CO2 activation processes.88
The case of the carbon dioxide activation by a gold–aluminyl complex is a textbook example of this type of situation. We extensively discussed the particularly complex topology of the flat PES in the case of this reaction, and this prevented the possibility for us to use the IRC to help providing insights into the connectivity between transition states and local minima. As shown in Fig. 10, when we used the IRC approach on TSI (see Fig. 1), it resulted in a non-physical shape of the reaction path, basically with a transition state connecting two identical local minima, which is obviously an unphysical result due to the flat topology of the PES.
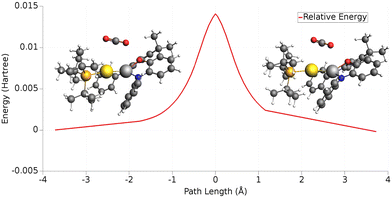 | ||
| Fig. 10 One-dimensional IRC minimum energy reaction path for the first step of the reaction of the [tBu3PAuAl(NON)] complex with CO2. Insets: IRC-optimized geometry for the two minima adjacent to TSI. Adapted and reprinted with permission from ref. 40 Copyright 2022, American Chemical Society. | ||
While particularly helpful in the computational exploration of reaction pathways, this example shows that tools like the IRC approach can lead to unphysical results for cooperative activation processes featuring apolar bonds, where a non-black-box PES exploration should always be preferred.
The model has a practically analogous starting point to that of the EDA approach. It allows to decompose the relative energy of a stationary point in two contributions: a penalty arising from the distortion of the reactants from their relaxed geometry to their in-adduct one (ΔEdist) and a (usually) stabilizing interaction contribution arising from the interaction between reacting fragments (ΔEint). Thus, the relative energy of a stationary point (ΔE) can be expressed as follows:
| ΔE(ζ) = ΔEdist(ζ) + ΔEint(ζ) | (4) |
In the case of the gold-aluminyl complex reacting with CO2, the ASM approach was particularly useful to understand the factors behind such favourable reaction kinetics. As shown in Fig. 11, we applied ASM to decompose the first part of the reaction pathway, i.e. the first activation barrier, by using eqn (4) to decompose the relative energies of “RC” and TSI” stationary points.
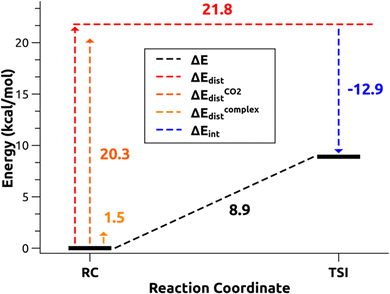 | ||
| Fig. 11 Activation strain model (ASM) decomposition of the electronic energy activation barrier between RC and TSI for the reaction of [tBu3PAuAl(NON)] complex and carbon dioxide. Adapted with permission from ref. 26 Copyright 2021, American Chemical Society. | ||
The results of the ASM analysis revealed a few important features that keep this barrier acceptably low to enable the reaction to proceed as fast at room temperature. ASM results unveil that, while the overall distortion penalty ΔEdist for this step is high (21.8 kcal mol−1), this is efficiently counterbalanced by the stabilizing interaction between the complex and carbon dioxide (ΔEint = −12.9 kcal mol−1), resulting in a particularly low activation barrier. Furthermore, decomposition of the distortion penalty revealed that most of it arises from the geometrical distortion (bending and anti-symmetric C–O bond stretching) of CO2 (20.3 kcal mol−1). This means that the gold–aluminyl complex, despite undergoing a notable geometrical distortion upon approaching TSI, has a very small associated energy penalty (1.5 kcal mol−1), revealing that the complex is particularly flexible, thus favouring the kinetically accessible CO2 activation process.
3 Complex–substrate interaction analysis
The application of the EDA analysis is totally analogous to that discussed in step 1a. In this case, however, we have a much simpler situation. At both RC and TSI the two fragments are interacting, but no actual bonds are formed, so we can confidently assign neutral charges to both the complex and carbon dioxide, avoiding additional fragmentation screening in step 1a (note that this may vary from case to case and caution should always be used).
Similar to the EDA approach, the resulting NOCV calculation is analogous to that for the M–M′ bond shown in step 1b, since we can decompose deformation densities in terms of NOCV according to eqn (2) and use the ETS-NOCV approach to decompose the orbital interaction energy term accordingly. Note, however, that it is often useful to bring the analysis one step further in this context. As a reminder, the NOCV φ−k and φ+k are envisaged as donor and acceptor orbitals, respectively. For the sake of interpretation, a population analysis can also be performed in order to single out, for φ−k and φ+k orbitals, which molecular orbitals (MOs) of the two constituting fragments contribute to the interaction (with a resulting associated coefficient accounting for the magnitude of the contribution). In the context of small molecule activation this is particularly useful since it allows to bring the discussion and interpretation at the MO level, which is particularly common in this framework (see Walsh diagram in Scheme 4) by, however, relying on an unbiased approach.
Within this approach, the electron density rearrangement (Δρ′), which typically shows charge accumulation regions (positive values) and charge depletion regions (negative values), defines two different positive functions, Δρ+ and Δρ−, each equal to the magnitude of the appropriate portion, i.e.:
| Δρ+/− = max[±Δρ(r),0] | (5) |
| Δρ(r) = Δρ+(r) = Δρ−(r) | (6) |
 | (7) |
 | (8) |
 | (9) |
In the case of the gold–aluminyl complex, the combination of the approaches illustrated in steps 3a–c allowed to characterize the interaction between the gold–aluminyl complex and carbon dioxide at TSI in fine detail. We chose TSI since it is the first stationary point along the PES in which significant interactions between the two fragments occur, allowing, however, to unambiguously define them in space.
Firstly, the application of the EDA approach (step 3a) reveals that the overall interaction energy (−12.9 kcal mol−1, Fig. 11) is made favourable (negative) by a strong orbital interaction between the two fragments (−53.3 kcal mol−1). Then, we move to step 3b, where we use the NOCV and ETS-NOCV approaches to characterize qualitatively and quantitatively the nature of such strong orbital interaction.
On a qualitative ground, the NOCV approach is in perfect agreement with the nature of the Au–Al bond we outlined in step 1.
From the NOCV analysis, we find that only two NOCV pairs (k = 1, 2) contribute significantly to the complex–CO2 interaction. We already showed the isosurfaces for these two deformation densities and discussed the molecular orbital contributions in Fig. 2. We were able to achieve the results by going through step 3b. We visualized at first the donor/acceptor NOCV pairs (φ−k/φ+k, k = 1, 2 see eqn (2)) associated to the related deformation densities. By inspection of φ−1 and φ+1 we confirmed that Δρ1 is a complex-to-CO2 charge transfer since φ−1 (donor) is mainly localized on Au and Al, while φ+1 (acceptor) is almost entirely localized on CO2. Furthermore, we break down the contributions to both from the MOs of the fragments by population analysis, revealing that the donor φ−1 shows mainly contributions from high-lying occupied MOs (HOMO and HOMO−2) of the complex centred on both Au and Al, while the acceptor has contributions mostly from the LUMO of carbon dioxide, as one expects.
Similarly, inspection of φ−2 and φ+2 confirmed a CO2-to-complex charge flux for Δρ2. In particular, the donor φ−2 (centred on CO2) has mainly contributions from the HOMO of the substrate, while the acceptor φ+2 is centred on the complex and has contributions from both the low-lying LUMO of the complex and a high-lying unoccupied orbital (LUMO+15), both displaying mainly contributions from the empty 3pz atomic orbital of Al.
Both step 3b (ETS-NOCV analysis) and step 3c (CD) analysis allow to provide a quantitative perspective on the extent of these interactions, which becomes crucial when comparing reactivity of slightly different complexes (different Au–M complexes, for instance, as we studied in ref. 39). The analyses report that Δρ1 has an associated ΔE1oi of −41.2 kcal mol−1 and an associated CT1 of 0.33 e, while the second component, smaller in magnitude yet not negligible, has a ΔE2oi of −4.0 kcal mol−1 and an associated CT1 of 0.05 e.
Note that these approaches are not new, yet they have proven to be effective in characterizing a wide variety of reactivities (see, for instance, ref. 93 for a recent Feature Article on their use in the framework of frustrated Lewis pairs by Fernandez). Furthermore, some additional tools may be useful to give an even more insightful picture of the forces at play. For instance, in previous works, we also relied on using tools from conceptual density functional theory (CDFT) to describe the molecular electronegativity and nucleophilic/electrophilic areas of the complex,94 or intrinsic bond orbitals (IBO)95 for a complementary characterization of the metal–metal bond nature. However, while the plethora of approaches within DFT and post-Hartree–Fock methods can surely be useful and insightful, we believe that the composite protocol presented here is a versatile, unbiased, accessible and easy-to-use way to quantitatively characterize homogeneous cooperative small molecule activation processes.
Conclusions and outlook
The efficient activation of small molecules is nowadays a pressing environmental and technological challenge due to their atmospheric abundance and their advantageous chemical reutilization. Cooperativity in small molecule activation has emerged as a particularly flexible and valuable tool to improve these processes. In this framework, an accurate and unbiased computational description of these reactions is essential to further drive the experimental exploration and discovery of novel increasingly efficient processes. In this Feature Article, we present recent experimental advances on cooperative small molecule activation processes mediated by weakly polar or apolar bonds together with our recent extensive work on the theoretical characterization of these reactions. We show how a thorough and unbiased theoretical characterization of the electronic structure of the involved species is essential for rationalizing the experimentally observed phenomena. Furthermore, we also demonstrate how theoretical approaches allow to inductively extract general principles and knowledge on an entire class of processes from single cases, sometimes resulting in unveiling unexpected shifts in previously established paradigms. The experimental work in this field has been intense due to the promising and tunable features of cooperative processes and we have reason to believe that the attention towards these systems will continue to increase. In this scenario, this Feature Article hopefully provides the readership with a broad overview of these processes, as well as with a simple and effective modus operandi to offer solid computational support to experimental discovery. We aim to inspire chemists to explore species containing apolar o weakly polar bonds and expand the range of their applications as catalysts for small molecules activation.Author contributions
All authors contributed equally to the conceptualization, writing and editing of this Feature Article.Conflicts of interest
There are no conflicts to declare.Acknowledgements
This work has been funded by the European Union – NextGenerationEU under the Italian Ministry of University and Research (MUR) National Innovation Ecosystem grant ECS00000041 – VITALITY – CUP B43C22000470005. Funding by the European Union – NextGenerationEU, AdP POR H2 project L. A. 1.1.35 CUP B93C22000630006 is also gratefully acknowledged. LB acknowledges support from the Ministero dell’Università e della Ricerca (MUR) through PRIN 2022 project “REVOLUTION” (2022HRZH7P).Notes and references
- W. B. Tolman, Activation of Small Molecules, Wiley, 2006 Search PubMed.
- D. W. Stephan and G. Erker, Angew. Chem., Int. Ed., 2010, 49, 46–76 CrossRef CAS PubMed.
- D. W. Stephan, Dalton Trans., 2009, 3129–3136 RSC.
- R. D. Dewhurst, M. A. Légaré and H. Braunschweig, Commun. Chem., 2020, 3, 1–4 CrossRef PubMed.
- P. P. Power, Nature, 2010, 463, 171–177 CrossRef CAS PubMed.
- C. Weetman and S. Inoue, ChemCatChem, 2018, 10, 4213–4228 CrossRef CAS.
- S. Fujimori and S. Inoue, Eur. J. Inorg. Chem., 2020, 3131–3142 CrossRef CAS PubMed.
- C. Camp and J. Arnold, Dalton Trans., 2016, 45, 14462–14498 RSC.
- M. Navarro, J. J. Moreno, M. Pérez-Jiménez and J. Campos, Chem. Commun., 2022, 58, 11220–11235 RSC.
- J. Campos, Nat. Rev. Chem., 2020, 4, 696–702 CrossRef CAS PubMed.
- S. Sinhababu, Y. Lakliang and N. P. Mankad, Dalton Trans., 2022, 51, 6129–6147 RSC.
- Y. Wang, E. Chen and J. Tang, ACS Catal., 2022, 12, 7300–7316 CrossRef CAS PubMed.
- E. Fujita, Coord. Chem. Rev., 1999, 185–186, 373–384 CrossRef CAS.
- H. Kumagai, Y. Tamaki and O. Ishitani, Acc. Chem. Res., 2022, 55, 978–990 CrossRef CAS PubMed.
- P. R. Yaashikaa, P. Senthil Kumar, S. J. Varjani and A. Saravanan, J. CO2 Util., 2019, 33, 131–147 CrossRef CAS.
- Webpage: https://gml.noaa.gov/ccgg/trends/monthly.html, accessed 19 October 2023.
- Webpage: https://webbook.nist.gov/cgi/cbook.cgi?ID=C124389&Mask=1, accessed 18 October 2023.
- R. Lalrempuia, A. Stasch, A. Stasch and C. Jones, Chem. Sci., 2013, 4, 4383–4388 RSC.
- A. F. R. Kilpatrick and F. G. N. Cloke, Chem. Commun., 2014, 50, 2769–2771 RSC.
- C. E. Kefalidis, C. Jones and L. Maron, Dalton Trans., 2016, 45, 14789–14800 RSC.
- A. F. R. Kilpatrick, J. C. Green and F. G. N. Cloke, Organometallics, 2015, 34, 4830–4843 CrossRef CAS PubMed.
- F. Hanusch, L. Groll and S. Inoue, Chem. Sci., 2021, 12, 2001–2015 RSC.
- J. Li, M. Hermann, G. Frenking and C. Jones, Angew. Chem., Int. Ed., 2012, 51, 8611–8614 CrossRef CAS PubMed.
- A. Caise, L. P. Griffin, C. McManus, A. Heilmann and S. Aldridge, Angew. Chem., Int. Ed., 2022, 61, e202117496 CrossRef CAS PubMed.
- J. Hicks, A. Mansikkamäki, P. Vasko, J. M. Goicoechea and S. Aldridge, Nat. Chem., 2019, 11, 237–241 CrossRef CAS PubMed.
- C. McManus, J. Hicks, X. Cui, L. Zhao, G. Frenking, J. M. Goicoechea and S. Aldridge, Chem. Sci., 2021, 12, 13458–13468 RSC.
- H. Y. Liu, R. J. Schwamm, M. S. Hill, M. F. Mahon, C. L. McMullin and N. A. Rajabi, Angew. Chem., Int. Ed., 2021, 60, 14390–14393 CrossRef CAS PubMed.
- M. M. D. Roy, J. Hicks, P. Vasko, A. Heilmann, A. M. Baston, J. M. Goicoechea and S. Aldridge, Angew. Chem., Int. Ed., 2021, 60, 22301–22306 CrossRef CAS PubMed.
- S. Sinhababu, M. R. Radzhabov, J. Telser and N. P. Mankad, J. Am. Chem. Soc., 2022, 144, 3210–3221 CrossRef CAS PubMed.
- D. Sorbelli, L. Belpassi and P. Belanzoni, J. Am. Chem. Soc., 2021, 143, 14433–14437 CrossRef CAS PubMed.
- A. Hinz, A. Schulz and A. Villinger, Angew. Chem., Int. Ed., 2016, 55, 12214–12218 CrossRef CAS PubMed.
- L. Zhao, F. Huang, G. Lu, Z. X. Wang and P. V. R. Schleyer, J. Am. Chem. Soc., 2012, 134, 8856–8868 CrossRef CAS PubMed.
- Y. Jung, M. Brynda, P. P. Power and M. Head-Gordon, J. Am. Chem. Soc., 2006, 128, 7185–7192 CrossRef CAS PubMed.
- M. Hermann, C. Goedecke, C. Jones and G. Frenking, Organometallics, 2013, 32, 6666–6673 CrossRef CAS.
- L. Zhao, M. von Hopffgarten, D. M. Andrada and G. Frenking, Wiley Interdiscip. Rev.: Comput. Mol. Sci., 2018, 8, 1345 Search PubMed.
- M. Mitoraj and A. Michalak, J. Mol. Model., 2007, 13, 347–355 CrossRef CAS PubMed.
- A. Michalak, M. Mitoraj and T. Ziegler, J. Phys. Chem. A, 2008, 112, 1933–1939 CrossRef CAS PubMed.
- I. F. Leach, D. Sorbelli, L. Belpassi, P. Belanzoni, R. W. A. Havenith and J. E. M. N. Klein, Dalton Trans., 2023, 52, 11–15 RSC.
- D. Sorbelli, L. Belpassi and P. Belanzoni, Inorg. Chem., 2022, 61, 1704–1716 CrossRef CAS PubMed.
- D. Sorbelli, E. Rossi, R. W. A. Havenith, J. E. M. N. Klein, L. Belpassi and P. Belanzoni, Inorg. Chem., 2022, 61, 7327–7337 CrossRef CAS PubMed.
- J. Hicks, P. Vasko, J. M. Goicoechea and S. Aldridge, Angew. Chem., Int. Ed., 2021, 60, 1702–1713 CrossRef CAS PubMed.
- D. Sorbelli, L. Belpassi and P. Belanzoni, Chem. Sci., 2022, 13, 4623–4634 RSC.
- H. J. Freund and M. W. Roberts, Surf. Sci. Rep., 1996, 25, 225–273 CrossRef.
- A. Mazheika, Y. G. Wang, R. Valero, F. Viñes, F. Illas, L. M. Ghiringhelli, S. V. Levchenko and M. Scheffler, Nat. Commun., 2022, 13, 1–13 Search PubMed.
- M. K. Singla, P. Nijhawan and A. S. Oberoi, Environ. Sci. Pollut. Res., 2021, 28, 15607–15626 CrossRef CAS PubMed.
- G. J. Kubas, Chem. Rev., 2007, 107, 4152–4205 CrossRef CAS PubMed.
- G. H. Spikes, J. C. Fettinger and P. P. Power, J. Am. Chem. Soc., 2005, 127, 12232–12233 CrossRef CAS PubMed.
- J. Li, C. Schenk, C. Goedecke, G. Frenking and C. Jones, J. Am. Chem. Soc., 2011, 133, 18622–18625 CrossRef CAS PubMed.
- T. J. Hadlington, M. Hermann, J. Li, G. Frenking and C. Jones, Angew. Chem., Int. Ed., 2013, 52, 10199–10203 CrossRef CAS PubMed.
- D. Sorbelli, L. Belpassi and P. Belanzoni, Chem. Sci., 2023, 14, 889–896 RSC.
- D. J. Gorin and F. D. Toste, Nature, 2007, 446, 395–403 CrossRef CAS PubMed.
- M. Devillard, R. Declercq, E. Nicolas, A. W. Ehlers, J. Backs, N. Saffon-Merceron, G. Bouhadir, J. C. Slootweg, W. Uhl and D. Bourissou, J. Am. Chem. Soc., 2016, 138, 4917–4926 CrossRef CAS PubMed.
- E. A. Davidson and D. Kanter, Environ. Res. Lett., 2014, 9, 105012 CrossRef.
- D. J. Wuebbles, Science, 2009, 326, 56–57 CrossRef CAS PubMed.
- A. R. Ravishankara, J. S. Daniel and R. W. Portmann, Science, 2009, 326, 123–125 CrossRef CAS PubMed.
- M. J. Prather, Science, 1998, 279, 1339–1341 CrossRef CAS PubMed.
- K. Severin, Chem. Soc. Rev., 2015, 44, 6375–6386 RSC.
- F. Le Vaillant, A. Mateos Calbet, S. González-Pelayo, E. J. Reijerse, S. Ni, J. Busch and J. Cornella, Nature, 2022, 604, 677–683 CrossRef CAS PubMed.
- A. Pomowski, W. G. Zumft, P. M. H. Kroneck and O. Einsle, Nature, 2011, 477, 234–237 CrossRef CAS PubMed.
- W. G. Zumft and P. M. H. Kroneck, Adv. Microb. Physiol., 2006, 52, 107–227 CrossRef PubMed.
- L. Zhang, A. Wüst, B. Prasser, C. Müller and O. Einsle, Proc. Natl. Acad. Sci. U. S. A., 2019, 116, 12822–12827 CrossRef CAS PubMed.
- S. I. Gorelsky, S. Ghosh and E. I. Solomon, J. Am. Chem. Soc., 2006, 128, 278–290 CrossRef CAS PubMed.
- D. Sorbelli, L. Belpassi and P. Belanzoni, Chem. – Eur. J., 2023, 29, e202203584 CrossRef CAS PubMed.
- E. M. Johnston, C. Carreira, S. Dell’Acqua, S. G. Dey, S. R. Pauleta, I. Moura and E. I. Solomon, J. Am. Chem. Soc., 2017, 139, 4462–4476 CrossRef CAS PubMed.
- I. Bar-Nahum, A. K. Gupta, S. M. Huber, M. Z. Ertem, C. J. Cramer and W. B. Tolman, J. Am. Chem. Soc., 2009, 131, 2812–2814 CrossRef CAS PubMed.
- E. Otten, R. C. Neu and D. W. Stephan, J. Am. Chem. Soc., 2009, 131, 9918–9919 CrossRef CAS PubMed.
- K. Sekine, Gold Bull., 2017, 50, 203–209 CrossRef CAS.
- C. McManus, A. E. Crumpton and S. Aldridge, Chem. Commun., 2022, 58, 8274–8277 RSC.
- D. Sorbelli, L. Belpassi and P. Belanzoni, Inorg. Chem., 2022, 61, 21095–21106 CrossRef CAS PubMed.
- J. I. Van der Vlugt, Chem. Soc. Rev., 2010, 39, 2302–2322 RSC.
- G. te Velde, F. M. Bickelhaupt, E. J. Baerends, C. Fonseca Guerra, S. J. A. van Gisbergen, J. G. Snijders and T. Ziegler, J. Comput. Chem., 2001, 22, 931–967 CrossRef CAS.
- F. Neese, WIREs Comput. Mol. Sci., 2012, 2, 73–78 CrossRef CAS.
- S. Rampino, L. Belpassi, F. Tarantelli and L. Storchi, J. Chem. Theory Comput., 2014, 10, 3766–3776 CrossRef CAS PubMed.
- D. Sorbelli, P. Belanzoni, L. Storchi, O. Bizzarri, B. Bizzarri, E. Mosconi and L. Belpassi, Mol. Phys., 2023, e2245061 CrossRef.
- Webpage: Energy Decomposition Analysis (EDA)—Tutorials, 2023.1 documentation, https://www.scm.com/doc/Tutorials/Analysis/EDA.html, accessed 18 October 2023.
- P. Jerabek, P. Schwerdtfeger and G. Frenking, J. Comput. Chem., 2019, 40, 247–264 CrossRef CAS PubMed.
- L. Belpassi, I. Infante, F. Tarantelli and L. Visscher, J. Am. Chem. Soc., 2008, 130, 1048–1060 CrossRef CAS PubMed.
- R. F. Nalewajski and J. Mrozek, Int. J. Quantum Chem., 1994, 51, 187–200 CrossRef CAS.
- R. F. Nalewajski, J. Mrozek and A. Michalak, Int. J. Quantum Chem., 1997, 61, 589–601 CrossRef CAS.
- T. Lu and F. Chen, J. Phys. Chem. A, 2013, 117, 3100–3108 CrossRef CAS PubMed.
- M. P. Mitoraj, A. Michalak and T. Ziegler, J. Chem. Theory Comput., 2009, 5, 962–975 CrossRef CAS PubMed.
- G. Bistoni, S. Rampino, F. Tarantelli and L. Belpassi, J. Chem. Phys., 2015, 142, 084112 CrossRef PubMed.
- N. Salvi, L. Belpassi and F. Tarantelli, Chem. – Eur. J., 2010, 16, 7231–7240 CrossRef CAS PubMed.
- Webpage: GitHub – BERTHA-4c-DKS/pycubescd, https://github.com/BERTHA-4c-DKS/pycubescd, accessed 19 October 2023.
- L. Deng and T. Ziegler, Int. J. Quantum Chem., 1994, 52, 731–765 CrossRef CAS.
- C. Gonzalez and H. B. Schlegel, J. Phys. Chem., 1990, 94, 5523–5527 CrossRef CAS.
- D. H. Ess, S. E. Wheeler, R. G. Iafe, L. Xu, N. Çelebi-Ölçüm and K. N. Houk, Angew. Chem., Int. Ed., 2008, 47, 7592–7601 CrossRef CAS PubMed.
- D. Sorbelli, P. Belanzoni, L. Belpassi, J. W. Lee and G. Ciancaleoni, J. Comput. Chem., 2022, 43, 717–727 CrossRef CAS PubMed.
- F. M. Bickelhaupt and K. N. Houk, Angew. Chem., Int. Ed., 2017, 56, 10070–10086 CrossRef CAS PubMed.
- I. Fernández and F. M. Bickelhaupt, Chem. Soc. Rev., 2014, 43, 4953–4967 RSC.
- P. Vermeeren, S. C. C. van der Lubbe, C. Fonseca Guerra, F. M. Bickelhaupt and T. A. Hamlin, Nat. Protoc., 2020, 15, 649–667 CrossRef CAS PubMed.
- G. Bistoni, L. Belpassi and F. Tarantelli, J. Chem. Theory Comput., 2016, 12, 1236–1244 CrossRef CAS PubMed.
- I. Fernández, Chem. Commun., 2022, 58, 4931–4940 RSC.
- P. Geerlings, F. De Proft and W. Langenaeker, Chem. Rev., 2003, 103, 1793–1873 CrossRef CAS PubMed.
- G. Knizia, J. Chem. Theory Comput., 2013, 9, 4834–4843 CrossRef CAS PubMed.
| This journal is © The Royal Society of Chemistry 2024 |


