 Open Access Article
Creative Commons Attribution 3.0 Unported Licence
Crystal phase engineering SiC nanosheets for enhancing photocatalytic CO2 reduction†
Bing
Wang‡
a,
Xiaotong
Shang‡
a,
Jiangjie
Zhang
a,
Jinni
Shen
 a,
Xuxu
Wang
 a and
Zizhong
Zhang
 *ab
*ab
aResearch Institute of Photocatalysis, State Key Laboratory of Photocatalysis on Energy and Environment, Fuzhou University, Fuzhou, 350002, China. E-mail: z.zhang@fzu.edu.cn
bQingyuan Innovation Laboratory, Quanzhou 362801, China
First published on 23rd November 2022
Abstract
The reduction of CO2 by photocatalysis has been widely considered, but the rapid recombination of photogenerated carriers on photocatalysts has become a major constraint on efficiency. Herein, we prepare SiC nanosheets with 2H and 3C phase junctions by an in situ high-pressure solvothermal method. The prepared 2H–3C SiC nanosheets promote charge carrier separation and the photocatalytic reduction efficiency of CO2 to CO is greatly improved without using a sacrificial agent. The CO production rate of this photocatalyst reached 6.29 μmol g−1 h−1, which is about 2.4 times that of pure 3C-SiC. This work deepens the understanding of the influence of the heterophase on photocatalytic activity and provides a novel idea for the application of SiC in catalysis.
Environmental significanceExcessive CO2 emissions from fossil energy combustion have caused an imbalance in the natural carbon cycle, leading to gradual warming of the global climate and environmental problems. Artificial photocatalysis provides an alternative for the conversion of CO2 to chemicals using renewable solar energy under ambient conditions. Silicon carbide (SiC) is one of the promising photocatalysts for CO2 reduction. In this work, SiC nanosheets with 2H and 3C phase junctions are fabricated by an in situ high-pressure solvothermal method. The 2H-phase is grown in situ on the flaky 3C phase SiC to generate a stronger two-phase interface to greatly enhance photocatalytic CO2 reduction with H2O. This work reveals that the morphology and composited structure SiC materials are closely related to photocatalytic activity. |
1. Introduction
With the extensive use of fossil energy, CO2 emissions have far exceeded the processing capacity of natural plants.1–3 The massive emission of CO2 has a huge impact on the environment. Reduction of CO2 to generate chemical products (e.g., CO, CH4, CH3OH and HCOOH) is a viable method to relieve global warming and promote the carbon cycle.4–6 Photocatalysis is seen as an ideal way to utilize the massive CO2 and produce renewable energy. However, most of the semiconductor photocatalysts so far have low activity for CO2 reduction. Improving the efficiency of current photocatalysts has become an urgent problem to be solved.Silicon carbide (SiC), as a stable and non-metallic oxide semiconductor material with the excellent mechanical and electronic properties of SiC,7–11 is gradually emerging in the field of photocatalysis.12–14 Moreover, the band gap width of SiC is moderate, especially it has a suitable negative conduction band potential (−1.40 V) for water reduction and CO2 reduction. The reduction of CO2 by SiC was reported as early as 1979,15 but so far, the activity of SiC in photocatalytic CO2 reduction has been low. The main reason is that the rapid recombination of carriers leads to a decrease in quantum efficiency. SiC has low flexibility in regulating the electronic structure, and the mobility difference between electrons and holes is large, which is not conducive to electron generation and transfer.16,17 Therefore, the practical application of SiC in photocatalysis still faces great challenges. Compounding with other semiconductor materials should be the only solution to the disadvantages of SiC in the photocatalytic reduction of CO2.
It is well documented that constructing a heterojunction structure has been one of the efficient pathways for the design of composite photocatalysts to improve the efficiency of carrier separation.18–20 The construction of a stable heterojunction interface is the key,21,22 which is related to lattice matched heterointerfaces and preparation methods. Traditional methods mostly combine two materials by electrostatic force,23,24 but it is difficult to achieve the optimal contact effect, and separation may occur between two materials with the change of environmental pH.25–27 Compared with heterogeneous junctions constructed using different semiconductors, heterophase junctions are more efficient because they have the same chemical composition and a good lattice matching to construct a more desirable interface and thus facilitate carrier migration at the interface more efficiently.28,29 A large number of studies have confirmed that heterophase junction design can effectively improve the performance of photocatalysis.30,31 The commercial material P25 is a mixture of anatase and rutile phases, and the space charge layer can form when the two phases are in contact, which promotes the transfer of holes from anatase to rutile and improves the efficiency of electron–hole separation.32 Li's team reported an α–β Ga2O3 heterophase junction to improve the photocatalytic activity of overall water splitting because of the enhanced charge separation on the heterophase junction.33 In addition, the NaNbO3 photocatalyst with cubic-orthorhombic surface junctions also greatly enhances the photocatalytic activity by improving charge separation.34 These studies indicate that there are still great application prospects for improving photocatalytic performance by constructing mixed phase junctions.
Traditional 3C–SiC materials are synthesized by high temperature calcination (1400 °C),35 and a higher temperature (1800 °C) is often needed to generate the lattice matched 2H phase.36,37 The very high reaction temperature will often lead to a series of challenges such as increasing catalyst particle size and decreasing specific surface, which will adversely affect the catalytic reaction.
Herein, we propose an in situ high-pressure solvothermal method to construct composite interface 2H–3C SiC nanosheets through PVP addition adjustment. The 2H phase grows in situ on the flaky 3C phase SiC to generate a stronger two-phase interface. Meanwhile, the degree of the phase transition from 3C to 2H can be tuned by PVP addition. Among various SiC samples, the highest phase interface content 2H–3C SiC displays the photocatalytic CO2 reduction with the highest activity of CO. This discovery not only shows that the interface formed between different phases of SiC is beneficial to accelerate electron transfer and improve photocatalytic activity, but also shows that SiC is still a promising photocatalytic material.
2. Experimental section
2.1 Materials
PVP was obtained from Aladdin Reagent Company. Other reagents used in the study, including C2H5OH, SiO2 and Mg powder were of analytical reagent grade and acquired from Sinopharm Chemical Reagent Company. All reagents were used without further purification.2.2 Preparation of 3C and 2H–3C SiC nanocrystals
In a typical synthesis procedure, 1.5 g of Mg powder and 1.2 g of SiO2 were added to 20 mL ethanol under magnetic stirring. After stirring evenly, PVP was introduced into the mixed liquor until it completely dissolved. The mixture was loaded into a stainless steel autoclave and maintained at 280 °C for 6 h, and then cooled down to room temperature. The raw product was washed with hydrochloric acid to remove the byproduct MgO, and then shifted to a tubular furnace and heated in a flowing O2 atmosphere at 600 °C for 6 h to remove residual carbon. Thereafter, the product was immersed in a solution of hydrofluoric acid and nitric acid to eliminate unreacted SiO2 and intermediate Si. The final sample was washed with deionized water and ethanol several times and dried in a vacuum oven at 60 °C for 6 h. According to the amount of added PVP 0 g, 0.2 g, 0.3 g, 0.5 g, and 0.8 g, the prepared SiC samples were named as SiC-0, SiC-0.2, SiC-0.3, SiC-0.5, and SiC-0.8, respectively.2.3 Characterization
The phase structure was characterized using a powder X-ray diffractometer (XRD, Bruker D8 Advance) with Cu Kα radiation (λ = 0.15406 nm) operating at 40 kV and 40 mA. An X-ray photoelectron spectrometer (XPS, Thermo Fisher Scientific ESCALAB 250) equipped with an Al Kα source was utilized to analyze the elemental composition and the surface structure of the samples. Transmission electron microscopy (TEM) was used to characterize the morphology and composition of the samples by using a JEOL model JEM 2010 EX instrument at an accelerating voltage of 200 kV. Optical absorption studies were carried out using a UV-vis spectrophotometer (DRS, Cary500) with pure BaSO4 as a reflectance standard.2.4 Phototcatalytic activity measurements
The photocatalytic reduction of CO2 with pure water was carried out in a 40 mL Schlenk flask reactor under atmospheric pressure at room temperature. In this system, 10 mg of photocatalyst was placed at the bottom of the reactor, and then pure CO2 gas was passed for 40 minutes as a reactant and to exclude the air as well. After the reactor was sealed, 10 μL of pure water was injected into the reactor via the silicone rubber septum. After stirring for 30 minutes under dark conditions to achieve adsorption equilibrium, the photosource was turned on. The reactor was irradiated with a 300 W Xe lamp (PLS-SXE300, Perfectlight, China). After 4 hours, 0.5 mL reaction gas was extracted into a gas chromatograph (GC-7890B, Agilent) which was equipped with a flame ionization detector (FID), a thermal conductivity detector (TCD) and a methanation reactor that can convert CO and CO2 to CH4.2.5 Photoelectrochemical measurements
Photoelectrochemical measurements were carried out on a conventional three-electrode electrochemical system with a working electrode, a platinum foil counter electrode, and a saturated Ag/AgCl reference electrode. Sodium sulfate solution (0.2 M) was used as the electrolyte solution, and a 300 W Xe lamp was used as the light source. The working electrode was made of FTO glass, which was cleaned by sonication in a cleanout fluid and water in sequence. Then the photocatalyst was dispersed in ethanol under sonication to form a suspension. The working electrode was prepared by spreading the suspension onto the conductive surface of FTO glass.3. Results and discussion
SiC nanosheet samples were prepared by a high-pressure solvothermal reaction. PVP addition can tune the crystal phase structure of SiC. Without PVP addition, pure 3C phase SiC was obtained. The addition of PVP led to the transformation of the 3C phase to the 2H phase, partially forming a composite 2H–3C SiC sample. The phase transformation was observed by XRD, as shown in Fig. 1(a). SiC-0 displayed five typical peaks at 2θ degrees of 35.58, 41.38, 59.98, 71.78 and 75.49°, which can be well indexed to the (111), (200), (220), (311), and (222) reflections of the 3C-SiC (PDF#29-1129), respectively. When PVP was added, some small XRD peaks assigned to 2H–SiC (PDF#29-1126) started to appear besides 3C–SiC. With increasing PVP addition, the corresponding characteristic peaks of 2H–SiC were gradually enhanced. The XRD peak intensity of 2H–SiC was highest when the addition amount of PVP was 0.3 g, which meant the maximum content of 2H phase in SiC-0.3. However, the intensity of the characteristic peaks of 2H–SiC began to decrease upon further addition of PVP more than 0.3 g. We concluded that a certain amount of PVP could promote the generation of the 2H phase, but excessive PVP will inhibit this transition.38,39 Under constant reaction temperature and pressure, the growing tendency of the 3C phase was much higher than that of the 2H phase. Thus, the characteristic peaks of 3C SiC was dominated in XRD pattern when without PVP was added. At a low concentration of PVP solution, PVP was combined with the lowest energy (111) crystal surface of the 3C phase, thus inhibiting the growth of the 3C phase.40 The (100) and (101) crystal surfaces of the 2H phase still grew freely, so that the characteristic peaks of the 2H phase began to appear. When the content of PVP was further increased, PVP showed a very high tendency to combine with each crystal surface, so that the overall growth was inhibited because of the passivation effect. Therefore, the diffraction peak of SiC-0.8 was much lower than that of SiC-0 in the XRD pattern. To further verify this phenomenon, these samples were characterized by Raman spectroscopy as shown in Fig. 1(b). Two Raman peaks at 785 cm−1 and 958 cm−1 can be observed for SiC-0, which correspond to the transverse optic (TO) and longitudinal optic (LO) modes of 3C–SiC.41 So we can confirm that the sample prepared without PVP actually only exhibits the 3C phase. Other samples prepared with PVP addition showed a new Raman peak at 245.7 cm−1, and this peak can be attributed to the transverse acoustic (TA) characteristic peak of 2H-SiC.42 The intensity of the Raman peak at 245.7 cm−1 of 2H–SiC reached the maximum with addition of 0.3 g PVP, and then decreased with further addition of PVP. The variation trends in Raman spectra were consistent with the XRD results.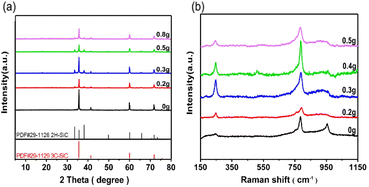 | ||
| Fig. 1 (a) XRD patterns and (b) Raman spectra of SiC samples with addition of different amounts of PVP. | ||
The ratio of the Raman peak area of the TA characteristic peak for the 2H phase to the TO peak for 3C phase SiC was used to quantify the content of the 2H phase relative to the 3C phase in various SiC samples, as summarized in Table S1.† The area ratio of the two characteristic peaks increased first and then decreased when the PVP addition increased. When the PVP addition was 0.3 g, the peak area ratio reached the maximum of 0.4674. These results demonstrated that the composite 2H–3C SiC sample can be tuned with PVP addition and SiC-0.3 has the highest content of 2H phase.
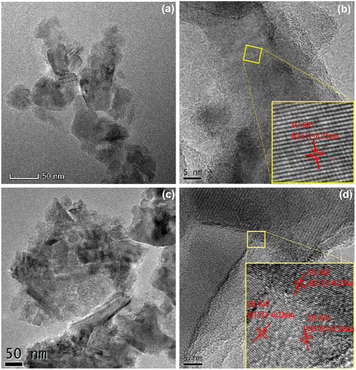
The microstructure of SiC was monitored by TEM, as shown in Fig. 2. Fig. 2(a and b) show that the prepared 3C–SiC sample displayed a lamellar structure with a plane size less than 50 nm, and the interplanar distances were 0.25 nm which belong to the (111) crystal plane of 3C–SiC. For the 2H–3C composite sample SiC-0.3, the sample size expanded and new flakes were extended at lamellar edges as shown in Fig. 2(c). In Fig. 2(d), different interplanar distances of 0.23 nm and 0.25 nm can be observed, which belong to the (101) crystal surface of 2H–SiC and the (111) crystal surface of 3C–SiC, respectively. Hence, we speculated that the 2H phase might be formed by epitaxial growth of the 3C phase, and a very tight contact interface was formed between the two crystal phases by in situ growth.
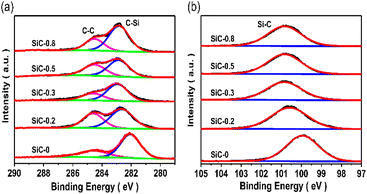
The influence of the heterophase junction on the surface chemical states of SiC was investigated by XPS characterization. For samples in Fig. 3(a), if no PVP was added, the C 1s XPS peaks located at 284.6 eV and 282.04 eV corresponded to the C–C standard peak and C–Si characteristic peak,43 respectively. When PVP was added, the binding energy of the C-Si peak was positively shifted to a higher value. When PVP addition reached 0.3 g, the deviation reached the maximum and then moved to a lower value with the further increase of PVP. In Si 2p XPS shown in Fig. 3(b), only one peak was located at 99.99 eV, which corresponds to the characteristic peak of Si–C.44 With increasing PVP addition, the Si 2p binding energy presented the same shift tendency as that of C 1s for all SiC samples. The increase of binding energy of both C 1s and Si 2p was caused by the formation of the 2H phase. The formation of the heterophase promoted the electron transfer at the phase interface.
The experimental measurements of photocatalytic CO2 reduction were carried out in a closed reaction system with a small amount of evaporated water under full range irradiation of a 300 W Xe lamp. The reaction products were mainly CO accompanied by small amounts of O2 and CH4.
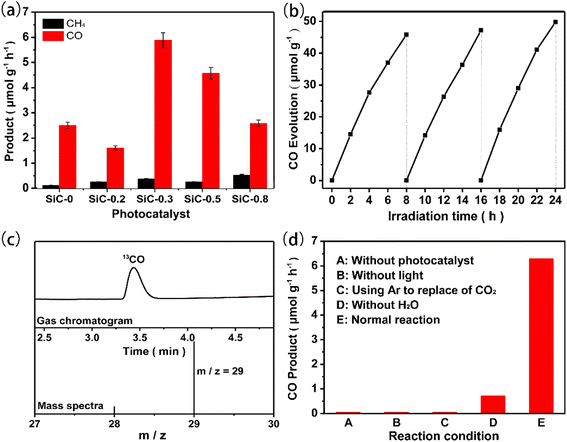
As shown in Fig. 4(a), SiC samples prepared with an increasing amount of PVP displayed a volcano-shaped curve for CO production. Among the various samples, the photocatalytic activity of SiC-0.3 was the best, and the CO production rate reached 6.29 μmol g−1 h−1, which was 2.4 times that of pure phase SiC-0, and with the increase of 2H phase content, the photocatalytic activity also increased gradually. This demonstrated that the maximum ratio of 2H to 3C SiC in the SiC-0.3 sample formed the optimal heterophase junction structure to enhance the photocatalytic CO2 reduction. We represented the relative ratio of 2H–SiC and 3C–SiC by the ratio of the Raman peak intensities of the 2H and 3C phases, and plotted the CO2 reduction activity with the relative ratio of 2H/3C in Fig. S3.† On the whole, the CO product was nearly linear with the ratio of 2H/3C in SiC heterophase photocatalysts. This well demonstrates that the 2H–3C heterojunction plays an important role in enhancing the reduction of CO2. Meanwhile, we studied the CO2 reduction performance over the common SiC samples prepared by high temperature calcination, as shown in Fig. S4.† The CO activity of nanosheet SiC was about twice that of bulk SiC, indicating that nanosheet SiC indeed promotes the CO2 photocatalytic reduction performance. The sample was employed in CO2 reduction stability tests. As shown in Fig. 4(b), after 3 cycles (8 hours per cycle, 24 hours in total), the CO production rate remained stable. This indicated an excellent photocatalytic stability of 2H–3C SiC samples towards photocatalytic CO2 reduction. In order to provide conclusive evidence to verify the source of CO, we carried out the isotope tracer experiment under different control conditions. The isotope experiment was carried out by using 13CO2 instead of 12CO2, and then the CO produced was analyzed by GC-MS. Fig. 4(c) shows that only 13CO (m/z = 29) was detected when 13CO2 was the reactant. The result of isotope experiments verified that CO evolution originated from the reduction of CO2. According to the control experiment in Fig. 4(d), when the reactions took place in the absence of either photocatalyst or light irradiation or CO2 resource, we could not detect any products. These results indicated that both light and catalysts were necessary for CO2 reduction. Without adding H2O into the reaction systems, a small amount of CO was produced over 2H–3C SiC samples because of the presence of the adsorbed H2O on the SiC surface for photocatalytic CO2 reduction. The hydrogen-producing side reaction was very common in CO2 reduction. However, the generation of H2 was not observed in the gas–solid reaction system of CO2 reduction over SiC samples. This was because SiC photocatalysts lacked the active sites for H2 evolution, proton reduction had a high overpotential for H2 evolution on the parent SiC surface and a very small amount of water was added into the reaction system.
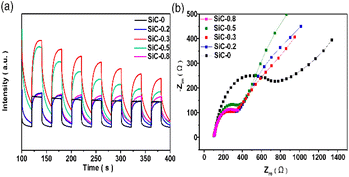
In order to clarify the intrinsic nature of 2H–3C heterophase junctions to enhance the photocatalytic performance, the charge transfer capability of the photocatalysts was investigated by photoelectrochemical measurements, as shown in Fig. 5. The transient photocurrent response of a series of SiC samples was analyzed under the illumination of a 300 W Xe lamp. At a bias voltage of 0.5 V, the photocurrent density of SiC was positively correlated with the content of heterophase junctions (Fig. 5(a)). The highest content of heterophase junctions in photocatalyst SiC-0.3 resulted in a highest photocurrent intensity. Fig. 5(b) shows the electrochemical impedance spectra of different samples. It can be seen that compared with SiC-0, the Nyquist curve radius of 2H–3C SiC was smaller, which indicated its excellent electrical conductivity. It was further explained that the existence of heterophase junctions was the reason for the low resistance or high electron mobility in 2H–3C SiC. Therefore, 2H–3C SiC was more conducive to the separation of photogenerated carriers than pure phase 3C–SiC, which in turn improved the photocatalytic performance. The steady-state fluorescence intensity of 2H–3C SiC was much lower than that of 3C–SiC (Fig. S1†), which also confirmed the lower recombination rate of holes and electrons in 2H–3C SiC. Therefore, the 2H–3C heterophase can effectively inhibit the recombination of photogenerated carriers generated on the surface, enhancing the utilization efficiency of electrons in photocatalytic CO2 reduction and the conversion efficiency of the reaction.
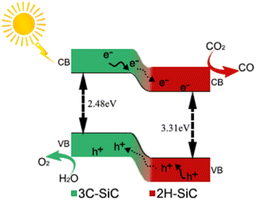
The band gap energy levels of SiC samples were determined by the combination of UV-vis diffuse reflection spectra and Mott–Schottky curves. As shown in Fig. 6(a) and (b), the light absorption properties of the samples can be investigated by UV-vis diffuse reflection spectroscopy (DRS). The absorption band edge of the samples can be ascertained by the intercept of the spectrum's tangent with the horizontal axis. According to the formula, the optical energy band gap (eV) = 1240/optical absorption band edge, and we calculated the band gaps of all samples as summarized in Table S2.† As for pure 3C SiC, its absorption band edge was 507 nm. However, the absorption band edge of SiC-0.3 was 470 nm, indicating that the formation of the 2H–SiC phase can affect the light absorption of the samples. Compared to SiC-0, the absorption band edge of 2H–3C SiC samples all showed a blue shift to some degree. The blue shift law was consistent with the change trend of the relative content of the 2H phase. The band gap widened with the increase of the 2H phase, which was ascribed to the broad band gap of the 2H phase.45,46 The Mott–Schottky curve (Fig. 6(c) and (d)) was utilized to determine the flat band potential of SiC-0 and SiC-0.3. Because SiC was an n-type semiconductor, the conduction band position was approximately equal to that of the flat band.47 So the conduction band positions of SiC-0 and SiC-0.3 were approximately calculated to be −1.14 V and −1.0 V, respectively. As can be seen from the band structure, the 2H–SiC has better electron delocalization with corresponding band gaps of 3.31 eV and the 3C–SiC has band gaps of 2.48 eV. Combining theoretical calculation with experimental data, the possible reaction process of photocatalytic CO2 reduction over the 2H–3C SiC catalyst is proposed in Fig. 7. Upon the light illumination, 3C–SiC and 2H–SiC generate electrons and holes.
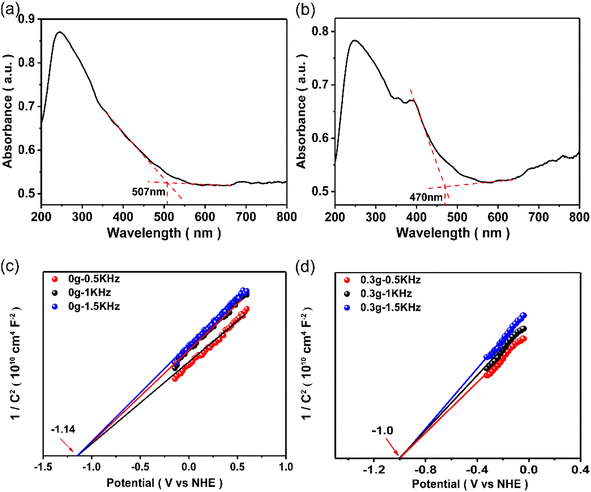 | ||
| Fig. 6 UV-vis diffuse reflection spectra of (a) 3C–SiC and (b) 2H–3C SiC. The Mott–Schottky curves of (c) 3C–SiC and (d) 2H–3C SiC. | ||
Based on the above experimental results, it can be found that the band gap of SiC-0.3 was wider than that of SiC-0, and the conduction band was reduced. Pure phase 2H–SiC cannot be synthesized when there is too much PVP. The band structures of 2H–SiC and 3C–SiC were obtained by theoretical calculations (Fig. S2†). As can be seen from the calculation results, the calculation results of 3C–SiC were very close to our actual measurements, so the band structure of 2H–SiC can also be used as a reference for the theoretical calculation. As can be seen from the band structure, 2H–SiC had better electron delocalization with the corresponding band gap of 3.31 eV and the band gap of 3C–SiC was 2.48 eV. Upon light illumination, 3C–SiC and 2H–SiC generate electrons and holes. The photo-generated electrons on the surface of 3C–SiC migrate from 3C–SiC to 2H–SiC through the heterophase interface, reducing the CO2 molecules adsorbed on the surface to CO. The photo-generated holes are concentrated in the valence band of 3C–SiC by reverse transfer, which oxidize the H2O adsorbed on the catalyst surface. The existence of the heterophase effectively separates photoelectron–hole pairs, which provides the possibility of efficient photocatalytic CO2 conversion.
4. Conclusions
Using a one-step solvothermal method, a series of 2H–3C SiC heterophase photocatalysts were successfully prepared by adjusting the amount of PVP additive, and the as-prepared photocatalysts exhibited excellent photocatalytic CO2 reduction performance. The ratio of 2H and 3C phases was affected by the amount of PVP addition, and the photocatalytic activity of 2H–3C SiC reached the maximum when the content of the two phases was equal. The CO yield reached 6.29 μmol g−1 h−1 over the optimal 2H–3C SiC heterophase photocatalyst, and the activity was 2.4 times higher than that of pure 3C–SiC. The tight heterogeneous interface formed by the in situ transformation of 2H–3C silicon carbide accelerated the separation and transfer of photogenerated carriers, and promoted the activation of carbon dioxide molecules and photocatalytic reduction conversion. This work provides some new insights into the role of 2H–3C heterophase junctions of SiC photocatalysts in the photocatalytic reduction of carbon dioxide.Conflicts of interest
There are no conflicts to declare.Acknowledgements
This work is financially supported by the National Natural Science Foundation of China (grant no. 21972020), Major Program of Qingyuan Innovation Laboratory (grant no. 00121001) and Natural Science Foundation of Fujian Province of PR China (2020L3003).Notes and references
- N. S. Lewis and D. G. Nocera, Powering the planet: chemical challenges in solar energy utilization, Proc. Natl. Acad. Sci. U. S. A, 2007, 104, 20142 CAS.
- J. Barber, Photosynthetic energy conversion: natural and artificial, Chem. Soc. Rev., 2009, 38, 185–196 RSC.
- H. B. Gray, Powering the planet with solar fuel, Nat. Chem., 2009, 1, 7 CrossRef CAS PubMed.
- A. Listorti, J. Durrant and J. Barber, Artificial photosynthesis solar to fuel, Nat. Mater., 2009, 8, U922–U929 CrossRef PubMed.
- T. Arai, S. Sato and T. Morikawa, A monolithic device for CO2 photoreduction to generate liquid organic substances in a single-compartment reactor, Energy Environ. Sci., 2015, 8, 1998–2002 RSC.
- J. Liu, G. Dong, J. Jing, S. Zhang, Y. Huang and W. Ho, Photocatalytic reactive oxygen species generation activity of TiO2 improved by the modification of persistent free radicals, Environ. Sci.: Nano, 2021, 8, 3846–3854 RSC.
- T. Guillod, R. Faerber, D. Rothmund, F. Krismer, C. M. Franck and J. W. Kolar, Dielectric losses in dry-type insulation of medium-voltage power electronic converters, IEEE J. Emerg. Sel. Top. Power Electron., 2019, 8, 2716–2732 Search PubMed.
- C. Wei, W. Guo, E. S. Pratomo, Q. Li, D. Wang, D. Whitehead and L. Li, High speed, high power density laser-assisted machining of Al-SiC metal matrix composite with significant increase in productivity and surface quality, J. Mater. Process. Technol., 2020, 285, 116784 CrossRef CAS.
- A. Oliveros, A. Guiseppi-Elie and S. E. Saddow, Silicon carbide: a versatile material for biosensor applications, Biomed. Microdevices, 2013, 15, 353–368 CrossRef PubMed.
- X. She, A. Q. Huang, O. Lucia and B. Ozpineci, Review of silicon carbide power devices and their applications, IEEE Trans. Ind. Electron., 2017, 64, 8193–8205 Search PubMed.
- E. Bekaroglu, M. Topsakal, S. Cahangirov and S. Ciraci, First-principles study of defects and adatoms in silicon carbide honeycomb structures, Phys. Rev. B: Condens. Matter Mater. Phys., 2010, 81, 075433 CrossRef.
- X. Zhou, Q. Gao, X. Li, Y. Liu, S. Zhang, Y. Fang and J. Li, Ultra-thin SiC layer covered graphene nanosheets as advanced photocatalysts for hydrogen evolution, J. Mater. Chem. A, 2015, 3, 10999–11005 RSC.
- J. Jian and J. Sun, A review of recent progress on silicon carbide for photoelectrochemical water splitting, Sol. RRL, 2020, 4, 2000111 CrossRef CAS.
- N. D. Shcherban, Review on synthesis, structure, physical and chemical properties and functional characteristics of porous silicon carbide, J. Ind. Eng. Chem., 2017, 50, 15–28 CrossRef CAS.
- T. Inoue, A. Fujishima, S. Konishi and K. Honda, Photoelectrocatalytic reduction of carbon dioxide in aqueous suspensions of semiconductor powders, Nature, 1979, 277, 637–638 CrossRef CAS.
- T. T. Mnatsakanov, M. E. Levinshtein, L. I. Pomortseva and S. N. Yurkov, Universal analytical approximation of the carrier mobility in semiconductors for a wide range of temperatures and doping densities, Semiconductors, 2004, 38, 56–60 CrossRef CAS.
- J. Geng, L. Zhao, M. Wang, G. Dong and W. Ho, The photocatalytic NO-removal activity of g-C3N4 significantly enhanced by the synergistic effect of Pd0 nanoparticles and N vacancies, Environ. Sci.: Nano, 2022, 9, 742–750 RSC.
- L. V. Bora and R. K. Mewada, Photocatalytic treatment of dye wastewater and parametric study using a novel Z-scheme Ag2CO3/SiC photocatalyst under natural sunlight, J. Environ. Chem. Eng., 2017, 5, 5556–5565 CrossRef CAS.
- Z. Chen, F. Bing, Q. Liu, Z. Zhang and X. Fang, Novel Z-scheme visible-light-driven Ag3PO4/Ag/SiC photocatalysts with enhanced photocatalytic activity, J. Mater. Chem. A, 2015, 3, 4652–4658 RSC.
- J. Lin, T. Sun, M. Li, J. Yang, J. Shen, Z. Zhang, Y. Wang, X. Zhang and X. Wang, More efficiently enhancing photocatalytic activity by embedding Pt within anatase–rutile TiO2 heterophase junction than exposing Pt on the outside surface, J. Catal., 2019, 372, 8–18 CrossRef CAS.
- K. Yang, X. Li, C. Yu, D. Zeng, F. Chen, K. Zhang, W. Huang and H. Ji, Review on heterophase/homophase junctions for efficient photocatalysis: the case of phase transition construction, Chin. J. Catal., 2019, 40, 796–818 CrossRef CAS.
- G. Meenakshi, A. Sivasamy, S. J. GA and S. Kavithaa, Preparation, characterization and enhanced photocatalytic activities of zinc oxide nano rods/silicon carbide composite under UV and visible light irradiations, J. Mol. Catal. A: Chem., 2016, 411, 167–178 CrossRef.
- Y. Wang, Z. Zhang, L. Zhang, Z. Luo, J. Shen, H. Lin, J. Long, J. C. S. Wu, X. Fu, X. Wang and C. Li, Visible-light driven overall conversion of CO2 and H2O to CH4 and O2 on 3D-SiC@2D-MoS2 heterostructure, J. Am. Chem. Soc., 2018, 140, 14595–14598 CrossRef CAS PubMed.
- H. Wang, R. Zhao, H. Hu, X. Fan, D. Zhang and D. Wang, 0D/2D Heterojunctions of Ti3C2 MXene QDs/SiC as an efficient and Robust photocatalyst for boosting the visible photocatalytic NO pollutant removal ability, ACS Appl. Mater. Interfaces, 2020, 12, 40176–40185 CrossRef CAS PubMed.
- Z.-H. Hou, J.-P. Chen, L.-J. Xie, X.-X. Wei, S.-Q. Guo and C.-M. Chen, Design of BiOBr nanosheets decorated SiC whisker hybrid structure with enhanced photocatalytic performance, Appl. Surf. Sci., 2021, 543, 148779 CrossRef CAS.
- H. Yang, R. Cao, P. Sun, J. Yin, S. Zhang and X. Xu, Constructing electrostatic self-assembled 2D/2D ultra-thin ZnIn2S4/protonated g-C3N4 heterojunctions for excellent photocatalytic performance under visible light, Appl. Catal., B, 2019, 256, 117862 CrossRef CAS.
- K. Qi, J. Jing, G. Dong, P. Li and Y. Huang, The excellent photocatalytic NO removal performance relates to the synergistic effect between the prepositive NaOH solution and the g-C3N4 photocatalysis, Environ. Res., 2022, 212, 113405 CrossRef CAS PubMed.
- Y.-p. Li, J.-y. He, X.-j. Wang, J. Zhao, R.-h. Liu, Y. Liu and F.-t. Li, Introduction of crystalline hexagonal-C3N4 into g-C3N4 with enhanced charge separation efficiency, Appl. Surf. Sci., 2021, 559, 149876 CrossRef CAS.
- Y. Z. Liu, B. Wang, D. M. Li, J. N. Shen, Z. Z. Zhang and X. X. Wang, Fabrication of 2H/3C-SiC heterophase junction nanocages for enhancing photocatalytic CO2 reduction, J. Colloid Interface Sci., 2022, 622, 31–39 CrossRef CAS PubMed.
- Y. Xie, X. Zhang, P. Ma, Z. Wu and L. Piao, Hierarchical TiO2 photocatalysts with a one-dimensional heterojunction for improved photocatalytic activities, Nano Res., 2015, 8, 2092–2101 CrossRef CAS.
- X. Zhou and H. Dong, A theoretical perspective on charge separation and transfer in metal oxide photocatalysts for water splitting, ChemCatChem, 2019, 11, 3688–3715 CrossRef CAS.
- R. I. Bickley, T. Gonzalez-Carreno, J. S. Lees, L. Palmisano and R. J. D. Tilley, A structural investigation of titanium dioxide photocatalysts, J. Solid State Chem., 1991, 92, 178–190 CrossRef CAS.
- X. Wang, Q. Xu, M. Li, S. Shen, X. Wang, Y. Wang, Z. Feng, J. Shi, H. Han and C. Li, Photocatalytic overall water splitting promoted by an alpha-beta phase junction on Ga2O3, Angew. Chem., Int. Ed. Engl., 2012, 51, 13089–13092 CrossRef CAS PubMed.
- P. Li, H. Xu, L. Liu, T. Kako, N. Umezawa, H. Abe and J. Ye, Constructing cubic–orthorhombic surface-phase junctions of NaNbO3 towards significant enhancement of CO2 photoreduction, J. Mater. Chem. A, 2014, 2, 5606–5609 RSC.
- Y. Wang, L. Zhang, X. Zhang, Z. Zhang, Y. Tong, F. Li, J. C. S. Wu and X. Wang, Openmouthed β-SiC hollow-sphere with highly photocatalytic activity for reduction of CO2 with H2O, Appl. Catal., B, 2017, 206, 158–167 CrossRef CAS.
- Y.-s. Wang, X.-z. Wang and Y.-d. Wang, Effects of the Ar flow rate on the composition, structure, and properties of near-stoichiometric SiC fibres that were annealed at 1600 °C, Ceram. Int., 2022, 48, 24571–24581 CrossRef CAS.
- F. Li, W. Cui, J. Zhang, S. Du, Z. Chen, S. Zhang, K. Chen and G. Liu, Synthesis, characterization and growth mechanism of SiC fibers, Mater. Chem. Phys., 2022, 291, 126703 CrossRef CAS.
- K. M. Koczkur, S. Mourdikoudis, L. Polavarapu and S. E. Skrabalak, Polyvinylpyrrolidone (PVP) in nanoparticle synthesis, Dalton Trans., 2015, 44, 17883–17905 RSC.
- J. Shang, Z. Xiao, L. Yu, P. Aprea and S. Hao, An insight on the role of PVP in the synthesis of monoclinic WO3 with efficiently photocatalytic activity, Nanotechnology, 2020, 31, 125603 CrossRef CAS PubMed.
- Y. Chen, Y. Chen, P. Hu, S. Ma and Y. Li, The effects of PVP surfactant in the direct and indirect hydrothermal synthesis processes of ceria nanostructures, Ceram. Int., 2016, 42, 18516–18520 CrossRef CAS.
- M. Wieligor, Y. Wang and T. W. Zerda, Raman spectra of silicon carbide small particles and nanowires, J. Phys.: Condens. Matter, 2005, 17, 2387–2395 CrossRef CAS.
- S. Nakashima and H. Harima, Raman Investigation of SiC polytypes, Phys. Status Solidi A, 1997, 162, 39–64 CrossRef CAS.
- Q.-B. Ma, J. Ziegler, B. Kaiser, D. Fertig, W. Calvet, E. Murugasen and W. Jaegermann, Solar water splitting with p-SiC film on p-Si: Photoelectrochemical behavior and XPS characterization, Int. J. Hydrogen Energy, 2014, 39, 1623–1629 CrossRef CAS.
- H. Li and J. Sun, Highly selective photocatalytic CO2 reduction to CH4 by ball-milled cubic silicon carbide nanoparticles under visible-light irradiation, ACS Appl. Mater. Interfaces, 2021, 13, 5073–5078 CrossRef CAS PubMed.
- X. Guo, X. Tong, Y. Wang, C. Chen, G. Jin and X.-Y. Guo, High photoelectrocatalytic performance of a MoS2–SiC hybrid structure for hydrogen evolution reaction, J. Mater. Chem. A, 2013, 1, 4657–4661 RSC.
- A. Majid, S. A. Fatima, S. Ud-Din Khan and Z. A. Almutairi, Assessment of 2H–SiC based intercalation compound for use as anode in lithium ion batteries, Ceram. Int., 2020, 46, 5297–5305 CrossRef CAS.
- S. Wu, X. Tan, J. Lei, H. Chen, L. Wang and J. Zhang, Ga-doped and Pt-loaded porous TiO2–SiO2 for photocatalytic nonoxidative coupling of methane, J. Am. Chem. Soc., 2019, 141, 6592–6600 CrossRef CAS PubMed.
Footnotes |
| † Electronic supplementary information (ESI) available. See DOI: https://doi.org/10.1039/d2va00253a |
| ‡ These authors contributed equally to this work. |
| This journal is © The Royal Society of Chemistry 2023 |

