DOI:
10.1039/D3MA00062A
(Paper)
Mater. Adv., 2023,
4, 2502-2511
Determination of Pb2+ and Cd2+ ions in raw milk, honey and groundnut shell using TSAB/MWCNT†
Received
3rd February 2023
, Accepted 4th May 2023
First published on 26th May 2023
Abstract
Herein, we present the fabrication of an N′,N′′,N′′′,N′′′′-tetra(salicylidene)-amino benzene-modified multi-walled carbon nanotube electrode (TSAB/MWCNT) for the voltammetric determination of Pb2+ and Cd2+. FT-IR and H1-NMR spectroscopic techniques were applied to characterize the TSAB ligand, which was synthesized according to the procedure described in the Experimental section. The surface morphology of the TSAB/MWCNT and MWCNT electrodes was characterized by SEM with EDAX techniques. Electrochemical studies were carried out using EIS and SWASV techniques. The modified TSAB/MWCNT and MWCNT electrodes were compared, and it was observed that the former exhibited significantly enhanced redox peak currents, which implies the increased the conductivity and surface area of the TSAB-coated MWCNT electrode. Under the optimized conditions, square wave anodic stripping voltammetry confirmed the linear range of 1–16 ppb and LOD of 0.13 ppb and 0.4 ppb for Pb2+ and Cd2+, respectively. The SWASV sensing of Pb2+ and Cd2+ in spiked raw milk, honey and groundnut shells were analyzed. The results revealed the recovery of 98% to 103% for Pb2+ and 96% to 103% for Cd2+. Also, the SWASV sample values were consistent with the results from the AAS method.
1. Introduction
Despite the impact of heavy metals such as lead (Pb2+), cadmium (Cd2+) and zinc (Zn2+) in daily life, they are present as environmental pollutants in ground water, industrial discharge, and rice even at a low dose. For instance, the accumulation of Pb2+ in the human body can affect neurobehavioral development in children, cause a series of diseases such as muscle paralysis, and contribute to an increase in blood pressure, anemia and kidney injury.1 Cd2+ also affect the lungs and nervous system.2 Consequently, the development of convenient, sensitive, selective and reliable methods for the determination of Pb2+ and Cd2+ is necessary to monitor the environment and protect human health. Currently, several analytical methods are employed to rdetemine Pb2+ and Cd2+ including atomic adsorption spectroscopy (AAS),3–5 inductively coupled plasma-mass spectroscopy (ICP-MS),6 and inductively coupled plasma-atomic emission spectroscopy (ICP-AES).7 The above-mentioned methods have the capability to detect heavy metal ions even in a low detection range, but their application is limited due to their high cost.8 Alternatively, the electro-analytical technique has been widely applied owing to its low cost and exposure range either in part per billion (ppb) or trillion (ppt) in a few cases.9–11 Presently, most researchers focus on detecting heavy metal ions by anodic stripping voltammetry because it is a rapid and insightful electro-analytical method, which is also used to analyze an effective pre-concentration and consequent measurements step.12–14 Nevertheless, graphite electrodes usually show limited sensitivity due to their low precise surface area, inadequate electro active centers, and low adsorption capability for ions.15 Therefore, to improve the adsorption behavior, a modified working electrode is employed to increase the conductivity, stability, sensitivity and specific surface area.16 For decades, mercury electrodes have been widely used as working electrodes in anodic stripping voltammetry (ASV) owing to their broad cathodic ranges, but they also form amalgams with some heavy metals.17 Therefore, recently, various modified electrodes have been used to detect harmful metals such as Cd2+, Pb2+, Hg2+, Zn2+, and Cu2+ present in different sources in the environment by measuring the ASV current based on conductive polymers such as poly(1,5-diaminonaphthalene)/multi-walled carbon nanotubes,18 BiNP/MWCNT/Nafion/GCE,19 poly(1,5-diaminonaphthalene)/graphene,20 graphene/polyaniline/polystyrene,21 and poly(1,2-diaminoanthraquinone) (PDAAQ).22 Among them, most researchers focus on multi-walled carbon nanotubes (MWCNTs) owing to their good stability and wide range potential.23–25 Also, Schiff base materials are highly reactive towards metals, exhibiting outstanding chelating behaviors, which are prepared via the chemical reaction between aldehyde and amine compounds. In some cases, these materials possess fluorescence properties with biological activity.26 The in situ condensation of 3,3′-diaminobenzidine and salicylaldehyde produces the N,N′,N′′,N′′′-tetrasalicylideneaminobenzene (TSAB) ligand, which is a symmetrical and chiral molecule.
Herein, we synthesized TSAB and prepared modified TSAB/MWCNT electrodes, which were characterized and their electrochemical behavior for the sensing of Pb2+ and Cd2+ was investigated. To the best of our knowledge, there are no reports in the literature on the use of TSAB/MWCNT electrodes for the determination of Pb2+ and Cd2+ to date. The TSAB ligand was characterized via Fourier transform infrared (FTIR) and proton nuclear magnetic resonance (H1-NMR) spectroscopy. The TSAB/MWCNT and MWCNT modified electrodes were characterized by electrochemical impedance spectroscopy (EIS) and cyclic voltammetry (CV). Ultimately, the electrochemical implementation of the sensor was performed by square wave anodic stripping voltammetry (SWASV) using TSAB/MWCNT in acetate buffer solution (pH 5.5) for the analysis of Pb2+ and Cd2+ in raw milk, honey and groundnut shell samples. The SWASV of the samples results were validated using atomic absorption spectroscopy (AAS).
2. Materials and methods
Herein, the following experimental methods were employed.
2.1. Chemicals and apparatus
MWCNT (98% purity) and graphite rods (diam 3 mm) were purchased from Sigma Aldrich. 2-Amino benzyl alcohol (assay >97.5%), lead(II) acetate trihydrate (pure 99%), cadmium acetate dihydrate (extra pure AR, 99%), acetic acid (min. 99.9%), and sodium acetate anhydrous (extra pure AR 99%) were procured from SRL PVT. Ltd, India. All the listed chemicals were Analar Grade. Doubly distilled water was used for all experiments.
SWASV measurement was carried out using a CHI 660B Analyzer (CH Instruments, USA model). The TSAB/MWCNT modified working electrode was used in the conventional three-electrode system. Scanning electron microscopy (SEM) and energy dispersive X-ray spectroscopy (EDX) were performed using a HITACHI S3400N (JOEL JSM 6360, potential range of 0.3 to 30 kV) instrument. The H1-NMR and FT-IR study was carried out using a BRUKER and 650 FT-IR spectrometer (Agilent Technologies), respectively.
2.2. Procedures
2.2.1. Synthesis of N′,N′′,N′′′,N′′′′-tetra(salicylidene)amino benzene (TSAB).
TSAB was prepared using the reported procedure27 with slight modification. Sodium methoxide was added to a stirring suspension of 1,2,4,5-tetraaminobenzene tetrahydrochloride (0.93 g, 3.3 mmol) in 50 mL dry methanol under nitrogen gas until the reaction was complete, resulting in a yellow solution. Subsequently, salicylaldehyde (1.61 g, 13.2 mmol) was added dropwise to the warm solution. The solution was refluxed overnight, the orange solid obtained was filtered and washed several times with methanol and ether, and air dried.
2.2.2. Modification of TSAB/MWCNT electrode.
A graphite surface electrode was used in an earlier report.28 MWCNT was overlaid on the graphite surface electrode. The synthesized TSAB (0.1 mM) was dissolved in an acetonitrile solution. Then, an optimized volume of 10 μL of TSAB was added to the MWCNT electrode surface at 25 °C.
2.2.3. Preparation of supporting medium.
Acetate buffer solution (ABS) was prepared by adding a suitable quantity of equimolar (0.1 M) acetic acid and sodium acetate solution in double distilled water. The mandatory pH of the ABS was modifying by adding 0.1 M NaOH and HCl solution.
2.2.4. Standard solutions prepared.
1 mM of Pb2+ and Cd2+ as stock solutions were prepared individually by dissolving them in pH 5.5 ABS. 10 mM solutions of Pb2+ and Cd2+ in pH 5.5 ABS were made as the stock solution by sequential dilution. Then 0.05 μL of Pb2+ and Cd2+ were spiked in a known amount of ABS solution.
2.2.5. Preparation of real groundnut shell, honey and raw milk samples.
Raw milk and honey samples were collected from a vegetable market in Avadi (India). Groundnut shells (sample-C) were obtained from a local market in Poonamallee (India). Firstly, the groundnut shells (sample-C) were considerably cleaned with DD water, and subsequently dried at 60 °C in an oven, and then made into powder samples. To each sample, i.e., Sample-A (honey), Sample-B (raw milk) and Sample-C (powdered groundnut shells), 0.1 mM of Pb2+ and Cd2+ were added using the prepared stock solutions for further experiment. Consequently, these samples were used for the analysis of Pb2+ and Cd2+ by SWASV and the resultant values were compared with AAS.
2.3. Stripping voltammetric measurement of toxic metal ions
A conventional three-electrode system was used for the voltammetric measurements, with the TSAB/MWCNT-modified electrode, platinum wire and saturated (1.0 M KCl) calomel electrode employed as the working electrode, counter electrode and reference electrode, respectively. The synthesized TSAB was characterized by FT-IR and H1-NMR spectroscopy. The conductivity and surface area of the TSAB/MWCNT and MWCNT electrodes were measured by EIS and CV. The Pb2+ and Cd2+ present in the raw milk, honey and groundnut shell solutions were detected by SWASV using the TSAB/MWCNT-modified electrode and determine at the ppb level.
3. Results and discussion
3.1. Characterization of synthesized TSAB
The FT-IR stretching frequencies of the synthesized TSAB are shown in Fig. S1 (ESI†). The absorption band observed at 1620 cm−1 is attributed to the presence of the imine group. A broad range absorption peak was observed between 3385 cm−1 to 3441 cm−1 due to the stretching vibration mode of the –OH group present in water molecules. The stretching frequencies in the range of 1431 cm−1 to 1475 cm−1 and 743 cm−1 to 820 cm−1 are due to presence of an aromatic group. The C–OH stretching mode observed at 1276 cm−1 shifted to a lower frequency as a result of the hydroxyl oxygen atoms in the coordination sites. The H1-NMR spectrum of TSAB is presented in Fig. S2 (ESI†). The chemical shift migrated towards the positive side due to the presence of aromatic protons in the range of δ 10.095 to δ 11.801. The OH proton was located at δ 6.553–6.974 ppm. The H1-NMR spectra confirmed the formation of TSAB, which were analyzed based on the earlier reports.29
3.2. Investigation of TSAB/MWCNT-modified working electrode
3.2.1. Analysis of SEM with EDAX.
The surface morphology of PIGE, MWCNT, TSAB/MWCNT and (M2+-TSAB)/MWCNT was identified by SEM and EDAX analysis, as shown in Fig. 1 and Table 1. The SEM image of PIGE shows smooth and regular carbon microspheres (Fig. 1A). EDAX indicated the presence of the C element (Fig. 1E). As shown in Fig. 1B, the SEM image of MWCNT shows a cage-like structure and EDAX indicated that the intensity of C increased, as shown in Fig. 1F. TSAB/MWCNT exhibited a needle crystalline-shaped structure on the PIGE electrode surface, as shown in Fig. 1C. Also, in the EDAX spectrum, intense peaks for C and O were observed, as shown in Fig. 1G. (M2+-TSAB)/MWCNT revealed a cloud-shaped structure due to the adsorption of Pb2+ and Cd2+ on the electrode surface Fig. 1D and the EDAX in Fig. 1H show the intense peaks of Pb2+, Cd2+, O and C elements.
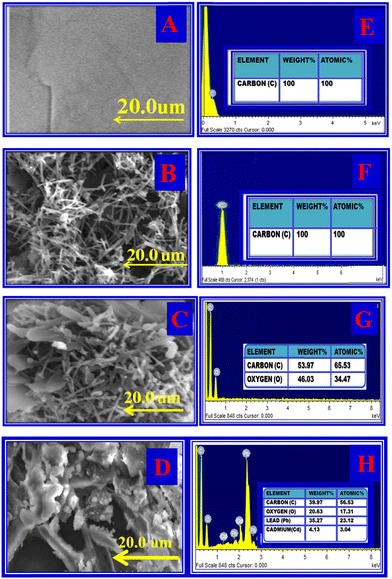 |
| | Fig. 1 Surface morphology. SEM image of PIGE (A), MWCNT (B), TSAB/MWCNT (C), and [Pb2+ and Cd2+-TSAB]/MWCNT (D). EDAX image of PIGE (E), MWCNT (F), TSAB/MWCNT (G) and [Pb2+ and Cd2+-TSAB]/MWCNT (H). | |
Table 1 SEM and EDX characterization of PIG electrode, MWCNT, TSAB/MWCNT, Cd2+ and Pb2+-TSAB/MWCNT
| Characterization |
PIG electrode |
MWCNT |
TSAB/MWCNT |
Cd2+ and Pb2+-TSAB/MWCNT |
| SEM |
(A) Smooth and regular carbon microspheres |
(B) Cage-shape structure |
(C) Needle crystalline-shaped structure |
(D) Cloud-shaped structure |
|
|
| EDAX |
(E) Carbon peak |
(F) Increased carbon peak |
(G) Carbon and oxygen peaks |
(H) Carbon, oxygen, cadmium and lead peaks |
3.2.2. Electrochemical sensing behavior of PIGE, MWCNT and TSAB/MWCNT.
The electrochemical behavior of the modified electrode surface was examined using cyclic voltammetry employing [Fe(CN)6]−3/4− as the redox probe. Fig. 2A shows the CV of the bare PIGE, modified MWCNT and TSAB/MWCNT electrodes in the presence of 1 mM [Fe(CN)6]−3/4− containing 0.1 mol L−1 ABS (pH 5.0) in the potential range of −0.30 V to 90 V at 50 mV s−1. The bare PIGE and MWCNT-modified electrodes showed higher peak to peak potential separation values (ΔEp = 228 mV and 175 mV, respectively) compared with the TSAB/MWCNT-modified electrode (ΔEp = 134 mV) (Table 2), where an increase in peak potential separation corresponds to lower electrical conductivity.
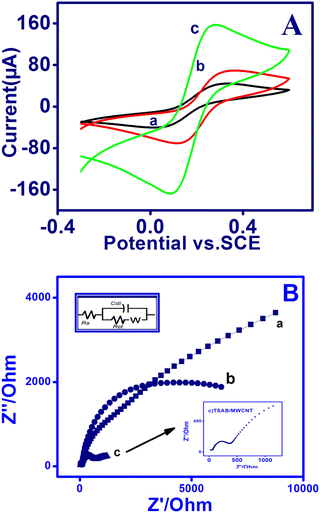 |
| | Fig. 2 (A) Cyclic voltammetry and (B) electrochemical impedance spectra on PIGE (curve a), MWCNT (curve b) and TSAB/MWCNT (curve c) in 1 mM [Fe(CN)6]−3/4− containing 0.1 mol L−1 ABS (pH-5.0) at 50 mV s−1. Inset: Enlarged image of (B) depicting the EIS of TSAB/MWCNT-modified electrode. | |
Table 2 Electrochemical parameters of PIG electrode, MWCNT, and TSAB/MWCNT using CV and EIS
| Characterization |
Term |
PIG electrode (a) |
MWCNT (b) |
TSAB/MWCNT (c) |
| CV |
I
P
|
0.012 cm2 |
0.060 cm2 |
0.123 cm2 |
| Ipa (μA) |
66 μA |
100 μA |
168 μA |
| ΔEP |
228 mV |
175 mV |
138 mV |
|
|
| EIS |
R
s
|
52.36 Ω |
38.16 Ω |
23.4 Ω |
|
R
ct
|
7490 Ω |
917.2 Ω |
194.83 Ω |
|
θ
|
0 |
0.87 |
0.97 |
Moreover, modifying bare PIGE with MWCNT increased the peak current (Ipa) from 66 μA to 100 μA. Furthermore, a sharp and very intense peak was observed at 168 μA for TSAB/MWCNT. The observed lower peak potential ΔEp and enormous improvement in the Ipa values (peak current) of TSAB/MWCNT may be due to the combination of TSAB/MWCNT, which increased the surface area and electron transfer between [Fe(CN)6]−3/4− and TSAB/MWCNT, indicating that it is electrochemically more active.
In 0.1 M ABS solution, the CV peak current was observed to increase linearly in 1 mM [Fe (CN)6]−3/4− for TSAB/MWCNT with the square root of the scan rate (v1/2) owing to the fact that the electron migration reaction at this modified (TSAB/MWCNT) electrode is a diffusion-controlled method. The active surface area of each electrode in an irreversible process can be examined based on the Randles–Sevcik equation [31]: Ip = 2.69 × 10⁵n3/2A D1/2vC, where n is the number of electrons (n = 2), A is the active electrode surface, D is the diffusion coefficient (7.6 × 10⁻⁶ cm2 S−1), C is the concentration of [Fe (CN)6]−3/4− (1 mM) and ν is the scan rate (V/S). According to the slope (ip-v1/2), the value of A was measured to be 0.927 cm2, 0.338 cm2 and 0.048 cm2 for TSAB/MWCNT, MWCNT and PIGE, respectively (Table 2). The obtained results show that the electroactive surface of TSAB/MWCNT increased drastically, which was ∼19 times higher than that of the untreated PIGE.
3.2.3. Electrochemical impedance spectroscopy of modified electrode.
EIS was performed and the changes in the electron transfer resistance (Ret) owing on the surface of the fabricated electrode were recorded. The Nyquist plots of the PIGE, MWCNT and TSAB/MWCNT electrodes were measured in 0.1 M ABS solution containing 1 mM of [Fe(CN)6]−3/−4, where the interfacial electron transfer resistance at the electrode surface is equal to the diameter of the semicircle, which were obtained by EIS.30 The semicircle, which indicates the restrained electron transfer kinetics of the redox probe at the electrode surface,31 showed the recorded data obtained in the frequency range of 0.1 Hz to 1.0 MHz using the AC signal amplitude of 5 mV. The impedance figure was fitted using the Randles electrical equivalent circuit, as shown in Fig. 2B, where Rs, Rct, Cdl and Zw are the resistance in solution, charge transfer resistance, double-layer capacitance and Warburg impedance, respectively. The Cole–Cole plots (Nyquist plot) of PIGE, MWCNT and TSAB/MWCNT were obtained in the presence of 0.1 M ABS containing 1 mM [Fe(CN)6]−3/−4, as shown in Fig. 2B and Table 2. The Nyquist plot of ferri/ferrocyanide, which undergo redox reactions, shows the significant changes in responses for all three electrodes. A large semicircle diameter (Ret = 4.1 kΩ) with almost a straight line was observed for PIGE, which indicates the high electron resistance of the bare electrode to the redox, whereas for MWCNT and TSAB/MWCNT Ret was calculated to be 2.4 kΩ and 1.07 kΩ, respectively. The result obtained indicates that the bare PIGE, showed huge Ret values compared to MWCNT and TSAB/MWCNT. Interestingly, the Ret for the modified electrode decreased to about 2.9 kΩ compared to that of the bare PIG, indicating that the TSAB/MWCNT nanocomposite enhanced the electron migration. The reduction in the interfacial electron transfer resistance is owing to the good conductivity of the nanocomposite. The results showed that the observed current signal for electro-oxidation increased in the corresponding stripping voltammetric investigations.
3.3. Electrochemical sensing performance for Pb2+ and Cd2+ ions on MWCNT and TSAB/MWCNT
The electrochemical sensing behavior of Pb2+ and Cd2+ was detected using stripping voltammetry on the surface of the unmodified (MWCNT without ligand) and modified TSAB/MWCNT electrodes. To detect the sensitivity and selectivity of the unmodified and modified electrodes towards the electrochemical activities of both analytes, the stripping voltammogram of an 8 ppb mixture of Pb2+ and Cd2+ in pH 5.5 ABS (Fig. 3) was observed. Curve b shows the anodic peak current responses using the TSAB/MWCNT electrode in the potential range of −1.2 V to −0.2 V vs. KCl for both metals, which were distinct and very intense peaks, confirming that the TSAB ligand coated on MWCNT was responsible for the superior electroanalytical detection performances. In contrast, for both metal analytes, weak peaks were observed at the unmodified MWCNT electrode (curve A). The significant peak for the TSAB ligand, which possesses OH and CH![[double bond, length as m-dash]](https://www.rsc.org/images/entities/char_e001.gif) N groups, is due to its tendency to bind the metal ions present in the electrolyte. Thus, the high-intensity peak observed is due to the presence of –OH and –CH
N groups, is due to its tendency to bind the metal ions present in the electrolyte. Thus, the high-intensity peak observed is due to the presence of –OH and –CH![[double bond, length as m-dash]](https://www.rsc.org/images/entities/char_e001.gif) N– groups in TSAB. The active sites present in the TSAB ligand have sensing performances for the metal (Pb2+ and Cd2+) present in the electrolyte, even at a very low concentration (ppb). The TSAB/MWCNT electrode was further investigated, as illustrated in Scheme 1.
N– groups in TSAB. The active sites present in the TSAB ligand have sensing performances for the metal (Pb2+ and Cd2+) present in the electrolyte, even at a very low concentration (ppb). The TSAB/MWCNT electrode was further investigated, as illustrated in Scheme 1.
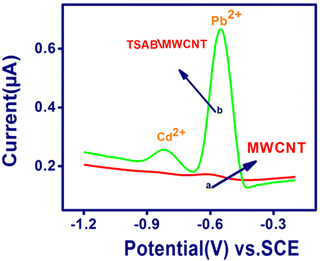 |
| | Fig. 3 SWASV performed on MWCNT (A) and TSAB/MWCNT (B) with Pb2+ and Cd2+ (8 ppb) accumulated on electrode surface in 0.1 M acetate buffer solution (pH 5.5). | |
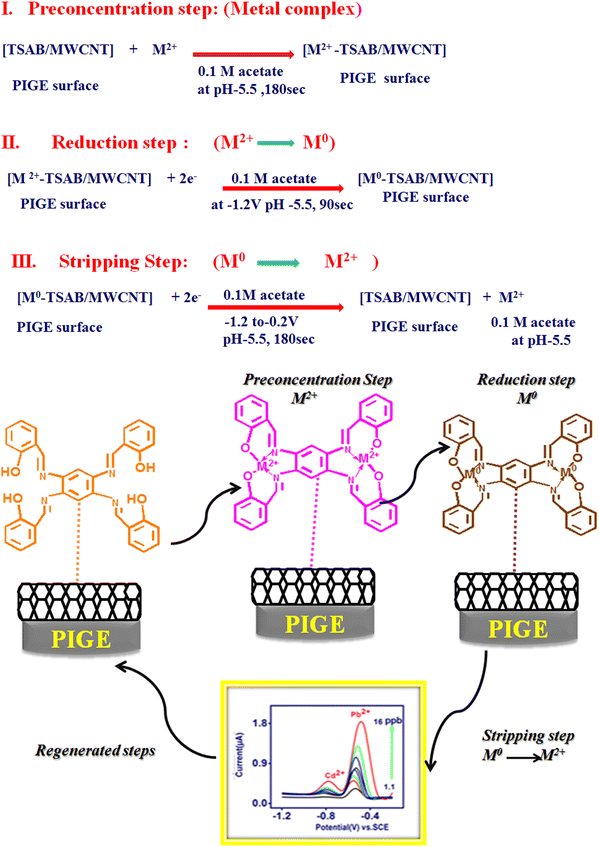 |
| | Scheme 1 Mechanism of [Pb2+ and Cd2+-TSAB]/MWCNT electrode. | |
3.4. Utilization of the new sensor
To apply the established sensor, the important parameters in the electrochemical detection of Pb2+ and Cd2+, such as supporting medium, pH and preconcentration time were scrutinized for the SWASV analysis of Pb2+ and Cd2+ (Fig. 4). The TSAB/MWCNT sensor for 8 ppb of Pb2+ and Cd2+, as shown in Fig. 4A, exhibited different stripping current peak intensities for various electrolytes including NH4NO3, KNO3, NaNO3 and acetate buffer at 0.1 M concentration. The most intense peak was observed for acetate buffer (0.78 μA for Pb2+ and 0.26 μA Cd2+), while the least intense peak was observed for NH4NO3 (0.2 μA for Pb2+ and 0.18 μA Cd2+). Therefore, the most suitable electrolyte is acetate buffer among the electrolytes, which was employed in subsequent experiments. The effect of pH using TSAB/MWCNT in 0.1 M acetate medium on the oxidation current for Pb2+ and Cd2+ was detected by SWASV (Fig. 4B). The acetate buffer pH was constantly maintained in the range of 3.5 to 6.5. The maximum oxidation peak was observed for Pb2+ and Cd2+ at 5.5 pH, i.e., when the pH increased from 3.5 to 5.5, the oxidation current density was the maximum, increasing the protonation on the TSAB/MWCNT electrode surface. Further, with an increase in pH, the oxidation current peak density decreased gradually, which may be due to the increase in deprotonation on the TSAB/MWCNT-modified electrode surface. The decrease in the oxidation peak current density observed in the hydrolysis mechanism of Pb2+ and Cd2+ will resist their accumulation on the TSAB/MWCNT-modified electrode surface at higher pH (5.5–6.5). Therefore, a suitable oxidation current response for detecting the Pb2+ and Cd2+ ions was achieved in a supporting electrolyte of pH 5.5, which was used in subsequent experiments. The accumulation time was varied from 60 s to 360 s for the detection of Pb2+ and Cd2+ in 0.1 M acetate buffer at pH 5.5 (Fig. 4C). An increase in the accumulation time from 60 s to 240 s increased the oxidation peak current owing to the greater accumulation of Pb2+ and Cd2+ with a longer accumulation time. Subsequently, with a further increase in the accumulation time to 300 and 360 s, no improvement was observed, which is due to the saturation of the TSAB/MWCNT electrode surface area. Therefore, the maximum accumulation time for the detection of Pb2+ and Cd2+ using the TSAB/MWCNT-modified electrode is 240 s.
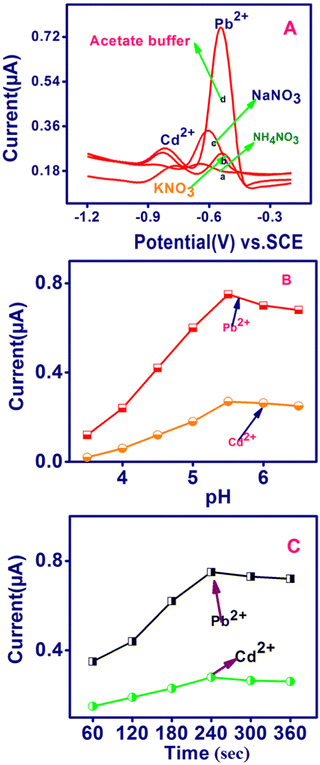 |
| | Fig. 4 Effect of (A) supporting electrolyte, (B) pH and (C) preconcentration time on the anodic stripping peak currents of Pb2+ and Cd2+ (8 ppb each) to evaluate TSAB/MWCNT sensor performance in 0.1 M ABS (pH 5.5). | |
3.5. Analytical behavior of TSAB/MWCNT
In this assessment, the quantitative estimation of the concentrations of the target metal was accomplished using SWASV and analytical curves for the newly modified sensors. The simultaneous detection of Pb2+ and Cd2+ was performed using SWASV (Fig. 5A), and the calibration data are shown in Fig. 5B and C. It was observed that under the optimum conditions, well-defined stripping current peaks and potential range were achieved for Pb2+ at −0.65 V and Cd2+ at −0.8 V. The stripping current peaks were proportional to the Pb2+ and Cd2+ concentration from 1 to 16 ppb and the linear equations are as follows:
| Pb2+ Ip (μA) = 0.926 C (ppb) + 0.9; R2 = 0.991; |
| Cd2+ Ip (μA) = 0.415 C (ppb) + 0.366; R2 = 0.991; |
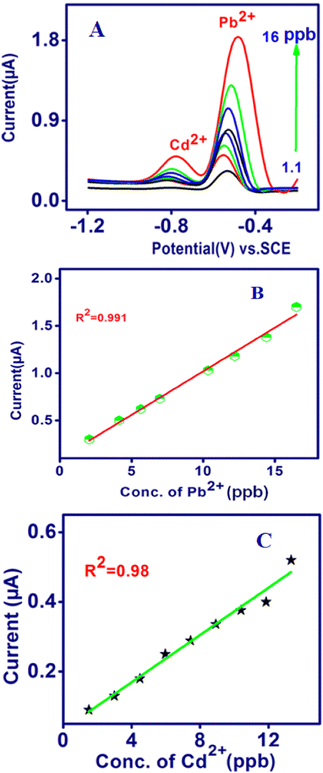 |
| | Fig. 5 Simultaneous determination of Pb2+ and Cd2+ by TSAB/MWCNT using (A) SWASV. Corresponding calibration plots for Pb2+ (B) and Cd2+ (C) calculated using SWASV. | |
The sensitivities were 0.926 μA per ppb for Pb2+ and 0.415 μA per ppb for Cd2+, demonstrating that the simultaneous detection of Pb2+ and Cd2+ on TSAB/MWCNT is feasible. Furthermore, the lowest detection limit (S/N = 3) was calculated to be 0.13 ppb and 0.4 ppb for Pb2+ and Cd2+, respectively, which is significantly lower than the recommended value for drinking water according to the WHO, i.e., 3 and 10 ppb, respectively.34 Subsequently, the evaluation of TSAB/MWCNT was compared with earlier reports on modified electrodes for the analysis of Pb2+ and Cd2+, and data are presented in Table 3. It was found that the fabricated modified electrode exhibited similar or even better analytical performances for the analysis of Pb2+ and Cd2+. However, our mercury-free electrodes are simple to prepare and environmentally friendly easily, which can be used for the construction of heavy metal ion electrochemical sensors.
Table 3 Comparison of TSAB/MWCNT for the detection of Pb2+ and Cd2+ with already reported works
| Modified electrode |
Linear range (ppb) |
LOD (ppb) |
Ref. |
| Cd2+ |
Pb2+ |
Cd2+ |
Pb2+ |
| IONP-COOH/APTES-ITO |
10–100 |
10–100 |
0.9 |
0.6 |
32
|
| Fe3O4/F-MWCNT/GCE |
56.2–3372 |
103.6–6216 |
5.62 |
16.58 |
33
|
| BFO/CPEs |
200–20![[thin space (1/6-em)]](https://www.rsc.org/images/entities/char_2009.gif) 000 000 |
200–20![[thin space (1/6-em)]](https://www.rsc.org/images/entities/char_2009.gif) 000 000 |
50 |
30 |
34
|
| Fe3O4@G2-PAD/MCPE |
0.5–80 |
0.5–80 |
0.21 |
0.17 |
35
|
| SWCNHs |
1–60 |
1–60 |
0.2 |
0.4 |
36
|
| NSRG/GCE |
5–3000 |
5–3000 |
6.5 |
1.3 |
37
|
| nZVI-BPC/GCE |
2.0–50 |
2.0–50 |
0.19 |
0.2 |
38
|
| MWCNT/Bi/PGE |
1–80 |
5–80 |
0.43 |
0.27 |
39
|
| (DTZ)@TiO2/poly(TBA)-(AA) |
10–1000 |
10–1000 |
10 |
20 |
40
|
| polyPCA/GE |
40–1000 |
40–1000 |
15.4 |
13.6 |
41
|
| TSAB/MWCNT |
1.1–16
|
1–16
|
0.18
|
0.13
|
This work
|
3.6. Interference studies of metal ions
The selectivity of TSAB/MWCNT for the detection of Pb2+ and Cd2+ was examined by the addition 10 ppb interfering metal such as Hg2+, Ni2+, Cu2+, Sn2+ and Zn2+ to 0.1 M pH 5.0 acetate buffer containing 12 ppb of Pb2+ and Cd2+, as shown in Fig. 6. The stripping peak currents of Pb2+ and Cd2+ in the presence (Ii) and absence (I0) of interfering Hg2+, Ni2+, Cu2+, Zn2+ and Sn2+ and relative signal changes were employed to calculate the RSD using eqn (1), as follows:| |  | (1) |
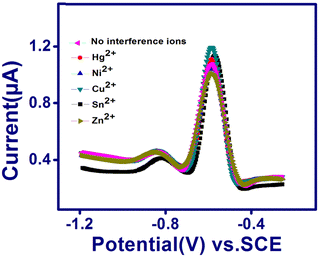 |
| | Fig. 6 SWASV curves of TSAB/MWCNT in pH 5.5 ABS containing 12 ppb Pb2+ and Cd2+ in the presence of 10 ppb Hg2+, Ni2+, Cu2+, Sn2+ and Zn2+. | |
The calculated RSD values are shown in Table 4, where the peak currents of Pb2+ in the presence of Hg2+, Ni2+, Sn2+ and Zn2+ interfering metals exhibited a slight decrease in RSD values by 2.8%, 4.6%, 5.3% and 8.7%, respectively. In the case of Cd2+, the Hg2+, Ni2+, Cu2+, Sn2+ and Zn2+ interfering metals resulted in a decrease of 8.0%, 1.2%, 2.0%, 1.7% and 1.5%, respectively. This can be attributed to the competition of the different metals with the Pb2+ and Cd2+ analytes and the interfering Hg2+, Ni2+, Cu2+, Sn2+ and Zn2+ for the active sites present on the TSAB/MWCNT electrode surface.34
Table 4 Investigated results for Pb2+ and Cd2+ in the presence of different interfering ions, including Hg2+, Ni2+, Cu2+, Sn2+ and Zn2+, in 0.1 M of ABS solutions spiked with 12 ppb Pb2+ and Cd2+
| Interference ions |
Pb2+ |
Cd2+ |
| Peak current (μA) |
Relative signal changes (%) |
Peak current (μA) |
Relative signal changes (%) |
| No interference ions |
1.15 |
— |
0.42 |
— |
| Hg2+ |
1.10 |
−8.7 |
0.417 |
−8.0 |
| Ni2+ |
1.05 |
−4.7 |
0.415 |
−1.2 |
| Cu2+ |
1.20 |
4.3 |
0.412 |
−2.0 |
| Sn2+ |
1.09 |
−5.3 |
0.413 |
−1.7 |
| Zn2+ |
1.07 |
−2.8 |
0.414 |
−1.5 |
3.7. Reproducibility and stability of the TSAB/MWCNT electrode
The reproducibility and stability of the developed TSAB/MWCNT electrode were measured using six modified TSAB/MWCNT electrodes in 0.1 M acetate buffer consisting of 12 ppb of Pb2+ and Cd2+ (Fig. 7). The six modified electrodes were employed for the analysis of Pb2+ and Cd2+ using SWASV, as shown in Fig. 7B. The acquired relative standard deviations (RSDs) of the six electrodes were 2.1% and 3.62% for Pb2+ and Cd2+ detection, respectively, indicating the excellent reproducibility of the developed electrochemical sensor. The long-term stability of the TSAB/MWCNT electrode was monitored using its anodic current responses for metal ions on a newly prepared TSAB/MWCNT electrode and other electrode was kept at room temperature over a period of one month. As shown in Fig. 7A, the RSDs of the anodic peaks current for the toxic metal ions were determined to be 0.05% for Pb2+ and 0.03% for Cd2+. Thus, the SWASV data substantiate the adequate stability and reproducibility of the fabricated MWCNT/TSAB-modified electrode for sensing Pb2+ and Cd2+.
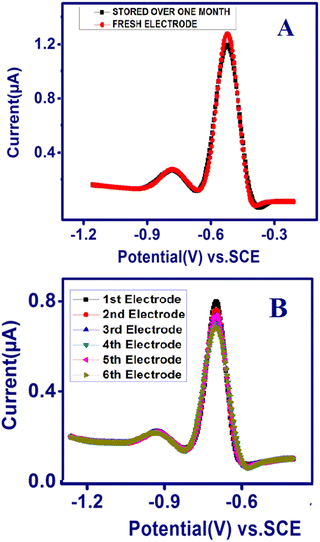 |
| | Fig. 7 Stability and reproducibility of TSAB/MWCNT. (A) Square wave anodic stripping voltammograms of 12 ppb of Pb2+ and Cd2+ using a freshly prepared electrode (red line) and one stored at room temperature over one month (black line) and (B) SWASV curves continuously recorded with six TSAB/MWCNT prepared under the same conditions in a solution containing 12 ppb of Pb2+ and Cd2+. | |
3.8. Sensing of Pb2+ and Cd2+ in raw milk, honey and groundnut shell samples
The TSAB/MWCNT sensor was applied for the detection of Pb2+ and Cd2+ in different real samples, i.e., Sample-A (honey), Sample-B (raw milk) and Sample-C (2 g of groundnut shell), using SWASV. The precision of the quantification of Pb2+ and Cd2+ was proven by AAS (atomic absorption spectroscopy). The samples were diluted three times in 0.1 M acetate buffer at pH 5.5 for the analysis of 10 ppb Pb2+ and Cd2+. The results from the analysis of the metal ions in the honey samples (Fig. 8A), raw milk (Fig. 8B), and groundnut shells (Fig. 8C) using SWASV and the recovery values of the diluted samples are exhibited in Table 2. The samples showed a good recovery value of 98% to 103% Pb2+ and 96% to 103% Cd2+, as illustrated in Table 5. Thus, the constructed TSAB/MWCNT electrode has high precision (recovery) for the detection of Pb2+ and Cd2+ in environmental samples.
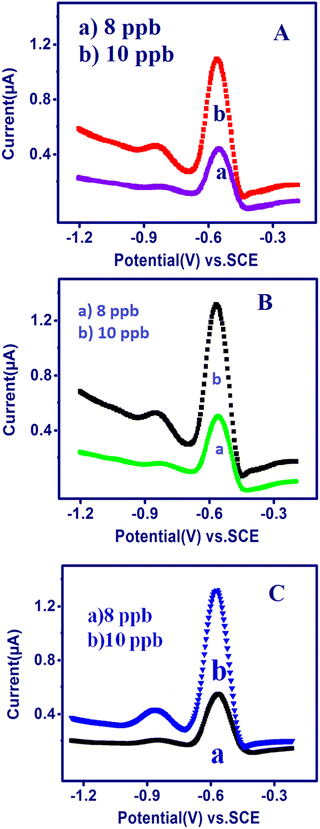 |
| | Fig. 8 SWASV of the TSAB/MWCNT in pH 5.5 ABS containing a 10 ppb mixture of Pb2+ and Cd2+ at an Eacc of −1.2 V and Tacc of 240 s in a few environmental samples: honey (A), raw milk (B) and groundnut shell (C). | |
Table 5 Comparison of the present method and AAS for the analysis of Cd2+ and Pb2+ (n = 3)
| Sample |
Metal ions |
Square wave anodic stripping voltammetry (SWASV) |
Atomic absorption spectroscopy (AAS) |
| Added ppb |
Found (ppb) |
RSD (%) |
Recovery (%) |
Found (ppb) |
Recovery (%) |
| Sample-A (honey) |
Cd2+ |
8.0 |
7.7 |
1.1 |
96.0 |
8.0 |
100.0 |
| 10 |
9.8 |
1.5 |
98.4 |
10.0 |
100.0 |
| Pb2+ |
8.0 |
7.8 |
1.4 |
98.0 |
8.0 |
100.0 |
| 10 |
10.9 |
2.0 |
99.0 |
10.0 |
100.0 |
| Sample-B (raw milk) |
Cd2+ |
8.0 |
7.6 |
1.8 |
96.0 |
8.0 |
100.0 |
| 10.0 |
9.7 |
1.9 |
97.0 |
10.1 |
101.0 |
| Pb2+ |
8.0 |
8.0 |
1.5 |
100.0 |
8.1 |
101.0 |
| 10.0 |
10.1 |
2.0 |
101.0 |
10.2 |
102.0 |
| Sample-C (ground shell nuts) |
Cd2+ |
8.0 |
8.2 |
1.7 |
102 |
9.0 |
113.0 |
| 10.0 |
10.3 |
2.3 |
103 |
11.4 |
114.0 |
| Pb2+ |
8.0 |
8.2 |
2.0 |
102 |
9.2 |
115.0 |
| 10.0 |
10.3 |
2.4 |
103 |
11.4 |
118.0 |
4. Conclusion
TSAB/MWCNT was effectively prepared and utilized as a sensor in ABS for the electrochemical analysis of Pb2+ and Cd2+. The successful synthesis of TSAB was confirmed by H1-NMR and FT-IR spectroscopy and the TSAB ligand coated on the MWCNT electrode was characterized by scanning electron microscopy, cyclic voltammetry and electrochemical impedance spectroscopy. Applying the SWASV method, the TSAB/MWCNT electrode was used for sensing Pb2+ and Cd2+ in raw milk, honey and groundnut shell samples. The suitability of the developed SWASV method using TSAB/MWCNT for the electrochemical detection of Pb2+ and Cd2+ in raw milk, honey and groundnut shell samples was verified by its recovery value of 98% to 103% of Pb2+ and 96% to 103% of Cd2+. The samples were validated using atomic absorption spectroscopy and the recovery results were in the range of 100% to 118% of Pb2+ and 100% to 113% of Cd2+. Furthermore, the TSAB/MWCNT-modified electrode was established to exhibit a low detection value, good stability and vast linear range. These results demonstrate that TSAB/MWCNT can be used for the detection and has superior potential for the analysis of Pb2+ and Cd2+ in real samples including raw milk, honey and groundnut shell samples.
Conflicts of interest
There is no conflict of interest.
Acknowledgements
The research work was supported with financial assistance through the DST-PURSE program by the Department of Science and Technology, New Delhi. One of the authors would like to acknowledge the Department of the National center for Nanosciences and Nanotechnology, the University of Madras for providing the facilities to conduct the characterization work.
References
- Z. Fang, J. Růžička and E. Hansen, Anal. Chim. Acta, 1984, 164, 23–39 CrossRef CAS.
- S. Bolisetty, M. Peydayesh and R. Mezzenga, Chem. Soc. Rev., 2019, 48, 463–487, 10.1039/C8CS00493E.
- K. Yin, Q. Wang, M. Lv and L. Chen, Chem. Eng. J., 2019, 360, 1553–1563 CrossRef CAS.
- H. Uslu, C. Buyukpinar, T. Unutkan, H. Serbest, N. San and F. Turak,S. Bakirdere, Microchem. J., 2018, 137, 155–159 CrossRef CAS.
- I. Mounteney, A. K. Burton, A. R. Farrant, M. J.Watts, S. J. Kemp and J. M. Cook, J. Geochem. Explor., 2018, 184, 1–10 CrossRef CAS.
- J. Wang, E. H. Hansen and M. Miró, Anal. Chim. Acta, 2003, 499, 139–147 CrossRef CAS.
- H. Karami, M. F. Mousavi, Y. Yamini and M. Shamsipur, Anal. Chim. Acta, 2004, 509, 89–94 CrossRef CAS.
- N. G. Beck, R. P. Franks and K. W. Bruland, Anal. Chim. Acta, 2002, 455, 11–22 CrossRef CAS.
- A. Cobelo-Garcıa and R. Prego, Anal. Chim. Acta, 2004, 524, 109–114 CrossRef.
- A. Moutcine, C. Laghlimi, Y. Ziat, M. A. Smaini, S. E. E. Qouatli, M. Hammi and A. Chtaini, Inorg. Chem. Commun., 2020, 116, 1–20 CrossRef.
- A. Moutcine, C. Laghlimi, O. Ifguis, M. A. Smaini, S. E. ElQouatli, M. Hammi and A. Chtaini, Diamond Relat. Mater., 2020, 104, 1–20 CrossRef.
- M. Baghayeri, H. Alinezhad, M. Fayazi, M. Tarahomi, R. G. Motlagh and B. Maleki, Electrochim. Acta, 2019, 312, 80–88 CrossRef CAS.
- C. B. Liu, X. Y. Chen, B. Y. Zong and S. Mao, J. Mater. Chem. A, 2019, 7, 6616–6630 RSC.
- Wei Xionga, Ping Zhanga, Shantang Liua, Yaokang Lvb and Da Zhangc, Diamond Relat. Mater., 2021, 111, 108170 CrossRef.
- J. Barton, M. B. G. García, D. H. Santos, P. F. Bolado, A. Ribotti, M. McCaul and D. Diamond, Microchim. Acta, 2016, 183, 503–517 CrossRef CAS.
- R. Y. Jiang, N. T. Liu, S. S. Gao, X. Mamat, Y. H. Su, T. Wagberg, Y. T. Li, X. Hu and G. Z. Hu, Sensors, 2018, 18, 1567–1579 CrossRef PubMed.
- L. S. Rocha, J. P. Pinheiro and H. M. Carapuça, J. Electroanal. Chem., 2007, 610, 37–45 CrossRef CAS.
- H. D. Vu, L.-H. Nguyen, T. D. Nguyen, H. B. Nguyen and D. L. Tran, Ionics, 2014, 21, 571–578 CrossRef.
- S. Palisoc, R. I. M. Vitto and M. Natividad, Sci. Rep., 2018, 9, 18491 CrossRef PubMed.
- T. D. Nguyen, T. T. H. Dang, L. H. Nguyen, D. L. Tran, B. Piro and M. C. Pham, Electroanalysis, 2016, 28, 1907–1913 CrossRef CAS.
- N. Promphet, P. Rattanarat, R. Rangkupan, O. Chailapakul and N. Rodthong, Sens. Actuators, B, 2015, 207, 526–534 CrossRef CAS.
- K. M. Hassan, S. E. Gaber, M. F. Altahan and M. A. Azzem, Electroanalysis, 2018, 30, 1155–1162 CrossRef CAS.
- Y. Tu, Y. Lin, W. Yantasee and Z. Reng, Electroanalysis, 2005, 17, 79–84 CrossRef CAS.
- J. Bankim and A. Srivastava, Electrochim. Acta, 2011, 56, 4188–4196 CrossRef.
- A. M. Golikand, M. Asgari, M. G. Maraghah and E. Lohrasbi, J. Appl. Electrochem., 2009, 39, 65–70 CrossRef CAS.
- P. Jayaseelan, E. Akila, M. Usha Rani and R. Rajavel, J. Saudi Chem. Soc., 2016, 20, 625–634 CrossRef CAS.
- S. A. Guzzi and H. S. El Alagi, Pelagia Research Library, Chem. Sin., 2013, 4, 62–66 Search PubMed.
- F. Scholz and B. Lange, Trends Anal. Chem., 1992, 11, 359–367 CrossRef CAS.
- L. Mishra, K. Bindu and S. Bhattacharya, Indian J. Chem., 2004, 43, 315–319 Search PubMed.
- M. Ibrahim, H. Ibrahim, N. B. Almandil, M. A. Sayed, A.-N. Kawde and Y. Aldaqdouq, Electroanalysis, 2020, 32, 1–11 CrossRef.
- Hossieny Ibrahim and Yassien Temerk, Talanta, 2020, 208, 120362 CrossRef CAS PubMed.
- Noorhashimah Mohamad Nor, Sarasijah Arivalakan, Nor Dyana Zakaria, Nithiyaa Nilamani, Zainovia Lockman and Khairunisak Abdul Razak, ACS Omega, 2022, 7, 3823–3833 CrossRef PubMed.
- W. Wu, M. Jia, Z. Zhang, X. Chen, Q. Zhang, W. Zhang, P. Li and L. Chen, Ecotoxicol. Environ. Saf., 2019, 175, 243–250, DOI:10.1016/j.ecoenv.2019.03.037.
- Y. Beyene, Z. Bitew and F. Fekade, Mater. Adv., 2022, 3, 5882–5892 RSC.
- B. Maleki, M. Baghayeri, M. Ghanei-Motlagh, F. Mohammadi Zonoz, A. Amiri, F. Hajizadeh, A. Hosseinifar and E. Esmaeilnezhad, Measurement, 2019, 140, 81–88 CrossRef.
- Y. Yao, H. Wu and J. Ping, Food Chem., 2018, 18, 31521 Search PubMed.
- X. Tan, Z. Li, X. Wang, M. Xu, M. Yanga and J. Zhao, New J. Chem., 2022, 46, 10618–10627 RSC.
- M. Amine Djebbi, L. Allagui, M. Slim El Ayachi, S. Boubakri, N. Jaffrezic-Renault, P. Namour and A. Ben Haj Amara, Zero-Valent, ACS Appl. Nano Mater., 2022, 5, 546–558 CrossRef.
- G. Sirin Ustabasi, I. Yilmaz, M. Ozcan and E. Cetinkaya, Electroanalysis, 2022, 34, 1237–1244 CrossRef.
- R. Sedghi, B. Heidari, H. Javadi and N. Sayyari, Environ. Nanotechnol., Monit. Manage., 2022, 18, 100670 CAS.
- T. Machado Lima, P. Izabela Soares, L. Aguiar do Nascimento, D. Leoni Franco, A. Cesar Pereira and L. Franco Ferreira, Microchem. J., 2021, 168, 106406 CrossRef.
|
| This journal is © The Royal Society of Chemistry 2023 |
Click here to see how this site uses Cookies. View our privacy policy here.  Open Access Article
 *a,
Sivakumar
Sivalingam
 *a and
Sanglimuthu
Sriman narayanan
b

![[double bond, length as m-dash]](https://www.rsc.org/images/entities/char_e001.gif) N groups, is due to its tendency to bind the metal ions present in the electrolyte. Thus, the high-intensity peak observed is due to the presence of –OH and –CH
N groups, is due to its tendency to bind the metal ions present in the electrolyte. Thus, the high-intensity peak observed is due to the presence of –OH and –CH![[double bond, length as m-dash]](https://www.rsc.org/images/entities/char_e001.gif) N– groups in TSAB. The active sites present in the TSAB ligand have sensing performances for the metal (Pb2+ and Cd2+) present in the electrolyte, even at a very low concentration (ppb). The TSAB/MWCNT electrode was further investigated, as illustrated in Scheme 1.
N– groups in TSAB. The active sites present in the TSAB ligand have sensing performances for the metal (Pb2+ and Cd2+) present in the electrolyte, even at a very low concentration (ppb). The TSAB/MWCNT electrode was further investigated, as illustrated in Scheme 1.


![[thin space (1/6-em)]](https://www.rsc.org/images/entities/char_2009.gif) 000
000![[thin space (1/6-em)]](https://www.rsc.org/images/entities/char_2009.gif) 000
000


