 Open Access Article
Creative Commons Attribution 3.0 Unported Licence
Structural properties of mixed conductor Ba1−xGd1−yLax+yCo2O6−δ
Ragnar
Strandbakke
a,
David S.
Wragg
b,
Magnus H.
Sørby
c,
Matylda N.
Guzik
 de,
Anette E.
Gunnæs
e,
Iga
Szpunar
 f,
Sebastian Lech
Wachowski
 f,
María
Balaguer
g,
Patricia A.
Carvalho
h,
Aleksandra
Mielewczyk-Gryń
 f,
Jose M.
Serra
 g and
Truls
Norby
 *a
*a
aDepartment of Chemistry, University of Oslo, SMN, Gaustadalléen 21, NO-0349 Oslo, Norway. E-mail: truls.norby@kjemi.uio.no
bDepartment of Chemistry, University of Oslo, POB 1033 Blindern, NO-0315 Oslo, Norway
cDepartment for Hydrogen Technology, Institute for Energy Technology, NO-2027 Kjeller, Norway
dDepartment of Technology Systems, University of Oslo, POB 70, NO-2027 Kjeller, Norway
eDepartment of Physics, University of Oslo, POB 1048 Blindern, NO-0316 Oslo, Norway
fFaculty of Applied Physics and Mathematics, Advanced Materials Centre, Gdańsk University of Technology, Gdańsk, Poland
gInstituto de Tecnología Química, Universitat Politècnica de València, Consejo Superior de Investigaciones Científicas, Av. Naranjos s/n, E-46022, Valencia, Spain
hMaterials Physics, SINTEF Industry, POB 124 Blindern, NO-0314 Oslo, Norway
First published on 28th November 2022
Abstract
Ba1−xGd1−yLax+yCo2O6−δ (BGLC) compositions with large compositional ranges of Ba, Gd, and La have been characterised with respect to phase compositions, structure, and thermal and chemical expansion. The results show a system with large compositional flexibility, enabling tuning of functional properties and thermal and chemical expansion. We show anisotropic chemical expansion and detailed refinements of emerging phases as La is substituted for Ba and Gd. The dominating phase is the double perovskite structure Pmmm, which is A-site ordered along the c-axes and with O vacancy ordering along the b-axis in the Ln-layer. Phases emerging when substituting La for Ba are orthorhombic Ba-deficient Pbnm and cubic LaCoO3-based R![[3 with combining macron]](https://www.rsc.org/images/entities/char_0033_0304.gif) c. When La is almost completely substituted for Gd, the material can be stabilised in Pmmm, or cubic Pm
c. When La is almost completely substituted for Gd, the material can be stabilised in Pmmm, or cubic Pm![[3 with combining macron]](https://www.rsc.org/images/entities/char_0033_0304.gif) m, depending on thermal and atmospheric history. We list thermal expansion coefficients for x = 0–0.3, y = 0.2.
m, depending on thermal and atmospheric history. We list thermal expansion coefficients for x = 0–0.3, y = 0.2.
Introduction
The double perovskite Ba1−xGd1−yLax+yCo2O6−δ (BGLC) has shown good performance as a positrode (oxygen electrode) for Proton Ceramic Electrochemical Cells (PCECs).1,2 The structural properties entail several crystallographic and chemical phases,3 depending on the stoichiometry factors x and y – both reflecting La, substituted for Ba (x) and Gd (y). Furthermore, the thermal and chemical expansion is vital for mechanical stability when this materials class is applied as PCEC electrodes and subjected to large variations in temperature and chemical environment. In this work, we utilise Powder X-ray Diffraction (PXD), Synchrotron Radiation Powder X-ray Diffraction (SR-PXD) and Powder Neutron Diffraction (PND) to determine the development of BGLC's constituent phases, with variations in x (0–0.5) and y (0–1). A tetragonal or orthorhombic double perovskite unit cell with ordering between Ba and the lanthanides along the c-axis can be expressed by the general formula A1−xIAxI*A1−yIIAyII*Co2O6−δ, where AI and AII are ordered A-sites, and * denotes substitutions on the respective A-sites.This A-site cation ordering can be seen for other materials in the same family4–9 often also accompanied by ordering of the oxygen vacancies located in the Ln layers, as δ varies between 0 and 1, resulting in a doubled b-axis and stabilising an orthorhombic unit cell.4,10 The Co-based double perovskites generally exhibit high electronic and ionic conductivity,11 and introducing a mix between di- and trivalent A-site cations opens the possibility of tuning both functional properties as well as chemical and structural stability by adjusting average valence states (x) and ionic radius (x + y) of the A-site cations. The overall aim is to influence hydration thermodynamics, electrochemical performance and chemical stability. The system has three end members: BaLaCo2O6−δ (x = 0, y = 1, BLC), BaGdCo2O6−δ (x = 0, y = 0, BGC), and Ba0.5Gd0.8La0.7Co2O6−δ (x = 0.5, y = 0.2, BGLC587), where 50% of the Ba on AI is nominally substituted with La. In BLC, the A-site cations can take ordered (BaLaCo2O6−δ) or disordered (Ba0.5La0.5CoO3) configurations.4,12,13 The reason for the tendency of A-site order with decreasing y is the difference in ionic radii between the relatively large Ba2+ (ionic radius 1.61 Å), the smaller La3+ (ionic radius 1.36 Å),14 and the even smaller Gd3+ (ionic radius 1.27 Å).14 The size difference at y = 1 is not big enough to unambiguously favour the ordered state. By reduction (lower Co valence and oxygen content) or substituting Gd for La, the structure will gradually stabilise in the A-site ordered double perovskite configuration.
In BGC, the size difference between Ba and Gd is too large to enable an A-site disordered cubic polymorph in the dry state. BGC is reported with two phase transitions upon cooling: at 350 K the structure changes from tetragonal P4/mmm (space group 123) to orthorhombic Pmmm (space group 47). By further cooling, there is a second order phase transition starting at 247 K from Pmmm to Pmma, (space group 51), where Co2+ and Co3+ order.5 The differentiation between P4/mmm and Pmmm is rooted in the ordering of oxygen vacancies in the Ln–O layer, and is thus dependent on the oxygen non-stoichiometry (δ), which changes with temperature and pO2. The identification of orthorhombic distortion can be subtle, and is sometimes only seen in high-resolution XRD data.15
In BGLC587, 50% of the Ba is substituted with La, and the phase identification is more complicated. The aim of this work is to show how the phase compositions and unit cells change as the compositions vary in the x and y ranges. Moreover, we investigate the thermal expansion when x is varied between 0 and 0.3.
Experimental
Powders for High Temperature PXD – BGLC (x = 0, 0.1, 0.2, and 0.3, y = 0.2) – were prepared by combustion reaction of a nitrate solution. 40 g citric acid was dissolved in water in a large beaker on a hot plate. BaCO3 was slowly added until fully dissolved. La, Gd, and Co nitrates were subsequently dissolved in stoichiometric ratios. The water was evaporated on a hot plate with magnetic stir until a gel was formed, and the beaker was put in a heating cabinet at 250 °C for the combustion reaction to happen. The citric acid remains were burned off at 400 °C for 1 hour. The ashes were crushed thoroughly in a mortar and calcined at 1100 °C for five hours in an alumina crucible to obtain the desired BGLC phase.For SR-PXD on compositions with x = 0, 0.1, 0.2, 0.3, 0.4, and 0.5 and y = 0.2 we used commercial powders as described in a previous work.11 A second series for SR-PXD and PND (x = 0 and y = 0, 0.2, 0.3, 0.5, 0.7, 0.8, and 1) was prepared by a solid-state reaction as described in a previous study.4
HTPXD data were collected on a Bruker D8 Advance diffractometer using Mo radiation with a focussing Goebel mirror and LynxEye XE high energy detector. 2.5° Soller slits were used to reduce beam divergence. Data were collected over a range of 10–45° 2θ with a step size of 0.02° and a count tie of 1 s per step. The high temperature stage used was an Anton Paar HTK1200. Samples were measured in flat plate mode using standard 0.3 mm deep corundum crucibles. The samples were heated to 850 °C and cooled again to room temperature, first in air, then under argon (after evacuating the chamber and filling with Ar 3 times).
Iodometric titration, SR-PXD, and PND were performed as described in previous work.4 Hydration of BGLC82 was done by heating the commercial BGLC82 powder in air at 300 °C for 12 hours while bubbling the gas through a saturated solution of KBr in H2O to control the humidity at 2.6%. After 12 hours, the powder was quenched to room temperature and sealed.
Results
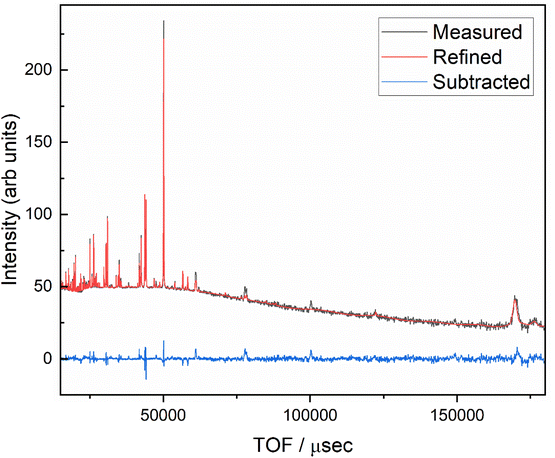
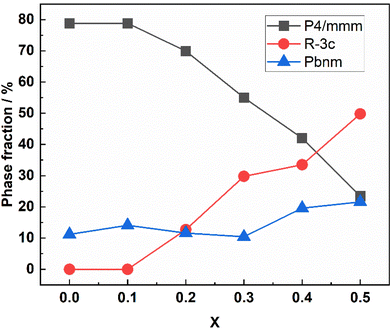
The BGLC series of compositions contain a range of crystallographic phases with compositional flexibility. With x = 0, the main phase is orthorhombic Pmmm, where Ba and La/Gd is ordered along the c-axis. BGLC's with x = 0.2 has previously been studied by powder XRD and reported with P4/mmm space group.3 Our results shows a doubling of the b-axis caused by ordering of the oxygen vacancies located in the Ln layer. The orthorhombic distortion is subtle in PXD diffractograms, and can only be seen in the high-resolution diffractograms, as the one presented for isotope enriched Ba160GdCo2O6−δ (B160GC) in Fig. 1 taken with TOF-PND.By increasing x, the Pmmm becomes indistinguishable from P4/mmm, and this phase gradually diminishes while a fraction of GdCoO3Pbnm emerges. From x = 0.2, a third phase – LaCoO3R![[3 with combining macron]](https://www.rsc.org/images/entities/char_0033_0304.gif) c (space group 167) – emerges and increases, leaving the end member, BGLC587 (x = 0.5) as a three-phase composite with 23 wt% of the original BGLC P4/mmm phase, 50 wt% LaCoO3, and 22 wt% GdCoO3. Both the LaCoO3 and GdCoO3 phases are substituted with La and Ba, giving a good fit for all composition when the refinements were constrained to nominal overall cation compositions (Fig. 2).
c (space group 167) – emerges and increases, leaving the end member, BGLC587 (x = 0.5) as a three-phase composite with 23 wt% of the original BGLC P4/mmm phase, 50 wt% LaCoO3, and 22 wt% GdCoO3. Both the LaCoO3 and GdCoO3 phases are substituted with La and Ba, giving a good fit for all composition when the refinements were constrained to nominal overall cation compositions (Fig. 2).
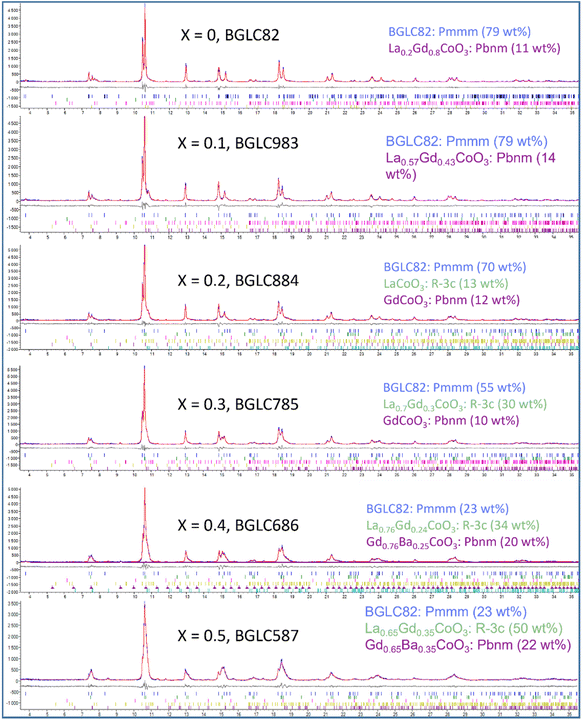 | ||
| Fig. 2 SR-PXD rietveld refinements (red line) of BGLC (x = 0–0.5, y = 0.2). Minority phases Co3O4, Gd2O3 and BaCO3 are refined, but omitted in the figure legends. | ||
All compositions of x have minor amounts of at least two among the phases BaCO3, Gd2O3 and Co3O4, as shown in Table 1 where all crystalline phases are shown with tentative compositions and fractions of total.
| Sample | Pmmm BGLC wt% (composition) |
R![[3 with combining macron]](https://www.rsc.org/images/entities/char_0033_0304.gif) c LaCoO3 wt% (composition) c LaCoO3 wt% (composition) |
Pbnm GdCoO3 wt% (composition) | Co3O4 wt% | Gd2O3 wt% | BaCO3 wt% |
|---|---|---|---|---|---|---|
| x = 0 | 78.8(4) | — | 11.2(5) | 2.0(2) | — | 7.2(2) |
| BaGd0.8La0.2Co2O6−δ | La0.2Gd0.8CoO3 | |||||
| x = 0.1 | 78.8(4) | — | 14.1(2) | 1.7(1) | 0.58(4) | 4.9(4) |
| BaGd0.8La0.2Co2O6−δ | La0.57Gd0.43CoO3 | |||||
| x = 0.2 | 69.9(5) | 12.7(4) | 11.6(4) | 1.54(8) | 0.42(4) | 3.8(2) |
| BaGd0.8La0.2Co2O6−δ | LaCoO3 | La0.05Gd0.88Ba0.07CoO3 | ||||
| x = 0.3 | 55.0(7) | 29.8(8) | 10.4(5) | — | 0.73(4) | 4.1(2) |
| BaGd0.8La0.2Co2O6−δ | La0.7Gd0.3CoO3 | GdCoO3 | ||||
| x = 0.4 | 42.0(4) | 33.5(4) | 19.6(2) | 1.11(7) | 0.64(4) | 3.2(1) |
| BaGd0.8La0.2Co2O6−δ | La0.76Gd0.24CoO3 | Gd0.75Ba0.25CoO3 | ||||
| x = 0.5 | 23.4(3) | 49.8(3) | 21.6(3) | 1.76(8) | — | 3.4(2) |
| BaGd0.8La0.2Co2O6−δ | La0.65Gd0.35CoO3 | Gd0.65Ba0.35CoO3 |
The evolvements of unit cell parameters with Ba/La fraction allowed an approximate assignment of substitutions in LaCoO3 and GdCoO3. The unit cell parameters in the initial P4/mmm phase were unaffected by La substitution, indicating that the Gd/La ratio of 8/2 was the most stable configuration with respect to formation of secondary phases. In Table 2: unit cell volumes of the three BGLC phases with x = 0–0.5, y = 0.2 (x = 0 refined to P4/mmm). We give unit cell volumes of the three main phases with increasing x. For simplicity and comparison we have here increased the symmetry from Pmmm to P4/mmm for x = 0.
| BGLC82 P4/mmm | LaCoO3R![[3 with combining macron]](https://www.rsc.org/images/entities/char_0033_0304.gif) c c |
GdCoO3Pbnm | |
|---|---|---|---|
| x = 0 | 114.7(1) | 215.80 | |
| x = 0.1 | 114.762(5) | — | 214.12(8) |
| x = 0.2 | 114.803(5) | 112.50(6) | 214.92(7) |
| x = 0.3 | 114.668(8) | 113.02(4) | 217.64(8) |
| x = 0.4 | 114.600(9) | 112.70(2) | 216.26(6) |
| x = 0.5 | 114.64(2) | 112.0(1) | 215.99(6) |
As can be seen from Table 2, there is no trend in cell volumes for the three phases, indicating that they stabilise each other by compositionally dependent symmetry changes, also reflecting the uncertainty in compositional determination based on Rietveld refinements alone.
We have previously shown that the chemical stability of BGLC in high steam pressures increases with x when y = 0.2,2 and also with y when x = 0.16 The increased stability for x = 0.5 can be suggested to stem from the ability of the secondary phases to incorporate Ba and La, and thus stabilising the main P4/mmm phase from decomposing to binary hydroxides. In Fig. 3 we show phase fractions in BGLC (x = 0–0.5, y = 0.2).
![[3 with combining macron]](https://www.rsc.org/images/entities/char_0033_0304.gif) m (space group 221), as illustrated in the refined SR-XRD diffractogram of reduced BLC, which contains 30 wt% cubic Pm
m (space group 221), as illustrated in the refined SR-XRD diffractogram of reduced BLC, which contains 30 wt% cubic Pm![[3 with combining macron]](https://www.rsc.org/images/entities/char_0033_0304.gif) m and 70 wt% A-site ordered Pmmm (Fig. 4).
m and 70 wt% A-site ordered Pmmm (Fig. 4).
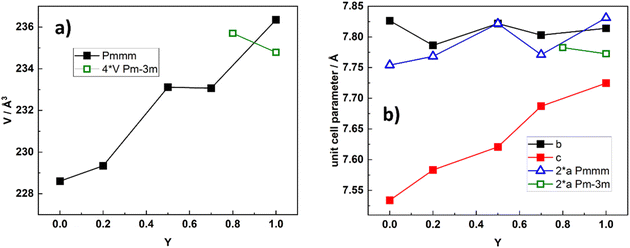
In Fig. 5, we present unit cell volume and cell parameters for BGLC compositions where x = 0 and y varies from 0 to 1, representing the solid solution of BGC and BLC.
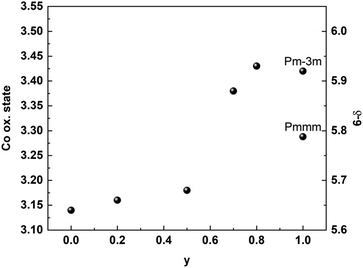
The increased cell volume is anisotropic along the c-axis, reflecting mainly the increased average Ln3+ radius as La replace Gd. The a- and b-axes are not affected by increased Ln3+ radius, as they are mainly fixed by the larger Ba2+ radius in the ab plane. The anisotropic evolvement of lattice parameters with increasing y is in accordance with previous results in the 0.2 ≤ y ≥ 0.8 range.3 The substitution of La for Gd also entails an increase in Co oxidation state as oxygen vacancies are gradually filled with increasing y. This is shown in Fig. 6, where we display the average Co oxidation state obtained by iodometric titration and accompanying oxygen non-stoichiometry as a function of y for BGLC (x = 0).
To investigate the effect of O occupancy vs. Co–O bond angle, we have refined the three highest compositions of x to a P4/mmm unit cell (Fig. 7, right) where O-occupancies on the O2 position were also refined, acknowledging that the refinement of occupancy on O2 is close to 1 and thus within uncertainty. The resulting correlation between O occupancies and O–Co–O bond angle is presented in Fig. 7.
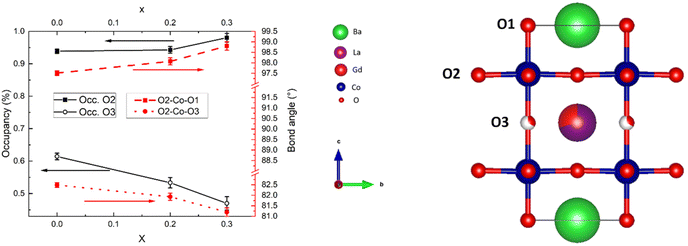 | ||
| Fig. 7 SR-PXD data at room temperature showing occupancies on O2 and O3 sites (left axis) and shift in O2–Co–O1 and O2–Co–O3 bond angles (right axis) with increasing La substitution x. | ||
It can be seen from Fig. 7 that the oxygen in the Co–O layer (O2) is positioned closer to the Ln layer with increasing occupancy, and that it is also positioned closer to the Ln layer with decreasing occupancy on O3. We will therefore expect anisotropic chemical expansion as red-ox mainly occurs at O3. We will come back to this phenomenon later.
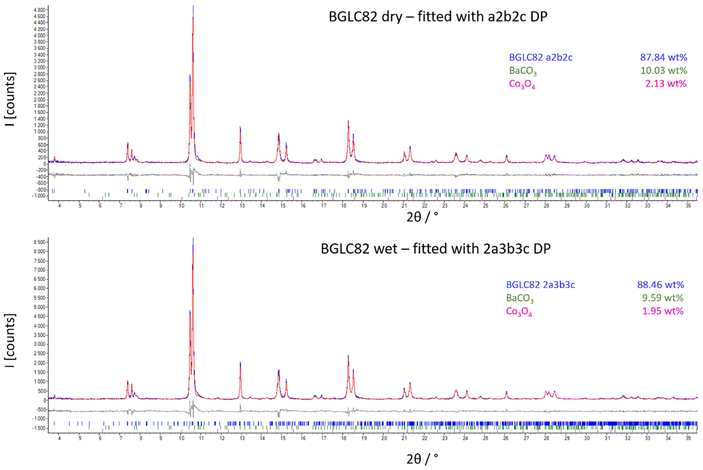 | ||
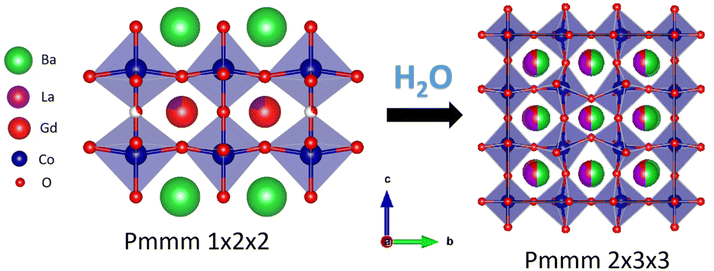
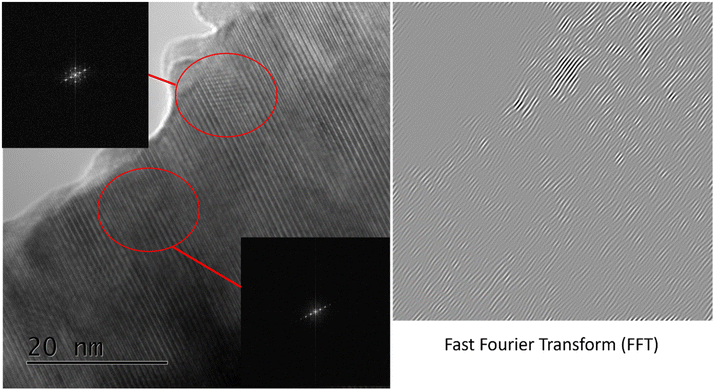
| Fig. 8 SR-PXD of BGLC82 treated in dry (upper) and wet (lower) atmosphere at 300 °C. The spectra are fitted to a Pmmm a2b2c (dry), and a Pmmm 2a3b3c (wet) unit cell. | ||
The refinements yield a suggested phase transition as shown in Fig. 9.
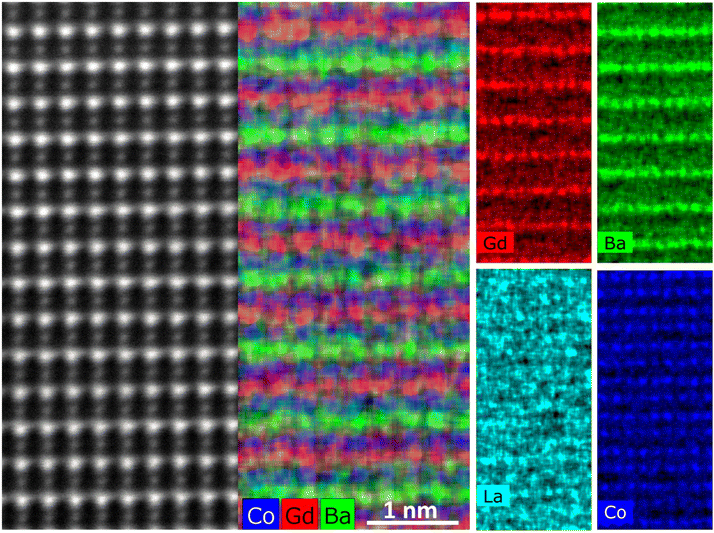
STEM-EDS atomic mapping was performed on the same sample in dry state, and the results show how Ba and Gd order along the c-axis (Fig. 11). The La signal is not strong enough for this composition to distinguish A-site ordering of Ba and La from background signals.
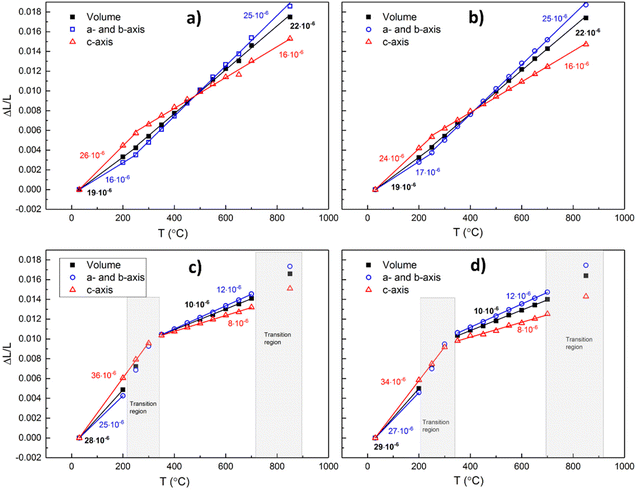 | ||
| Fig. 12 Thermal and chemical expansion of a- and b-axes and volume expansion in air for x = 0 (a), x = 0.1 (b), x = 0.2 (c), and 0.3 (d). | ||
The volume expansion of BGLC shows a linear dependence on temperature for x = 0 and 0.1 despite substantial oxygen loss upon heating above 300 °C. The absence of a net chemical volume expansion is seen also in BGCO and stems from anisotropic chemical expansion. This can be seen by comparing cell parameters as a function of temperature in air and Ar. The formation of oxygen vacancies has an expanding effect in the a–b plane and a contracting effect in the c direction, as exemplified in Fig. 13 for x = 0.1. The same effect of air and Ar can be seen for x = 0.2 and 0.3, while for x = 0, there is no change in a- or c-axis upon air vs. Ar atmosphere (Fig. 14).
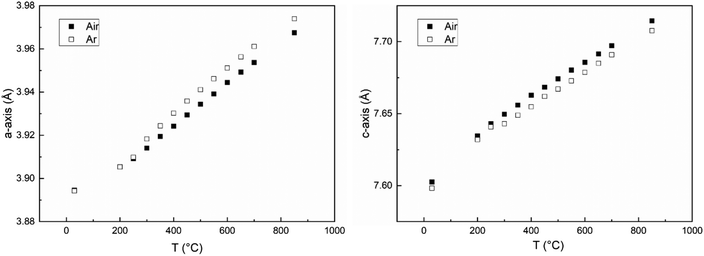 | ||
| Fig. 13 Cell parameters for a-axis (left) and c-axis (right) vs. temperature for x = 0.1 in air (closed squares) and Ar (open squares) atmospheres. | ||
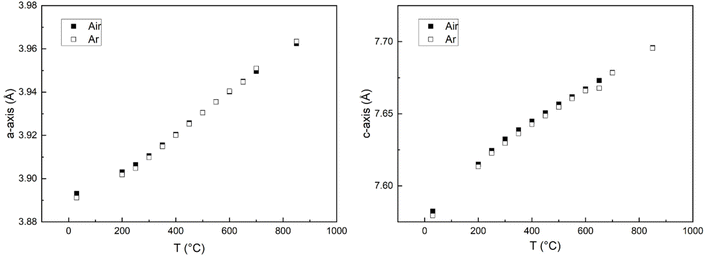 | ||
| Fig. 14 Cell parameters for a-axis (left) and c-axis (right) vs. temperature for x = 0 in air (closed squares) and Ar (open squares) atmospheres. | ||
It can also be seen from Fig. 13 and 14 that as oxygen loss starts at ∼300 °C, the thermal expansion increases in the ab-plane and decreases in the c-direction, both in Ar and Air atmospheres.
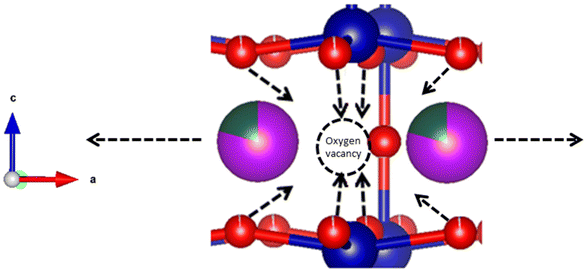
This anisotropic change in a/b- and c-axes can be seen as a result of reduction, and hence a higher oxygen non-stoichiometry with increasing temperature. It has previously been shown that the formation of oxygen vacancies in LnBaCo2O6−δ double perovskites induces a contraction in the c-axis and an expansion in the ab-plane.17 Two main reasons may be suggested for this expansion behaviour; coulombic forces, and red-ox of the B-site cation giving changes in the ionic radius of Co. When a new oxygen vacancy is formed, the radius of the vacancy is smaller than for the host oxide ion,18 but it still causes coulombic repulsion between the surrounding cations.19 This repulsion can be counteracted by an inward attraction felt by the surrounding oxide ions towards the oxygen vacancy (Fig. 15).
The tendencies of O2 to shift position towards the Ln layer with increased concentrations of O vacancies located there can be seen from the relation between O3 occupancies and O2–Co–O3 bond angles in Fig. 7.
The HT-XRD analysis (Fig. 12) shows different temperature behaviour for the two compositions with higher AI substitution (x = 0.2 and 0.3) than for the two with lower (x = 0 and 0.1). Looking at the a-axis, it can be seen that the two lower substituted compositions (x = 0 and 0.1) go from low TEC (17 and 18 × 10−6 K−1) in the temperature interval from RT to 300 °C to higher values (25 and 26 × 10−6 K−1) in the temperature interval from 350 to 850 °C. In the high temperature interval, the structure releases oxygen, and the increased TEC can thus be suggested to stem from an added expansion in the a–b plane due to formation of oxygen vacancies. If we compare with the c-axis, the trend is opposite. The TEC for the two same compositions is lowered in the high temperature interval, suggesting that chemical expansion has a negative contribution to the overall TEC, and that the c-axis thus contracts upon formation of oxygen vacancies.
For the two compositions with 20 and 30% La substitution for Ba on AI (x = 0.2 and 0.3), the trends are significantly altered. High TECs (33–36 × 10−6 K−1) for both a- and c-axes in the low temperature interval are lowered to 13 × 10−6 K−1 for the a-axis and 9 × 10⁻⁶ K−1 for the c-axis above 350 °C through an apparent phase transition.
The z-coordinate of the B-site Co in the structure varies slightly between the four compositions, albeit shifted towards the Ln layer for all compositions, indicating that the layered structure is not interrupted. Upon heating, the Co z-coordinate moves from an off-centred position, shifted towards the Ln layer to a symmetric position of 0.25 above 600 °C, indicating that some A-site ordering may be lost above this temperature. The positioning of the Co z-coordinate vs. temperature is given for BGLC (x = 0, y = 0.2) in air and inert atmosphere in Fig. 16.
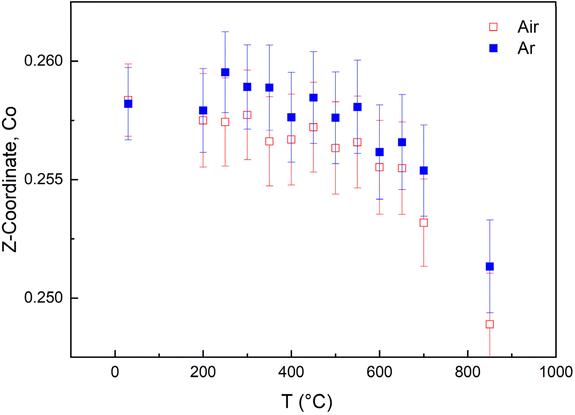 | ||
| Fig. 16 Z-coordinate of Co in BGLC (x = 0, y = 0.2) upon heating from RT to 850 °C in air and Ar atmosphere. | ||
Table 3 gives the extracted thermal expansion coefficients – including chemical expansion – for each axis and the volumetric thermal expansion coefficients at high and low temperatures and in air and Ar for all compositions.
| TEC (× 10−6 K−1) | ||||||
|---|---|---|---|---|---|---|
| Atmosphere | T (°C) | x = 0 | x = 0.1 | x = 0.2 | x = 0.3 | |
| a-Axis | Air | RT–300 | 17 | 18 | 33 | 34 |
| 350–850 | 25 | 25 | 13 | 13 | ||
| Ar | RT–300 | 16 | 21 | 34 | 35 | |
| 350–850 | 24 | 26 | 14 | 14 | ||
| c-Axis | Air | RT–300 | 25 | 23 | 36 | 34 |
| 350–850 | 15 | 15 | 9 | 9 | ||
| Ar | RT–300 | 25 | 23 | 35 | 36 | |
| 350–850 | 15 | 15 | 8 | 9 | ||
| Volume expansion | Air | RT–300 | 19 | 19 | 34 | 34 |
| 350–850 | 22 | 22 | 12 | 12 | ||
| Ar | RT–300 | 19 | 22 | 34 | 36 | |
| 350–850 | 21 | 22 | 12 | 12 | ||
Conclusions
We have shown the development of crystalline phases in double perovskite Ba1−xGd1−yLax+yCo2O6−δ (BGLC) in the intervals x = 0–0.5, y = 0.2 and x = 0, y = 0–1. The end members are BGLC587 (x = 0.5, y = 0.2), BGC (x = 0, y = 0), and BLC (x = 0, y = 1). The most studied and reported composition of BGLC with x = 0, y = 0.2 (BGLC82) is found to be a double perovskite with 79 wt% orthorhombic Pmmm, 11 wt% orthorhombic Ba-deficient Pbnm, and minor impurities of BaCO3 and Co3O4. Substitution of La for Ba on the Pmmm AI site gives formation of a cubic LaCoO3-based R![[3 with combining macron]](https://www.rsc.org/images/entities/char_0033_0304.gif) c phase when x ≥ 0.2. The end member BGLC587 is a three-phase material composed of 50 wt% LaCoO3 with space group R
c phase when x ≥ 0.2. The end member BGLC587 is a three-phase material composed of 50 wt% LaCoO3 with space group R![[3 with combining macron]](https://www.rsc.org/images/entities/char_0033_0304.gif) c, 23 wt% BaGd0.8La0.2Co2O6−δ with space group Pmmm and 22 wt% GdCoO3 with space group Pbnm, where Ba is distributed over Pmmm and Pbnm, and Gd is distributed over all three phases. For the compositions with x = 0.1 and 0, the dominating phase is always Pmmm. By increasing La-substitution for Gd (with x = 0), the orthorhombic phase dominates until y = 0.9 and 1, where the structure can be stabilised in Pmmm or cubic Pm
c, 23 wt% BaGd0.8La0.2Co2O6−δ with space group Pmmm and 22 wt% GdCoO3 with space group Pbnm, where Ba is distributed over Pmmm and Pbnm, and Gd is distributed over all three phases. For the compositions with x = 0.1 and 0, the dominating phase is always Pmmm. By increasing La-substitution for Gd (with x = 0), the orthorhombic phase dominates until y = 0.9 and 1, where the structure can be stabilised in Pmmm or cubic Pm![[3 with combining macron]](https://www.rsc.org/images/entities/char_0033_0304.gif) m depending on thermal and atmospheric history. The thermal expansion of BGLC is generally anisotropic, where reduction causes chemical expansion and contraction in the a–b plane and c-direction, respectively. Upon hydration, we propose the formation of an oxidised 2a3b3c Pmmm supercell formation with disordering of Ba and La, giving domains where Bragg-reflections overlap with the Pmmm a2b2c unit cell.
m depending on thermal and atmospheric history. The thermal expansion of BGLC is generally anisotropic, where reduction causes chemical expansion and contraction in the a–b plane and c-direction, respectively. Upon hydration, we propose the formation of an oxidised 2a3b3c Pmmm supercell formation with disordering of Ba and La, giving domains where Bragg-reflections overlap with the Pmmm a2b2c unit cell.
Conflicts of interest
There are no conflicts to declare.Acknowledgements
The research has been supported by the National Science Centre Poland (2016/22/Z/ST5/00691), the Spanish Ministry of Science and Innovation (PCIN-2017-125, RTI2018-102161 and IJCI-2017-34110), and the Research Council of Norway (Grant no. 272797 “GoPHy MiCO”) through the M-ERA.NET Joint Call 2016. The authors acknowledge the skilful assistance from the staff of the Swiss–Norwegian Beamline (SNBL) at the European Synchrotron Radiation Facility (ESRF), Grenoble, France. Dr. Cheng Li at POWGEN, SNS, Oak Ridge, US and Dr. Chiu C. Tang at beamline I11 at Diamond, Didcot, UK are gratefully acknowledged for PND and SR-PXD measurements, respectively.References
- R. Strandbakke, V. A. Cherepanov, A. Y. Zuev, D. S. Tsvetkov, C. Argirusis, G. Sourkouni, S. Prünte and T. Norby, Solid State Ionics, 2015, 278, 120 CrossRef CAS.
- E. Vøllestad, R. Strandbakke, M. Tarach, D. Catalán-Martínez, M.-L. Fontaine, D. Beeaff, D. R. Clark, J. M. Serra and T. Norby, Nat. Mater., 2019, 18(7), 752 CrossRef PubMed.
- D. Malyshkin, A. Novikov, I. Ivanov, V. Sereda, D. Tsvetkov and A. Zuev, J. Alloys Compd., 2020, 845, 156309 CrossRef CAS.
- S. L. Wachowski, I. Szpunar, M. H. Sørby, A. Mielewczyk-Gryń, M. Balaguer, C. Ghica, M. C. Istrate, M. Gazda, A. E. Gunnæs, J. M. Serra, T. Norby and R. Strandbakke, Acta Mater., 2020, 199, 297 CrossRef CAS.
- N. Ishizawa, T. Asaka, T. Kudo, K. Fukuda, A. Yasuhara, N. Abe and T.-h. Arima, Chem. Mater., 2014, 26(22), 6503 CrossRef CAS.
- A. Grimaud, K. J. May, C. E. Carlton, Y.-L. Lee, M. Risch, W. T. Hong, J. Zhou and Y. Shao-Horn, Nat. Commun., 2013, 4(1), 2439 CrossRef PubMed.
- D. S. Tsvetkov, I. L. Ivanov, D. A. Malyshkin and A. Y. Zuev, Dalton Trans., 2014, 43(31), 11862 RSC.
- A. A. Taskin, A. N. Lavrov and Y. Ando, Phys. Rev. B: Condens. Matter Mater. Phys., 2005, 71(13), 134414 CrossRef.
- C. Frontera, A. Caneiro, A. E. Carrillo, J. Oró-Solé and J. L. García-Muñoz, Chem. Mater., 2005, 17(22), 5439 CrossRef CAS.
- A. Maignan, C. Martin, D. Pelloquin, N. Nguyen and B. Raveau, J. Solid State Chem., 1999, 142(2), 247 CrossRef CAS.
- E. Vøllestad, M. Schrade, J. Segalini, R. Strandbakke and T. Norby, J. Mater. Chem. A, 2017, 5(30), 15743 RSC.
- C. Bernuy-Lopez, K. Høydalsvik, M.-A. Einarsrud and T. Grande, Materials, 2016, 9(3), 154 CrossRef PubMed.
- I. Szpunar, S. Wachowski, T. Miruszewski, K. Dzierzgowski, K. Górnicka, T. Klimczuk, M. H. Sørby, M. Balaguer, J. M. Serra, R. Strandbakke, M. Gazda and A. Mielewczyk-Gryń, J. Am. Ceram. Soc., 2020, 103(3), 1809 CrossRef CAS.
- Y. Q. Jia, J. Solid State Chem., 1991, 95(1), 184 CrossRef CAS.
- I. Szpunar, R. Strandbakke, M. H. Sørby, S. L. Wachowski, M. Balaguer, M. Tarach, J. M. Serra, A. Witkowska, E. Dzik, T. Norby, M. Gazda and A. Mielewczyk-Gryń, Materials, 2020, 13(18), 4044 CrossRef CAS PubMed.
- A. Mielewczyk-Gryń, S. Yang, M. Balaguer, R. Strandbakke, M. H. Sørby, I. Szpunar, A. Witkowska, S. Wachowski, J. M. Serra, A. Navrotsky and M. Gazda, under publication.
- D. S. Tsvetkov, I. L. Ivanov, D. A. Malyshkin, A. L. Sednev, V. V. Sereda and A. Y. Zuev, Pure Appl. Chem., 2019, 91(6), 923 CrossRef CAS.
- C. Chatzichristodoulou, P. Norby, P. V. Hendriksen and M. B. Mogensen, J. Electroceram., 2015, 34(1), 100 CrossRef CAS.
- Y. Wang, C. Cai, L. Li, L. Yang, Y. Zhou and G. Zhou, AIP Adv., 2016, 6(9), 095113 CrossRef.
| This journal is © The Royal Society of Chemistry 2022 |

