 Open Access Article
Journey of a molecule from the solid to the gas phase and vice versa: direct estimation of vapor pressure of alkaline-earth metalorganic precursors for atmospheric pressure vapor phase deposition of fluoride films†
Francesca
Lo Presti
,
Anna L.
Pellegrino
 and
Graziella
Malandrino
 *
*
Dipartimento di Scienze Chimiche, Università degli Studi di Catania, INSTM UdR Catania, Viale Andrea Doria 6, I-95125 Catania, Italy. E-mail: graziella.malandrino@unict.it
First published on 22nd April 2022
Abstract
Atmospheric pressure (AP) vapor phase processes such as spatial atomic layer deposition (S-ALD) and AP-metalorganic chemical vapor deposition (AP-MOCVD) are becoming increasingly appealing for their use in a variety of academic and industrial applications. Evaluation of precursor vapour pressures is crucial for their application in AP processes and to this aim the Langmuir equation has been applied as a simple and straightforward method for estimating the vapor pressure and vaporization enthalpy of various metalorganic precursors. Using benzoic acid as a calibration reference, the vapour pressure–temperature curves for several alkaline-earth β-diketonate fluorinated compounds, with molecular formula “M(hfa)2·L” (with M = Mg, Ca, Sr, Ba; Hhfa = 1,1,1,5,5,5-hexafluoroacetylacetone and L = diglyme, triglyme, and tetraglyme) are derived from their termogravimetric curves. Thus, the enthalpy of vaporization of all complexes has been estimated using the Clausius–Clapeyron equation. As a proof of concept, preliminary results on the use of [Mg(hfa)2·2H2O]·2diglyme and [Ca(hfa)2·diglyme·H2O] or [Ca(hfa)2·triglyme] as precursors for AP-MOCVD deposition of MgF2 and CaF2 in the form of thin films are presented. This approach may be used to easily determine vapor pressures of complexes and thus evaluate “a priori” the suitability of a compound as precursor for AP-MOCVD and/or spatial ALD.
Introduction
The success of chemical deposition processes through vapor phase, either chemical vapor deposition (CVD)1 or atomic layer deposition (ALD)2,3 depends on a variety of factors, but a crucial issue is certainly the choice of appropriate molecular precursors.4 Their chemical properties, as well as their design, affect their thermal properties, in terms of thermal stability and volatility, thus the reproducibility of the process and, in turn, the quality of the final materials. Over the years, the most intriguing and challenging precursors are those containing alkaline-earth (AE) and lanthanide metals due to their large ionic radii, which require a tailored coordination sphere to determine good thermal properties. The most important properties for a good precursor to be used in vapor phase processes are high volatility, thermal stability under vaporization and vapor phase conditions, and an optimized temperature range between evaporation and decomposition for the film deposition. The precursors who first exhibited such good properties are, undoubtedly, the β-diketonate metal complexes M(RCOCHCOR)x (R = –CH3, –C6H5, –CF3, etc.).5 These complexes are known as “first-generation” precursors and, even though widely used, suffer from relevant issues with particular reference to group II and lanthanide metal complexes. On the other hand, alkaline-earth and lanthanide metalorganic precursors are essential for the film deposition of various functional materials, such as ferroelectrics, superconductors and ionic/electron conductors for solid oxide fuel cells.6–8 Recently, alkaline-earth precursors have attracted even more attention due to their applications to the deposition of fluoride films, challenging host matrices for upconversion or downconversion processes.9Great efforts have been devoted to overcome those issues, such as low volatility and poor thermal stability due to the lack of the saturation of the metal centre coordination sphere resulting in the formation of non-volatile oligomeric structures. These drawbacks have stimulated the synthesis of new metalorganic β-diketonate compounds, named “second-generation” precursors, in which the addition of neutral ligands such as polyethers prevents the oligomerization and water-coordination, thus improving thermal stability and volatility.10,11
In addition, along with the development of new and promising precursors, it is also critical to investigate their physico-chemical properties, particularly their thermal behaviour and vapor phase stability, which are essential characteristics for their application in metal–organic chemical vapor deposition (MOCVD) procedures. The above-mentioned “second-generation” precursors have been widely applied in MOCVD approaches under reduced pressure conditions,12–15 and their thermal properties make them also suitable for ALD processes.
Recently, another form of ALD processes is emerging, i.e. the spatial ALD (SALD),16,17 which has the great advantage of a much higher growth rate per cycle, but this variant is regularly carried out under atmospheric pressure.
These conditions make the thermal requirements of precursors even more stringent since they should possess a high volatility at atmospheric pressure. Under the light of these premises, optimizing a simple approach to evaluate the vapor pressures of complexes is fundamental to have a reference point on the suitability of a given precursor for application in AP-vapor phase processes. This information would avoid a full trial-and-error approach in the optimization of film deposition through SALD.
Herein, a simple and functional approach has been implemented to evaluate the vapor pressures of the fluorinated β-diketonate alkaline-earth adducts of the type “M(hfa)2·glyme” [with Hhfa = 1,1,1,5,5,5-hexafluoroacetylacetone, M = Mg, Ca, Sr and Ba; glyme = diglyme bis(2-methoxyethyl)ether, triglyme (2,5,8,11-tetraoxadodecane) and tetraglyme (2,5,8,11,14-pentaoxapentadecane)] for application in atmospheric pressure vapor phase processes. Thermogravimetric (TGA) analyses have been used to firstly confirm thermal stability and volatility of these complexes. Starting from the experimental data of the thermogravimetric analyses, we deeply discuss the possibility of using the Langmuir equation for the direct estimation of vapor pressure and enthalpy of vaporization for the principal alkaline-earth “second-generation” β-diketonate fluorinated precursors.
Furthermore, as a proof of concept, the [Mg(hfa)2·2H2O]·2diglyme and the calcium complexes, [Ca(hfa)2·diglyme·H2O] and [Ca(hfa)2·triglyme], have been tested for the fabrication of nanostructured MgF2 and CaF2, respectively, thin films on silicon substrates through atmospheric pressure processes in a customized horizontal hot-wall reactor.
Experimental
Alkaline-earth precursors synthesis
Magnesium hydroxide (purity 95+%), calcium oxide (purity 99.95%), strontium hydroxide octahydrate (purity 98+%), barium hydroxide octahydrate (purity 98+%), and Hhfa (purity 98%) were purchased from STREM Chemicals; while diglyme (purity 99.5%) triglyme (purity 99%) and tetraglyme (purity 99.9%) were purchased from Sigma-Aldrich and used without further purification processes. The M(hfa)2·L complexes (where M = Mg, Ca, Sr, Ba and L = diglyme, triglyme, tretraglyme) were synthesized by the reaction of the metal hydroxide or oxide with the fluorinated β-diketone (Hhfa) and the appropriate polyether ligands. The syntheses were carried out under reflux for 1 h using dichloromethane as solvent. Details of the procedure can be found elsewhere.18,19Thermal analysis
Thermogravimetric analyses were carried out using a Mettler Toledo TGA with STARe software. All thermogravimetric experiments were repeated at least three times to confirm the accuracy and reproducibility of the data. About 15–18 mg of precursor were placed in an alumina crucible (40 μl). The samples were then heated at atmospheric pressure under purified nitrogen flow (50 sccm) with a 10 °C min−1 heating rate. The vapor pressures of the alkaline-earth metalorganic compounds were estimated by applying Langmuir's equation and by using benzoic acid as the standard whose vapor pressure data, together with the Antoine's constant, were taken from literature.20Synthesis and characterization of MgF2 and CaF2 thin films
The depositions were carried out starting from [Mg(hfa)2·2H2O]·2diglyme and the calcium complexes, [Ca(hfa)2·diglyme·H2O] and [Ca(hfa)2·triglyme] for MgF2 and CaF2 films, respectively, on Si substrate in a horizontal, hot-wall MOCVD reactor, using argon (150 sccm) as carrier gas, and oxygen (200 sccm) as reacting gas under atmospheric-pressure. The Ar and O2 flows were introduced in proximity to the reaction zone and controlled using MKS 1160 flow controller units. The substrate temperature was maintained at 450 °C. The precursor source temperature was kept at the value of 140 °C for [Mg(hfa)2·2H2O]·2diglyme and 195 °C in the case of [Ca(hfa)2·diglyme·H2O] or [Ca(hfa)2·triglyme] for an efficient vaporization process. The time of each deposition was fixed at 60 minutes. Structural characterization was performed using a Smartlab Rigaku diffractometer in grazing incident mode (0.5°) operating at 45 kV and 200 mA equipped with a rotating anode of Cu Kα radiation. Film morphologies were investigated using field emission scanning electron microscopy (FE-SEM) ZEISS SUPRA 55 VP. The EDX spectra were recorded using an INCA-Oxford windowless detector, having a resolution of 127 eV as the full width at half maximum (FWHM) of the Mn Kα.Results
As a result of the studies carried out by diverse research groups new monomeric, volatile, and thermally stable metal sources of the type M(β-diket)2·polyether for thin film deposition via MOCVD techniques have emerged.18,19,21–29Table 1 reports a list of the most common alkaline-earth “second-generation” precursors. The alkaline-earth metal β-diketonate complexes coordinated with polyethers, object of the present study, have a general formula “M(hfa)2·CH3O(CH2CH2O)nCH3” with M = Mg, Ca, Sr, Ba and n = 2 diglyme, n = 3 triglyme, n = 4 tetraglyme.| Alkaline-earth metal | Ligands | ||
|---|---|---|---|
| Diglyme | Triglyme | Tetraglyme | |

|
[Mg(hfa)2·2H2O]·2diglyme19 | ||

|
[Ca(hfa)2·diglyme·H2O]24 | [Ca(hfa)2·triglyme]21,27 | [Ca(hfa)2·tetraglyme]18,25 |

|
[Sr(hfa)2·diglyme·H2O]24 | [Sr(hfa)2·triglyme·H2O]2![[thin space (1/6-em)]](https://www.rsc.org/images/entities/char_2009.gif) 28 28 |
[Sr(hfa)2·tetraglyme]18 |

|
[Ba(hfa)2·(diglyme)2]24 | [Ba(hfa)2·triglyme·H2O]29 | [Ba(hfa)2·tetraglyme]18,26 |
All the alkaline-earth metals forming the above-mentioned precursors, have a +2 oxidation state, but their coordination number tends to increase (Mg < Ca < Sr < Ba) with the increasing of the ionic radius. Nevertheless, there is essentially no preferential coordination geometry, at difference with transition metals, with the exception of a preferred spherical distribution of the donor atoms.30
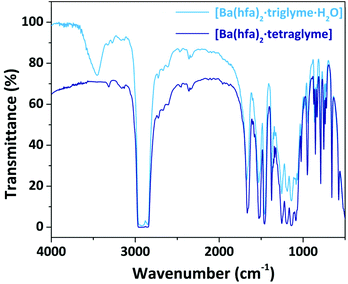
The nature of the adducts has been assessed through comparison of their melting points and FT-IR spectra with literature data. All the FT-IR spectra show a peak at 1660 cm−1 associated with the C![[double bond, length as m-dash]](https://www.rsc.org/images/entities/char_e001.gif) O stretching, whose shift, compared to the free ligand, confirms coordination of the hfa, hence formation of the complexes. Around 3500 cm−1 a broad band is observed in those adducts which have coordinated water molecules, while in the range 1100–750 cm−1 the peaks associated with the glyme coordination are observed. As an exemplificative case, the FT-IR spectra of the Ba adducts are reported in Fig. 1, while the other spectra are reported in the ESI in Fig. S1–S3.† In the case of the Ba adduct spectra (Fig. 1), the saturated signal at 2900 cm−1 is actually due to the C–H stretching of the nujol overlapping the C–H stretching signal of the glyme.
O stretching, whose shift, compared to the free ligand, confirms coordination of the hfa, hence formation of the complexes. Around 3500 cm−1 a broad band is observed in those adducts which have coordinated water molecules, while in the range 1100–750 cm−1 the peaks associated with the glyme coordination are observed. As an exemplificative case, the FT-IR spectra of the Ba adducts are reported in Fig. 1, while the other spectra are reported in the ESI in Fig. S1–S3.† In the case of the Ba adduct spectra (Fig. 1), the saturated signal at 2900 cm−1 is actually due to the C–H stretching of the nujol overlapping the C–H stretching signal of the glyme.
Vapor pressure estimation using the Langmuir equation
The vapor pressure of metalorganic precursors can be readily determined using the Langmuir equation,31 which assesses a relation between the vapor pressure P (Pa) of a certain substance of molecular mass M (kg mol−1) at temperature T (K) and its evaporation rate dm/dt (kg s−1) (eqn (1)): | (1) |
| P = υ·k | (2) |
 | (3) |
For a defined calibration standard of mass M, by plotting the logarithm of P (Pa) calculated from eqn (3)vs. υ derived directly from the TGA/DTG experiment, the value of k can be estimated.34
It is worth noting that the Antoine equation is closely linked to a specific temperature range, thus, the results will be more precise the smaller the temperature range employed to calculate them. Therefore, for each compound the vapor pressure can be calculated using eqn (2) if k is known.
The Clausius–Clapeyron equation35 (eqn (4)) can additionally be used to determine the enthalpy of vaporization of the substances under investigation:
 | (4) |
In the eqn (4), P is the vapor pressure (Pa), A is a constant, ΔH is the enthalpy of vaporization (kJ mol−1) and R is the gas constant (J K−1 mol−1). Using the vapor pressure from eqn (3), by plotting the ln of P (Pa) versus 1/T (K−1) the ΔH may be extrapolated from the slope of the straight line. It is worth noting that the Clausius–Clapeyron equation only applies to substances that evaporate and sublimate in a zero-order process.
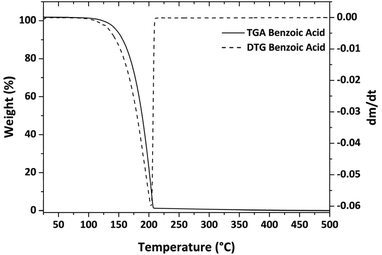
Using eqn (2), the k value was calculated from three distinct experiments and found to be 839![[thin space (1/6-em)]](https://www.rsc.org/images/entities/char_2009.gif) 325 Pa kg1/2 m−2 s−1 K−1/2 on average (the relative plot is reported in Fig. S4†). This value is similar to previous literature estimates; the small variations are due to the fact that k is highly dependent on the instrumentation and operating conditions.39,41,42
325 Pa kg1/2 m−2 s−1 K−1/2 on average (the relative plot is reported in Fig. S4†). This value is similar to previous literature estimates; the small variations are due to the fact that k is highly dependent on the instrumentation and operating conditions.39,41,42
Regardless, a back-test has been performed to verify the accuracy of the result. Therefore, the vapor pressure of another chemical, salicylic acid, whose vapor pressure values are well-known in the literature36,43 have been estimated. More specifically, salicylic acid vapor pressure has been assessed in the temperature range 416–477 K, using eqn (3) and the Antoine constant from ref. 3, and has been compared to the values obtained using eqn (2) with the k value derived from the benzoic acid analysis. Fig. S5† depicts the results, which indicate a good match with the reference data. The salicylic acid enthalpy of vaporization calculated using vapor pressure data has been compared to other references. The enthalpy of vaporization obtained is 76.03 ± 0.55 kJ, and compares very well with the value of 79 kJ obtained in ref. 36. TGA/DTG and ln of P vs. 1/T of salicylic acid are shown in Fig. S6.†
Vapor pressure and ΔH estimation for alkaline-earth metalorganic compounds
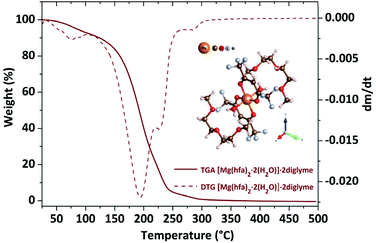
The TGA plot displays two weight loss regions: the first, in the temperature range 308–383 K, is associated with dehydration, and the second, in the temperature range from 402 to 461 K, is related to the quantitative evaporation of the anhydrous complex, [Mg(hfa)2·2diglyme], leaving a very low residue.
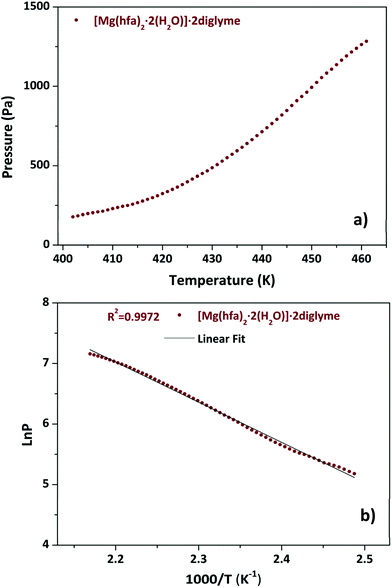
Fig. 4a shows the graph of the vapour pressure vs. temperature, while the graph in Fig. 4b, reporting the ln![[thin space (1/6-em)]](https://www.rsc.org/images/entities/char_2009.gif) P in function of 1/T, allowed the estimation of the enthalpy of vaporization calculated using the Clausius–Claypeyron method. The estimated ΔH for a temperature range of 402–461 K is 55.1 ± 0.3 kJ mol−1, whereas the extrapolated vapor pressure at 423 K is 365.1 Pa.
P in function of 1/T, allowed the estimation of the enthalpy of vaporization calculated using the Clausius–Claypeyron method. The estimated ΔH for a temperature range of 402–461 K is 55.1 ± 0.3 kJ mol−1, whereas the extrapolated vapor pressure at 423 K is 365.1 Pa.
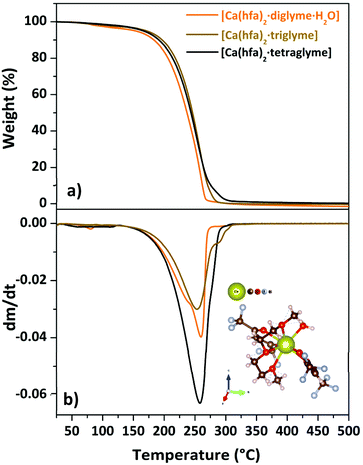 | ||
| Fig. 5 TGA curves (a) and DTG plot (b) of “Ca(hfa)2·L” compounds (with L = diglyme, triglyme, tetraglyme). Scheme of the [Ca(hfa)2·triglyme] is reportd as inset in (b). | ||
Regarding the [Ca(hfa)2·tetraglyme] structure, the Ca2+ is octacoordinated by the four oxygens from the hfa units and four of the five oxygen atoms from the tetraglyme ligand.25
The TGA/DTG plots for the Ca adducts with different glyme ligands are reported in Fig. 5a and b.
The presence of a minimum from 333 to 358 K for the [Ca(hfa)2·diglyme·H2O] (orange curve) is observed on the TGA plot, corresponding to the elimination of the water molecule, while the main weight loss at higher temperatures refers to the vaporization of the anhydrous complex [Ca(hfa)2·diglyme], leaving a residue of less than 1%. The thermal behaviour of [Ca(hfa)2·triglyme] (brown line) and [Ca(hfa)2·tetraglyme] (black line) is remarkably comparable in the temperature ranges of 423–529 K and 433–523 K, respectively. These curves show only one-step major loss and no residues, confirming quantitative vaporization processes for both complexes. Fig. 6 shows the vapor pressure trends as a function of temperature.
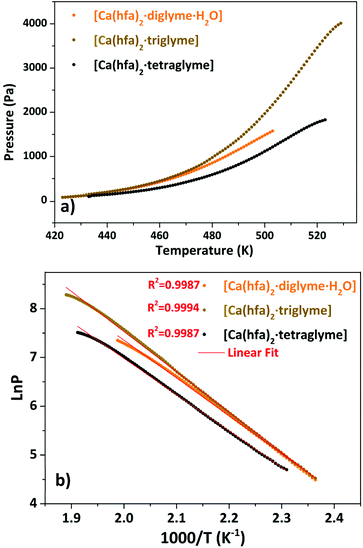 | ||
Fig. 6 Vapor pressure/temperature (a) and ln![[thin space (1/6-em)]](https://www.rsc.org/images/entities/char_2009.gif) P vs. 1/T (b) plots of Ca(hfa)2·L compounds (with L = diglyme, triglyme, tetraglyme). P vs. 1/T (b) plots of Ca(hfa)2·L compounds (with L = diglyme, triglyme, tetraglyme). | ||
According to the ln![[thin space (1/6-em)]](https://www.rsc.org/images/entities/char_2009.gif) P vs. 1/T plot, the ΔH values for [Ca(hfa)2·diglyme·H2O], [Ca(hfa)2·triglyme], and [Ca(hfa)2·tetraglyme] are 64.4 ± 0.2 kJ mol−1, 68.6 ± 0.2 kJ mol−1 and 61.9 ± 0.2 kJ mol−1, respectively. The results show that the “Ca(hfa)2glyme” adducts have similar vaporization enthalpies and thus comparable volatilities under atmospheric conditions.
P vs. 1/T plot, the ΔH values for [Ca(hfa)2·diglyme·H2O], [Ca(hfa)2·triglyme], and [Ca(hfa)2·tetraglyme] are 64.4 ± 0.2 kJ mol−1, 68.6 ± 0.2 kJ mol−1 and 61.9 ± 0.2 kJ mol−1, respectively. The results show that the “Ca(hfa)2glyme” adducts have similar vaporization enthalpies and thus comparable volatilities under atmospheric conditions.
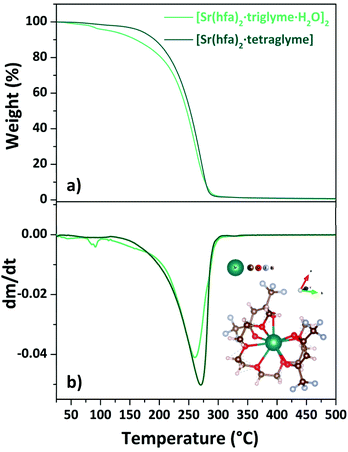 | ||
| Fig. 7 TGA curves (a) and DTG plots (b) of “Sr(hfa)2·L” adducts (with L = triglyme, tetraglyme). Scheme structure of the [Sr(hfa)2·tetraglyme] is reported as inset in (b). | ||
The loss of coordinated water molecules from the [Sr(hfa)2·triglyme·H2O]2 complex (light green line) results in a slight weight loss at 345–373 K. Then, in the range of 466–528 K, the dehydrated species [Sr(hfa)2·triglyme] evaporates with one-step weight loss, leaving no residue. The [Sr(hfa)2·tetraglyme] adduct, on the other hand, shows a one-step weight loss of 98% in the temperature range of 454–545 K. Hence, the enthalpy of vaporization estimated from the vapor pressure vs. temperature plots (Fig. S7†), is equal to 60.4 ± 0.4 kJ mol−1 and 74.3 ± 0.1 kJ mol−1 for the [Sr(hfa)2·triglyme·H2O]2 and the [Sr(hfa)2·tetraglyme], respectively. In comparison to the compound with a longer chain ligand, it appears that the Sr adduct with triglyme has a lower enthalpy of vaporization, and hence a better thermal behaviour, with a trend similar to calcium ones. As a consequence, the predicted vapor pressure for both compounds at 423 K is 73.4 Pa for the [Sr(hfa)2·triglyme·H2O]2 and 34.8 Pa for the [Sr(hfa)2·tetraglyme] species.
Consequently, only the [Ba(hfa)2·triglyme·H2O] and [Ba(hfa)2·tetraglyme] are the Ba adducts under investigation in this work. The Ba(II) ion in the [Ba(hfa)2·triglyme·H2O] structure is nine coordinated by eight oxygens from the hfa and triglyme and an oxygen from the water molecule completing the coordination sphere.29
When tetraglyme is used, the 9-coordination of Ba(II) is reached with the four oxygens of the hfa and all the five oxygens from the tetraglyme ligand (inset in Fig. 8b), yielding the anhydrous volatile [Ba(hfa)2·tetraglyme].18,26 The thermal behaviour of these two adducts is investigated by their TGA analysis (Fig. 8a) and its derivative curve (Fig. 8b).
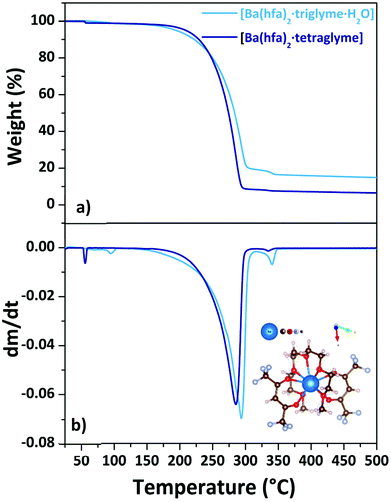 | ||
| Fig. 8 TGA curves (a) and DTG plots (b) of Ba(hfa)2·L adducts (with L = triglyme, tetraglyme). Scheme structure of the [Ba(hfa)2·tetraglyme] is reportedas inset in (b). | ||
For the [Ba(hfa)2·triglyme·H2O] adduct (light blue line), the initial weight loss in the range between 358–373 K is due to the dehydration process, leaving the [Ba(hfa)2·triglyme] anhydrous species. The major vaporization process starts at a temperature of 438 K and ends at 542 K with a quite high residue of about 20%. It is worth to note that even though a certain residue is left behind, the ΔH and vapor pressure may still be evaluated considering that the product of dehydratation of the [Ba(hfa)2·triglyme·H2O] has been reported to evaporate congruently.27 Instead, the [Ba(hfa)2·tetraglyme] adduct (dark blue line) has a one-step 88% weight loss in the temperature range between 432–553 K. Fig. S8† depicts the vapor pressure/temperature plots.
The enthalpy of vaporization calculated from the ln![[thin space (1/6-em)]](https://www.rsc.org/images/entities/char_2009.gif) P vs. 1/T plot for the [Ba(hfa)2·triglyme·H2O] and [Ba(hfa)2·tetraglyme] is 53.6 ± 0.3 kJ mol−1 and 82.1 ± 0.1 kJ mol−1, respectively. In the case of the Ba-tetraglyme adduct, the longer glyme yields a slightly less volatile precursor.
P vs. 1/T plot for the [Ba(hfa)2·triglyme·H2O] and [Ba(hfa)2·tetraglyme] is 53.6 ± 0.3 kJ mol−1 and 82.1 ± 0.1 kJ mol−1, respectively. In the case of the Ba-tetraglyme adduct, the longer glyme yields a slightly less volatile precursor.
In literature there are few reports on the synthesis of MgF2 and CaF2 thin films through reduced pressure chemical vapor deposition from the “second-generation” [M(hfa)2·polyether] adducts.9,10,19,24,42,44–46 Recently, a solution process through sol–gel/spin coating approach has been tested as well for the deposition of CaF2.9,45 To the best of our knowledge, the present study represents the first report on the synthesis of MgF2 and CaF2 thin film through atmospheric pressure process starting from the [Mg(hfa)2·2H2O]·2diglyme and the [Ca(hfa)2·diglyme·H2O] or [Ca(hfa)2·triglyme] complexes, respectively.
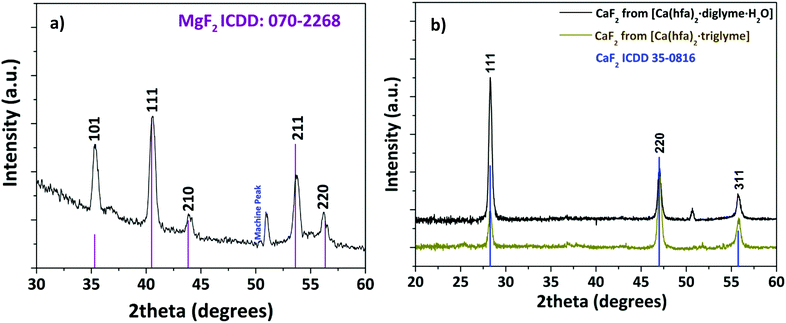
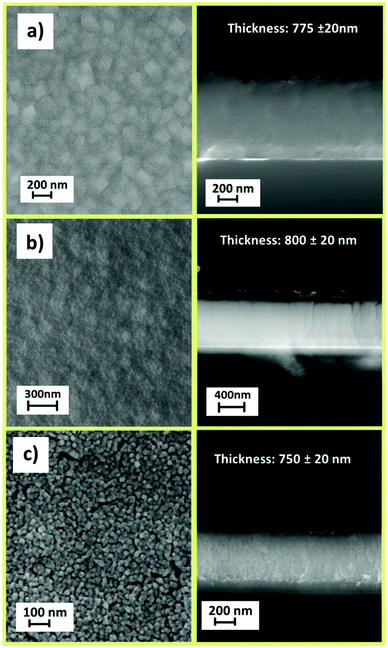
Structural characterization, performed through XRD analysis, is reported in Fig. 9 for the film deposited at 450 °C on Si (100) substrate. The peaks at 2θ = 35.28°, 40.56°, 43.96°, 53.66°, and 56.14° of the pattern in Fig. 9a correspond to the 101, 111, 210, 211 and 220 reflections of the MgF2 phase (ICDD No. 070-2268). The CaF2 formation (Fig. 9b) is assessed by the presence of peaks at 2θ = 28.28°, 47.04° and 55.78° associated with the 111, 220 and 311 reflections, respectively (ICDD No. 35-0816). It is worth mentioning that a pure polycrystalline CaF2 phase is produced regardless of the applied precursor, either [Ca(hfa)2·diglyme·H2O] or [Ca(hfa)2·triglyme]. The only difference between the two patterns is the relative intensities of the peaks which do not exactly match the intensities reported in the database. Surface morphology investigations have been carried out through field–emission Scanning Electron Microscopy (FE-SEM) analysis in both plan view and cross-sectional configurations (Fig. 10). The FE-SEM images display the formation of uniform and compact layers over the whole surface with very small grains barely visible for both the MgF2 film and CaF2 one grown from the [Ca(hfa)2·diglyme·H2O] precursors. The homogeneity of the fluoride films is also confirmed by cross-sectional images, in which the estimated thickness is in the order of 750–800 nm in all cases. The surface of the film grown from the [Ca(hfa)2·triglyme] adduct, shown in Fig. 10c, is more structured and consists of smaller grains, but the film thickness is equivalent to that deposited with the [Ca(hfa)2·diglyme·H2O] source. Interestingly, the morphology presently observed is quite similar to the one recently found for lanthanide doped CaF2 thin films obtained at 450 °C on silicon using a reduced pressure MOCVD approach.45 This finding points to a direct correlation of the CaF2 film morphology with the kinetic growth process on silicon substrate for a given temperature range.
Finally, compositional characterization, through energy dispersive X-ray analysis (EDX), has been carried out on the MgF2 and CaF2 films in order to assess the compositional purity of the layers. In Fig. S9,† the EDX spectrum of the CaF2 film displays the presence of Ca Kα peak at 3.69 keV and F Kα peak at 0.68 keV. The peaks of Si Kα at 1.74 keV and O at 0.53 keV arise from the silicon substrate. Notably, the absence of the peak at 0.28 keV, due to the C Kα, excludes any carbon contamination. Analogously, the EDX spectrum of the MgF2 layer (Fig. S10†) shows the presence of the Mg Kα peak at 1.25 keV and F Kα peak. Also in this case, no C contamination is observed.
Discussion
Precursor nature is extremely central in chemical vapor deposition processes either CVD or ALD approaches. The latest ALD and spatial ALD techniques, based on sequential, self-saturating surface reactions, require the use of very volatile precursors,47 applicable also at atmospheric pressure, in particular in the case of the SALD.This requirement is crucial for the development of this method and may represent a limitation for the growth affirmation of the spatial ALD in specific applications to alkaline-earth containing films. The glyme adducts of the alkaline-earth metal hexafluoroacetylacetonate complexes are the most volatile, and thus appealing, precursors for chemical vapor phase processes under reduced pressure. Even though the characterizations of their thermal properties have been reported for some of these compounds, up to date only few studies have been reported on the evaluation of their vapor pressures, which are essential for applications in atmospheric pressure processes.
In particular, Tsymbarenko et al. devoted their attention to study the structures, thermal stability and volatility of Ca, Sr, and Ba hexafluoroacetylacetonates mixed ligand complexes with various polyethers.27 For these metal–organic adducts, the authors have investigated their volatility and thermal stability in the gas phase through mass spectrometry (MS) and density functional theory (DFT) calculations.27
Starting from present thermogravimetric analyses, and as confirmed by the studies of Tsymbarenko et al.27 and Luo et al.,48 all the investigated compounds evaporate congruently. Based on these data, we discuss the possibility of using the Langmuir equation for the direct estimation of the vapor pressure and the enthalpy of vaporization for the principal alkaline-earth “second-generation” fluorinated β-diketonate precursors. This approach has been used for the first time by the group of Kunte et al.36 for the estimation of the vapor pressure of two distinct titanium metalorganic precursors using benzoic acid as a standard.
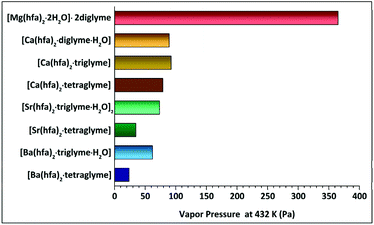
The presently reported Langmuir procedure has allowed to easily estimate the vapor pressure and vaporization enthalpy of alkaline-earth metalorganic compounds. The slope of ln![[thin space (1/6-em)]](https://www.rsc.org/images/entities/char_2009.gif) P versus 1/T, with a regression coefficient close to unity, has been used to estimate the enthalpy of vaporization. The vapor pressure at 423 K has then been extrapolated. The trend as a function of the type of ligands coordinating one single metal centre for each set of alkaline-earth precursors is reported in Table 2 and schematized in Fig. 11.
P versus 1/T, with a regression coefficient close to unity, has been used to estimate the enthalpy of vaporization. The vapor pressure at 423 K has then been extrapolated. The trend as a function of the type of ligands coordinating one single metal centre for each set of alkaline-earth precursors is reported in Table 2 and schematized in Fig. 11.
| Compound | Temperature range (K) | ΔH (kJ mol−1) | Estimated V. pressure (Pa) at 423 K | Effective ionic radius for 6-fold coordination (Å) | Observed coordination number of the M2+ ion |
|---|---|---|---|---|---|
| [Mg(hfa)2·2H2O]·2diglyme | 402–461 | 55.1 ± 0.3 | 365.1 | 0.57 | 6 |
| [Ca(hfa)2·diglyme·H2O] | 423–503 | 64.4 ± 0.2 | 89.2 | 1.00 | 8 |
| [Ca(hfa)2·triglyme] | 423–529 | 68.6 ± 0.2 | 92.4 | ||
| [Ca(hfa)2·tetraglyme] | 433–523 | 61.9 ± 0.2 | 78.9 | ||
| [Sr(hfa)2·triglyme·H2O]2 | 466–528 | 60.4 ± 0.4 | 73.4 | 1.18 | 9 |
| [Sr(hfa)2·tetraglyme] | 454–545 | 74.3 ± 0.1 | 34.8 | ||
| [Ba(hfa)2·triglyme·H2O] | 438–542 | 53.6 ± 0.3 | 61.9 | 1.35 | 9 |
| [Ba(hfa)2·tetraglyme] | 432–553 | 82.1 ± 0.1 | 23.7 |
It is interesting to comment on the trend observed for the vapor pressure and vaporization enthalpy of the different complexes. (a) A decrease in the vapor pressure of the different complexes has been observed on going from Mg2+ to Ba2+ ion. This trend parallels the larger ion dimension and consequently the higher coordination number on going from Mg2+ (optimal coordination is 6) to Ba2+, which needs at least a 9-coordination. To compare the various alkaline-earth ion dimensions, the Shannon 6-coordinated ionic radii,49 and related effective coordination in the most stable complexes, are reported in Table 2. (b) Related to the vapor pressure values, it is the variation of the vaporization enthalpy observed on going from the lightest to the heaviest among the considered AE metal complexes. These values are slightly smaller than those previously reported by Tsymbarenko et al.:27e.g. 61.9 ± 0.2 vs. 131.7 ± 1.8 (kJ mol−1), 74.3 ± 0.1 vs. 138.5 ± 8.9 (kJ mol−1), 82.1 ± 0.1 vs. 140.9 ± 4.5 (kJ mol−1), for the [Ca(hfa)2·tetraglyme] [Sr(hfa)2·tetraglyme] and [Ba(hfa)2·tetraglyme], respectively. Various factors may be responsible for these findings: (i) significantly different temperature ranges are used in the present and previous evaluation of ΔH values; (ii) completely different approaches have been used to determine these quantities. Significant differences in the ΔHs have also been observed for other adducts, for example for the Ba(β-diket)2·18-crown-6 compounds due to the different Knudsen and static method applied.50 (c) Polyether plays a key role on the vapor pressure of the complexes since the vapor pressure value decreases on increasing the polyether length. Thus, for a given AE ion, the tetraglyme adduct is usually the least volatile with respect to the triglyme or diglyme ones. In this context, a comment deserves the trend observed for the “Ca(hfa)2glyme” vaporization enthalpies and the relationship between vaporization enthalpies and vapor pressures. This trend may be explained considering that in the Clausius–Clapeyron equation (eqn (4)), in addition to the slope, which determines the ΔH, also the intercept should be considered. In addition, vapor pressures of compounds, being derived from eqn (1), are strictly dependent not only on their vaporization rate dm/dt, but also on their molecular mass.
Finally, the potentiality of the most volatile compounds in ALD and SALD processes may be envisaged considering the promising results obtained for the fluorinated β-diketonate Mg and Ca alkaline-earth adducts as single-source precursors in AP-MOCVD processes of binary fluoride thin films. In addition, this type of precursors would represent a great advantage for the ALD of AE metal fluorides since most of the actual reports use an independent source for fluorine, such as TiF4 and TaF5.51
Conclusions
In this paper, a comprehensive study on the thermal properties under atmospheric pressure of a class of well-known alkaline-earth metal adducts of the “M(hfa)2·glyme” is reported. These compounds have been widely applied as single-source precursors for the deposition of fluoride phases through MOCVD under reduced pressure. The present study assesses the potentiality of these adducts as single-source precursors for atmospheric pressure vapor phase processes, either AP-MOCVD or spatial ALD. A facile route has been optimized to calculate the vapor pressure and enthalpy of vaporization of several alkaline-earth fluorinated β-diketonate polyether adducts using the Langmuir equation. The estimated vapor pressure values for the alkaline-earth precursor decrease as the ionic radius rises (from Mg to Ba), according to experimental data. Based on these findings, the diglyme adduct of magnesium and the diglyme and triglyme adducts of calcium hexafluoroacetylacetonate, have been applied and evaluated as precursors for atmospheric-pressure MOCVD of homogenous and pure polycrystalline MgF2 and CaF2 thin films. This method is a facile and viable route to assess suitability of a given compound as precursor for AP-MOCVD or SALD deposition methods based on their vapor pressure values.Conflicts of interest
There are no conflicts to declare.Acknowledgements
The authors thank the University of Catania for financial support within the PIACERI research program UNICT 2020-22 Linea 2. The authors thank Bionanotech Research and Innovation Tower (BRIT) laboratory of University of Catania (Grant no. PONa3_00136 financed by the Italian Ministry for Education, University and Research, MIUR) for the diffractometer facility.References
- Chemical Vapour Deposition: Precursors, Processes and Applications, ed. A. C. Jones and M. L. Hitchman, Royal Society of Chemistry Publishing, London, 2009 Search PubMed.
- M. Leskela and M. Ritala, Angew. Chem., Int. Ed., 2003, 42, 5548–5554 CrossRef CAS PubMed.
- R. L. Puurunen, J. Appl. Phys., 2005, 97, 121301 CrossRef.
- M. A. Malik and P. O'Brien, Basic chemistry of CVD and ALD precursors in Chemical Vapour Deposition: Precursors, Processes and Applications, ed. A. C. Jones and M. L. Hitchman, Royal Society of Chemistry Publishing, London, 2009, pp. 207–271 Search PubMed.
- R. C. Mehrotra, R. Bohra and D. P. Gaur, Metal β-diketonates and allied derivatives, Academic Press, London, New York, 1978 Search PubMed.
- A. R. Barron and W. S. Rees, Adv. Mater. Opt. Electron., 1993, 2, 271–288 CrossRef CAS.
- A. C. Jones, H. C. Aspinall and P. R. Chalker, Surf. Coat. Technol., 2007, 201, 9046–9054 CrossRef CAS.
- R. G. Toro, D. M. R. Fiorito, M. E. Fragalà, A. Barbucci, A. P. Carpanese and G. Malandrino, Mater. Chem. Phys., 2010, 124, 1015 CrossRef CAS.
- A. L. Pellegrino, G. Lucchini, A. Speghini and G. Malandrino, J. Mater. Res., 2020, 35, 2950–2966 CrossRef CAS.
- G. G. Condorelli, G. Malandrino and I. L. Fragala, Coord. Chem. Rev., 2007, 251, 1931–1950 CrossRef CAS and references therein.
- G. Malandrino and I. L. Fragala, Coord. Chem. Rev., 2006, 250, 1605–1620 CrossRef CAS and references therein.
- G. Malandrino, D. S. Richeson, T. J. Marks, D. C. DeGroot, J. L. Schindler and C. R. Kannewurf, Appl. Phys. Lett., 1991, 58, 182–184 CrossRef CAS.
- G. Malandrino, L. M. S. Perdicaro, G. Condorelli, I. L. Fragalà, A. Cassinese and M. Barra, J. Mater. Chem., 2005, 15, 4718 RSC.
- M. R. Catalano, G. Cucinotta, E. Schilirò, M. Mannini, A. Caneschi, R. Lo Nigro, E. Smecca, G. Condorelli and G. Malandrino, ChemistryOpen, 2015, 4, 523 CrossRef CAS PubMed.
- A. L. Pellegrino, P. Cortelletti, M. Pedroni, A. Speghini and G. Malandrino, Adv. Mater. Interfaces, 2017, 4, 1700245 CrossRef.
- D. Munoz-Rojas and J. MacManus-Driscoll, Mater. Horiz., 2014, 1, 314–320 RSC.
- P. Poodt, D. C. Cameron, E. Dickey, S. M. George, V. Kuznetsov, G. N. Parsons, F. Roozeboom, G. Sundaram and A. Vermeer, J. Vac. Sci. Technol., A, 2012, 30, 010802 CrossRef.
- G. Malandrino, F. Castelli and I. Fragalà, Inorg. Chim. Acta, 1994, 224, 203–207 CrossRef CAS.
- M. E. Fragalà, R. G. Toro, P. Rossi, P. Dapporto and G. Malandrino, Chem. Mater., 2009, 21, 2062–2069 CrossRef.
- C. L. Yaws and M. A. Satyro, Chapter 2 - The Yaws Handbook of Vapor Pressure, Gulf Professional Publishing, 2nd edn, 2015, pp. 315–322 Search PubMed.
- K. Timmer, K. I. M. A. Spee, A. Mackor, H. A. Meinema, A. L. Spek and P. van der Sluis, Inorg. Chim. Acta, 1991, 190, 109–117 CrossRef CAS.
- R. Gardiner, D. W. Brown, P. S. Kirlin and A. L. Rheingold, Chem. Mater., 1991, 3, 1053–1059 CrossRef CAS.
- A. D. Berry, R. T. Holm, M. Fatemi and D. K. Gaskill, J. Mater. Res., 1990, 5, 1169–1175 CrossRef CAS.
- N. P. Kuzmina, D. M. Tsymbarenko, I. E. Korsakov, Z. A. Starikova, K. A. Lysenko, O. V. Boytsova, A. V. Mironov, I. P. Malkerova and A. S. Alikhanyan, Polyhedron, 2008, 27, 2811–2818 CrossRef CAS.
- S. R. Drake, S. A. S. Miller and D. J. Williams, Inorg. Chem., 1993, 32, 3227–3235 CrossRef CAS.
- P. van der Sluis, A. L. Spek, K. Timmer and H. A. Meinema, Acta Crystallogr., Sect. C: Cryst. Struct. Commun., 1990, 46, 1741–1743 CrossRef.
- D. M. Tsymbarenko, A. M. Makarevich, A. E. Shchukin, I. P. Malkerova, A. S. Alikhanyan and N. P. Kuzmina, Polyhedron, 2017, 134, 246–256 CrossRef CAS.
- D. J. Otway and W. S. Rees Jr., Coord. Chem. Rev., 2000, 210, 279–328 CrossRef CAS and references therein.
- J. A. Belot, D. A. Neumayer, C. J. Reedy, D. B. Studebaker, B. J. Hinds, C. L. Stern and T. J. Marks, Chem. Mater., 1997, 9, 1638–1648 CrossRef CAS.
- G. Wilkinson, R. D. Gillard and J. A. McCleverty, Comprehensive coordination chemistry: The synthesis, reactions, properties and applications of coordination compounds V3 Main group and early transition elements, Pergamon Press, United Kingdom, 1987 Search PubMed.
- I. Langmuir, Phys. Rev., 1913, 2, 329–342 CrossRef.
- D. M. Price, S. Bashir and P. R. Derrick, Thermochim. Acta, 1999, 327, 167–171 CrossRef CAS.
- C. C. Antoine, Tensions des vapeurs; nouvelle relation entre les tensions et les tempè, Comptes Rendus des Séances de l'Académie des Sciences, 1888, p. 107 Search PubMed.
- G. W. Thomson, Chem. Rev., 1946, 38(1), 1–39 CrossRef CAS PubMed.
- O. L. I. Brown, J. Chem. Educ., 1951, 28(8), 428 CrossRef CAS.
- G. V. Kunte, S. A. Shivashankar and A. M. Umarji, Meas. Sci. Technol., 2008, 19, 25704 CrossRef.
- K. Chatterjee, D. Dollimore and K. A. Alexander, Int. J. Pharm., 2001, 213, 31–44 CrossRef CAS PubMed.
- D. M. Price, Thermochim. Acta, 2001, 367–368, 253–262 CrossRef CAS.
- S. F. Wright, P. Phang, D. Dollimore and K. S. Alexander, Thermochim. Acta, 2002, 392–393, 251–257 CrossRef CAS.
- D. Menon, D. Dollimore and K. S. Alexander, Thermochim. Acta, 2002, 392–393, 237–241 CrossRef CAS.
- K. Chatterjee, A. Hazra, D. Dollimore and K. S. Alexander, Eur. J. Pharm. Biopharm., 2002, 54, 171–180 CrossRef CAS PubMed.
- A. M. Makarevich, A. S. Shchukin, A. V. Markelov, S. V. Samoilenkov, P. P. Semyannikov and N. P. Kuzmina, ECS Trans., 2009, 25(8), 525 CrossRef CAS.
- C. Wang, S. Yang and Y. Chen, R. Soc. Open Sci., 2019, 6, 181193 CrossRef CAS PubMed.
- A. M. Makarevich, P. P. Semyannikov and N. P. Kuzmina, Russ. J. Inorg. Chem., 2010, 55, 1940 CrossRef CAS.
- A. L. Pellegrino, S. La Manna, A. Bartasyte, P. Cortelletti, G. Lucchini, A. Speghini and G. Malandrino, J. Mater. Chem. C, 2020, 8, 3865 RSC.
- M. E. Fragala, R. G. Toro, S. Privitera and G. Malandrino, Chem. Vap. Deposition, 2011, 17, 80–87 CrossRef CAS.
- M. Putkonen, Precursors for ALD processes, in Atomic Layer Deposition of Nanostructured Materials, ed. N. Pinna and M. Knez, Wiley-VCH Verlag GmbH & Co. KGaA, Weinheim, Germany, 2012, pp. 41–60 Search PubMed.
- L. Luo, Y. Kuzminykh, M. R. Catalano, G. Malandrino and P. Hoffmann, ECS Trans., 2009, 25(8), 173–179 CrossRef CAS.
- R. D. Shannon, Acta Crystallogr., Sect. A: Cryst. Phys., Diffr., Theor. Gen. Crystallogr., 1976, 32, 751–767 CrossRef.
- T. S. Pochekutova, V. K. Khamylov, G. K. Fukin, B. I. Petrov, A. S. Shavyrin, A. V. Arapova, N. M. Lazarev, V. I. Faerman, T. I. Kulikov, E. V. Baranov and N. M. Khamaletdinova, Polyhedron, 2000, 177, 114263 CrossRef.
- M. Mäntymäki, M. Ritala and M. Leskelä, Coatings, 2018, 8, 277 CrossRef and reference therein.
Footnote |
| † Electronic supplementary information (ESI) available. See DOI: https://doi.org/10.1039/d2dt00479h |
| This journal is © The Royal Society of Chemistry 2022 |

