Halide–propene complexes: validated DSD-PBEP86-D3BJ calculations and photoelectron spectroscopy†
Peter D.
Watson
 ac,
Timothy R.
Corkish
 a,
Christian T.
Haakansson
 a,
Allan J.
McKinley
 a and
Duncan A.
Wild
 *ab
*ab
aSchool of Molecular Sciences, The University of Western Australia, Crawley, 6009, Western Australia, Australia. E-mail: duncan.wild@uwa.edu.au; Tel: +61(8) 6488 3178
bSchool of Science, Edith Cowan University, Joondalup, 6027, Western Australia, Australia
cDepartment of Chemistry, Physical and Theoretical Chemistry Laboratory, University of Oxford, South Parks Road, Oxford, OX1 3QZ, UK
First published on 15th October 2022
Abstract
Anion photoelectron spectroscopy has been used to determine the electron binding energies of the X−⋯C3H6 (X = Cl, Br, I) complexes. To complement the experimental spectra the DSD-PBEP86-D3BJ functional has been employed, following comparison with previously calculated halide/halogen-molecule van der Waals complexes. To validate the functional, comparison between the complex geometries and vertical detachment energies with both experimental and CCSD(T)/CBS data for a suite of halide–molecule complexes is also made. PES spectra determine the electron binding energies as 3.89 eV and 4.00 eV, 3.59 eV and 4.01 eV, and 3.26 eV and 4.20 eV for transitions to perturbed 2P states of the chlorine, bromine and iodine complexes respectively. Two contributing structures resulting in the photoelectron spectrum are those where the halide is coordinated by two hydrogens, each from a terminal carbon in C3H6, and when bifurcating the C![[double bond, length as m-dash]](https://www.rsc.org/images/entities/char_e001.gif) C bond. These complexes are distinct from the corresponding halide–ethene complexes and represent potential entry pathways to haloakyl radical formation in atmospheric and extraterrestrial environments.
C bond. These complexes are distinct from the corresponding halide–ethene complexes and represent potential entry pathways to haloakyl radical formation in atmospheric and extraterrestrial environments.
1 Introduction
Propene represents an important atmospheric, industrial, and extraterrestrial hydrocarbon as an extension of the chemistry displayed by ethene and an intermediate in reactions to produce both longer and substituted hydrocarbons. Industrially, propene undergoes polymerisation to form polypropylene, a common plastic with U.S production capacity of 7.8 T g year−1. Production of polypropylene relies on a Ziegler-Natta catalyst and can be performed in the form of slurry or the gas-phase.1 Taking the example of gas-phase polymerisation, a minor route in global production, heterogeneous co-catalysts TiCl4 and MgCl2 are used, presenting the potential for chlorine–propene complex formation as catalyst degradation would likely lead to the release of chlorine radicals into the reaction vessel.2The detection of propene in both the atmospheres of Titan and the interstellar medium (ISM) in the Taurus Molecular Cloud (TMC-1) place it as an important intermediate in a bottom-up approach to the formation of long-chain hydrocarbons in extraterrestrial environments (see eqn (1)–(3)).3,4 The basis of this process is the bimolecular reaction of the methylidyne radical (˙CH) with ethane to produce propene and atomic hydrogen with further reactions building upon the size of the carbon chain.5 As an example, the methylidyne radical (˙CH) has been investigated spectroscopically using VUV synchrotron photoionisation mass spectrometry, producing a mixture of 1,3-butadiene, 1,2-butadiene and 1-butyne as photolysis products. The ethynyl radical (˙C2H) participates in similar processes of hydrocarbon growth and has been investigated extensively, particularly by pulsed Laval nozzle experiments.6–8
| ˙CH + C2H6 → C3H6 + ˙H | (1a) |
| ˙CH + C3H6 → 1,3-C4H6 + ˙H | (1b) |
| ˙C2H + C4H6 → c-C6H6 + ˙H | (1c) |
In the troposphere, propene undergoes oxidation via two primary mechanisms. Models of smog chambers suggest that reaction with hydroxy radicals (HO˙) and O2 leads to the production of aldehydes (methanal and ethanal) and hydroperoxyl (HO2˙).9 Atmospheric models determining the fate of volatile organic compounds (VOC) indicate direct reaction with ozone again leads to production of two primary aldehydes but also Criegee biradicals as demonstrated by:10
 | (2a) |
| →C˙HOO˙ + CH3CHO | (2b) |
These reactions occur in the troposphere, and given ideal conditions, the latter can lead to net ozone production,10 however, the impact of halogen radicals in this region ultimately results in ozone depletion11via reactions with bromine radicals. While the largest flux of propene (and other VOCs) into the atmosphere is from the chemical industry and petroleum sources (32–62 T g year−1) both propene and bromine are readily sourced from the oceans into the marine boundary layer (MBL), albeit in much lower quantities (propene: 0.5 T g year−1).12 Given the free-radical addition to alkenes, the interaction between a halogen radical and propene in the van der Waals (vdW) region could activate propene to reaction with hydroxyl radicals and oxygen, or ozone as per the reactions suggested previously (eqn (2a)).
Similarly the radical intermediates of the ˙OH + C3H6 reaction have been studied via (2+1) REMPI spectroscopy, utilising 193 nm radiation to produce the photolysis products (˙C3H6OH).13 At the time of writing, halogen–propene complexes have scarcely been studied, with the only published work on propene complexes believed to be that of Xu14 and Peebles15,16 who recorded the rotational spectrum and modelled the propene–SO2 complex respectively. Xu14 reports a structure of the propene–SO2 complex where the propene carbon backbone lies parallel with the plane of the SO2. This reflects a similar conformation to that of the halogen–acetylene complexes and may therefore be indicative of dispersion interaction.17 A combination of distributed multipole analysis (DMA) and atom–atom potentials were modelled by Peebles and the resulting structures agree with the parallel plane conformation though different structures as to the rotation of the SO2 molecule in this plane result.15,16 Considering that this work is rather inexpensive computationally, with DMA being completed using only Hartree–Fock theory and 6-31G** basis sets, it is difficult to definitively assign the structure, however these structures are not significantly different from those determined from experiment.
Given the role that halogen radical chemistry plays atmospherically, and that halogen–propene vdW complexes represent model systems for these pre-reaction adducts, their structure and stability warrants further exploration. This paper features two different studies of halide–molecule complexes. The first applies a double-hybrid functional to previously studies halide–molecule systems in order to validate the DSD-PBEP86-D3BJ functional against previous experimental and ab initio methods. This is briefly discussed in the Computational Methods (Section 2.2) to rationalise the functionals selection. The functional is then employed in the latter study, which investigates the substituent effects present in larger unsaturated hydrocarbons on interactions with halides and halogens by comparison to previous halide–ethene complexes using anion photoelectron spectroscopy (PES).
2 Methods
2.1 Experimental methods
Halide–propene gas mixtures were prepared by exposing halide sources to the evacuated gas mixing station followed by injection of 50 kPa of propene (Tradeflame, TF/Ultra Gas MAPP, 400 g). The duration of exposure is governed by the vapour pressure of the CCl4, CH2Br2 and CH3I. To control the addition of CH3I, the sample was cooled in an ice-salt water bath to approximately −11 °C. The gas mixture is then made up to an operational backing pressure of 450 kPa with argon. As the atomic mass of C3H6 is 42 amu, the 37Cl−⋯C3H6 complex is expected to have a m/z value of approximately 79. However due to the isotopic abundances of Cl, the 37Cl peak is still preferable for performing PES due to the increased ion signal. To reduce the impact of residual 79Br contaminating the complex peak in the mass spectrum, bromide experiments were conducted first, followed by iodide and then chloride spectra. As recently concluded spectra had also been of the bromide complexes, the likelihood of contaminant CH2Br2 being present remained significant, precluding experiments from commencing with chloride spectra. This contaminating effect was sought to be reduced further in each set of experiments by repeatedly flushing the gas mixing station with a backing pressure (450 kPa) of argon, however trace CH2Br2 was purposely not eliminated entirely as spectra of 81Br− were also used in calibration.The spectrometer in the Wild Group has been described in detail previously, with typical operating parameters of the time-of-flight mass spectrometer (TOF-MS) including a beam energy of 1500 eV.18,19 Mass spectra were calibrated using bare halide peaks identified by their approximate time-of-flight (TOF) timing and isotopic abundances, where available multiple halide spectral features were used for this calibration and in the case of iodide experiments the inclusion of the bromide-79,81 doublet was necessary. Similarly, PES spectra of bare halides were recorded and used to calibrate PES spectra of the associated complexes. For each of the chloride complexes, the photoelectron peak was fitted by a pair of gaussians with separation constrained to the experimental spin–orbit splitting of bare Cl.20 This was used for the purpose of verification of the recorded 2P3/2,1/2 Cl ← 1S Cl− transition, however the respective bromide and iodide spectra formed the calibration of the chloride-propene spectra. To present the photoelectron intensities with respect to electron kinetic energy (EKE), a Jacobi tranfsorm (I × t3) was also applied prior to normalisation.
2.2 Computational methods
To test the applicability of the DSD-PBEP86-D3BJ functional for the purposes used in this work, a number of representative halide–molecule complexes were optimised and compared to previous computational and experimental studies.21,22 The complexes selected are the halide complexes with O2, N2, acetylene, ethene and both the syn- and anti-formic acid isomers.17,20,23–27 As these complexes have been investigated previously, starting geometries were chosen from those already optimised using ab initio methods rather than a traditional search of conformer space. These were then reoptimised using the DSD-PBEP86-D3BJ functional with Ahlrich's def2QZVP and Dunnings aug-cc-pVnZ basis sets.28–30 For Br and I, pseudopotentials were included in the Dunning basis sets (i.e. aug-cc-pVnZ-PP) and additional diffuse functions were included for the Cl basis set.31,32 Collectively these basis sets are denoted here as AVnZ (n = T,Q). For the def2QZVP basis set, a pseudopotenial is included for I but notably Br is an all-electron basis set. Optimised structures were then confirmed by harmonic frequency calculations with all calculations completed using Gaussian 09.33 Associated complex dissociation energy (D0) values are then determined for both the anion and neutral minima by comparison of the corresponding energies of the monomer species. Vertical detachment energies (VDE)s for these complexes were calculated similarly to previous ab initio methods, by calculating the energy of the neutral complex with the geometry of the anion. The energy difference between the neutral single-point energy and the anion minima then represents detachment to the barycentre of the neutral electronic state. This energy was then artificially split into the two states analogous to the 2P states of the halogen according to the spin–orbit coupling constant and given by with A = −588.23 cm−1, −2456.83 cm−1 and −5068.77 cm−1 for Cl, Br and I respectively.34–36 The calculated VDE values are also corrected for differences between the computational methods and experimental 2P3/2,1/2 ← 1S VDEs. This is done by calculating the VDE of the corresponding bare halide for a given method and basis set and then determining an empirical correction from the calculated to the experimental value from literature (see Table 1).37–39 Subsequently this empirical correction is applied to the complex VDEs, and typically produce smaller corrections with improvements to the quality of computational method and with increasing basis set size (i.e. ShiftW1w(I−) = −0.006 eV).40,41 A summary of the resulting corrected and shifted VDEs is provided in Table 3 with all cartesian coordinates, geometries, VDEs, and harmonic frequencies provided in the ESI.†
| E DFT | E DH−DFT | E corr | VDE | VDE2P3/2 | VDE2P1/2 | VDEexp | Shift | ||
|---|---|---|---|---|---|---|---|---|---|
| Cl− | def2QZVP | −459.9780761 | 3.498 | 3.462 | 3.571 | 3.613 | 0.151 | ||
| AVTZ | −459.8651033 | −459.9695313 | −0.1044280 | 3.566 | 3.530 | 3.639 | 0.083 | ||
| AVQZ | −459.8679704 | −459.9821509 | −0.1141805 | 3.609 | 3.573 | 3.682 | 0.040 | ||
| CBS | −459.9892676 | −0.1212972 | 3.645 | 3.609 | 3.718 | 0.004 | |||
| Cl | def2QZVP | −459.8495275 | |||||||
| AVTZ | −459.7559396 | −459.8384744 | −0.0825348 | ||||||
| AVQZ | −459.7590777 | −459.8495294 | −0.0904517 | ||||||
| CBS | −459.8553066 | −0.0962289 | |||||||
| Br− | def2QZVP | −2573.4537545 | 3.384 | 3.232 | 3.689 | 3.364 | 0.132 | ||
| AVTZ | −416.1875885 | −416.3037678 | −0.1161793 | 3.396 | 3.244 | 3.701 | 0.120 | ||
| AVQZ | −416.1888795 | −416.3403815 | −0.1515020 | 3.443 | 3.291 | 3.748 | 0.073 | ||
| CBS | −416.3661575 | −0.1772780 | 3.481 | 3.329 | 3.786 | 0.035 | |||
| Br | def2QZVP | −2573.3294072 | |||||||
| AVTZ | −416.0818963 | −416.1789782 | −0.0970819 | ||||||
| AVQZ | −416.0833295 | −416.2138432 | −0.1305137 | ||||||
| CBS | −416.2382394 | −0.1549099 | |||||||
| I− | def2TZVPD | −297.4673082 | 3.222 | 2.908 | 3.850 | 3.059 | 0.151 | ||
| def2QZVP | −297.5439463 | 3.232 | 2.918 | 3.860 | 0.141 | ||||
| AVTZ | −295.2455821 | −295.3511569 | −0.1055748 | 3.235 | 2.921 | 3.863 | 0.138 | ||
| AVQZ | −295.2460954 | −295.3884861 | −0.1423907 | 3.290 | 2.976 | 3.918 | 0.083 | ||
| CBS | −295.4153518 | −0.1692564 | 3.332 | 3.018 | 3.960 | 0.041 | |||
| I | def2TZVPD | −297.3488981 | |||||||
| def2QZVP | −297.4251586 | ||||||||
| AVTZ | −295.1432301 | −295.2322600 | −0.0890299 | ||||||
| AVQZ | −295.1438493 | −295.2675757 | −0.1237264 | ||||||
| CBS | −295.2928948 | −0.1490455 |
Included in Table 1, the DSD-PBEP86-D3BJ/AV(T,Q)Z energies are also extrapolated to the complete basis set limit using Helgaker's approach for completeness.42 The results of these benchmarking calculations are presented and discussed in further detail in Section 3.1, however in general those values calculated using Dunning basis sets were more suitable. Considering the comparative computational cost of the halide–propene calculations, and that the employed calibration protocol to experimental halide photodetachment corrected for deficiencies in the basis set, the smaller basis sets (def2QZVP and AVTZ) were selected for exploratory work.
3 Results and discussion
3.1 Benchmarking DH-DFT methods
All DSD-PBEP86-D3BJ structures are presented in the ESI.† It should be noted that the structures presented correspond to minima on their respective potential energy surfaces, however all the structures presented for the halide–oxygen complexes are determined to be transition states in all basis sets. The calculation of these complexes in particular have presented difficulties previously where less robust ab initio methods (i.e. MP2) fail to produce qualitatively correct structures. This was attributed to the multireference character of the system which can lead to spin contamination of the self-consistent field (SCF) wavefunction and erroneous exaggeration of the perturbative contributions.24 In X−⋯O2 these effects have also been attributed to higher order electrostatic contributions, particularly in anion complexes, where the appropriate bent anion structure is determined via inclusion of ion-quadrupole and ion-hexadecapole contributions. This can be addressed to a degree with robust coupled cluster methods and by use of analytic gradients as opposed to finite differences, however in benchmarking the double-hybrid functional here error superposition cannot be excluded without full decomposition of the respective energy contributions. Rather, the approach taken here is to alter the choice of basis set to best describe diffuse orbitals. Given that the original DSD-PBEP86-D3BJ functional has been parameterised to reproduce CCSD(T) electronic behaviour and optimised with Ahlrich's def2 basis sets, to avoid any systematic error in basis set design, a basis set from this family should also be chosen.21,22 However in the original design of Dunning basis sets additional augmentation functions are included to improve the dipole polarisabilities of group 18 elements, this also extends to group 17 halides.31 Similar improvements to the calculated polarisability of fluorine and other atomic polarisability have been shown in the design of Ahlrich def2 basis sets with additional diffuse functions (mean unsigned error of 0.5%).44
To test the dependence in this troublesome case, the XO2 complexes were reoptimised using both inclusion of diffuse functions in the Ahlrich's set but also additional diffuse functions in the already augmented Dunning basis set, denoted def2QZVPD and dAVTZ respectively (shown in Table 2).45 Using the MolSSI basis set exchange Python API module, additional diffuse functions to form the doubly augmented d-aug-cc-pV(T+d)Z basis set was also generated for chlorine and is provided in the ESI.†![[thin space (1/6-em)]](https://www.rsc.org/images/entities/char_2009.gif) 45,46 The choice of basis set alone however, seemed to not produce qualitatively accurate structures. Rather the optimisation procedure, in this case calculation of the nuclear Hessian at each step, produces these results. However, becoming overly reliant on a full harmonic calculation at each optimisation step quickly becomes impracticable with respect to the computational cost for larger systems.
45,46 The choice of basis set alone however, seemed to not produce qualitatively accurate structures. Rather the optimisation procedure, in this case calculation of the nuclear Hessian at each step, produces these results. However, becoming overly reliant on a full harmonic calculation at each optimisation step quickly becomes impracticable with respect to the computational cost for larger systems.
| Cl−⋯O2 Cs | ||||||
|---|---|---|---|---|---|---|
| AV(T+d)Z | dAVTZ | dAV(T+d)Z | def-2QZVP | def-2QZVPD | CCSD(T)/AVTZ | |
| # Primatives | 264 | 264 | 324 | 305 | 335 | |
| ω 1 | 119i | 119i | 119i | 126i | 15 | 14 |
| ω 2 | 55 | 56 | 56 | 57 | 57 | 58 |
| ω 3 | 1566 | 1566 | 1566 | 1587 | 1602 | 1591 |
| w. CalcAll | ||||
|---|---|---|---|---|
| ω 1 | 25 | 25 | 25 | 24 |
| ω 2 | 62 | 62 | 62 | 61 |
| ω 3 | 1580 | 1580 | 1580 | 1599 |
Overall, while users should be aware that the inclusion of additional diffuse functions to an Ahlrich basis set can yield qualitatively correct structures for troublesome cases, the number of primitives with respect to the Dunning bases here (albeit comparing the TZ and QZ quality bases), is not preferable due to the associated computational cost. Secondly, while outside the scope of this work, the intention of performing calculations on these geometries with AVTZ and AVQZ basis sets was that future energy decomposition (via methods such as SAPT2) could lead to the formulation of extrapolation protocols that would exceed the thermodynamic accuracy of the functionals.47 A number of existing protocols have been developed in recent years (including rudimentary methods demonstrated here in Table 1), however have been developed with cc-pVnZ bases.48–52
| Complex | VDEComp | VDEExp | VDEDH−DFT/AVQZ |
|---|---|---|---|
| a Experimental spectra were not deconvoluted into the two 2P peaks of the Cl in this case. | |||
| Cl−⋯O223,24 | 3.66|3.77 | 3.66|3.77 | 3.65|3.76 |
| Br−⋯O224 | 3.40|3.85 | 3.43|3.90 | 3.40|3.85 |
| I−⋯O224 | 3.09|4.03 | 3.12|4.06 | 3.09|4.03 |
| Cl−⋯N220 | 3.69|3.80 | 3.72|3.83 | 3.68|3.79 |
| Br−⋯N225 | 3.41|3.86 | 3.42|3.92 | 3.42|3.88 |
| I−⋯N225 | 3.08|4.02 | 3.07|3.92 | 3.10|4.04 |
| Cl−⋯HCCH17 | 4.04|4.15 | 4.1a | 4.13|4.24 |
| Br−⋯HCCH17 | 3.72|4.18 | 3.81|4.28 | 3.78|4.24 |
| I−⋯HCCH17 | 3.33|4.28 | 3.43|4.37 | 3.36|4.30 |
| Br−⋯C2H426 | 3.52|3.98 | 3.57|4.05 | 3.51|3.97 |
| I−⋯C2H426 | 3.17|4.11 | 3.19|4.12 | 3.17|4.11 |
| Cl−⋯ syn-HCOOH27 | 4.75|4.86 | 4.67|4.78 | 4.79|4.92 |
| Br−⋯ syn-HCOOH27 | 4.24|4.70 | 4.23|4.69 | 4.47|4.96 |
| I−⋯ syn-HCOOH27 | 3.69|4.63 | 3.75|4.68 | 3.71|4.68 |
| Cl−⋯ anti-HCOOH27 | 5.12|5.23 | 5.07|5.18 | 5.13|5.24 |
| Br−⋯ anti-HCOOH27 | 4.63|5.08 | 4.62|5.08 | 4.65|5.13 |
| I−⋯ anti-HCOOH27 | 4.07|5.01 | 4.08|5.05 | 4.07|5.03 |
Most notable is the encouraging performance of the double-hybrid in these cases. It is largely attributed to the calibration protocol used in determining detachment energies. While it is true that the shift values determined for Wnw methods are distinctly lower than those for DSD-PBEP86-D3BJ/AVQZ (0.002 eV and 0.083 eV respectively for I−), this difference would appear to remain consistent in both the bare halides and halide–molecule complexes.19 Similarly, the difference between the AVQZ VDEs and those from the AVTZ calculations is small (see Table 1). As the formation of halide–molecule complexes represent a perturbation to the electronic structure of the bare halide, calculated VDEs of these complexes may be corrected empirically in this manner to reliably reproduce experiment at a reduced cost. While Table 1 also includes CBS extrapolated VDEs with shifts of at most half of the corresponding AVQZ values, the magnitude of this shift is less important than whether it can be accounted for empirically. Given this, and the appreciable increase in computational cost for larger systems for ab initio methods, the exploratory study of halide–propene complexes will include use of the def2QZVP and AVTZ basis sets. This protocol may also have wider implementations as an effective strategy for determining such electronic transitions with minimal computational effort.
3.2 Halide–propene complexes
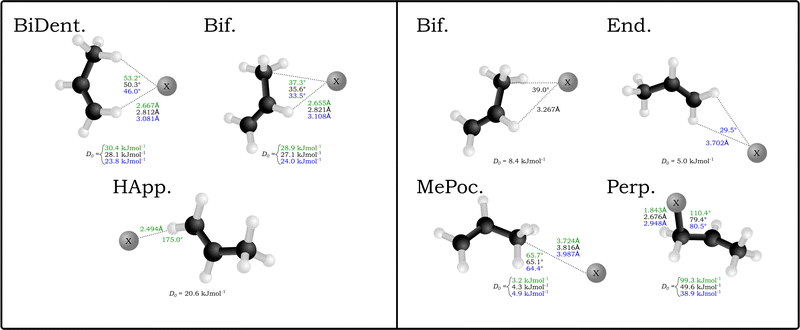
A similar number of neutral complexes have been optimised for the halogen–propene complexes (also in Fig. 1). While a selection of these are minima in the bromine and iodine complexes, namely the bifurcated (Bif) and methylidene group appended (End), the two stuctures that yield minima in all halogens are those where the halogen rests inside the methyl group pocket (MePoc) or interacts with the π-system of the propene (Perp). The MePoc structures are weakly bound (D0 = 3.2–4.9 kJ mol−1) as is expected for vdW complexes, and we note that the D0 halide trend established inverts for the corresponding halogens. This is attributed to the polarisability of the halogen atoms in each case, with those that are more diffuse and polarisable able to form stronger transient interactions. Those complexes where the halogen is interacting with the π-system are bound stronger than even the corresponding halide complexes. For the bromine and iodine complexes the D0 values are 49.6 kJ mol−1 and 38.9 kJ mol−1 respectively and the halogen is bound equidistant from the two unsaturated carbons. In the chlorine complex however there is a distinct contraction of the C–Cl distance to 1.843 Å and the ∠X−C![[double bond, length as m-dash]](https://www.rsc.org/images/entities/char_e001.gif) C angle increases to 110.4° as the chlorine binds with the terminal carbon forming a 1-chloropropyl radical. The associated D0 of this complex is significantly higher (99.3 kJ mol−1) and representative of an intermediate for the free-radical addition of chlorine to the alkene. This insertion agrees with previous theoretical studies in that gas-phase chlorine insertion preferentially occurs on the terminal carbon and that the Cl–C distance and ∠Cl–C–C angle correspond to literature MP2/AVDZ structures.53–55
C angle increases to 110.4° as the chlorine binds with the terminal carbon forming a 1-chloropropyl radical. The associated D0 of this complex is significantly higher (99.3 kJ mol−1) and representative of an intermediate for the free-radical addition of chlorine to the alkene. This insertion agrees with previous theoretical studies in that gas-phase chlorine insertion preferentially occurs on the terminal carbon and that the Cl–C distance and ∠Cl–C–C angle correspond to literature MP2/AVDZ structures.53–55
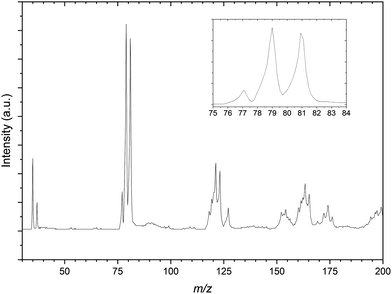
Fig. 2 is the mass spectrum produced from the CH2Br2:C3H6:Ar gas mixture. Immediately apparent are the two sets of calibration peaks corresponding to the 35,37Cl− and 79,81Br−anions. There is also a peak at 77 m/z which corresponds in mass to 35ClC3H6− is assigned to the formation of the 35Cl−⋯C3H6 complex. This complex formation also contributes to the now unequal intensities of the bromide peaks, highlighted in the inset of Fig. 2, as the corresponding 37Cl complex isobaric with the 79Br peak. While not the intended spectroscopic target in this gas mixture, PES spectra of the 77 m/z peak were recorded in case later experiments on the CCl4 gas mixture proved unsuccessful. These PES spectra are included in the ESI,† along with a corresponding deconvoluted Cl− PES spectrum.
A number of other structures are present in the mass spectrum in the regions of 115–125 m/z and 150–175 m/z. These peaks are taken to be a combination of several isotopic combinations of CCl4 and a similar contaminant CHCl3 from previous experiments. For the region of 115–125 m/z, combinations of CHCl3− is expected but not assigned as the vdW complex Cl−⋯˙CHCl2, would result in peaks with m/z values of 118, 120, 122 and 124 respectively. The 81Br−⋯C3H6 complex would be expected to have a m/z value of 123 and there is a peak in this structure that indeed does. As this peak appears sufficiently resolved, PES spectra of this mass peak would not be expected to contain other contaminant complexes, however when undertaking photodetachment within such a congested region this should be kept in mind.
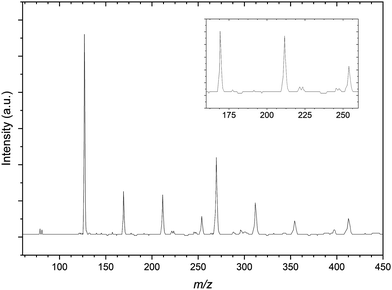
Comparatively the mass spectrum of the CH3I:C3H6:Ar gas mixture (Fig. 3) is not significantly congested. In the lower m/z range shown, the residual bromide anion peaks are still detected however the spectrum is now dominated by the iodide signal. These three peaks are used for a preliminary calibration that is then improved upon with inclusion of the next most intense signal at 269 m/z representing the I−⋯CH3I complex commonly seen in previous CH3I gas mixtures.56 The other peaks within the mass spectrum represent these two primary iodide sources solvated by propene molecules, with I−⋯(C3H6)n and I−⋯(CH3I)(C3H6)n (n = 1–3) present.
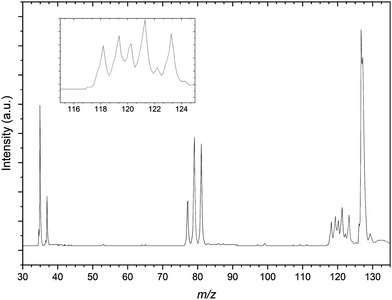
Finally the mass spectrum of the CCl4:C3H6:Ar gas mix is presented in Fig. 4. There is a congested 117–125 m/z region in the mass spectrum similar to that of Fig. 2 however this is significantly more resolved than for the previous spectrum. The resolution in this region in the presented spectrum does not adequately resolve these peaks individually. This is attributed predominantly due to the optimisation of space focussing of the TOF plates and einzel lenses for the calibration peaks. It is because of this resolution and congestion that a number of the peaks are assigned to complexes of bromide and argon as well as the previously noted Cl−⋯(C3H6)2 complexes. The m/z range presented is restricted here by comparison to the CH3I gas mixture however there are clear formation of both the 35Cl−⋯C3H6 and 81Br−⋯C3H6, distinct from contaminant isobaric species.
The photoelectron spectrum of the 77 m/z peak from Fig. 4 is shown in Fig. 5. The spectrum consists of a single broad feature that is attributed to transitions to the two perturbed 2P states of the chlorine. A pair of Gaussian functions is fitted to the spectrum with an R2 value of 0.9848. While the intensities of the fit are arbitrary and are normalised for the purposes of presentation here, the σ value from the fit is 85.6(4) meV. The determined electron stabilisation energy (Estab) values for the perturbed Cl−⋯C3H6 states are then 3.89(1) eV and 4.00(1) eV respectively. This is indicative of a relatively strong vdW interaction as the Estab of the chloride complex is 0.28 eV (27.1 kJ mol−1). Comparing this experimental stabilisation with that of the DSD-PBEP86-D3BJ/AVTZ values, the closest calculated VDE belongs to the bifurcated structure (Estab = 27.5 kJ mol−1). While it is tempting to therefore assign the detachment to this conformer, the resolution of the experiment is such that this is not conclusive. Given the similarity in the D0 values for the bidentate and bifurcated structures, the formation of the complex is likely driven by collision theory and the orientation of the monomers under complex formation. Similarly, considering the solid angle of the approaching chloride to the propene, the interaction between the formal charge of the halide and the π-system of the propene would likely redirect the incoming halide to regions of attractive interaction. While the third hydrogen-appended structure is present for the chloride complex, it is relatively more weakly bound, and would likely represent a meta-stable conformation.
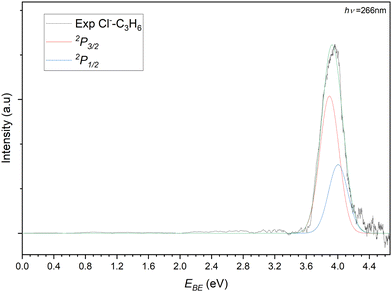 | ||
| Fig. 5 Photoelectron spectrum of the 77 m/z peak from Fig. 4. The spectrum is deconvoluted into two gaussians representing the perturbed 2P3/2 (red) and 2P3/2 (blue) states of the Cl−⋯C3H6 complex. | ||
In recording the bromide–propene spectrum, the 123 m/z peak in Fig. 2 was targeted. The resulting PES is shown in Fig. 6 and is attributed to the 81Br−⋯C3H6. These transitions are assigned similarly to the chloride complex and have EBE values of 3.59 eV and 4.01 eV for transitions to the perturbed 2P3/2 and 2P1/2 states of the bromine. The Estab of the complex is then determined to be 0.23 eV (22.2 kJ mol−1), highlighting the relative strength of the interaction in the chloride complex. The inset of Fig. 6 details the tailing features of the 2P1/2 peak. Typically these features, as the detector is less saturated and are closer to the photon energy, are more resolved than those of the 2P3/2 peak. There are two features present in this region with EBE values of 4.21 eV and 4.31 eV respectively. Within the main 2P1/2 peak there is some addtional structure with features at 4.02 eV and 4.08 eV. While less resolved, some structure is present within and shouldering the 2P3/2. These transitions correspond to 3.62 eV and 3.79 eV.
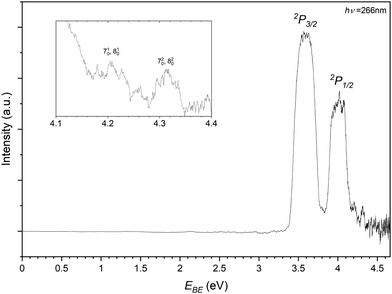 | ||
| Fig. 6 Photoelectron spectrum of the 123 m/z peak from Fig. 2 assigned to photodetachment to the perturbed 2P3/2 and 2P1/2 states of the Br−⋯C3H6 complex. | ||
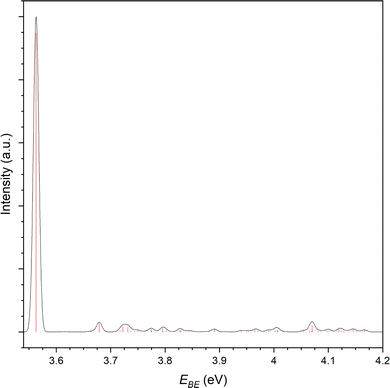
As the bromide–propene complex has calculated bifurcated minima structures in the anion and neutral, the PES can be modelled with ezSpectrum 3.0 and is presented in Fig. 7.57 Full Franck-Condon factors (FCFs) with Duschinsky rotations from these calculations are included in the ESI,† and as the spin–orbit states in this context only represent a change to the band origin, are only included for the 2P3/2 however the vibronic behaviour is the same in both cases as modelled here. While useful, it should be noted however that due to the strength of the non-covalent interactions, these modes are expected to be anharmonic and the calculated band structures may not resemble experimental spectra. The band origin, corresponding to the adiabatic detachment energy (ADE), is 3.563 eV with the next transition at 3.616 eV corresponding well to the experimental feature within the main 2P3/2 peak. This represents a 510 vibronic transition with the ω5 (424 cm−1) mode corresponding to a C–C–C bending mode of the propene. Notably the energy difference between this feature and the ADE corresponds to the same peak separation in the 2P1/2 peak, allowing for the assignment of these 4 features. The feature residing between the two perturbed 2P peaks has an EBE of 3.79 eV and agrees well with the modelled 720 and 820 overtones (EBE = 3.795 eV, 3.797 eV). Here the ω7 (936 cm−1) and ω8 (942 cm−1) modes represent the C–CH3 stretch and a number of coupled hydrogen bending modes. The same modes are assigned to this progression present in the 2P1/2 peak (4.21 eV and 4.31 eV). This vibrational structure suggests that transitions to the bifurcated neutral, importantly from the corresponding anion complex, are indeed present. It is not clear whether the same structure is present for the bidentate complex as no corresponding neutral was optimised. Given the neutral geometry would represent a highly vibrationally excited analogue of the bidentate complex the VDE, while not an experimentally observable quantity, would then likely correspond to a potentially unbound excited state. Similarly to the chloride complex, it is expected that both complexes are observed experimentally and cannot be distinguished at the current resolution.
Finally the iodide–propene complex PES is recorded by photodetachment of the 169 m/z peak in Fig. 3 and shown in Fig. 8. As with the previous PES spectra for the chloride and bromide complexes, the spectrum features two main peaks representing detachment to the perturbed 2P states of the iodine in an I−⋯C3H6 complex. The EBE of these peaks are determined to be 3.26 eV and 4.20 eV, equating to an Estab value of 0.20 eV (19.4 kJ mol−1). In the higher EBE region from the 2P1/2 peak similar vibrational structure can be seen to that of the bromide complex. Two bands are determined with one having EBE values of 4.35, 4.40, 4.45 and 4.50 eV (ΔEBE = 0.05 eV = 403 cm−1) corresponding to a progression in the C–C–C bend (ω5 = 420 cm−1). The other band is only determined with two peaks 4.47 and 4.52 eV and is assigned to a combination band of the bending mode and a C–C–C internal twisting mode (ω3 = 160 cm−1). Both transitions represent transitions to the complex where the halide is interacting with the π-system perpendicularly to the plane of the propene.
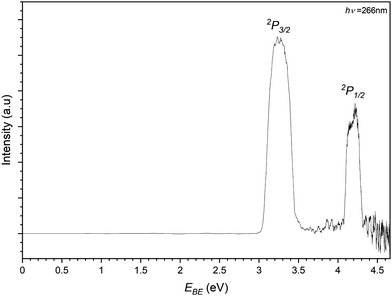 | ||
| Fig. 8 Photoelectron spectrum of the 169 m/z peak from Fig. 3 assigned to photodetachment to the perturbed 2P3/2 and 2P1/2 states of the I−⋯C3H6 complex. | ||
Collectively, the halide–propene complexes are bound by the electrostatic interaction, with the relatively strong D0 values in each case dominated by the anion interaction. Moreover, the respective charge density of the anion correlates with the strength of the interaction. This is reflected by the Estab values of 27.1 kJ mol−1, 22.2 kJ mol−1 and 19.4 kJ mol−1 for the Cl−, Br− and I−⋯C3H6 respectively. In comparing the bidentate and bifurcated conformers of each of the halide complexes, the Estab values indicate that those halides that are larger (Br, I), are sterically unfavoured in residing in the interacting regions when compared to the chloride complexes. The vibrational progressions present in the iodide and bromide complexes suggest that detachment from the bound anions, of which both the bifurcated and bidentate conformers are most likely, to a vibrationally excited region of the neutral. Given that the most stable neutral complexes are those where the halogen interacts with the π-system reminiscent of a free-radical addition to the alkene, detachment to these states may serve to lock the halide in the vdW region prior to initiation. Here the use of anion PES allows for photodetachment to regions of the neutral potential energy surface that may not be typically accessible in neutral spectroscopy.
These neutral interactions can also be compared to those of previously studied halide-alkene systems, namely the halide–ethene complexes.26 In these complexes, where the interaction dominated by the perturbation of the π-system, the strength of interaction is lower than when a purely hydrogen bonding environment is available. The Estab values for the halide–ethene complexes are 0.21 eV (19.5 kJ mol−1) and 0.13 eV (12.6 kJ mol−1) for bromide and iodide respectively. The stability of the bromide complexes is not dissimilar, while there is a significant stabilising effect when increasing the length of the alkene in the iodide complexes. Again it is expected that the interaction is balanced by the charge density of the anion and its size with respect to the physical interacting region.
4 Conclusions
To summarise, halide–propene complexes have been produced in the gas-phase and their photoelectron spectra are presented. The experimental EBE values, representing transitions to perturbed 2P states of the halogen, are 3.89 eV and 4.00 eV, 3.59 eV and 4.01 eV, and 3.26 eV and 4.20 eV for Cl−, Br− and I− complexes respectively. DSD-PBEP86-D3BJ/AVTZ calculations have also been completed to determine structures of a number of anion and neutral complexes. To validate the double-hybrid for use in these cases, a suite of calculations were also completed for comparison with previously studied halide–molecule complexes. These generally showed good agreement with previous experiments however in troublesome cases, use of additional diffuse functions in an Ahlrich def2QZVPD basis set was the only basis set to yield qualitatively correct harmonic frequencies. With all other basis sets, calculating second derivatives at each optimisation step was required. Inclusion of an empirical correction derived from the computational and experimental VDE of the bare halides yields complex VDEs in excellent agreement with previous experiments and values comparable to CCSD(T)/CBS. Each of the calculated halide–propene structures correspond to photodetachment from either a bidentate or bifurcated structure where the interaction is dominated by the electrostatics interaction of the anion and hydrogen atoms. Given the energy resolution of the PES spectrometer, the two conformers cannot be distinguished however vibrational structure in the Br−⋯C3H6 spectrum indicates that the bifurcated structure is present. The most stable neutral conformers are those where the halogen interacts with the π-system of the C![[double bond, length as m-dash]](https://www.rsc.org/images/entities/char_e001.gif) C bond in each case. For the chlorine complex, this also results in insertion into the double bond at the terminal carbon, producing a 1-chloropropyl radical.
C bond in each case. For the chlorine complex, this also results in insertion into the double bond at the terminal carbon, producing a 1-chloropropyl radical.
Author contributions
Peter D. Watson: conceptualization (equal), writing – original draft (lead), writing – reviewing and editing (equal), investigation (lead), formal analysis (lead). Timothy R. Corkish: writing – reviewing and editing (equal), investigation (equal). Christian T. Haakansson: writing – reviewing and editing (equal), investigation (equal). Allan J. McKinley: writing – reviewing and editing (equal), supervision (equal). Duncan A. Wild: conceptualization (equal), writing – reviewing and editing (equal), supervision (equal), project administration (lead).Conflicts of interest
There are no conflicts to declare.Acknowledgements
This research was undertaken with the assistance of computational resources from the Pople high-performance computing cluster of the Faculty of Science at the University of Western Australia. The Australian Research Council is acknowledged for funding the laser installation under the LIEF scheme (LE110100093). The School of Molecular Sciences and the Faculty of Science are acknowledged for financial support. T. R. C. thanks the support of Research Training Program (RTP) scholarship funded by the Australian Government, C. T. H. acknowledges the UWA Dean's Excellence in Science PhD Scholarship, and P. D. W. thanks the support of the Center for Materials Crystallography at Aarhus University in Denmark, funded by the Danish National Research Foundation (DNRF93).References
- J. J. C. Samson, B. van Middelkoop, G. Weickert and K. R. Westerterp, AIChE J., 1999, 45, 1548–1558 CrossRef CAS.
- A. J. Cancelas, V. Monteil and T. F. L. McKenna, Macromol. Symp., 2016, 360, 133–141 CrossRef CAS.
- N. Marcelino, J. Cernicharo, M. Agúndez, E. Roueff, M. Gerin, J. Martín-Pintado, R. Mauersberger and C. Thum, Astrophys. J., 2007, 665, L127–L130 CrossRef CAS.
- C. A. Nixon, D. E. Jennings, B. Bézard, S. Vinatier, N. A. Teanby, K. Sung, T. M. Ansty, P. G. J. Irwin, N. Gorius and V. Cottini, et al. , Astrophys. J., 2013, 776, L14 CrossRef.
- B. M. Jones, F. Zhang, R. I. Kaiser, A. Jamal, A. M. Mebel, M. A. Cordiner and S. B. Charnley, Proc. Natl. Acad. Sci. U. S. A., 2010, 108, 452–457 CrossRef PubMed.
- J. Bouwman, F. Goulay, S. R. Leone and K. R. Wilson, J. Phys. Chem. A, 2012, 116, 3907–3917 CrossRef CAS.
- D. Chastaing, P. L. James, I. R. Sims and I. W. M. Smith, Faraday Discuss., 1998, 109, 165–181 RSC.
- A. B. Vakhtin, D. E. Heard, I. W. Smith and S. R. Leone, Chem. Phys. Lett., 2001, 348, 21–26 CrossRef CAS.
- W. P. L. Carter, A. C. Lloyd, J. L. Sprung and J. N. Pitts, Int. J. Chem. Kinet., 1979, 11, 45–101 CrossRef CAS.
- R. Wayne, Chemistry of Atmospheres, Oxford University Press, New York, 3rd edn, 2000 Search PubMed.
- R. von Glasow, R. von Kuhlmann, M. G. Lawrence, U. Platt and P. J. Crutzen, Atmos. Chem. Phys., 2004, 4, 2481–2497 CrossRef CAS.
- P. Warneck, Chemistry of the Natural Atmosphere, Academic Press, 2nd edn, 2000 Search PubMed.
- M. D. Brynteson, C. C. Womack, R. S. Booth, S. H. Lee, J. J. Lin and L. J. Butler, J. Phys. Chem. A, 2014, 118, 3211–3229 CrossRef CAS PubMed.
- L. Xu and R. L. Kuczkowski, J. Chem. Phys., 1994, 100, 15–22 CrossRef CAS.
- S. A. Peebles and R. L. Kuczkowski, J. Mol. Struct., 1997, 436–437, 59–67 CrossRef CAS.
- S. A. Peebles and R. L. Kuczkowski, J. Mol. Struct., 1998, 447, 151–158 CrossRef CAS.
- D. Beckham, S. Conran, K. Lapere, M. Kettner, A. McKinley and D. Wild, Chem. Phys. Lett., 2015, 619, 241–246 CrossRef CAS.
- K. Lapere, R. LaMacchia, L. Quak, A. McKinley and D. Wild, Chem. Phys. Lett., 2011, 504, 13–19 CrossRef CAS.
- T. R. Corkish, C. T. Haakansson, P. D. Watson, A. J. McKinley and D. A. Wild, ChemPhysChem, 2020, 22, 69–75 CrossRef.
- P. D. Watson, H.-W. Yong, K. M. Lapere, M. Kettner, A. J. McKinley and D. A. Wild, Chem. Phys. Lett., 2016, 654, 119–124 CrossRef CAS.
- S. Kozuch and J. M. L. Martin, Phys. Chem. Chem. Phys., 2011, 13, 20104 RSC.
- S. Kozuch and J. M. L. Martin, J. Comput. Chem., 2013, 2327–2344 CAS.
- V. Distelrath and U. Boesl, Faraday Discuss., 2000, 115, 161–174 RSC.
- P. D. Watson, A. J. McKinley and D. A. Wild, J. Mol. Spectrosc., 2020, 372, 111320 CrossRef CAS.
- K. M. L. Lapere, M. Kettner, P. D. Watson, A. J. McKinley and D. A. Wild, J. Phys. Chem. A, 2015, 119, 9722–9728 CrossRef CAS PubMed.
- C. T. Haakansson, T. R. Corkish, P. D. Watson, D. B. ‘t Hart, A. J. McKinley and D. A. Wild, Chem. Phys. Lett., 2022, 793, 139433 CrossRef CAS.
- C. T. Haakansson, T. R. Corkish, P. D. Watson, H. T. Robinson, J. R. Brookes, H. C. Adam, A. J. McKinley and D. A. Wild, Phys. Chem. Chem. Phys., 2022, 24, 24748–24758 RSC.
- F. Weigend and R. Ahlrichs, Phys. Chem. Chem. Phys., 2005, 7, 3297 RSC.
- F. Weigend, Phys. Chem. Chem. Phys., 2006, 8, 1057 RSC.
- T. H. Dunning, K. A. Peterson and A. K. Wilson, J. Chem. Phys., 2001, 114, 9244–9253 CrossRef CAS.
- K. A. Peterson, D. Figgen, E. Goll, H. Stoll and M. Dolg, J. Chem. Phys., 2003, 119, 11113–11123 CrossRef CAS.
- K. A. Peterson, B. C. Shepler, D. Figgen and H. Stoll, J. Phys. Chem. A, 2006, 110, 13877–13883 CrossRef CAS.
- M. J. Frisch, G. W. Trucks, H. B. Schlegel, G. E. Scuseria, M. A. Robb, J. R. Cheeseman, G. Scalmani, V. Barone, B. Mennucci, G. A. Petersson, H. Nakatsuji, M. Caricato, X. Li, H. P. Hratchian, J. Izmaylov, A. F. Bloino, G. Zheng, J. L. Sonnenberg, M. Hada, M. Ehara, K. Toyota, R. Fukuda, J. Hasegawa, M. Ishida, T. Nakajima, Y. Honda, O. Kitao, H. Nakai, T. Vreven, J. Montgomery, J. E. Peralta, F. Ogliaro, M. Bearpark, J. J. Heyd, E. Brothers, K. N. Kudin, V. N. Staroverov, R. Kobayashi, J. Normand, K. Raghavachari, A. Rendell, J. C. Burant, S. S. Iyengar, J. Tomasi, M. Cossi, N. Rega, M. J. Millam, M. Klene, J. E. Knox, J. B. Cross, V. Bakken, C. Adamo, J. Jaramillo, R. Gomperts, R. E. Stratmann, O. Yazyev, A. J. Austin, R. Cammi, C. Pomelli, J. W. Ochterski, R. L. Martin, K. Morokuma, V. G. Zakrzewski, G. A. Voth, P. Salvador, J. J. Dannenberg, S. Dapprich, A. D. Daniels, O. Farkas, J. B. Foresman, J. V. Ortiz, J. Cioslowski and D. J. Fox, Gaussian 09 Revision D.01, Gaussian Inc., Wallingford CT, 2009 Search PubMed.
- L. J. R. Jr. and V. Kaufman, J. Opt. Soc. Am., 1969, 59, 424–443 CrossRef.
- J. L. Tech, J. Res. Natl. Bur. Stand. (U.S.), Sect. A, 1963, 67, 505–554 CrossRef.
- L. Minnhagen, Ark. Fys. (Stockholm), 1962, 21, 415–465 Search PubMed.
- D. Hanstorp and M. Gustafsson, J. Phys. B: At., Mol. Opt. Phys., 1992, 25, 1773–1783 CrossRef CAS.
- C. Blondel, P. Cacciani, C. Delsart and R. Trainham, Phys. Rev. A: At., Mol., Opt. Phys., 1989, 40, 3698–3701 CrossRef CAS.
- R. Trainham, G. D. Fletcher and D. J. Larson, J. Phys. B: At. Mol. Phys., 1987, 20, L777–L784 CrossRef CAS.
- T. R. Corkish, C. T. Haakansson, P. D. Watson, H. T. Robinson, A. J. McKinley and D. A. Wild, ChemPhysChem, 2021, 22, 1316–1320 CrossRef CAS PubMed.
- A. D. Boese, M. Oren, O. Atasoylu, J. M. L. Martin, M. Kállay and J. Gauss, J. Chem. Phys., 2004, 120, 4129–4141 CrossRef CAS PubMed.
- A. Halkier, T. Helgaker, P. Jørgensen, W. Klopper, H. Koch, J. Olsen and A. K. Wilson, Chem. Phys. Lett., 1998, 286, 243–252 CrossRef CAS.
- A. G. Suits, Annu. Rev. Phys. Chem., 2020, 71, 77–100 CrossRef CAS PubMed.
- D. Rappoport and F. Furche, J. Chem. Phys., 2010, 133, 134105 CrossRef.
- D. E. Woon and T. H. Dunning, J. Chem. Phys., 1994, 100, 2975–2988 CrossRef CAS.
- B. P. Pritchard, D. Altarawy, B. Didier, T. D. Gibson and T. L. Windus, J. Chem. Inf. Model., 2019, 59, 4814–4820 CrossRef CAS.
- B. Jeziorski, R. Moszynski and K. Szalewicz, Chem. Rev., 1994, 94, 1887–1930 CrossRef CAS.
- Y.-Y. Chuang and S.-M. Chen, J. Comput. Chem., 2011, 32, 1671–1679 CrossRef CAS.
- Y.-Y. Chuang and S.-M. Chen, J. Chin. Chem. Soc., 2012, 59, 1094–1103 CrossRef CAS.
- D. Feller and D. A. Dixon, J. Phys. Chem. A, 2018, 122, 2598–2603 CrossRef CAS PubMed.
- P. Kraus, J. Chem. Theory Comput., 2020, 16, 5712–5722 CrossRef CAS PubMed.
- P. Kraus, J. Chem. Theory Comput., 2021, 17, 5651–5660 CrossRef CAS PubMed.
- J. C. Amicangelo and Y.-P. Lee, J. Phys. Chem. Lett., 2010, 1, 2956–2961 CrossRef CAS.
- F. S. C. Lee and F. S. Rowland, J. Phys. Chem., 1977, 81, 1222–1229 CrossRef CAS.
- P. Braña and J. A. Sordo, J. Comput. Chem., 2003, 24, 2044–2062 CrossRef.
- K. Hiraoka, K. Fujita, M. Ishida, T. Ichikawa, H. Okada, K. Hiizumi, A. Wada, K. Takao, S. Yamabe and N. Tsuchida, J. Phys. Chem. A, 2005, 109, 1049–1056 CrossRef CAS PubMed.
- V. A. Mozhayskiy and A. I. Krylov, ezSpectrum 3.0, 2009, https://iopenshell.usc.edu/downloads Search PubMed.
Footnote |
| † Electronic supplementary information (ESI) available. See DOI: https://doi.org/10.1039/d2cp03796c |
| This journal is © the Owner Societies 2022 |

