
 Open Access Article
 This Open Access Article is licensed under a
 Creative Commons Attribution 3.0 Unported Licence
Role of conical intersection seam topography in the chemiexcitation of 1,2-dioxetanes†
Ignacio
Fdez. Galván
 *a,
Anders
Brakestad
bc and
Morgane
Vacher
*d
*a,
Anders
Brakestad
bc and
Morgane
Vacher
*d
aDepartment of Chemistry – BMC, Uppsala University, P.O. Box 576, SE-751 23 Uppsala, Sweden. E-mail: ignacio.fernandez@kemi.uu.se
bHylleraas Centre for Quantum Molecular Sciences, UiT The Arctic University of Norway, 9037 Tromsø, Norway
cDepartment of Chemistry, UiT The Arctic University of Norway, 9037 Tromsø, Norway
dUniversité de Nantes, CNRS, CEISAM UMR 6230, F-44000 Nantes, France. E-mail: morgane.vacher@univ-nantes.fr
First published on 6th January 2022
Abstract
Chemiexcitation, the generation of electronic excited states by a thermal reaction initiated on the ground state, is an essential step in chemiluminescence, and it is mediated by the presence of a conical intersection that allows a nonadiabatic transition from ground state to excited state. Conical intersections classified as sloped favor chemiexcitation over ground state relaxation. The chemiexcitation yield of 1,2-dioxetanes is known to increase upon methylation. In this work we explore to which extent this trend can be attributed to changes in the conical intersection topography or accessibility. Since conical intersections are not isolated points, but continuous seams, we locate regions of the conical intersection seams that are close to the configuration space traversed by the molecules as they react on the ground state. We find that conical intersections are energetically and geometrically accessible from the reaction trajectory, and that topographies favorable to chemiexcitation are found in all three molecules studied. Nevertheless, the results suggest that dynamic effects are more important for explaining the different yields than the static features of the potential energy surfaces.
1 Introduction
Conical intersections (CIs) are known to play a key role in photochemistry.1–3 Absorption of light can promote a molecule into an electronically excited state. CIs, when present and accessible, offer an ultrafast non-radiative pathway to relax back to the electronic ground state. This nonadiabatic relaxation path can be associated with a chemical reaction, i.e. the formation of a new chemical compound. Chemiluminescence can be seen as a reverse photochemical process: it is the emission of light as a result of a nonadiabatic chemical reaction.4 More precisely, a thermally activated molecule reacts and, by doing so, undergoes a nonadiabatic transition from the reactant in the electronic ground state up to an electronic excited state of the product or an intermediate. The latter then releases the excess energy in the form of a photon.Chemiluminescence occurring in living organisms is called bioluminescence.5 While the most typical example is the firefly,6 bioluminescence is mainly found in animals living in the sea.7,8 Light emission serves several important functions in Nature with, in general, bioluminescent glows acting as attractant signals while sudden flashes are thought to be repellent.7 Examples include various defensive mechanisms against predators,9–12 offensive strategies to illuminate, lure or confuse preys,11,13–15 and means of communication to attract partners.16–19 Chemiluminescence also has practical applications,20 for instance in real-time in vivo imaging,21 immunoassays developed for diverse biochemical and clinical analytes,22 combustion diagnostics,23 analysis of atmospheric pollution,24 and biosensing for environmental pollutants and food industry, etc.25
Almost all currently known chemiluminescent systems have the –O–O– peroxide bond in common.4 The smallest such system with chemiluminescent properties is the 1,2-dioxetane molecule which breaks down into two formaldehydes (see Fig. 1).26 Theoretical studies, involving in particular non-adiabatic dynamics simulations, provided insights into the mechanism and yield of chemiluminescent reactions of 1,2-dioxetane and other larger molecules, e.g. the firefly dioxetanone anion, luminol, and 1,2-dioxetanedione.26–30 According to previous works, the general mechanism of the decomposition reaction in the 1,2-dioxetane molecule implies a stepwise process:26,27 (i) the O–O bond breaks leading to a biradical intermediate with four singlet and four triplet electronic states that are energetically quasi-degenerate; and (ii) the C–C bond breaks leading to dissociation of the molecule into two formaldehyde molecules. For the second step, dark decomposition is said to occur if the two formed formaldehyde molecules are in the ground state, while chemiluminescent decomposition occurs if one formaldehyde molecule ends up in a singlet or triplet excited state. Chemical titrations of formaldehyde and chemiluminescence measurements have shown that the yield of the triplet excited states is much higher than that of the singlet excited states.31
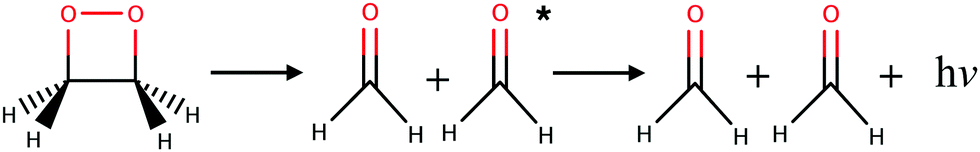 | ||
| Fig. 1 Chemiluminescent decomposition reaction of 1,2-dioxetane into two formaldehydes. | ||
Already in the 1980s, dioxetane molecules with systematic substitution of a hydrogen atom by a methyl group were studied experimentally in solution in an attempt to rationalize the chemiluminescence yields.31 An important observation is that the chemiexcitation efficiency increases significantly with the degree of methylation: substituting all four hydrogen atoms by methyl groups enhances the chemiluminescence yield from approximately 0.3% to 35%. The reason for this impressive increase in chemiluminescence yield remained an outstanding question for several decades. In 2007, it was suggested that adding substituents to 1,2-dioxetane, thereby increasing the number of degrees of freedom for the molecule, would increase the time spent in the electronically quasi-degenerate region of the potential energy surface, thus creating an “entropic trap” that enhances the possibility of populating the product excited states.26 This view was supported in a more recent theoretical investigation that used ab initio molecular dynamics in gas phase to study five of the methyl-substituted 1,2-dioxetanes. It was found that the higher chemiexcitation yield in the methyl-substituted molecules could be attributed to an increased lifetime of the biradical intermediates.32 However, this is partly due to a simple mass effect. The rotation around the O–C–C–O dihedral angle is slowed down; thus, the molecular system stays longer in the entropic trap region. In that latter study, a kinetic model was also presented to explain how slower dissociation can lead to a higher chemiluminescence yield.32
In addition to the dynamic effects considered above, the probability to undergo a nonadiabatic transition is generally expected to depend on the topography of a CI and on the approach to this CI (direction and speed of the nuclear trajectory or wavepacket).33,34 In particular, one distinguishes between peaked CIs, where the intersection point is a minimum on the upper state surface, and sloped CIs, where the energy of the upper state can become lower than that of the intersection along some directions.35 On the one hand, during a photochemical reaction, peaked CIs are generally thought to yield to a more efficient nonadiabatic decay to a lower-energy electronic state, due to either topographical or dynamical effects.34 Indeed, as a peaked intersection is a minimum on the upper state surface, it can act as a funnel or attractor for processes occurring on this upper surface. On the other hand, chemiexcitation is expected to be favored by sloped CIs since, in that case, there exists a relaxation path on the upper surface, i.e. a path along which the potential energy of the excited state decreases as one goes away from the CI (see Fig. 2).33
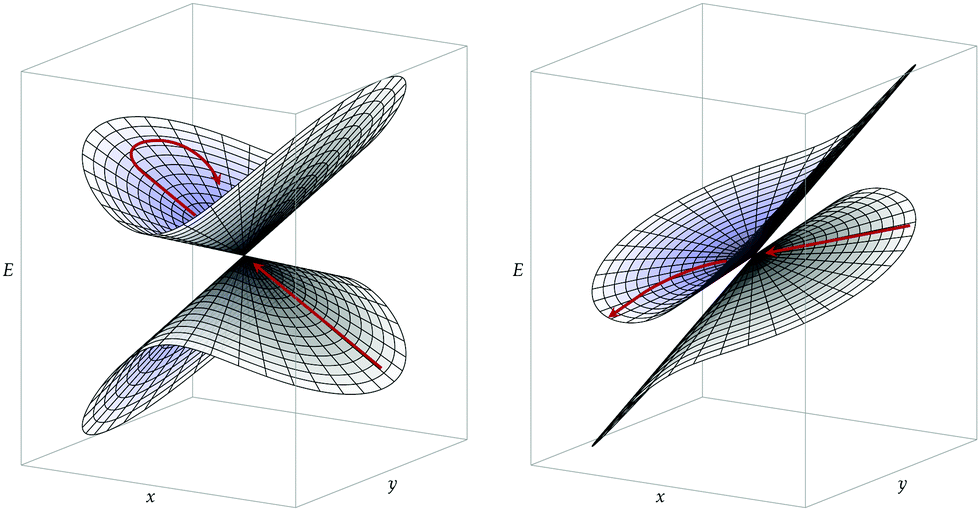 | ||
| Fig. 2 Representation of the potential energy surfaces on the branching plane (the x and y axes) around two conical intersections. Left: Peaked intersection. Right: Sloped intersection. The red arrows illustrate a possible trajectory starting on the lower surface. | ||
The aim of the present work is to understand further the increase in chemiexcitation yields upon methylation of 1,2-dioxetanes, through a detailed study of the CI seams. How close is the intersection seam from the ground state decomposition pathway (in energy and geometry)? Does the CI topography favor chemiexcitation in certain regions of the seams? Are there significant differences between methyl-substituted compounds that can further explain the observed trend in yields? Can a “static” analysis replace or complement the ab initio molecular dynamics simulations? These are important questions, not only to understand the chemiluminescence in the dioxetane molecules but also to understand how Nature has designed efficient bioluminescent systems and how researchers can potentially design more efficient chemiluminescent systems with, for instance, medical applications.
The article is structured as follows: in Sections 2 and 3, the theory and computational details used in this work, respectively, are presented. In Section 4, the results are exposed and discussed. Section 5 offers some concluding remarks.
2 Conical intersection characterization
Two electronic diabatic states may cross. If the adiabatic potential energy surfaces (PES) are degenerate at some point, they typically form a conical intersection.36 The set of geometries where the surfaces are degenerate is the intersection space, and it has a dimensionality of K − 2 degrees of freedom, where K is the dimensionality of the PES themselves. The remaining 2 degrees of freedom form the branching space (or, locally, branching plane), where the degeneracy is lifted. For more details about conical intersection characterization, the reader is adviced to refer to previous works, especially ref. 33 and 35–37, only a quick summary is provided here. At a conical intersection point, two independent geometrical distortions can linearly break the degeneracy. These directions, usually obtained as gAB (the half-difference between the gradients of the two intersecting states) and hAB (the derivative coupling between the two states), thus define the branching plane. In general, gAB and hAB are not orthogonal, but a suitable unitary rotation between the intersecting states can be chosen such that the corresponding vectors are orthogonal, denoted as![[g with combining tilde]](https://www.rsc.org/images/entities/b_i_char_0067_0303.gif) and
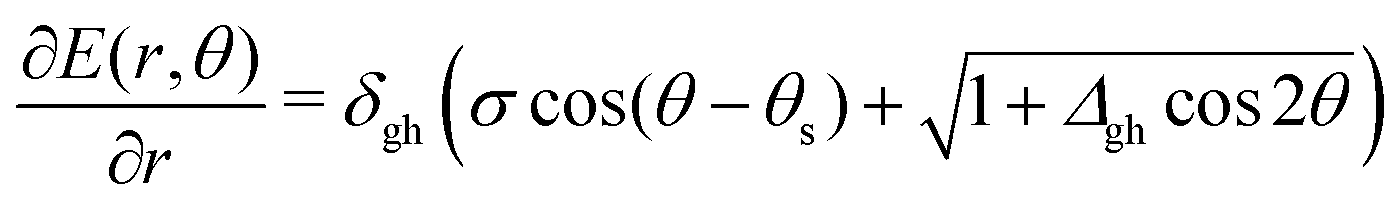
and ![[h with combining tilde]](https://www.rsc.org/images/entities/b_i_char_0068_0303.gif) . The average length of and determines the pitch, δgh, or overall steepness of the intersecting PES. The relative difference between the same lengths determines the asymmetry, Δgh, or the extent in which the shape deviates from a radially symmetric double cone. A third vector, sAB, the average gradient of the two states, and its orientation relative to and , determine the tilt, σ, and tilt heading, θs, parameters. All these parameters can be used to define a linear model that describes the two intersecting PES around the intersection point for geometries in the branching plane:33
. The average length of and determines the pitch, δgh, or overall steepness of the intersecting PES. The relative difference between the same lengths determines the asymmetry, Δgh, or the extent in which the shape deviates from a radially symmetric double cone. A third vector, sAB, the average gradient of the two states, and its orientation relative to and , determine the tilt, σ, and tilt heading, θs, parameters. All these parameters can be used to define a linear model that describes the two intersecting PES around the intersection point for geometries in the branching plane:33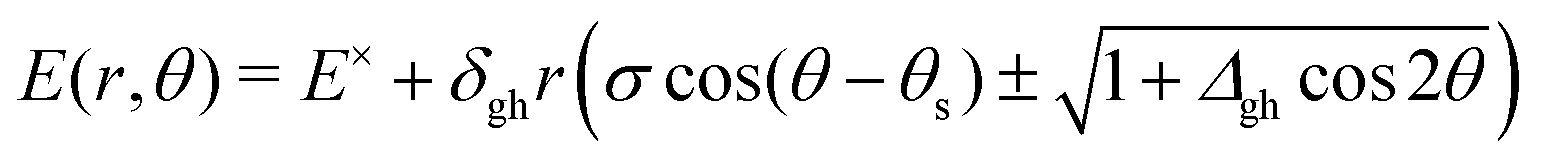 | (1) |
Conical intersections can be classified as peaked or sloped according to the behavior of the upper surface in the branching plane around the intersection. In peaked intersection, the intersection point is a minimum on the upper surface, i.e. any small displacement from the intersection point in the branching plane would result in an increase of energy of the upper surface. In a sloped intersection there are some directions in the branching plane in which a displacement from the intersection point results in a decrease of energy of the upper surface. See Fig. 2.
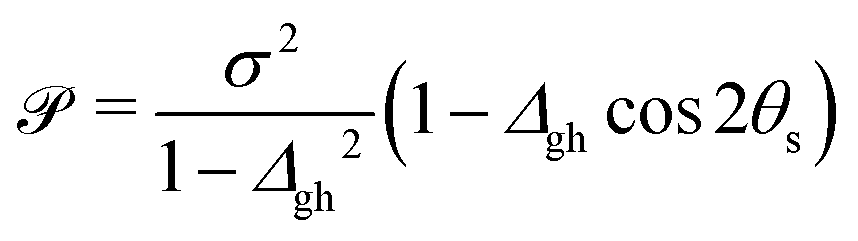
To characterize an intersection as peaked or sloped, a condition number ![[scr P, script letter P]](https://www.rsc.org/images/entities/char_e52f.gif) can be computed:33
can be computed:33
 | (2) |
< 1, the intersection is peaked; if > 1, the intersection is sloped. From the point of view of chemiexcitation, sloped intersections are particularly interesting, as they provide a possible pathway that simultaneously stabilizes the excited state and avoids further nonadiabatic transitions to the ground state by breaking the degeneracy between the surfaces.
However, although the > 1 condition is a rigorously mathematical one, it is not necessarily the best way to characterize the likelihood of a system escaping the CI region on the excited state. In the first place, the condition is binary: it only tells whether or not a downhill escape path exists in the branching plane on the upper surface. It should not, in principle, be used to compare intersections to decide which one is more sloped or closer to being sloped. In the second place, the peaked/sloped classification is only strictly valid for minimum energy intersection points, or at least for points which are critical points in the intersection space, where the gradient along every direction not in the branching plane (the intersection space) vanishes. For any other intersection point, there is a nonzero gradient in the intersection space, which means that it is always possible to find directions with negative gradient on the upper surface by combining contributions from the branching plane and intersection space.
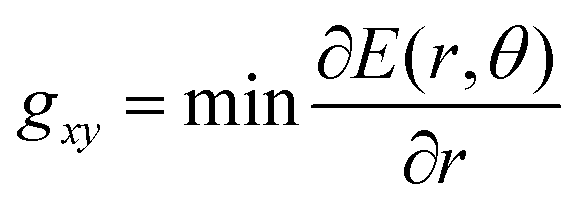
In this work, therefore, to compare intersections and quantify their degree of “slopedness”, we use the minimum radial gradient on the upper surface in the branching plane, gxy, i.e.
 | (3) |
 | (4) |
> 1 and positive if < 1. Finding the minimum numerically is easy, once δgh, Δgh, σ, and θs are known, especially given the fact that a plot of ∂E/∂r vs. θ can only have one or two local minima in the range [0, 2π).33 But obtaining a closed analytical expression resulted too cumbersome to be of practical use. For an example see Fig. 3.
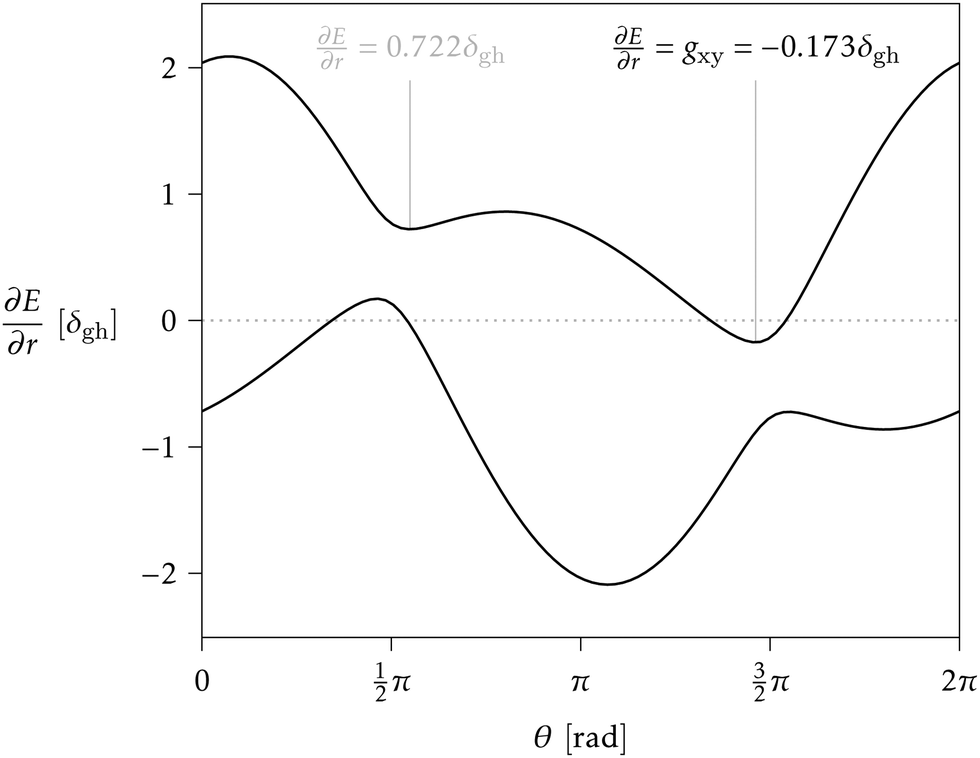 | ||
| Fig. 3 Example of a ∂E/∂r vs. θ plot for a conical intersection with Δgh = 0.9, σ = 0.8 and θs = 0.6 rad. The two curves correspond to the lower and upper surface, and the gradient is given in units of δgh. The upper surface shows two minimum gradient directions (vertical lines), the lowest of which determines gxy. Since the lowest gradient is negative, this intersection can be classified as sloped (accordingly, = 2.27 > 1). | ||
We also want to take into account the effect of the gradient in the intersection space, gz, which is obtained from the average gradient of the two states, sAB, by projecting out the components in the branching plane:
 | (5) |
gz = sAB − (sAB·![[x with combining circumflex]](https://www.rsc.org/images/entities/b_i_char_0078_0302.gif) ) − (sAB·ŷ)ŷ ) − (sAB·ŷ)ŷ | (6) |
, ŷ are orthogonal unit vectors defining the branching plane, i.e. unit vectors in the directions of and . As mentioned above, when gz is not zero (i.e. when the system is not at a minimum energy intersection point), it is always possible to find directions not lying entirely on the branching plane that satisfy the sloped condition: a displacement in that direction breaks the degeneracy and stabilizes the upper surface. We consider how much this direction must deviate from the branching plane in order for the upper surface gradient to become zero, and express it as an angle, αs:gxy![[thin space (1/6-em)]](https://www.rsc.org/images/entities/char_2009.gif) cosαs − gzsinαs = 0 cosαs − gzsinαs = 0 | (7) |
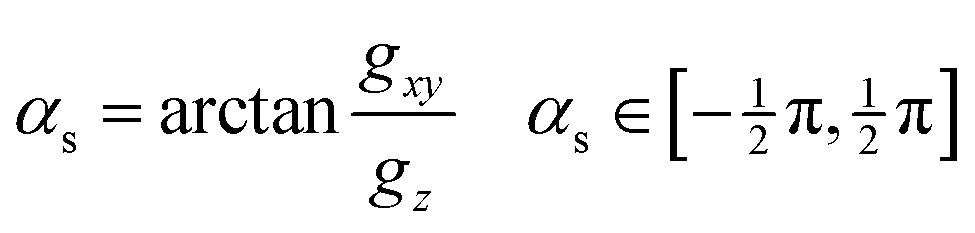 | (8) |
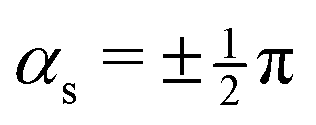 . No contribution from the intersection space gradient can change the sign of gxy, and the intersection is “always peaked” or “always sloped”. To summarize:
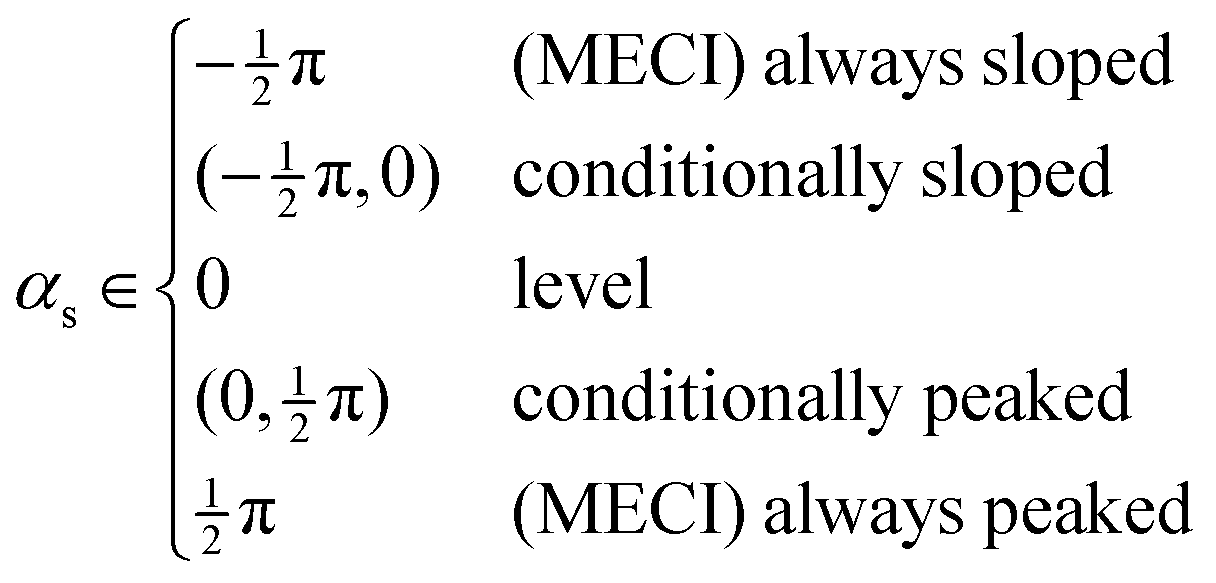 | (9) |
It is reminded that this discussion is based on the linear model, eqn (1), and it can only describe the potential energy surfaces in the close vicinity of the intersection seam, so extrapolations to other regions must be done with caution. The range of validity of this model would depend on the importance of higher-order terms in the description of the surfaces.38 Nevertheless, we suggest that lower values of gxy and αs are indications of a topography more favorable to a relaxation on the upper surface, and therefore to chemiexcitation.
Besides the shape of the potential energy surfaces, it is also interesting to compare the wave functions involved in conical intersections. There are two main difficulties that make this task not trivial. The first one is due to the complexity of a general polyelectronic wave function. As chemists, we like to refer to electronic configurations, orbital occupations or state characters, but these are only partial aspects of a wave function. A more formal measure of the similarity between two wavefunctions is their overlap,39 although it offers little insight into their differences. The second difficulty is more specific to conical intersections, where two electronic states are degenerate. The degeneracy means any linear combination of the two crossing wave functions is also an equally valid solution with the same energy. It is therefore not meaningful to analyze or compare the states one by one.
We address this last difficulty by comparing not the individual states, but the electronic space spanned by a set of states, i.e. the ensemble of possible wave functions that can be expressed as a linear combination of the states in the set. The two states crossing at an intersection are not uniquely defined, but the electronic space spanned by them is invariant, i.e. it is not altered by unitary rotations among the states. These electronic spaces can be compared by means of their “principal angles”40 or, more succinctly, with a single number, R, that results from the product of the cosines of the principal angles. If all angles are zero, the two electronic spaces are coincident, all the cosines are 1 and R = 1. As any angle approaches  , its cosine will approach 0 and R → 0. So, analogously to the dot or inner product, R gives a measure of the overlap between two electronic spaces.
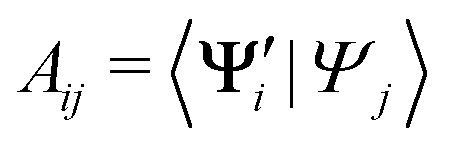
In practice, we compute the matrix of state overlaps A, with elements
 | (10) |
 {i = 1,…,N} and Ψj {j = 1,…,M} are the wave functions of different sets of states at possibly different geometries. The value R can be obtained as the product of the singular values of A:
| A = Udiag(ς)VT (singular value decomposition) | (11) |
| R = Πςi | (12) |
 and
and  , while a value of 0 indicates one of the electronic spaces contains at least one degree of freedom that cannot be represented in the other electronic space. Note that we do not require that N and M are equal, i.e. the two electronic spaces may have different dimensionality. In that case R indicates the extent to which the smaller electronic space can be represented as a subspace of the larger one.
A useful tool in understanding electronic states and their differences is their natural orbitals and corresponding occupation numbers. They are the eigenvectors and eigenvalues of the one-electron density matrix of the state. If one tries to obtain the natural orbitals for the states in an intersection, the same problem discussed above arises: different unitary rotations of the crossing states are equally valid, and they could result in completely different natural orbital descriptions. However, the average density matrix of the crossing states is invariant to these unitary rotations, and therefore the corresponding eigenvectors and eigenvalues could be an appropriate description for the pair of states as a whole. We will call the orbitals obtained in this way the “natural intersection orbitals” (NIO). The concept is essentially the same as the natural average orbitals regularly used in state-average CASSCF calculations, but in this case the averaging is restricted to the states that are degenerate in energy. In addition to the R values, comparing the NIOs and their occupations for different intersections can provide insight into the similarities or differences between the wave functions involved.
3 Computational details
The CI seams of 1,2-dioxetane and methylated derivatives were explored with particular attention to their relationship with the corresponding dissociating trajectories. A full dynamical study would include the computation of a number of trajectories with different initial geometries and momenta intended to represent the quantum nuclear wavepacket delocalization, as was done in ref. 27 and 32. However, in this work we take a “classical” approach, using a single reference trajectory for each compound (see below for details) and comparing the obtained CI seams with it.We studied three compounds of the methylated dioxetane series, namely 1,2-dioxetane (0Me), 3-methyl-1,2-dioxetane (1Me) and trans-3,4-dimethyl-1,2-dioxetane (2Me), shown in Fig. 4, in gas phase. Among the several dimethyl-1,2-dioxetane isomers, we have chosen the trans isomer because this is the one with the highest reported chemiexcitation yield. As a result, substituting two of the four hydrogen atoms by methyl groups enhances the chemiexcitation yield by a factor of more than 50.31 This increase is large enough to test the importance of “static” explanations. Although tri- and tetra-methylated derivatives show even higher chemiexcitation yield, we considered that the lighter members of the series should already be representative of the trend, and thus avoid the increased computational cost that would be needed. The reference trajectories were obtained from a simulation of the ground state only, starting from the transition state (TS) of the O–O bond breaking, with 1 kcal mol−1 kinetic energy along the transition vector. This is the “unsampled” trajectory described in ref. 27 for 0Me, and identical settings were used for the corresponding trajectories of 1Me and 2Me. From the initial structure, the trajectories were obtained by numerical integration of the classical equations of motion with the velocity Verlet algorithm, using a time step of 10 a.u. (∼0.24 fs) and including all nuclear coordinates.
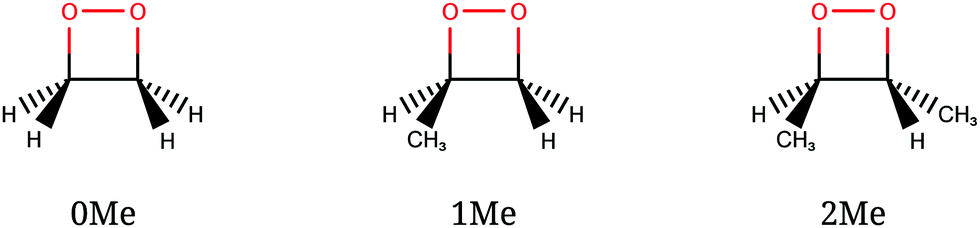 | ||
| Fig. 4 Dioxetane species studied in this work. | ||
Once the reference trajectories were obtained, conical intersections between the two lowest singlet states were searched for in their vicinity. A possible approach would be finding the CI seam region closest to the reference trajectory, by locating minimum distance crossing points.41 We chose, however, to search not necessarily the closest points, but low energy regions roughly parallel to the reference trajectory. Thus, CI structures were optimized on hyperplanes perpendicular to the reference trajectories at specific points (every 5th step, 1.2 fs, for 0Me and 1Me; every 7th step, 1.7 fs, for 2Me). The hyperplanes were defined as the subspace of nuclear coordinates orthogonal to the trajectory velocity at each time step, in mass-weighted Cartesian coordinates, and the trajectory velocity was considered simply as the geometry difference between two consecutive time steps. While this optimization on hyperplanes may lead to geometries farther away from the trajectory than needed (accessible crossing points could be found closer to the trajectory), locating minimum distance crossing points could instead lead to geometries that are close to the trajectory but too high in energy. The CI optimization algorithm is based on the projected constrained optimization method (PCO),42,43 and is described in ref. 33. The algorithm makes use of analytical energy gradients and nonadiabatic couplings, and the hyperplane restriction is easily introduced as an additional geometrical constraint.
The electronic structure of the molecules was computed with complete active space self-consistent field (CASSCF) method,44,45 with an active space of 12 electrons distributed in 10 orbitals, corresponding to the eight σ and σ* orbitals of the four-membered ring plus the two lone-pair orbitals on the oxygens perpendicular to the ring (Fig. 5). A state average of the four lowest singlet states was used to optimize the orbitals. The basis set employed was the relativistic atomic natural orbital basis set ANO-RCC, with polarized valence triple-ζ contraction.46 Two-electron integrals were computed with density fitting with an auxiliary basis set obtained through the atomic compact Cholesky decomposition (acCD).47 All calculations were done with OpenMolcas,48 version 19.11-276-g12757fc. The use of CASSCF was justified in ref. 27.
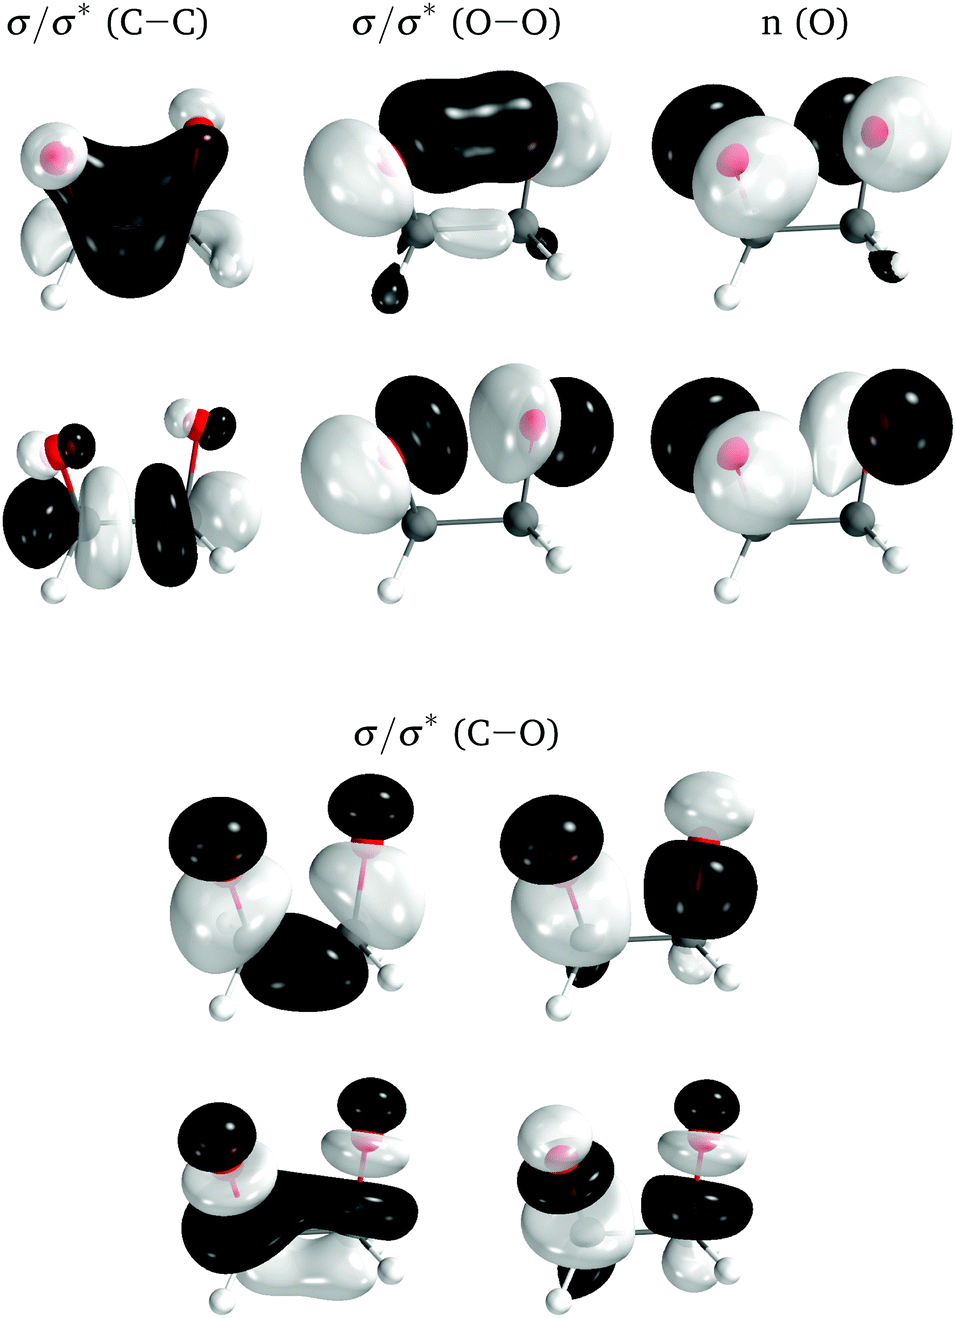 | ||
| Fig. 5 Active space orbitals for 0Me, represented as the ground state natural orbitals at the TS geometry. | ||
4 Results and discussion
Along the reference trajectories, the O–C–C–O torsion angle increases monotonically with the simulation time from its initial value of ∼40°, but does so at different rates depending on the mass of the molecule,32 with 0Me reaching about 95° after 80 fs, while 1Me reaches only 80°, and 2Me 65°. This is displayed in Fig. 6. | ||
| Fig. 6 Time evolution of the O–C–C–O torsion angle for the reference (unsampled) trajectories. | ||
In the following, the CI structures are labeled according to the O–C–C–O torsion angle of their reference structure in the reference trajectory, since this is the most distinctive change along this initial part of the trajectory. It should be kept in mind that the same angle corresponds to different times for each compound, as shown in Fig. 6, and that the angle at the optimized structure may differ from this reference. CI structures labeled with a particular reference angle were always optimized on the hyperplane perpendicular to the trajectory at that torsion angle, regardless of the starting geometry used for the optimization.
As a general result, it was noticed that the CI seams obtained from independent optimizations, i.e. by optimizing each CI structure starting from the corresponding point on the reference trajectory, showed several discontinuities, with sudden geometry changes between consecutive points. The energies were in general much smoother, indicating that there may be several seams or seam regions accessible during the reaction. In order to simplify the discussion, we tried to obtain continuous seams, by restarting the optimizations from previously optimized structures from contiguous reference time steps. Eventually, we located several sets of smoothly changing CI structures for each compound, or “valleys” in the intersection space.
4.1 Dimethylated: 2Me
We start discussing the results with the larger molecule, 2Me, since, perhaps unexpectedly, it shows the simplest behavior among the studied compounds. In Fig. 7 we represent the variation of several quantities along the two identified CI valleys, which we label A and B. Fig. 7a shows the evolution of the energies of the four lowest singlet states along each valley. The first two states are degenerate so they appear as a single line, and there are therefore three lines per valley; the (ground state) energy of the reference trajectory is plotted as a dotted line. The lines for valley B are interrupted below 50° because we did not find optimized CI structures to smoothly continue the valley (instead, the optimization fell back to valley A). Fig. 7b focuses on the energy difference between the CI valleys and the reference trajectory, the energy of the trajectory is again represented by the dotted line at 0.0 kcal mol−1, and the parts of the valleys that are lower in energy than the reference trajectory are easily seen on the negative side.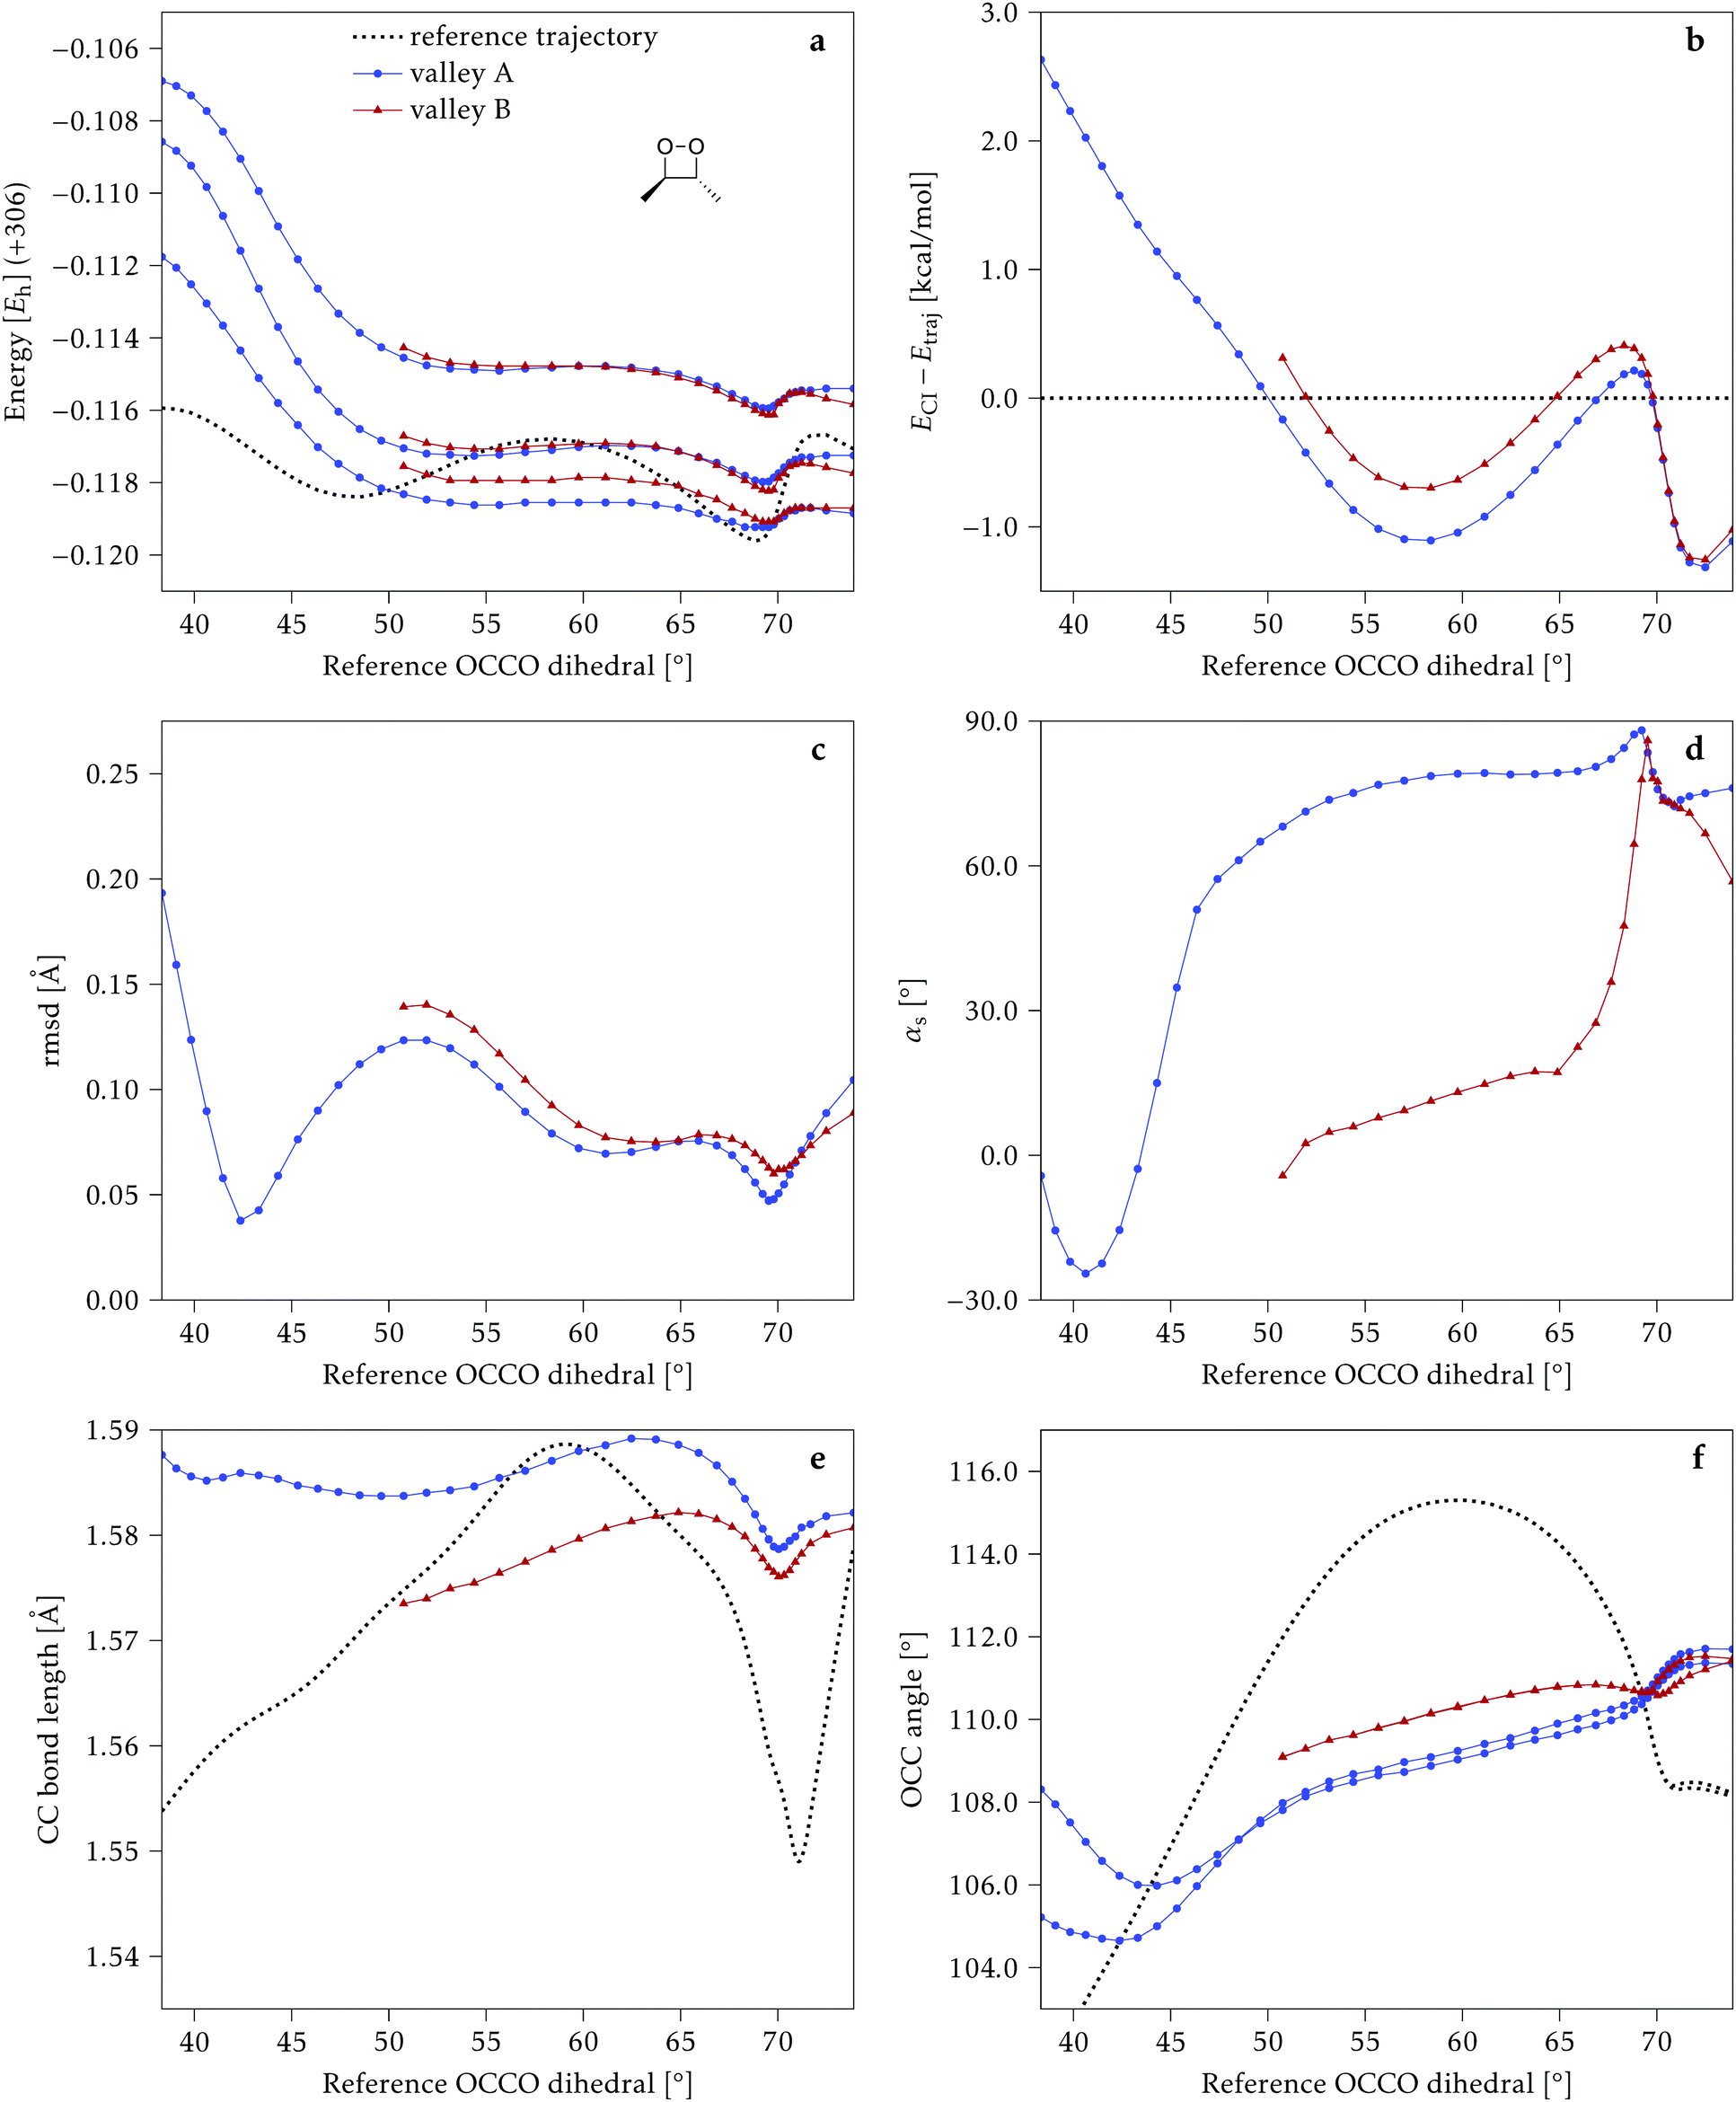 | ||
| Fig. 7 Some energetic and geometric parameters along the CI valleys found for 2Me. (a) Energies of the four lowest singlet states, the first two being degenerate. (b) Energy difference between the CI and the reference trajectory. (c) Rmsd between the CI and the reference trajectory. (d) αs angle. (e) Central C–C bond length. (f) Central O–C–C angles. The values for the reference trajectory are shown as a dotted line in panels (a, b, e and f). | ||
In Fig. 7c we represent the root mean square displacement (rmsd) between each optimized CI structure and the corresponding point of the reference trajectory. Fig. 7d shows the αs angle to measure the degree of “slopedness”: where it is negative, the intersection is classified as (conditionally) sloped. Finally, Fig. 7e and f display the variation of the C–C bond length and the two O–C–C angles in the initial dioxetane ring. There are two angles for each valley, but in some parts they show as a single line because they are identical. In these last two panels, the values corresponding to the geometries along the reference trajectory are again represented as dotted lines.
We can see that valley A starts 2.5 kcal mol−1 above the reference trajectory energy, and at about 45° is already within 1 kcal mol−1 and below the initial TS energy. From 50° the seam is below the trajectory energy, except for a small region close to 70°. The rmsd falls quickly below 0.15 Å and for the most part stays below 0.10 Å, with a minimum below 0.05 Å at around 43°; at 70° there is another minimum in the rmsd of similar value.
The CI topography shows a region of negative αs (conditionally sloped) around torsions of 40°, and then the values increase and stay positive and above 60°. The values of αs close to 90° at a reference dihedral of ∼70° indicate that at these points the valleys are very nearly MECIs (so gz ≃ 0). Although the molecule has symmetrical substitution, the valley has a broken symmetry at lower dihedral angles, but after ∼50° the two O–C–C angles become almost equal for the rest of the valley.
A second CI valley, valley B, is stable, as mentioned above, for reference dihedral angles above 50°. It is about 0.4 kcal mol−1 above valley A, until about 70° where their energies become equal, and slightly farther away from the reference trajectory (larger rmsd). Its topography differs significantly from valley A, at least for reference angles between 50° and 70°, with αs values very close to zero and even negative, which may indicate that regions of the CI seam close to this valley could be important for chemiexcitation. Geometrically, it has a shorter C–C bond by almost 0.01 Å, and completely symmetric O–C–C angles.
The reference trajectory (Fig. 7e and f) shows an oscillation of C–C distance and O–C–C angles before dissociation (which would occur at later times). The rather sharp shape of the graph in Fig. 7e at ∼70° is an artifact of the representation with respect to the reference dihedral, a representation vs. time would be much smoother. The values of these geometrical parameters for the CI valleys are within the ranges accessible to the trajectory, indicating that the intersection geometries are not heavily distorted.
The electronic states in the intersection are analyzed in Fig. 8. In this figure we display, at the top, the energies of the four lowest singlet states along the reference trajectory, showing that  and
and  remain relatively well separated, but
  and
and  cross several times. In all the cases we computed conical intersections between the two lowest states, but these are the states at the intersection geometry, and need not be the same as the
  and
and  states at the corresponding reference trajectory geometry. To make this clearer, we label the states at the intersection with a prime, so
  and
and  . The lower panels show for each of the valleys, the overlaps between the electronic space spanned by
  and
and  , and different electronic spaces spanned by the states of the reference trajectory.
 | ||
Fig. 8 Top: Energies of the computed states along the reference trajectory for 2Me. Middle and bottom: Overlaps of the space of the intersection states,  and and  , with the space of different sets of reference states, , with the space of different sets of reference states,  . . | ||
The blue line closer to the top is the overlap with the set of the four states. It is always 0.9 or larger, except at the lower angles, signifying that the intersecting states are well represented by the four lowest singlet states of the reference trajectory, with no significant contribution from higher states. The difference from 1.0 is mostly due to the geometry difference between the reference trajectory and the valleys, that necessarily lowers the overlaps. We expected the shape of this line to be roughly inverse to the rmsd in Fig. 7c, and this is confirmed. The other lines are more interesting and different between the two valleys. In both cases the lines corresponding to the overlaps with  ,
,  and
and  ,
,  cross at ∼55°, ∼63° and ∼70°. This is not due to sudden changes in the intersecting states
  and
and  , but to the crossings in the reference states
  and
and  , as can be observed in the top panel. A confirmation of this can be obtained from the transition dipole moments, which also display a switch between
  and
and  at ∼55°, ∼63° and ∼70° (see Fig. S1 in the ESI†). Apart from that, the intersecting states in valley A seem to be better described by the states
  and
and  most of the time, although contributions from
  and
and  are not negligible, while valley B, agrees more with
  and
and  , with
  being replaced by
  or
or  at larger angles. Overall, it can be said that the two valleys involve different reference states, although it is not possible to know from these results whether they actually form part of the same intersection seam or they belong to disjoint intersection spaces.
Another view of the difference between the two valleys is provided by the natural intersection orbitals. As a representative example, Fig. 9 shows the NIOs for both valleys at a similar geometry. It is clear that the wave functions in valley A are more asymmetrical than those of valley B, as is also reflected in the O–C–C angles in Fig. 7d.
 | ||
| Fig. 9 Relevant natural intersection orbitals and occupation numbers for the two valleys in 2Me, at a reference dihedral of 55.7° (top, valley A and bottom, valley B). The other NIOs are almost identical in both valleys. The molecule is viewed from the top, as represented in Fig. 4, with the oxygens pointing towards the viewer. | ||
4.2 Monomethylated: 1Me
The data for 1Me is represented in Fig. 10, with panels (a–f) equivalent to those in Fig. 7 (note that they also have the same vertical scale). As in 2Me, two main valleys, A and B, are located, although in this case they are almost completely degenerate and can hardly be distinguished by their energy. Another similarity with 2Me is that from ∼45° on, the CI energy is within 1 kcal mol−1 of the reference trajectory and below the initial TS energy, and shortly after 50° it falls below the reference trajectory energy (Fig. 10b).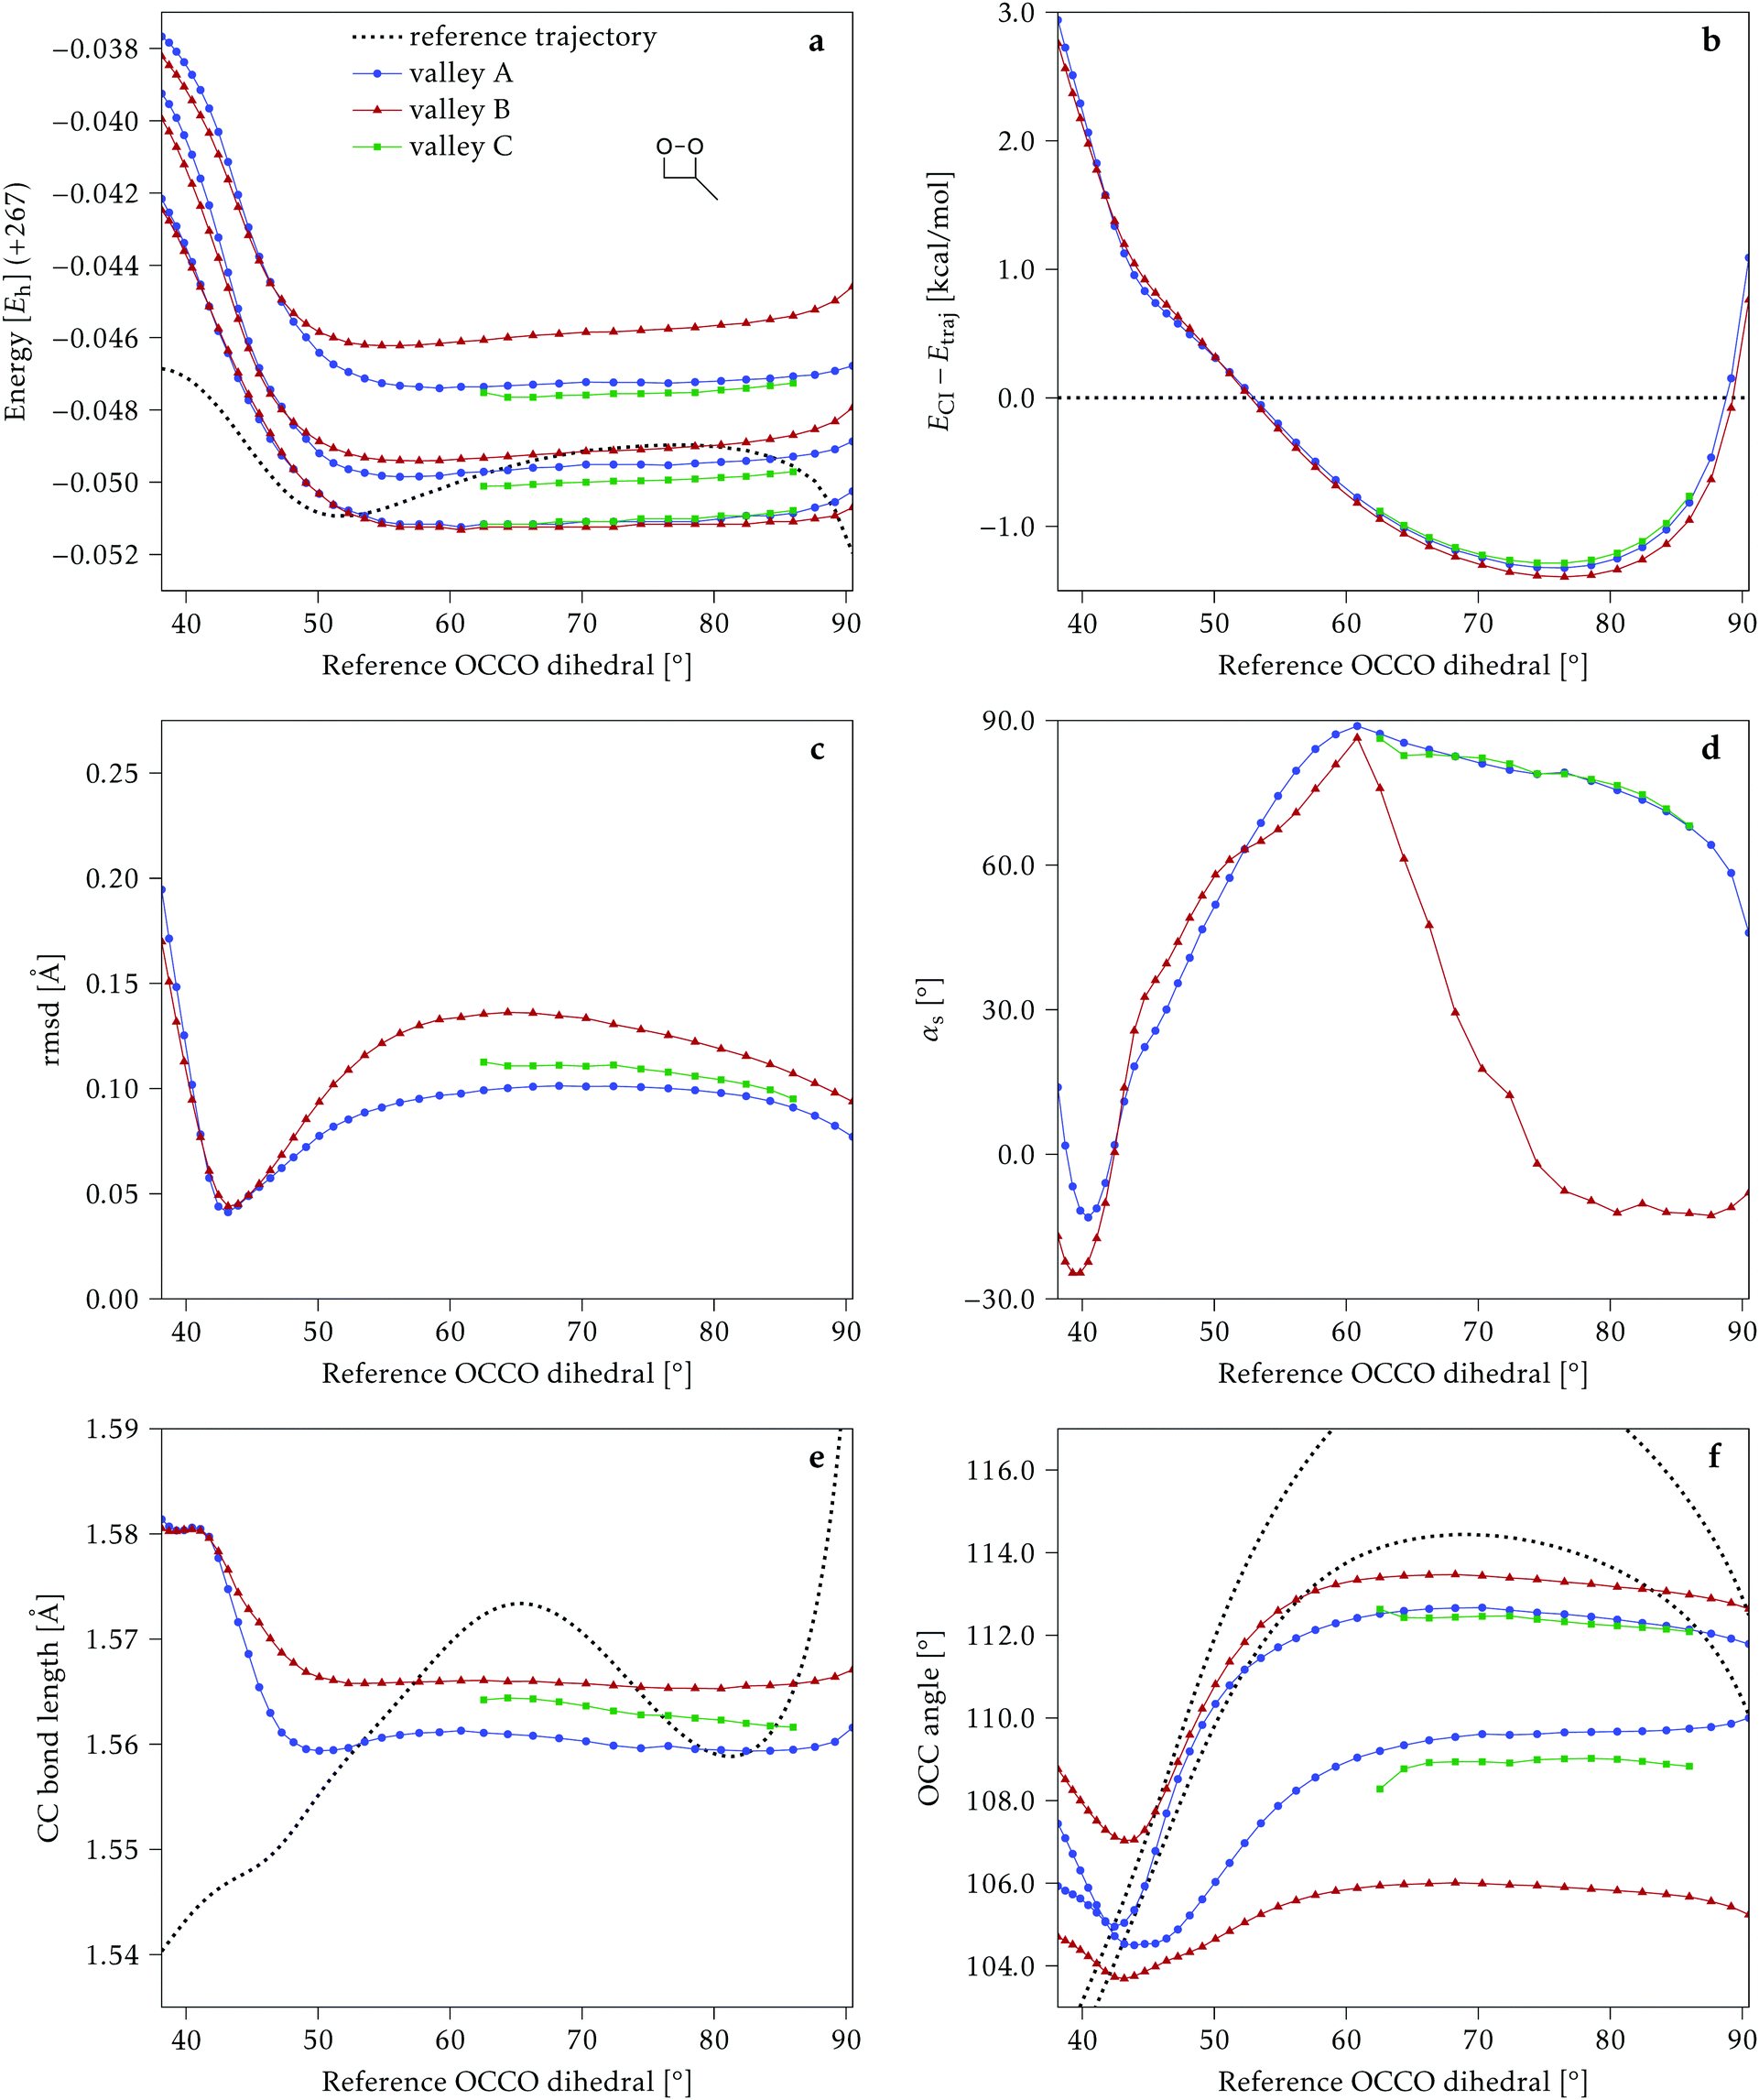 | ||
| Fig. 10 Some energetic and geometric parameters along the CI valleys found for 1Me. (a) Energies of the four lowest singlet states, the first two being degenerate. (b) Energy difference between the CI and the reference trajectory. (c) Rmsd between the CI and the reference trajectory. (d) αs angle. (e) Central C–C bond length. (f) Central O–C–C angles. The values for the reference trajectory are shown as a dotted line in panels (a, b, e and f). | ||
In terms of geometry, except for the very beginning, valley A is always within 0.1 Å rmsd of the reference trajectory, while valley B is found up to 0.15 Å away (Fig. 10c). The main differences between the two valleys can be seen in Fig. 10e and f: valley B has a larger asymmetry between the two O–C–C angles, and a C–C distance longer than valley A by about 0.005 Å. As in 2Me, both valleys show geometries that are in the range of values explored along the reference trajectory.
The CI topography, as in 2Me, shows a region of negative αs around 40° that then rises to positive values and stays above 60° for valley A, while for valley B the value decreases again and from a dihedral of ∼70° it becomes very close to zero and even negative (Fig. 10d). It would therefore seem that although valley A is closer to the reference trajectory, valley B (with a longer C–C bond and more asymmetric O–C–C angles) could be more favorable for chemiexcitation.
In addition to the two valleys described above, a third valley C could be located between torsions of 65° and 85°. It has in general features very similar to valley A, but the C–C bond length is intermediate between valleys A and B.
The overlaps of the electronic spaces spanned by the intersecting states with the ones of the reference trajectory are shown in Fig. 11 (transition dipole moments are shown in Fig. S2 in the ESI†). As with 2Me, the blue line near the top in all three valleys indicates that the intersecting states are well represented by the four lowest singlets of the trajectory. It is also observed that states  and
and  cross along the trajectory at around 70°, a feature that's reflected in the crossing red and green lines in valley A, but interestingly not in valleys B and C. Another significant feature is that the overlaps for valley B with all the state pairs shown is below 0.5 for most of the angles. In fact, the overlaps with the pairs
  ,
,  and
and  ,
,  (not shown) are the highest (0.5–0.6) between 50° and 85°. In summary, the assignment is not as clear as for 2Me, but it is evident that the wave functions of the crossing states are different in the different valleys.
 | ||
Fig. 11 Top left: Energies of the computed states along the reference trajectory for 1Me. Top right and bottom: Overlaps of the space of the intersection states,  and and  , with the space of different sets of reference states, , with the space of different sets of reference states,  . . | ||
The natural intersection orbitals are represented in Fig. 12. As in 2Me, their differences appear in the oxygen p orbitals, although in this case the two oxygens are never symmetrically equivalent. In the three valleys the orbitals can be described as two p orbitals on one oxygen with occupations close to 1.5, and two p orbitals on the other oxygen with occupations close to 2.0 and 1.0. They differ in which of the four orbitals has the ∼1.0 occupation. In this respect, valleys A and C look the most similar to valley A of 2Me (see Fig. 9).
 | ||
| Fig. 12 Relevant natural intersection orbitals and occupation numbers for the three valleys in 1Me, at a reference dihedral of 76.5° (top, valley A; middle, valley B and bottom, valley C). The other NIOs are very similar in all three valleys. The molecule is viewed from the top, as represented in Fig. 4, with the oxygens pointing towards the viewer. | ||
4.3 Unmethylated: 0Me
Fig. 13 shows the data for 0Me, again with the same layout and scales as for the previous molecules. Up to four different valleys can be identified, but none of them is stable along the whole range of reference dihedrals. | ||
| Fig. 13 Some energetic and geometric parameters along the CI valleys found for 0Me. (a) Energies of the four lowest singlet states, the first two being degenerate. (b) Energy difference between the CI and the reference trajectory. (c) Rmsd between the CI and the reference trajectory. (d) αs angle. (e) C–C bond length. (f) O–C–C angles. The insets in panels (e) and (f) show parts that would off-scale in the main graphs. The values for the reference trajectory are shown as a dotted line in panels (a, b, e and f). | ||
Valley A is stable below 55° and valley B is stable above 45°. Their energetic behavior is similar to the one of the other molecules and they stay within an rmsd of 0.1 Å of the reference trajectory. The main difference between these two valleys, in the region where they coexist, is that valley A has asymmetric O–C–C angles, while valley B has a symmetric structure, although at larger dihedrals the symmetry is broken in this valley too. Valley C is stable only in the region between 45° and 65°, it has symmetric O–C–C angles and an energy similar or higher than valleys A and B.
Valley D can be classified as an outlier, with an energy that starts below the reference trajectory but quickly increases, an rmsd above 0.2 Å, and C–C bond length and O–C–C angles significantly larger than the other valleys (see Fig. 13e and f, insets). Except for valley D, the C–C distance and O–C–C angles of the intersections are within the range of values accessible along the trajectory.
As in the other molecules, a region of negative αs is found around 40°, but then values become positive for all valleys and valley B rises above 60°. Valley C shows a sharply decreasing αs with higher reference dihedral angles before it becomes unstable (Fig. 13d). Valley D has a negative αs for a longer range, but the energy rises so much, even above the initial TS point, that it is doubtful that this valley could be relevant for chemiexcitation.
The electronic space overlaps for 0Me are displayed in Fig. 14 (transition dipole moments are shown in Fig. S3 in the ESI†). Again, crossings between excited states can be observed in the trajectory energies, but the ground state is always well separated. In this case, the crossings occur between  and
and  at ∼50° and ∼70°, and between
  and
and  at ∼90°. The crossing signatures can also be clearly seen in the graphs for valleys B and C. The overlap with the electronic space spanned by the full set of four states (blue lines) is high, except in valley D; this is probably a consequence of the geometry difference between the valley and the reference trajectory, as valley D is the one that shows larger rmsd values. Given the limited extent of most of the valleys, comparisons are not straightforward, but the intersecting states of valley B seem to be well represented by the initial (at the TS geometry) states
  and
and  , with the index of the higher state changing as the crossings occur in the reference trajectory. On the other hand, valley C appears to be better described as the intersection between the initial states
  and
and  .
.
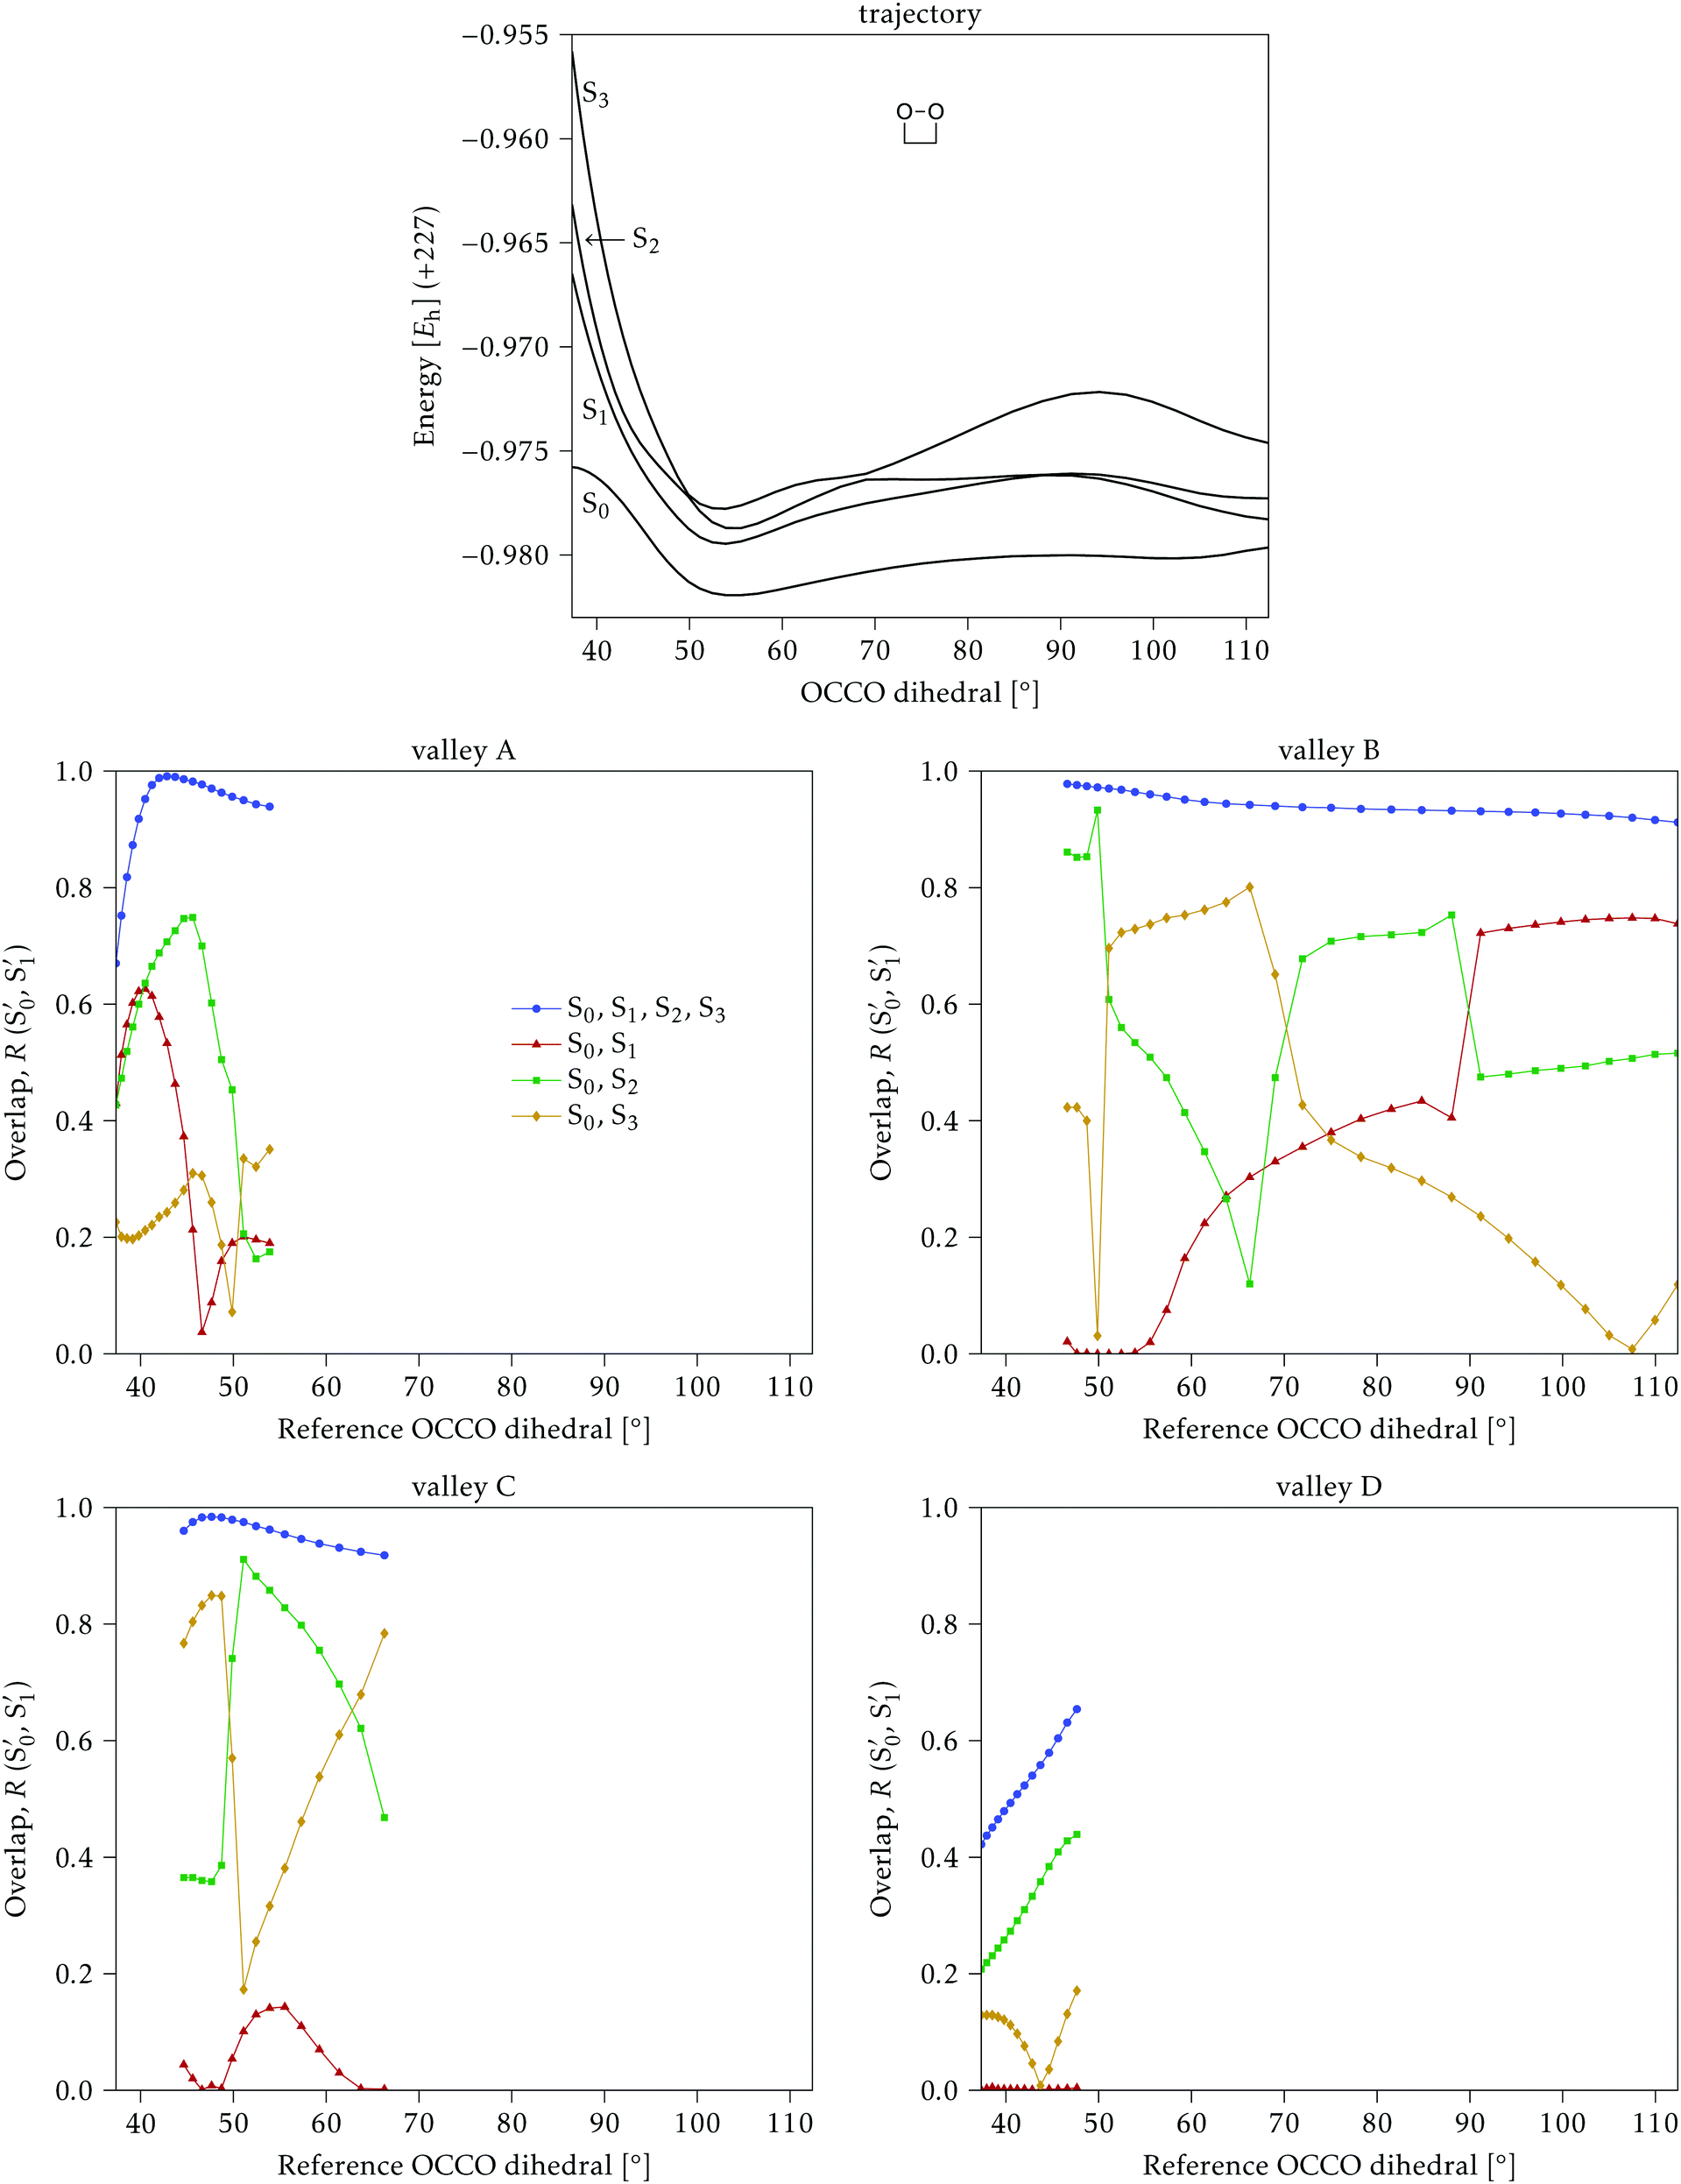 | ||
Fig. 14 Top: Energies of the computed states along the reference trajectory for 0Me. Middle and bottom: Overlaps of the space of the intersection states,  and and  , with the space of different sets of reference states, , with the space of different sets of reference states,  . . | ||
Natural intersection orbitals for all four valleys close to a reference dihedral of 50° are shown in Fig. 15. Except for valley A, they are all quite symmetrical, as could be expected from the geometries (see Fig. 13f). The shapes and occupations of the NIOs for valley A agree with the other A valleys of 1Me and 2Me. The orbitals for valleys B and C can be described as σ(O–O), σ*(O–O) and two “lone” p orbitals: in valley B the lone orbitals have occupations of around 1.7 and the σ/σ* have occupations of 1.3, while in valley B the numbers are reversed. This allows to match the nature of valley C with that of valley B for 2Me (Fig. 9).
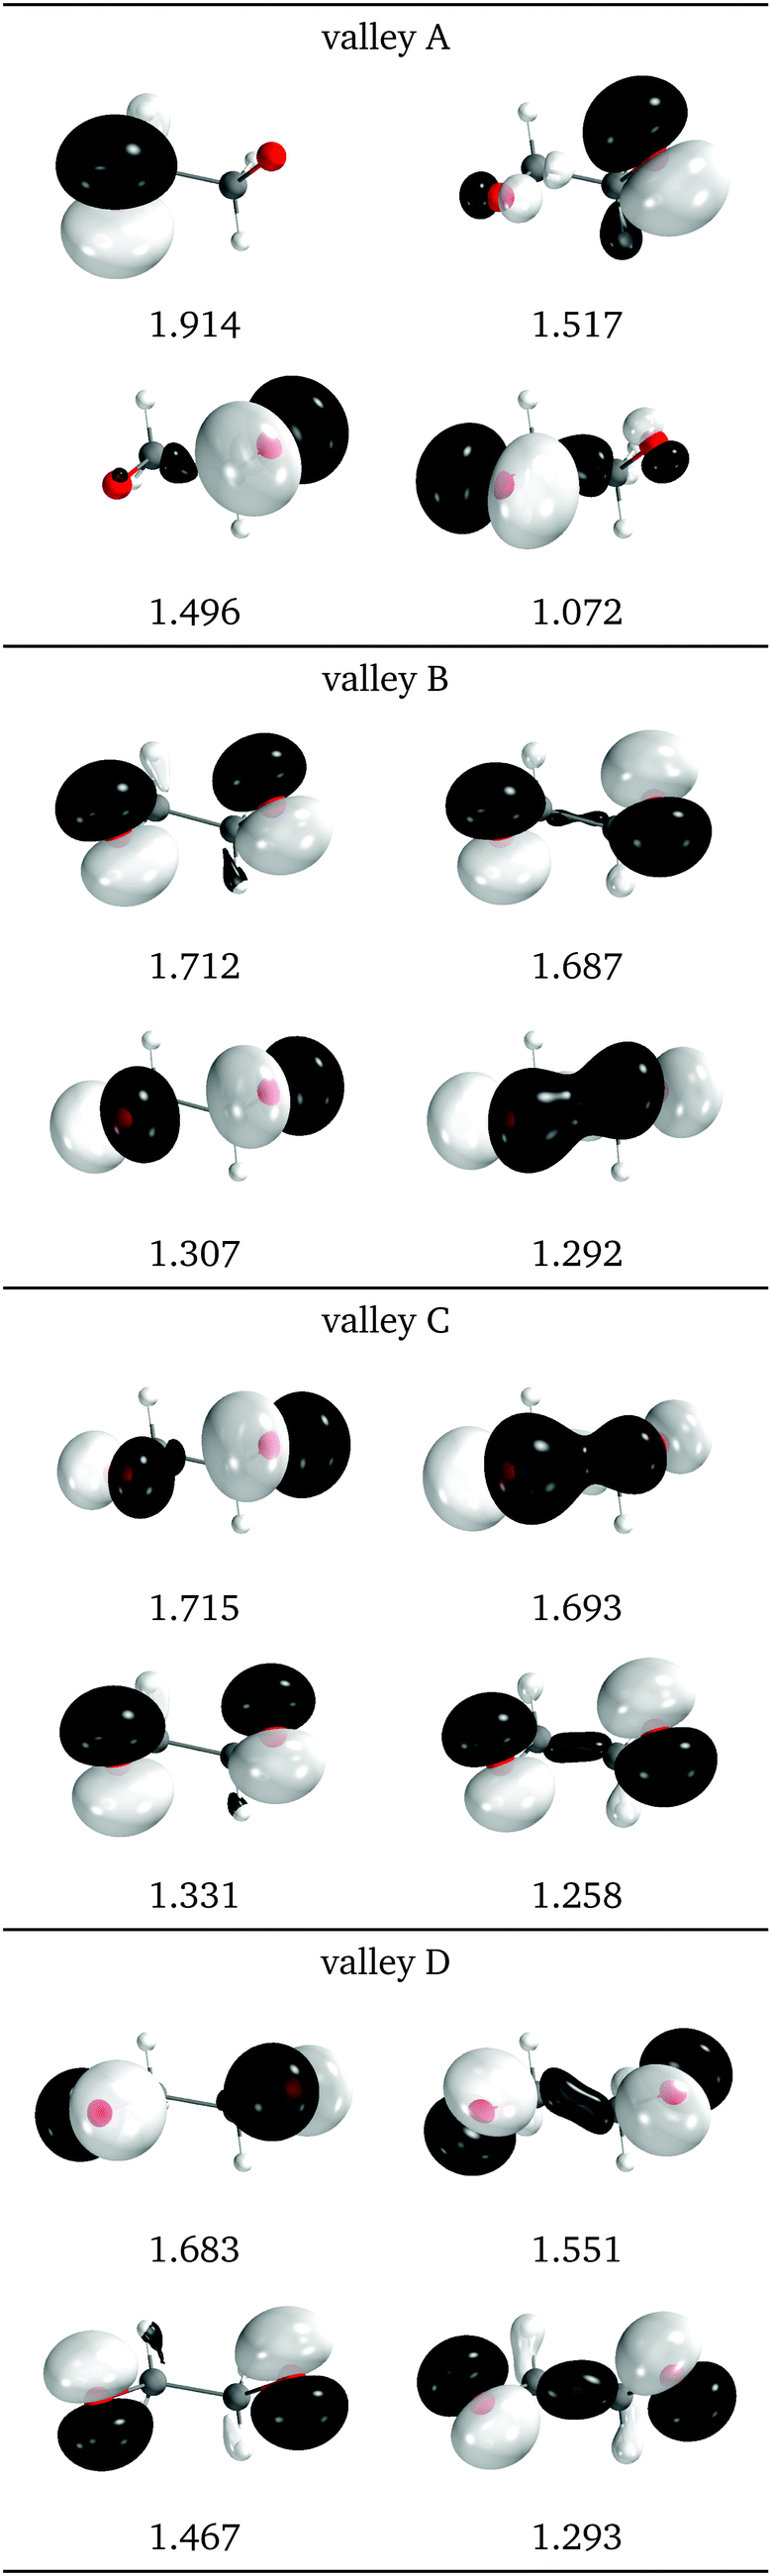 | ||
| Fig. 15 Relevant natural intersection orbitals and occupation numbers for the four valleys in 0Me, at a reference dihedral of 47.6°. The other NIOs are very similar in all four valleys. The molecule is viewed from the top, as represented in Fig. 4, with the oxygens pointing towards the viewer. | ||
4.4 Comparison
In spite of the evident differences, there are some common traits among the CI seams found for the three studied molecules. In all three molecules the CI energy quickly falls below the initial TS energy, and even below the energy of the reference trajectory, making the seam easily accessible, at least from the energetic point of view. After a reference O–C–C–O dihedral of 40°, the CI seam valleys can be found at an rmsd relative to the reference trajectory below 0.1 Å in most cases. At the TS structure, CI seams tend to be found at longer C–C distances, and as the reference trajectory progresses CI structures keep smaller O–C–C angles than the corresponding reference trajectory. A region of negative αs is found for reference dihedrals around 40°. Interestingly, this matches roughly with the region where most transitions to an upper state occurred in surface-hopping simulations of 0Me.27 At larger reference dihedrals we could also find CI structures with very small or negative αs (valley B for 2Me and 1Me), or indications that they may exist (valley C for 0Me). At least in the 2Me and 0Me cases, these correspond to crossings between the initial states and
and  , and have similar NIOs. It should be kept in mind that the fact that a valley becomes unstable outside some range does not mean that the seam disappears, it only means that the seam is no longer at a minimum in the optimization space (hyperplane perpendicular to the trajectory, in this case). The possible CI structures accessible to the system are certainly not limited to either MECIs, or seam valleys. Moreover, despite our efforts to follow all the different CI valleys, the results are far from exhaustive, and are undoubtedly biased by the strategy used in the optimization.
Can the calculated different CI topographies explain the different chemiexcitation yields obtained in 1,2-dioxetanes? The negative or low αs angles obtained for conical intersections at large dihedral angles in 1Me and 2Me might facilitate chemiexcitation in those molecules, as compared to 0Me. However, energetically and geometrically, the differences between the CI seams of the three molecules do not appear to be significant. This finding is in agreement with the previous dynamical study that showed that most of the difference in chemiexcitation yield is due to a mass effect.32
5 Conclusions
We have studied the conical intersection seams of 1,2-dioxetane and methylated derivatives, using a multi-reference electronic structure method. Our calculations have demonstrated, for each compound, the existence of several seams in the vicinity of the nuclear trajectory describing the ground state decomposition pathway into two formaldehyde molecules. We have analysed each of these conical intersection seams using detailed and new descriptors. More specifically, the seams have been characterized in terms of their energetic accessibility and geometrical distance from the ground state decomposition pathway, their degree of “slopedness” using the angle αs, and specific nuclear coordinates such as bond lengths and angles. In addition, in order to characterize the electronic states involved in the CI seams, we have calculated the electronic space spanned by the intersecting states and compared it with the electronic space of different sets of states from the reference trajectories. We have also calculated “natural intersection orbitals” as eigenvectors of the average density matrix of the crossing states. Interestingly, those indicate that the different intersection seams involve different pairs of “diabatic” states.For all three studied molecules, the intersection seam is relatively close (in both energy and geometry) from the ground state decomposition pathway. More precisely, the energies of the intersection seams are below the one of the ground state decomposition pathway for O–C–C–O dihedral angles larger than approximately 50°. Those regions of the seams are also all relatively geometrically close to the ground state decomposition pathway with an rmsd lower than 0.15 Å. There, the O–C–C angles range from 104° to 114° (they are symmetric for some intersection seams and asymmetric for others), while the C–C bond length ranges from 1.56 Å to 1.57 Å and a bit larger for 2Me.
The CI topography seems to favor chemiexcitation in certain parts of the seams. For all three molecules, the optimized conical intersections are sloped for small O–C–C–O dihedral angles: αs < 0. This is consistent with the numerous hops from the ground state to the first excited state and the longer time spent in the excited states predicted to occur for low O–C–C–O dihedral angles in the nonadiabatic surface hopping simulations of 1,2-dioxetane of ref. 27. For larger O–C–C–O dihedral angles, we could optimize conical intersections with relatively low αs angles for both 1Me and 2Me (even αs < 0 for 1Me), while we could not find optimized conical intersections with αs < 30° for 0Me.
While the latter fact could contribute to the higher chemiexcitation yield measured for the methylated derivatives, the absence of significant differences between the topography of the conical intersection seams of the different molecules seems to indicate that the increase of chemiexcitation yield upon methylation does not come from a “static” origin. Our results are thus consistent with and complement the nonadiabatic surface hopping simulations of 1,2-dioxetane and methylated derivatives that showed that most of the increase of chemiexcitation yield upon methylation comes from a mass effect, hence a dynamical origin.32 It would be interesting to re-visit our previous dynamics results in the light of the new knowledge acquired in the present static study: in a future work, we could for instance analyze which conical intersection seam valley is used in the non-adiabatic transitions from the electronic ground state to the first excited state.
It is reminded that the yield of the triplet excited states was measured to be much higher than that of the singlet excited states.31 While the triplet excited state may behave similarly to the singlet excited state, future similar analysis of the intersystem crossings would provide complementary insights into the chemiexcitation and chemiluminescence of 1,2-dioxetanes.
Conflicts of interest
There are no conflicts to declare.Acknowledgements
The computations were partially enabled by resources provided by the Swedish National Infrastructure for Computing (SNIC) at UPPMAX and NSC, partially funded by the Swedish Research Council through grant agreement no. 2018-05973. M. V. acknowledges the Région des Pays de la Loire for financial support through the framework of the PULSAR programme. I. F. G. acknowledges the Institut Français de Suède for financial support through the FRÖ programme.Notes and references
- M. Klessinger, Angew. Chem., Int. Ed. Engl., 1995, 34, 549–551 CrossRef CAS.
- F. Bernardi, M. Olivucci and M. A. Robb, Chem. Soc. Rev., 1996, 25, 321–328 RSC.
- W. Domcke and D. R. Yarkony, Annu. Rev. Phys. Chem., 2012, 63, 325–352 CrossRef CAS PubMed.
- M. Vacher, I. Fdez Galván, B.-W. Ding, S. Schramm, R. Berraud-Pache, P. Naumov, N. Ferré, Y.-J. Liu, I. Navizet, D. Roca-Sanjuán, W. J. Baader and R. Lindh, Chem. Rev., 2018, 118, 6927–6974 CrossRef CAS PubMed.
- I. Navizet, Y.-J. Liu, N. Ferré, D. Roca-Sanjuán and R. Lindh, ChemPhysChem, 2011, 12, 3064–3076 CrossRef CAS PubMed.
- H. H. Seliger and W. D. McElroy, Proc. Natl. Acad. Sci. U. S. A., 1964, 52, 75–81 CrossRef CAS PubMed.
- S. H. D. Haddock, M. A. Moline and J. F. Case, Annu Rev. Mar. Sci., 2010, 2, 443–493 CrossRef PubMed.
- E. A. Widder, Science, 2010, 328, 704–708 CrossRef CAS PubMed.
- R. E. Young and F. M. Mencher, Science, 1980, 208, 1286–1288 CrossRef CAS PubMed.
- B. H. Robison, J. Mar. Biol. Assoc. U. K., 1992, 72, 463–472 CrossRef.
- B. H. Robison, K. R. Reisenbichler, J. C. Hunt and S. H. D. Haddock, Biol. Bull., 2003, 205, 102–109 CrossRef PubMed.
- S. Johnsen, Integr. Comp. Biol., 2005, 45, 234–246 CrossRef PubMed.
- J. E. Purcell, Science, 1980, 209, 1045–1047 CrossRef CAS PubMed.
- R. H. Douglas, J. K. Bowmaker and C. W. Mullineaux, Bioluminescence and Chemiluminescence, World Scientific, 2002, pp. 391–394 Search PubMed.
- S. H. D. Haddock, C. W. Dunn, P. R. Pugh and C. E. Schnitzler, Science, 2005, 309, 263 CrossRef CAS PubMed.
- A. B. Lall, H. H. Seliger, W. H. Biggley and J. E. Lloyd, Science, 1980, 210, 560–562 CrossRef CAS PubMed.
- W. A. Woods, Jr., H. Hendrickson, J. Mason and S. M. Lewis, Am. Nat., 2007, 170, 702–708 CrossRef PubMed.
- P. J. Herring, J. Mar. Biol. Assoc. U. K., 2007, 87, 829–842 CrossRef CAS.
- J. G. Morin and A. C. Cohen, J. Crustacean Biol., 2010, 30, 56–67 CrossRef.
- C. Dodeigne, L. Thunus and R. Lejeune, Talanta, 2000, 51, 415–439 CrossRef CAS PubMed.
- S. Daunert and S. K. Deo, Photoproteins in Bioanalysis, Wiley-VCH Verlag GmbH & Co. KGaA, 2006, pp. 235–240 Search PubMed.
- S. Beck and H. Koster, Anal. Chem., 1990, 62, 2258–2270 CrossRef CAS PubMed.
- V. N. Nori and J. M. Seitzman, Proc. Combust. Inst., 2009, 32, 895–903 CrossRef CAS.
- P. Stella, M. Kortner, C. Ammann, T. Foken, F. X. Meixner and I. Trebs, Biogeosciences, 2013, 10, 5997–6017 CrossRef CAS.
- S. Ripp, K. A. Daumer, T. McKnight, L. H. Levine, J. L. Garland, M. L. Simpson and G. S. Sayler, J. Ind. Microbiol. Biotechnol., 2003, 30, 636–642 CrossRef CAS PubMed.
- L. De Vico, Y.-J. Liu, J. W. Krogh and R. Lindh, J. Phys. Chem. A, 2007, 111, 8013–8019 CrossRef CAS PubMed.
- M. Vacher, A. Brakestad, H. O. Karlsson, I. Fdez. Galván and R. Lindh, J. Chem. Theory Comput., 2017, 13, 2448–2457 CrossRef CAS PubMed.
- L. Yue, Z. Lan and Y.-J. Liu, J. Phys. Chem. Lett., 2015, 6, 540–548 CrossRef CAS PubMed.
- L. Yue and Y.-J. Liu, J. Chem. Theory Comput., 2019, 15, 1798–1805 CrossRef CAS PubMed.
- L. Yue and Y.-J. Liu, J. Chem. Theory Comput., 2021, 17, 3483–3494 CrossRef CAS PubMed.
- W. Adam and W. J. Baader, J. Am. Chem. Soc., 1985, 107, 410–416 CrossRef CAS.
- M. Vacher, P. Farahani, A. Valentini, L. M. Frutos, H. O. Karlsson, I. Fdez. Galván and R. Lindh, J. Phys. Chem. Lett., 2017, 8, 3790–3794 CrossRef CAS PubMed.
- I. Fdez. Galván, M. G. Delcey, T. B. Pedersen, F. Aquilante and R. Lindh, J. Chem. Theory Comput., 2016, 12, 3636–3653 CrossRef PubMed.
- J. P. Malhado and J. T. Hynes, J. Chem. Phys., 2016, 145, 194104 CrossRef PubMed.
- G. J. Atchity, S. S. Xantheas and K. Ruedenberg, J. Chem. Phys., 1991, 95, 1862–1876 CrossRef.
- D. R. Yarkony, Conical Intersections. Electronic Structure, Dynamics & Spectroscopy, World Scientific, 2004, pp. 41–127 Search PubMed.
- D. R. Yarkony, J. Phys. Chem. A, 2001, 105, 6277–6293 CrossRef CAS.
- L. Blancafort, B. Lasorne, M. J. Bearpark, G. A. Worth and M. A. Robb, The Jahn–Teller Effect, Springer, Berlin Heidelberg, 2009, pp. 169–200 Search PubMed.
- F. Plasser, M. Ruckenbauer, S. Mai, M. Oppel, P. Marquetand and L. González, J. Chem. Theory Comput., 2016, 12, 1207–1219 CrossRef CAS PubMed.
- Å. Björck and G. H. Golub, Math. Comput., 1973, 27, 579 CrossRef.
- B. G. Levine, J. D. Coe and T. J. Martnez, J. Phys. Chem. B, 2008, 112, 405–413 CrossRef CAS PubMed.
- J. M. Anglada and J. M. Bofill, J. Comput. Chem., 1997, 18, 992–1003 CrossRef CAS.
- L. De Vico, M. Olivucci and R. Lindh, J. Chem. Theory Comput., 2005, 1, 1029–1037 CrossRef CAS PubMed.
- B. O. Roos, P. R. Taylor and P. E. M. Sigbahn, Chem. Phys., 1980, 48, 157–173 CrossRef CAS.
- B. O. Roos, Advances in Chemical Physics, John Wiley & Sons, Inc., 1987, vol. 69, pp. 399–445 Search PubMed.
- B. O. Roos, R. Lindh, P.-Å. Malmqvist, V. Veryazov and P.-O. Widmark, J. Phys. Chem. A, 2004, 108, 2851–2858 CrossRef CAS.
- F. Aquilante, L. Gagliardi, T. B. Pedersen and R. Lindh, J. Chem. Phys., 2009, 130, 154107 CrossRef PubMed.
- I. Fdez. Galván, M. Vacher, A. Alavi, C. Angeli, F. Aquilante, J. Autschbach, J. J. Bao, S. I. Bokarev, N. A. Bogdanov, R. K. Carlson, L. F. Chibotaru, J. Creutzberg, N. Dattani, M. G. Delcey, S. S. Dong, A. Dreuw, L. Freitag, L. M. Frutos, L. Gagliardi, F. Gendron, A. Giussani, L. González, G. Grell, M. Guo, C. E. Hoyer, M. Johansson, S. Keller, S. Knecht, G. Kovačević, E. Källman, G. Li Manni, M. Lundberg, Y. Ma, S. Mai, J. P. Malhado, P. Å. Malmqvist, P. Marquetand, S. A. Mewes, J. Norell, M. Olivucci, M. Oppel, Q. M. Phung, K. Pierloot, F. Plasser, M. Reiher, A. M. Sand, I. Schapiro, P. Sharma, C. J. Stein, L. K. Sørensen, D. G. Truhlar, M. Ugandi, L. Ungur, A. Valentini, S. Vancoillie, V. Veryazov, O. Weser, T. A. Wesołowski, P.-O. Widmark, S. Wouters, A. Zech, J. P. Zobel and R. Lindh, J. Chem. Theory Comput., 2019, 15, 5925–5964 CrossRef PubMed.
Footnote |
| † Electronic supplementary information (ESI) available: Transition dipole moments along the reference trajectories. Geometries of the three studied molecules, 0Me, 1Me and 2Me, for the reference trajectories, and for the optimized conical intersection “valleys”. See DOI: 10.1039/d1cp05028a |
| This journal is © the Owner Societies 2022 |