Femtosecond dynamics of stepwise two-photon ionization in solutions as revealed by pump–repump–probe detection with a burst mode of photoexcitation†
Hikaru
Sotome
 *,
Masafumi
Koga
 ,
Tomoya
Sawada
and
Hiroshi
Miyasaka
 *
*
Division of Frontier Materials Science and Centre for Advanced Interdisciplinary Research, Graduate School of Engineering Science, Osaka University, 1-3 Machikaneyama, Toyonaka, Osaka 560-8531, Japan. E-mail: sotome@laser.chem.es.osaka-u.ac.jp; miyasaka@chem.es.osaka-u.ac.jp
First published on 25th April 2022
Abstract
Pump–repump–probe spectroscopy with a burst mode of photoexcitation was applied to the direct observation of the photoionization dynamics of perylene in the solution phase. Irradiation of a pump pulse train generated with birefringent crystals effectively accumulated an intermediate S1 state and a repump pulse triggered photoionization in the higher excited state, ensuring sufficiently large signal intensity to probe. Two-photon excitation to the energy level, which is 0.7 eV lower than the ionization potential in the gas phase, results in instantaneous formation of the radical cation of perylene in acetonitrile, unlike aromatic amines in previous reports. In addition, subsequent recombination dynamics between the radical cation and ejected electron was monitored in polar and nonpolar solvents. The ultrafast recombination in nonpolar solvents suggests that the distribution of the distance in the cation-ejected electron pair largely evolves even in acetonitrile in the femtosecond timescale, in which the solvation is not completed and the dielectric constant is still low. The recombination process in acetonitrile was well reproduced with simulations based on the Smoluchowski equation taking account of the transient change in the dielectric constant by solvation.
Introduction
A molecule inherently possesses various electronic excited states, each of which has its own properties depending on the electronic structure. Thus, tuning the energy and mode of the excitation for transition could open state-selective chemical outputs. Actually, various photoreactions depending on the electronic state have been reported for small molecules1 but, for rather large molecules, it is usually difficult to find photochemical responses in higher excited states owing to rapid relaxation to the lowest excited state, which is known as Kasha's rule.2,3 However, several specific responses in higher excited states have been reported for large molecules in the condensed phase,4–6 which have been regarded as a new subject leading to realization of new photoresponses and functions.4Ionization is one of the representative responses taking place in the electronic state at high energy levels and, in the condensed phase, it can take place with energy lower than that in the gas phase.7–9 Although a dielectric response of the environment such as the solvation process contributes to the stabilization of the ionized state, the lifetime of higher excited states is generally in the time region ≤sub-ps, which is shorter than or comparable with the solvation times of most of the solvents. Hence, several mechanisms, such as photo-detachment via electron transfer from highly excited states to solvents,10–12 contribution of specific electronic states,13–16 and so forth,17,18 have been proposed for the ionization process in the condensed phase.
Not only the mechanism but also an initial distance in the electron–cation pair in the photoionization has been studied by scavenging reactions of the ejected electron and dynamics of the recombination. From these studies, the initial electron–cation distance by the photoionization has been estimated to be 3–4 nm in the condensed phase,18–20 which is several to ten times longer than that for the photoinduced intermolecular electron transfer. As a result of this long distance, suppression of the geminate recombination and acceleration of the ionic dissociation into free ions could be achieved owing to the decrease in the Coulombic attraction as well as the electronic interaction between the cationic and anionic species. Actually, we recently demonstrated that a charge-separated state produced by the capture of the electron from the higher excited state and/or ionized state could result in the formation of a long-lived charge-separated state (>5 μs) without a remarkable geminate recombination in the subnanosecond to nanosecond time scale.21
Although mechanisms of photoionization with low energy and the properties of the ionic state thus produced involve important subjects, details of these have not been well elucidated owing to the difficulties in the ultrafast time-resolved measurements arising from the generation of ultrafast laser pulses in the wavelength region corresponding to the ionization energy, ≪250 nm, and the selective excitation of the solute molecules by avoiding the one-photon and/or off-resonant simultaneous multiphoton excitation of the solvent.22–25
Resonant double-pulse femtosecond excitation is an effective method to selectively excite the target molecule to higher electronic states. The first pulse prepares the excited state molecule in the S1 state in most of the cases and the second pulse resonant to the Sn ← S1 absorption pumps the molecule into the highly excited state. The dynamics after the second laser pulsed excitation can be detected as time evolution of transient absorption spectra. Although this method has been applied to the detection of isomerization reactions in the higher excited states,26–32 electron transfer and subsequent ion-pair dynamics,33–36 and photoinduced carrier dynamics in photovoltaics,37–40 a standing problem in this method is its extremely small signal amplitude due to the limited number of highly excited states attained by the double excitation. To overcome this limitation in the present work, we constructed a signal-enhanced pump–repump–probe (SE-PRP) spectroscopic system that dramatically amplifies the population of the target state formed by the sequential excitation and boosts up a signal-to-noise ratio of the measurements. By applying this system, we detected the dynamics of two-photon ionization reactions in polar and nonpolar solutions and estimated the initial electron–cation distance in the present study.
Experimental
Steady-state measurements and samples
Steady-state absorption spectra were recorded on a Hitachi U-3500. Perylene (FUJIFILM Wako) was used after recrystallization from ethanol. Acetonitrile (FUJIFILM Wako, infinity pure grade), n-hexane (FUJIFILM Wako, infinity pure grade), and cyclohexane (FUJIFILM Wako, for Spectrochemical Analysis) were used as received. The concentration of perylene was typically 2.1 × 10⁻⁴ M. The solution sample was filled into a home-built rotation cell with 1 mm-thick quartz windows and a Teflon spacer for adjustment of optical length (0.1–2 mm thickness). During the time-resolved measurements, the rotational motion provided a fresh portion of the sample solution with individual optical pulses. All the measurements were performed at 22.5 ± 1 °C.Burst mode of photoexcitation
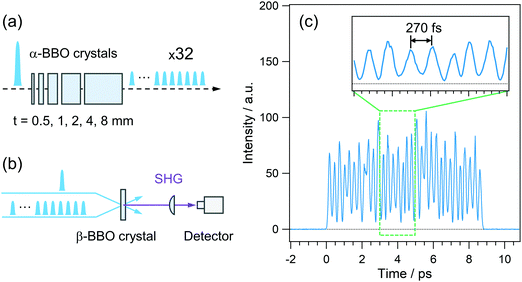
The pulsed light source of the SE-PRP setup was a Ti:Sapphire regenerative amplifier (Spectra-Physics, Spitfire, 802 nm, 1 mJ, 100 fs, 1 kHz) combined with an oscillator (Spectra-Physics Tsunami). As mentioned in the introductory section, the population of the intermediate state for the second photon excitation is usually small in the conventional PRP experiments as shown in Fig. 1(a). To effectively populate molecules in the intermediate state without undesirable additional phenomena induced by the high peak intensity of a femtosecond laser pulse, we converted a single intense pump pulse at 802 nm to temporally dispersed sequential pulses, as shown in Fig. 1(b). To generate a train of a few tens of pump pulses, we employed birefringent crystals with distinct refractive indices (no and ne) along the ordinary and extraordinary axes. An incident optical pulse whose polarization is tilted to the two axes by 45 degree can be split into two pulses with perpendicular polarization to each other (see details in the ESI†). The polarizer behind the crystal extracts the parallel component of individual pulses to the orientation of the polarizer. As a result, this procedure generates a pair of pulses with a time interval depending on the crystal thickness and difference in the refractive indices between no and ne. Repeating this pulse splitting with multiple birefringent crystals enables generation of a pulse train.41 In the present study, we used 5 alpha-BBO crystals with thicknesses of 0.5, 1, 2, 4, and 8 mm (FOCtek Photonics, custom-made) as shown in Fig. 2(a), so as to obtain a pulse train in which each of the pulses has rather constant intensity (see details in the ESI†).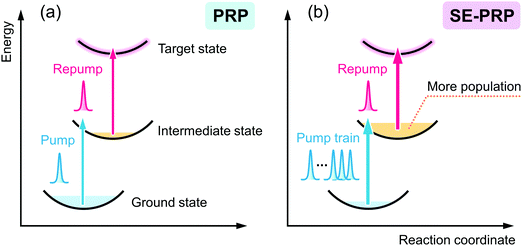 | ||
| Fig. 1 Schematic illustrations of (a) pump–repump–probe (PRP) spectroscopy and (b) signal-enhanced pump–repump–probe (SE-PRP) spectroscopy proposed in the present work. | ||
The time profile of the pulse train thus generated was measured by the SHG correlation with an 802 nm laser pulse, the schematic illustration of which is shown in Fig. 2(b). As shown in Fig. 2(c), rather constant intensity was obtained for each of the pulses in a train, which can avoid the nonlinear phenomena induced by the high-intensity pulse in a train. The typical energy of the train at 401 nm is ca. 10 μJ with an input of 90 μJ at 802 nm. Although 5 alpha-BBO crystals generated the pulse train ranging at ca. 9 ps in the present study, it is possible to shorten the irradiation time by reducing the number of crystals. A shorter irradiation time enables us to effectively accumulate the population of the intermediate state with a shorter lifetime than the present irradiation time of ca. 9 ps although it slightly increases the peak intensity and risk for non-linear optical effects and the damage to samples. Therefore, it is important to optimize the irradiation time by adjusting the number of crystals for each sample of interest. In addition, the wavelength applicability is also crucial for the photoexcitation of various sample systems. As mentioned above, the time spacing between the adjacent pulses is determined by no − ne, and this value is limited in the range of 0.12–0.14 at 300–1200 nm, which was calculated using the Sellmeier equation. Thus, tuning the pump wavelength does not lead to a dramatic change of the irradiation time of the pulse train. In the actual use, on the other hand, the wavelength tunability is dominated by the wavelength range of the anti-reflection (AR) coating on the crystals. The alpha-BBO crystals used in the present work have the AR coating in the range of 600–800 nm. In this sense, not only the fundamental of Ti:Sapphire lasers but also the output at 600–800 nm of the OPA system can be converted to the pulse train. Further extension of the wavelength applicability can be realized by changing the wavelength range of the AR coating.
For the temporal stretching of the ultrashort laser pulse, the grating-based technique is a traditional way and also effective in decreasing the peak intensity.42 Compared to the conventional grating method, the main advantage of the present approach using birefringent crystals is that we could obtain the pulse train with each of the pulses having similar intensity. That is, the envelope of the pulse train could be regarded as a square-wave-like light pulse and can prevent the non-linear phenomenon which is induced in the strong part in the Gaussian pulse duration. In addition, the throughput is close to 100% using the crystal array with the AR coating. Furthermore, the birefringent crystal array easily inserts into the path of the pump beam without a major change of the optical path length, while the grating stretcher requires an additional optical pathlength of the pump beam, which also needs to elongate repump and probe pathlengths for their matching.
Fig. 3 shows a diagram of the system for transient absorption measurements with the PRP setup. The wavelength of one OPA was tuned to 700 nm and this output or the second harmonics at 350 nm was used as the repump pulse. The remaining fundamental pulse at 802 nm in this OPA was used to obtain the pulse train with 32 pulses at 802 nm. Unlike the characterization of the pulse train in Fig. 2, the polarizer placed behind the crystals (see Fig. S1 and S2, ESI†) was removed so as to maximize the pump energy and excitation portion. The pulse train at 802 nm was further converted into the second harmonics at 401 nm via a 1 mm beta-BBO crystal and used as the pump beam. The other OPA generated a near-infrared pulse at 1180 nm, which was focused into a 2 mm CaF2 plate for the generation of a white light continuum (WLC) as the probe pulse covering transient absorption spectra from 385 to 985 nm. The probe pulse was divided into signal and reference pulses, and the signal pulse was focused to the sample with a concave mirror together with the pump and repump pulses. The signal pulse passing through the sample and the reference one were detected by a pair of photodiode arrays. The polarization of the repump pulse was set to the magic angle with respect to that of the probe pulse. Pump–repump and repump–probe time delays were independently controlled with two delay stages (Delays 1 and 2). Irradiation of the repump pulse was modulated with an optical chopper (Newport, 3501), and the transient absorption signal (ΔA) was defined as an absorbance change between in the presence and absence of the repump pulse (ΔARepump![[thin space (1/6-em)]](https://www.rsc.org/images/entities/char_2009.gif) ON − ΔARepump
ON − ΔARepump![[thin space (1/6-em)]](https://www.rsc.org/images/entities/char_2009.gif) OFF).
OFF).
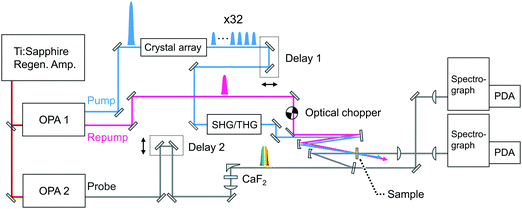 | ||
| Fig. 3 Schematic diagram of the SE-PRP setup. OPA: Optical parametric amplifier, SHG: second harmonics generation, THG: third harmonics generation, PDA: photodiode array. | ||
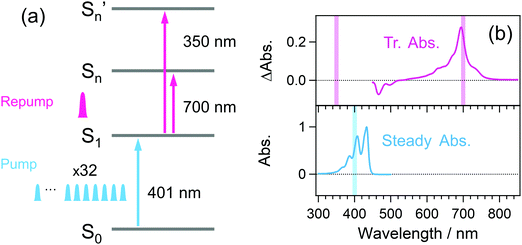
Fig. 4(a) and (b) respectively show the photoexcitation scheme and the steady-state and time-resolved absorption of perylene. Detailed spectroscopic properties35,36,43 such as the molar absorption coefficient so far accumulated allow the quantitative discussion on the excitation portion. The pump pulse train at 401 nm is resonant with the absorption from the ground state to the vibrationally excited level of the S1 state, and the repump pulse at 700 nm is resonant with the absorption from the S1 state to the higher state (Sn state). The 350 nm repump pulse pumps up the S1 molecule to a distinct higher excited state (Sn′ state) although its resonance is elusive because of the limited wavelength range of the TA setup.
Results and discussion
Performance of the burst-mode excitation
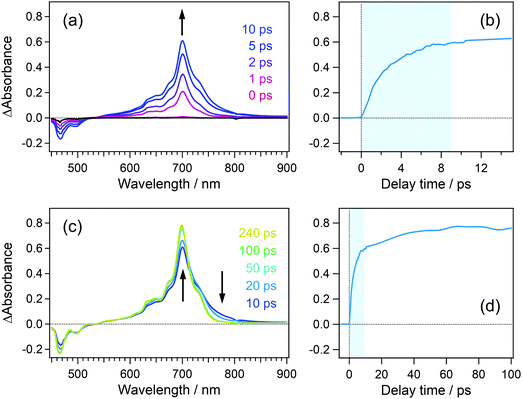
In order to confirm the effective accumulation of the population of intermediate species, we measured transient absorption using a pulse train as a pump beam. Fig. 5(a) shows the transient absorption spectra of perylene in acetonitrile solution excited with a pulse train at 401 nm, the total intensity of which was ca. 10 μJ. A positive band grew up around 700 nm in the initial 10 ps together with a negative one in the wavelength region shorter than 540 nm. The former and latter signals are respectively ascribable to the absorption and stimulated emission of the S1 state of perylene. The gradual rise looks more apparent in the time profile shown in Fig. 5(b). A closer look at this profile revealed that transient absorbance linearly increased within ca. 2 ps, which is followed by saturation tendency until ca. 9 ps. This saturation originates from two factors such as a significant decrease of the S0 population under the irradiation of the pump pulse train and the Sn ← S1 absorption in competition with the S1 ← S0 absorption. However, it should be noted that nonlinearly produced species such as the radical cation of perylene, which shows an absorption band at 535 nm, is not observed in these spectra.In the time region longer than 10 ps where the irradiation of the pulse train is completed, the transient absorbance at 700 nm is still on the rise together with the decrease in the absorbance in the wavelength range >700 nm. These spectral evolutions are ascribable to the dissipation process of the vibrational excess energy in the S1 state (thermalization by a cooling process). The transient absorbance of the S1 state after this relaxation was 0.78 at 698 nm and it can be estimated that 39% of the molecules was pumped up to the S1 state on the basis of the molar absorption coefficient of the S1 state.44 This value is almost 10 times larger than that in conventional pump–probe TA spectroscopy using a single femtosecond excitation pulse.
Ionization dynamics in acetonitrile solution
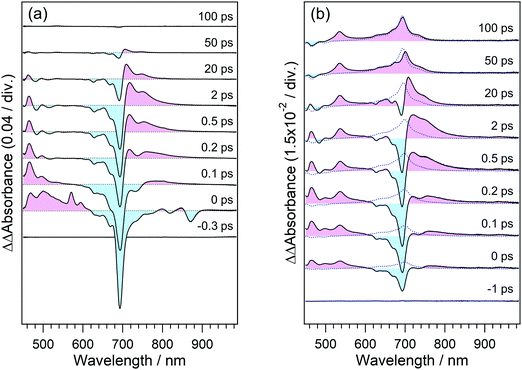
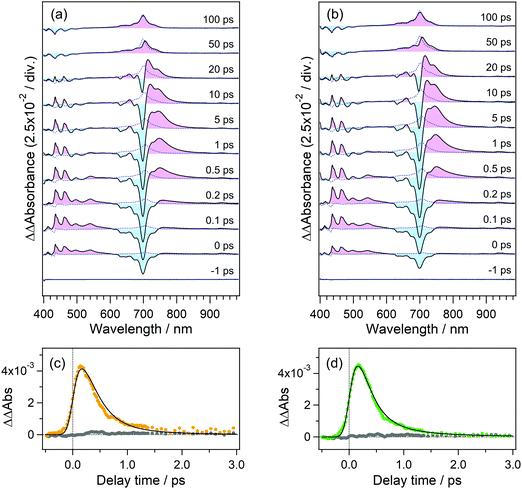
To elucidate the dynamics in the higher excited state, we applied the PRP setup to the transient absorption measurement of perylene in acetonitrile solution. In this measurement, the time interval between the first pulse in the pump pulse train and repump pulse was set to 100 ps, and the repump–probe delay was scanned as Δt. The time interval of 100 ps is long enough for the molecule excited by the first pulse to vibrationally relax to the thermal equilibrium after the dissipation of the vibrational excess energy, as is shown in Fig. 5(d).Fig. 6(a) shows the transient absorption spectra of perylene in acetonitrile doubly excited with pump and repump pulses at 401 and 700 nm. The spectrum at the time origin shows a prominent negative band around 700 nm and a positive one at 500–600 nm. The former negative band is due to the bleaching signal of the S1 state and the latter one is ascribable to the highly excited state. The absorption of the highly excited state decreases within 0.2 ps concomitantly with partial recovery of the S1 bleaching signal. It is worth mentioning that the signal intensities of ΔA absorbance for these two features are respectively −0.15 and +0.03, which are one order of magnitude larger than those detected by typical PRP spectroscopy. With the decay of this highly excited state, another positive feature shows up in a longer wavelength region than 700 nm. This absorption band is ascribable to the hot band of the S1 state with large vibrational excess energy. A positive band in the wavelength region <550 nm is an inverted signal of the stimulated emission of the relaxed S1 state, which appears due to the formation of the hot S1 state. With an increase in the delay time, these signals decrease and no signal remains at 100 ps, indicating that the highly excited state produced by the repump excitation at 700 nm perfectly recovered to the initial S1 state, and no additional reaction takes place in the highly excited state.
To elucidate the dynamics in a much higher excited state, we used a 350 nm laser light for the repump pulse. Fig. 6(b) shows the transient absorption spectra of perylene excited at 401 and 350 nm. The transient spectrum around the time origin shows positive and negative bands in 500–600 and 600–750 nm. In addition to these signals, the spectrum clearly shows the absorption band of the radical cation of perylene around 535 nm,45 which was not detected under the 700 nm repump conditions. At and after ca. 0.3 ps following the introduction of the 350 nm laser pulse, positive absorption signals appear in the wavelength region >710 nm, which is ascribable to the hot band of the S1 state. Compared with the results in Fig. 6(a) with the repump pulse at 700 nm, the hot band by the 350 nm second pulse excitation extends to a longer wavelength region, indicating that the S1 molecules produced from a highly excited state hold larger vibrational excess energy. The positive band in the wavelength region longer than 800 nm may contain the absorption of the anionic species of acetonitrile46 produced from the electron ejected from perylene, although their molar absorption coefficients are relatively smaller than the S1 state and radical cation of perylene.
The spectrum at 100 ps shows a positive absorption band due to the S1 state of perylene at 700 nm, in addition to the band of the radical cation at 535 nm. This is due to the direct excitation of the S0 state of perylene through the weak absorption at 350 nm (1000 M−1 cm−1).43 To quantitatively confirm this additional S1 absorption band, we measured the transient absorption spectra of the same sample solution excited only by the pulse at 350 nm, which are shown as blue dotted curves in Fig. 6(b). The agreement of the spectra around 700 nm clearly indicates that the S1 absorption band remaining at 100 ps is due to the excitation of the S0 state by the pulse at 350 nm. It should be noted that the absorption band due to the radical cation is absent in the spectra measured under the excitation of the single pump at 350 nm. This result safely excludes a possibility that the radical cation is produced by ionization under the single pulse irradiation at 350 nm.
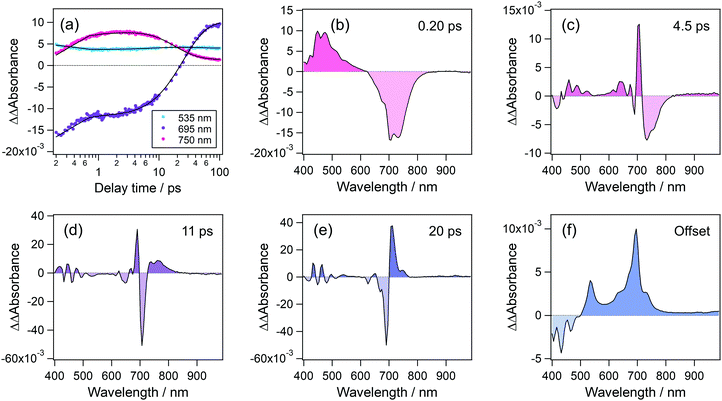
To elucidate the formation process of the radical cation, we analyzed the temporal evolution of transient absorption spectra. Fig. 7(a) shows time profiles of transient absorption signals at 535, 695, and 750 nm, respectively corresponding to the absorption maxima of the radical cation, S1 state and the absorption signal due to the hot band of the S1 state. These time profiles were reproduced by a quadruple-exponential function with an offset component and the decay-associated spectra (DAS) of these time constants are shown in Fig. 7(b)–(f). DAS for the fastest time constant, 0.2 ps, shows positive and negative components in the wavelength regions of <620 nm and 620–840 nm, which respectively correspond to the decay and rise of absorption signals. These results indicate that the species produced by the second photon excitation of the S1 state undergoes internal conversion to the S1 state at a high vibrational level. The second DAS with a time constant of 4.5 ps shows a prominent positive peak at 705 nm together with a negative component at 715–820 nm. In addition, the third and fourth DASs (11 ps and 20 ps) are also characterized by a differential spectral pattern. These alternate positive and negative signatures indicate that the DASs with 4.5, 11, and 20 ps describe a continuous shift toward the shorter wavelength. Actually, the blue shift of absorption bands is typical evidence for the vibrational cooling, and the spectral shape of the above DASs indicates that the hot S1 state undergoes the relaxation to the equilibrated S1 state in a few tens of picoseconds. The offset (long-living component in this time window) component shows the absorption due to the radical cation at 535 nm and the S1 state at 695 nm. It should be noted that no remarkable signal around 535 nm, corresponding to the radical cation, was observed in these DASs. This result indicates that the radical cation is produced within the time resolution of the present measurement (<140 fs) and undergoes no remarkable decay at least in several tens of the ps time region.
For the photoionization of amine derivatives33,34 such as N,N,N′,N′-tetramethyl-p-phenylenediamine and N,N-dimethylaniline, it was observed that the sequential two-photon excitation to the energy level 0.8–0.9 eV lower than the ionization potential in the gas phase led to the slow ionization in the sub-ps to several ps time range. These slow ionization processes suggested that the ionization is mediated by an intermediate state such as the Rydberg state.14,15 In contrast, perylene undergoes instantaneous ionization as the radical cation is clearly detected in the transient spectrum at time zero, although the total energy given by the two-photon absorption (6.4 eV)47 is 0.7 eV lower than the ionization potential of perylene in the gas phase (7.1 eV).48 This distinct ionization behavior reveals that the amine substituent plays a critical role in producing the specific electronic excited state before the ionization, as suggested by Tsubomura and Nakato.14,15
Recombination dynamics of the electron–cation pair
To elucidate the time evolution of the electron–cation pair, the dynamics in the ns region was also investigated. As mentioned in the introductory section, the interionic distance of the electron–cation pair after the photoionization has been estimated to be 3–4 nm or longer and this distance strongly affects the recombination process. As will be shown in eqn (1), the analysis of the temporal evolution using a diffusion equation at the Coulombic potential19,49 has been employed for the estimation of this distance. To confirm the validity of this analysis to the ultrafast dynamics, we first elucidated the ionization process in nonpolar solutions where the ionized state undergoes the ultrafast recombination.Fig. 8(a) and (b) show the transient absorption spectra of perylene in n-hexane and cyclohexane, excited with 401 and 350 nm laser pulses. The transient spectra obtained under only 350 nm pulsed irradiation are also shown as blue dotted curves to clearly exhibit the dynamics initiated by the sequential excitation. Although the absorption of the radical cation at 535 nm appears within the response of the apparatus as in acetonitrile, this band decreases in the sub-ps to a few ps time region. This result confirms the rapid recombination of the electron–cation pair.
Time profiles of the transient absorbance of the radical cation of perylene are shown in Fig. 8(c) and (d). The signal of the radical cation rapidly vanishes in both solutions within 1.5 ps. As mentioned above, we employed the diffusion equation at the Coulombic attractive potential, known as the Smoluchowski equation (eqn (1)).19,49
 | (1) |
 | (2) |
The full width at half maximum (FWHM) is given as (2c2![[thin space (1/6-em)]](https://www.rsc.org/images/entities/char_2009.gif) ln
ln![[thin space (1/6-em)]](https://www.rsc.org/images/entities/char_2009.gif) 2)1/2. In the actual calculation, we employed numerical integration of the equation with a time interval of 10−17 second and a spatial interval of 0.01 nm and the FWHM was set to be 0.5 nm. In addition, we assumed that the recombination takes place at 0.7 nm between the cation and the electron within 10 fs. The distance of 0.7 nm has been used as the encounter distance in the recombination process of radical ions produced by general photoinduced electron transfer, and the recombination time constant of 10 fs was assumed to keep the conditions of the diffusion-controlled recombination under the Coulombic field. Time profiles of the radical cation thus calculated are shown in Fig. 8(c) and (d) as black solid lines. The calculated results for n-hexane and cyclohexane systems well reproduce the experimental results, for which the initial electron–cation distances were set to 2.0 and 2.7 nm in n-hexane and cyclohexane, respectively. The above results in nonpolar solvents verified that the Smoluchowski equation is applicable to the analysis of the ultrafast dynamics of the electron–cation pair under the present conditions and could estimate the initial distance of the electron–cation pair.
2)1/2. In the actual calculation, we employed numerical integration of the equation with a time interval of 10−17 second and a spatial interval of 0.01 nm and the FWHM was set to be 0.5 nm. In addition, we assumed that the recombination takes place at 0.7 nm between the cation and the electron within 10 fs. The distance of 0.7 nm has been used as the encounter distance in the recombination process of radical ions produced by general photoinduced electron transfer, and the recombination time constant of 10 fs was assumed to keep the conditions of the diffusion-controlled recombination under the Coulombic field. Time profiles of the radical cation thus calculated are shown in Fig. 8(c) and (d) as black solid lines. The calculated results for n-hexane and cyclohexane systems well reproduce the experimental results, for which the initial electron–cation distances were set to 2.0 and 2.7 nm in n-hexane and cyclohexane, respectively. The above results in nonpolar solvents verified that the Smoluchowski equation is applicable to the analysis of the ultrafast dynamics of the electron–cation pair under the present conditions and could estimate the initial distance of the electron–cation pair.
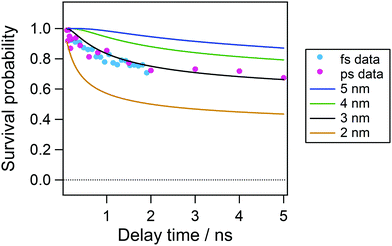
On the basis of the initial electron–cation distance in nonpolar solvents, we analyzed the temporal evolution of the radical cation in acetonitrile in the nanosecond time region. Fig. 9 shows the time profiles of the transient absorption signal at 535 nm after 100 ps following the excitation so as to avoid the effect of the vibrational cooling and the contribution of the decay of the Sn state around the time origin detected by the fs measurements. As is shown by the repump-induced spectra in Fig. 6(b), the absorption of the radical cation is dominant and the contribution of the S1 absorption is negligibly small at 535 nm. In this plot, we also showed the time evolution obtained by the two-photon ionization by the picosecond 355 nm laser pulse to cover a longer time window. Although the first excitation wavelength is different between these two conditions, a rather long pulse duration in the ps laser pulse (fwhm, 15 ps) can allow the formation of the relaxed S1 state during the laser pulse and the total excitation energy could be regarded to be almost similar to each other. Actually, the time profiles in the 0–2 ns time region are almost the same between the two. As shown in this figure, the decay of the radical cation is observed in a few nanoseconds time range and almost constant signal intensity follows in longer time range.
Solid curves in Fig. 9 show the result calculated with initial distances of 2.0–5.0 nm between the cation and the electron, a FWHM value of 0.5 nm, a dielectric constant of 37.5 and a diffusion constant of 2.00 × 10⁻⁹ m2 s−1. As shown in Fig. 9, the curve calculated with the initial distance of 3.0 nm, which is similar to that estimated in cyclohexane solution, shows the best agreement with the experimental result. However, the experimental results are smaller in the time range <2 ns and slightly larger than the calculated curve. This result suggests that the initial distribution of the electron–cation pair has become wider. That is, the population of the electron with the distance close to the cation leads to the recombination in the shorter time region and that with longer distance results in longer survival time.
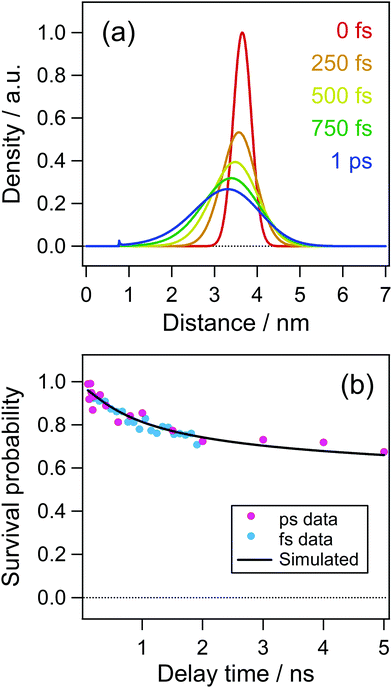
As is shown in Fig. 8(c) and (d), the electron distribution could rapidly change in a low dielectric environment owing to the large Coulombic attractive force and a large diffusion coefficient of the electron.51 Although the dielectric constant of acetonitrile is as large as 37.5 after the dielectric response is finished, it is reported to be ca. 2 before the dielectric response such as the solvation process.52 The solvation time52 in acetonitrile was reported to be τ1 = 0.089 ps and τ2 = 0.63 ps. Accordingly, the initial distribution just after the ejection of the electron could change before the dielectric response. To take this effect into account, we calculated the time evolution of the distribution function for the time up to 1 ps using the dielectric constant of n-hexane (ε = 1.88) and the diffusion coefficient of electrons (1.78 × 10⁻⁷ m2 s−1), results of which are shown in Fig. 10(a). In this calculation, the initial distance of 3.65 nm was used because a remarkable decay of the cation within a few to several tens of ps was not observed in acetonitrile solution as is shown in Fig. 6(b). The time evolution of the distribution function in Fig. 10(a) shows a significant change over a short period of time (1 ps). Fig. 10(b) shows the time profile calculated with the distribution at 1.0 ps in Fig. 10(a) as the initial distribution for the calculation of the dynamics in acetonitrile with the dielectric constant and the diffusion coefficient used in the result in Fig. 9. The curve in Fig. 10 well reproduces the experimental results not only in the early time region but also in the late stage of several nanoseconds.
This rapid change in the distribution function of the electron–cation pair in polar solvents before the solvation can well explain our recent results on the two-photon ionization of pyrene in acetonitrile.21 In this previous report, the decay of the radical cation of pyrene was observed in the time domain of several nanoseconds as observed in the present system. The cation remaining after several ns was about 70% of the initial value at 5 ns. On the other hand, more than 90% of the pyrene cations in the time domain of several ns survived in the solution with biphenyl where biphenyl captured the electron within 200 fs. The rapid capture of the electron could keep the initial distribution, which is far from the cation, and prevents the rapid evolution owing to the smaller diffusion coefficient of the molecular anion. Although more detailed investigation is necessary for the precise elucidation of the evolution of the distribution function of the electron–cation pair, the present results by means of SE-PRP spectroscopy could be effectively used for further studies.
Conclusions
In the present study, we have developed a pump–repump–probe measurement system with a burst mode of photoexcitation, in which the pump pulse train was generated with a birefringent crystal array and used for the effective accumulation of the intermediate state without unwanted nonlinear optical effects.This system was applied to the direct detection of photoionization and subsequent recombination of perylene in the solution phase. While the stepwise two-photon excitation at 401 and 700 nm does not lead to photoionization in acetonitrile due to the lower excitation level, the irradiation of the repump pulse at 350 nm successfully triggers the ionization and formation of the radical cation of perylene. This irradiation of the pump and repump pulses corresponds to the two-photon excitation to the energy level, which is 0.7 eV lower than the ionization potential in the gas phase. It should be noted that the radical cation is produced immediately after the photoexcitation within the time resolution of the measurements. This instantaneous photoionization is markedly different from the ionization of aromatic amines in our previous studies, in which the photoionization takes place in the slower timescale and the formation of the radical cation is rate-limited by the solvation process. In the nanosecond time region, on the other hand, the resultant radical cation undergoes partial recombination with the ejected electron. For the elucidation of this recombination dynamics in both the early and late time regions, we investigated the photoionization and recombination also in nonpolar solvents. The ultrafast recombination within 1 ps originates from the change of the spatial distribution of the ejected electron in such low environments by the diffusion process under the Coulombic attractive force. This behavior suggests that the population function depending on the electron–cation distance evolves even in acetonitrile in the femtosecond timescale, in which the solvation is not completed and the dielectric constant is still lower than the static value. We further performed the simulation based on the Smoluchowski equation to verify the effect of the dielectric change on the recombination dynamics in acetonitrile. It can be considered that the transient change of the dielectric constant well reproduces the experimentally observed recombination process in the overall time region. These results emphasize that the ultrafast solvation in polar solvents is intimately involved in the dielectric environments, and it greatly affects the recombination in the later nanosecond time region. We are now undertaking the detailed investigation of the solvent effect on the initial interionic distance of the electron–cation pair and recombination dynamics by using the Smoluchowski equation taking account of the transient dielectric change.
Conflicts of interest
There are no conflicts of interest to declare.Acknowledgements
This work was supported partly by JSPS KAKENHI Grant Number 21H01889 to HM, 21H01888, 21H05395 and the Research Foundation for Opto-Science and Technology and the Murata Science Foundation to HS.References
- H. Okabe, Photochemistry of Small Molecules, Wiley-Interscience, New York, 1978 Search PubMed.
- M. Kasha, Discuss. Faraday Soc., 1950, 9, 14–19 RSC.
- M. Kasha and S. McGlynn, Annu. Rev. Phys. Chem., 1956, 7, 403–424 CrossRef CAS.
- H. Miyasaka, K. Matsuda, J. Abe and T. Kawai, Photosynergetic Responses in Molecules and Molecular Aggregates, Springer, Singapore, 2020 Search PubMed.
- P. Demchenko, V. I. Tomin and P.-T. Chou, Chem. Rev., 2017, 117, 13353–13381 CrossRef PubMed.
- J. C. del Valle and J. Catalán, Phys. Chem. Chem. Phys., 2019, 21, 10061–10069 RSC.
- G. N. Lewis and D. Lipkin, J. Am. Chem. Soc., 1942, 64, 2801–2808 CrossRef CAS.
- W. Meyer and A. Albrecht, J. Phys. Chem., 1962, 66, 1168–1177 CrossRef CAS.
- Y. Hirata and N. Mataga, Prog. React. Kinet., 1993, 18, 273 CAS.
- M. Robin, Higher excited states of polyatomic molecules, Elsevier, 2012 Search PubMed.
- D. Bent and E. Hayon, J. Am. Chem. Soc., 1975, 97, 2599–2606 CrossRef CAS PubMed.
- X. Chen, D. S. Larsen, S. E. Bradforth and I. H. van Stokkum, J. Phys. Chem. A, 2011, 115, 3807–3819 CrossRef CAS PubMed.
- M. Ottolenghi, Chem. Phys. Lett., 1971, 12, 339–343 CrossRef CAS.
- Y. Muto, Y. Nakato and H. Tsubomura, Chem. Phys. Lett., 1971, 9, 597–599 CrossRef CAS.
- Y. Nakato, M. Ozaki and H. Tsubomura, J. Phys. Chem., 1972, 76, 2105–2112 CrossRef CAS.
- Y. Yamamoto, Y. Suzuki, G. Tomasello, T. Horio, S. Karashima, R. Mitric and T. Suzuki, Phys. Rev. Lett., 2014, 112, 187603 CrossRef PubMed.
- Y. Hirata, M. Ichikawa and N. Mataga, J. Phys. Chem., 1990, 94, 3872–3874 CrossRef CAS.
- H. Miyasaka and N. Mataga, in Pulse Radiolysis, ed. Y. Tabata, CRC Press, Boca Raton, Florida, 1991, pp. 173–198 Search PubMed.
- L. Onsager, Phys. Rev., 1938, 54, 554–557 CrossRef CAS.
- J. Yang, T. Kondoh, K. Norizawa, R. Nagaishi, M. Taguchi, K. Takahashi, R. Katoh, S. V. Anishchik, Y. Yoshida and S. Tagawa, Radiat. Phys. Chem., 2008, 77, 1233–1238 CrossRef CAS.
- T. Kawakami, M. Koga, H. Sotome and H. Miyasaka, Phys. Chem. Chem. Phys., 2020, 22, 17472–17481 RSC.
- J. Kloepfer, V. Vilchiz, V. Lenchenkov, A. Germaine and S. Bradforth, J. Chem. Phys., 2000, 113, 6288 CrossRef CAS.
- P. Kambhampati, D. H. Son, T. W. Kee and P. F. Barbara, J. Phys. Chem. A, 2002, 106, 2374–2378 CrossRef CAS.
- H. Masuhara, H. Miyasaka, N. Ikeda and N. Mataga, Chem. Phys. Lett., 1981, 82, 59–62 CrossRef CAS.
- H. Miyasaka, H. Masuhara and N. Mataga, Laser Chem., 1987, 7, 119–128 CrossRef CAS.
- H. Sotome, T. Nagasaka, K. Une, S. Morikawa, T. Katayama, S. Kobatake, M. Irie and H. Miyasaka, J. Am. Chem. Soc., 2017, 139, 17159–17167 CrossRef CAS PubMed.
- T. Nagasaka, H. Sotome, Y. Yoshida, Y. Yokoyama and H. Miyasaka, J. Phys. Chem. C, 2018, 122, 24987–24995 CrossRef CAS.
- Y. Kobayashi, T. Katayama, T. Yamane, K. Setoura, S. Ito, H. Miyasaka and J. Abe, J. Am. Chem. Soc., 2016, 138, 5930–5938 CrossRef CAS PubMed.
- J. A. Snyder and A. E. Bragg, J. Phys. Chem. Lett., 2018, 9, 5847–5854 CrossRef CAS PubMed.
- E. Fitzpatrick, C. N. Lincoln, L. J. G. W. van Wilderen and J. J. van Thor, J. Phys. Chem. B, 2012, 116, 1077–1088 CrossRef PubMed.
- C. L. Ward and C. G. Elles, J. Phys. Chem. Lett., 2012, 3, 2995–3000 CrossRef CAS PubMed.
- C. L. Ward and C. G. Elles, J. Phys. Chem. A, 2014, 118, 10011–10019 CrossRef CAS PubMed.
- M. Koga, Y. Yoneda, H. Sotome and H. Miyasaka, Phys. Chem. Chem. Phys., 2019, 21, 2889–2898 RSC.
- M. Koga, Y. Miyake, M. Hayasaka, H. Sotome and H. Miyasaka, J. Chem. Phys., 2021, 154, 054304 CrossRef CAS PubMed.
- S. Pagès, B. Lang and E. Vauthey, J. Phys. Chem. A, 2006, 110, 7547–7553 CrossRef PubMed.
- J. S. Beckwith, B. Lang, J. Grilj and E. Vauthey, J. Phys. Chem. Lett., 2019, 10, 3688–3693 CrossRef CAS PubMed.
- T. W. Kee, J. Phys. Chem. Lett., 2014, 5, 3231–3240 CrossRef CAS PubMed.
- S. S. Lim, D. Giovanni, Q. Zhang, A. Solanki, N. F. Jamaludin, J. Wei, M. Lim, N. Mathews, S. Mhaisalkar, M. S. Pshenichnikov and T. C. Sum, Sci. Adv., 2019, 5, 1–6 Search PubMed.
- A. Bakulin, A. Rao, V. G. Pavelyev, P. H. M. van Loosdrecht, M. S. Pshenichnikov, D. Niedzialek, J. Cornil, D. Beljonne and R. H. Friend, Science, 2012, 335, 1340–1344 CrossRef CAS PubMed.
- S. Nakahara, K. Ohara, H. Tahara, G. Yumoto, T. Kawawaki, M. Saruyama, R. Sato, T. Teranishi and Y. Kanemitsu, J. Phys. Chem. Lett., 2019, 10, 4731–4736 CrossRef CAS PubMed.
- B. Dromey, M. Zepf, M. Landreman, K. O’Keeffe, T. Robinson and S. M. Hooker, Appl. Opt., 2007, 46, 5142–5146 CrossRef CAS PubMed.
- M. Pessot, P. Maine and G. Mourou, Opt. Commun., 1987, 62, 419–421 CrossRef CAS.
- K. Kawai, N. Yamamoto and H. Tsubomura, Bull. Chem. Soc. Jpn., 1970, 43, 2266–2268 CrossRef CAS.
- Y. H. Meyer and P. Plaza, Chem. Phys., 1995, 200, 235–243 CrossRef CAS.
- T. Shida, Electronic Absorption Spectra of Radical Ions, Elsevier, Amsterdam, 1988 Search PubMed.
- S. C. Doan and B. J. Schwartz, J. Phys. Chem. B, 2013, 117, 4216–4221 CrossRef CAS PubMed.
- The energy level of the relaxed S1 state is estimated to be 2.85 eV from the steady-state absorption and fluorescence spectra of perylene in acetonitrile, and the repump energy at 350 nm corresponds to 3.54 eV. Thus, total energy acquired from the excitation is 6.39 eV.
- H. Kuroda, Nature, 1964, 201, 1214–1215 CrossRef CAS.
- K. M. Hong and J. Noolandi, J. Chem. Phys., 1978, 68, 5163–5171 CrossRef CAS.
- Y. Yoshida, S. Tagawa and Y. Tabata, in Pulse Radiolysis, ed. Y. Tabata, CRC Press, Boca Raton, Florida, 1991, pp. 343–355 Search PubMed.
- Electron mobility of nonpolar solvents used in the present study are respectively 0.071 and 0.23 cm2 V−1 s−1 for n-hexane and cyclohexane according to ref. 50. These values can be respectively converted to the diffusion coefficients of 1.78 × 10⁻⁷ and 5.75 × 10⁻⁷ m2 s−1.
- M. L. Horng, J. A. Gardecki, A. Papazyan and M. Maroncelli, J. Phys. Chem., 1995, 99, 17311–17337 CrossRef CAS.
Footnote |
| † Electronic supplementary information (ESI) available. See DOI: https://doi.org/10.1039/d1cp03866d |
| This journal is © the Owner Societies 2022 |

