 Open Access Article
Creative Commons Attribution 3.0 Unported Licence
Selective removal of natural organic matter during drinking water production changes the composition of disinfection by-products†
Anna
Andersson
 *a,
Elin
Lavonen
bc,
Mourad
Harir
de,
Michael
Gonsior
f,
Norbert
Hertkorn
d,
Philippe
Schmitt-Kopplin
de,
Henrik
Kylin
 ag and
David
Bastviken
 *a
*a
aDepartment of Thematic Studies – Environmental Change, Linköping University, SE-581 83 Linköping, Sweden. E-mail: anna.e.andersson@liu.se; david.bastviken@liu.se
bNorrvatten, Kvalitet och Utveckling, SE-169 02 Solna, Sweden
cStockholm Vatten och Avfall, SE-168 67 Bromma, Sweden
dResearch Unit Analytical BioGeoChemistry, Helmholtz Centre Munich, Ingolstädter Landstraße 1, 85764 Neuherberg, Germany
eChair of Analytical Food Chemistry, Technische Universität München, 85354 Freising, Germany
fChesapeake Biological Laboratory, University of Maryland Center for Environmental Science, Solomons, Maryland 20688, USA
gResearch Unit: Environmental Sciences and Management, North-West University, Potchefstroom, South Africa
First published on 21st January 2020
Abstract
Disinfection by-products (DBPs) are potentially toxic compounds formed upon chemical disinfection of drinking water. Controlling the levels and characteristics of dissolved organic matter (DOM) as precursor material for DBPs is a major target to reduce DBP formation. A pilot-scale treatment including suspended ion exchange (SIX®), a ceramic microfilter (CeraMac®) with in-line coagulation and optional pre-ozonation followed by granular activated carbon (GAC) filtration was compared with a conventional full-scale treatment based on DOM removal and DBP formation using Fourier transform ion cyclotron resonance mass spectrometry (FT-ICR MS), rapid fractionation, liquid chromatography organic carbon detection (LC-OCD), adsorbable organic halogens (AOX) and trihalomethane (THM) analysis. The new treatment combination showed different selectivity for DOM removal, compared to the conventional, leading to changes in composition of the DBPs formed. SIX® and GAC had the largest impacts on reducing AOX and THM formation potentials but the high adsorptive capacity of GAC affected the diversity of detected DBPs most. Chlorination and chloramination of pilot treated water with doses normally used in Sweden produced low levels of AOX compared to the full-scale treatment, but FT-ICR MS revealed an abundance of brominated DBP species in contrast with the conventional treatment, which were dominated by chlorinated DBPs. This finding was largely linked to the high DOM removal by the pilot treatment, causing an increased Br−/C ratio and a higher formation of HOBr. Potential increases in Br-DBPs are important to consider in minimizing health risks associated with DBPs, because of the supposed higher toxicity of Br-DBPs compared to Cl-DBPs.
Water impactDisinfection by-products (DBPs) are potentially toxic compounds formed during drinking water disinfection. Evaluating treatment processes for improved organic matter removal revealed shifts from Cl-DBPs towards Br-DBPs. Given the higher toxicity of Br-DBPs compared to Cl-DBPs, this work highlights that both qualitative and quantitative aspects should be taken into account for optimal water treatment. |
1. Introduction
Disinfection by-products (DBPs) are unwanted and potentially toxic compounds that are formed during drinking water treatment when dissolved organic matter (DOM) reacts with primary and secondary chemical disinfectants, such as chlorine, chlorine dioxide or chloramine.1 DBPs are of concern due to their potential health risk. Epidemiological studies have shown associations between exposure to chlorinated drinking water and increased risk for bladder cancer.2 In addition, other health concerns have been reported, including miscarriages and congenital disabilities.3 Natural organic matter (NOM) together with anthropogenic compounds make up the complex mixture of organic compounds that interacts with the chemical disinfectants, giving rise to several hundreds of different DBP molecules. Disinfectant type, dosage and contact time also have major impacts on the formation of DBPs, as well as pH and temperature.4 Furthermore, presence of bromide or iodide in the source water can lead to the formation of bromine- or iodine-containing DBPs.5–7 Three different approaches are typically discussed as means of reducing human DBP exposure, i.e., 1) changing the type of disinfectant or optimizing dosage, 2) removing reactive DOM species (precursors) prior to disinfection through up-stream water treatment processes or 3) removing the DBPs after their formation through various end-user solutions applied before consumption, e.g., filters based on activated carbon adsorption. The second approach, to improve DOM removal, is attractive for water treatments plants (WTPs) for other reasons than solely to minimize DBP exposure, e.g. to avoid saturation of activated carbon filters and bacterial regrowth in the distribution system.8 Increasing levels of DOM in source waters have already been observed in northern European lakes and climate change may result in even higher levels.9 Hence, some WTPs will need to modify their current treatment processes to maintain high drinking water quality.To date, coagulation is the major DOM removal treatment for WTPs producing drinking water from surface water sources. Recently, a new treatment technique, suspended ion exchange (SIX®), became available which has the potential of removing DOM more efficiently than coagulation for certain water types.10 SIX® was developed to remove DOM upstream a ceramic membrane process to reduce fouling of the charged membrane surface and SIX® effectively removes the DOM fraction that is negatively charged at neutral pH.10 The full process evaluated in this study, combines SIX® with in-line coagulation, ceramic micro-filtration (CeraMac®), ozonation and GAC (granular activated carbon) filtration. In-line coagulation on the CeraMac® membrane removes particulate and high molecular weight DOM, which is not as efficiently removed by SIX®.11 Ozonation in combination with GAC filtration offers additional potential for DOM removal, because ozone breaks down unsaturated organic molecules to oxygenated rather bioavailable compounds that can be consumed by microbial biofilms in the GAC filter downstream. The DOM species that are particularly relevant for the formation of DBPs constitute DOM-specific compositional and structural fractions that are highly reactive with the chlorine-based disinfectants. Non-target screening of the DOM pool, including assessment of formed DBPs, is currently only possible using ultrahigh resolution organic structural spectroscopy. Here, Fourier transform ion cyclotron resonance mass spectrometry (FT-ICR MS) specifically offers detection of thousands of molecular formulae, representing ionisable molecules directly out of mixtures and hence is capable of the discovery of treatment-specific changes in the DOM pool and associated DBP formation. Previous research based on detailed molecular-level analysis investigated the chlorine-DOM reaction12–15 and the specific DOM removal by drinking water treatments, focused on coagulation,8,12,14,16,17 sand filtration16 and nano filtration.8,18 This study was undertaken to investigate the individual and combined potential of suspended ion exchange, ozonation, ceramic-microfiltration and GAC filtration to remove specific DOM components and influence DBP formation by using analytical tools with molecular resolution.
2. Methods
2.1 Evaluation approach
DOM removal was evaluated based on typical bulk characteristics, including dissolved organic carbon (DOC), absorbance at 254 nm and the specific absorbance at 254 nm (SUVA). To allow detailed molecular level analysis, Fourier transform ion cyclotron resonance mass spectrometry (FT-ICR MS) was used.19 To complement the detailed qualitative information provided by FT-ICR MS, DOM analysis based on fractionation techniques, specifically rapid fractionation20 and size-exclusion chromatography using liquid chromatography organic carbon detection (LC-OCD),21 was included to provide further size- and composition-related information on DOM removal. Rapid fractionation and LC-OCD were performed according to Chow et al. 2004 (ref. 20) and Huber et al. 2011 (ref. 21), respectively. Additional information and results from this separate long-term evaluation of the pilot treatment process have been published in a Swedish report.22The effects of individual treatment steps, prior to chlorine-based disinfection on DBP formation, were assessed experimentally using the DBP formation potential (DBPFP) test. It is a common approach to determine the DBPFP from different DOM pools by adding chemical disinfectants in excess.23 With the attempt to assess the mixture of formed DBPs, a non-target evaluation strategy was chosen, using adsorbable organic halogens (AOX) and FT-ICR MS for quantitative and qualitative DBP analysis, respectively. In addition, the commonly monitored trihalomethanes (THMs) were analysed.
2.2 Description of the pilot treatment
The pilot treatment processes evaluated were set up by Norrvatten and Stockholm Vatten och Avfall (SVOA), two drinking water producers that operate three WTPs in Stockholm, Sweden. All three WTPs use raw water from Lake Mälaren, together providing drinking water to about 2 million people in the Stockholm area. The background of this initiative was that Norrvatten and SVOA share several challenges to ensure high-quality drinking water in the future, where one is connected to the increasing and fluctuating levels of DOM in Lake Mälaren.24 The pilot plant was set up at Lovö WTP in 2016. Lovö WTP currently uses coagulation with aluminium sulphate (Al2(SO4)3), followed by sedimentation and rapid sand filtration, slow sand filtration, UV disinfection and dosing of monochloramine. Fig. 1 shows an overview of the treatment processes of the conventional full-scale plant at Lovö WTP and its connected pilot-scale plant. The pilot plant included five treatment steps (Fig. 1) where the following doses and contact times were used during the sampling period: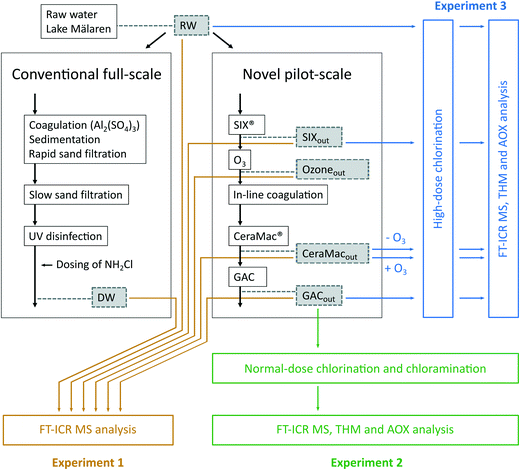 | ||
| Fig. 1 Set up of the conventional full-scale and the novel pilot-scale treatments at Lovö WTP. Sampling points are highlighted in grey boxes and the experimental design and analysis methods are indicated in coloured boxes. The figure is modified from Lundqvist et al. 2019 (ref. 51) in which various bioassays were performed on the same extracts. | ||
1) Suspended ion exchange (SIX®) – a novel technology provided by PWNT Water Technology. In this case, an acrylic quaternary amine (strongly basic) was used as an anionic resin (Lewatit S5128, Lanxess, Germany). The dose and contact time were 15 mL L−1 and 30 minutes, respectively and the process was operated at pH ≈ 7.3–7.4.
2) Ozonation, with estimated dose and contact time of 2.5–3.5 mg O3 per L and 5–10 minutes, respectively.
3) In-line coagulation using PIX-311 (FeCl3) with the dose 4.5 mg Fe per L.
4) Direct filtration over a ceramic microfilter membrane (CeraMac®) provided by PWNT Water Technology, using a flux of 200 L m−2 h−1. This ceramic membrane has a pore size of 0.1 μm and is produced by Metawater (Japan).
5) GAC (granular activated carbon) (Norit 1240 W) filtration operated at pH ≈ 7.2–7.3 with an empty bed contact time of 20 minutes.
At the time of sampling, the same SIX® resin had been in use and continuously regenerated for about 10 months. However, operational challenges associated with the CeraMac® membrane resulted in shorter operation of the GAC filter (in total about 30 days of continuous operation) at the time of sample collection. The performance of the GAC filter was therefore higher than would be expected for full-scale operation, where the activated carbon oftentimes is saturated and used as a biological filter (BAC) as the material is not regularly regenerated or replaced.
2.3 Sampling and chlorination experiments
An overview of the three experiments and samples collected at Lovö WTP and the connected pilot plant are presented in Fig. 1. Briefly, experiment 1 focused on the analysis of DOM removal by the individual processes of the pilot treatment, experiment 2 focused on evaluating the formation of DBPs from the pilot treatment at typical disinfectant doses for Swedish WTPs, and experiment 3 aimed to analyse the effects of individual treatment processes on DBP formation potentials. For each sampling point (marked with dashed boxes in Fig. 1), three replicates of water samples (5 L each) were collected in amber glass bottles. The water samples were filtered immediately after sampling using pre-combusted (450 °C, 5 h) GF/F glass fibre filters (0.7 μm porosity). The samples marked with yellow in Fig. 1 (experiment 1) were extracted and analysed according to the protocol described in 2.5.1 without further modifications, except for the sample collected after ozonation (Ozoneout) for which 2.5 mL L−1 0.01 M Na2S2O3 was added to quench excess ozone (1 mg L−1) at this specific sampling point. In the other experiments, hypochlorite or pre-made monochloramine were added to quantify the potential DBP production. The hypochlorite and monochloramine were taken from Lovö WTP the same day. Immediately after addition, residual levels of hypochlorite and monochloramine were measured as free chlorine (expressed as Cl2) and total chlorine (expressed as Cl2), respectively, using an eXact idip photometer. Free chlorine refers to the combined concentrations of chlorine in the forms of dissolved gas (Cl2), hypochloric acid (HOCl) and hypochlorite (OCl−) and total chlorine refers to the sum of free and combined chlorine levels, i.e., including chloramines.For normal-dose chlorination and chloramination (experiment 2), hypochlorite and monochloramine were added to water samples collected after the GAC filter (GACout), i.e., to the finished water from the pilot treatment. A dose of 0.3–0.4 mg L−1 was used, representing total chlorine residuals typical for disinfected water at Swedish WTPs. The experiment included nine GACout samples in total, three replicates for control (no addition), three replicates for hypochlorite addition and three replicates for monochloramine addition. After dosing, samples were adjusted to pH ∼8.5 using 1 M NaOH and were stored for 24 h at 15 °C before extraction and water collection for AOX and THM analysis. The finished water at the conventional full-scale treatment at Lovö WTP (after the addition of monochloramine) was used as a reference (sampling point DW, Fig. 1).
High-dose chlorination (experiment 3) was conducted using hypochlorite only. Hypochlorite was added in excess to a residual of ∼10 mg L−1, measured as free chlorine, to water samples from each stage in the pilot treatment (RW, SIXout, CeraMacout − O3, CeraMacout + O3, GACout). To investigate the effect of coagulant addition on the CeraMac® membrane alone (without ozonation), the sampling point after CeraMac® (CeraMacout) was collected, both with the ozone turned off (−O3) and on (+O3). The ozone levels were monitored by on-line measurements and were also checked manually using the AccuVac MR method (HACH). Ozone residuals were not detected at CeraMacout and therefore, no addition of ozone quenching agent was needed. pH was ∼8.5 (there was no need to adjust pH with NaOH this time) and the samples were kept in the dark at room temperature for 3 days of contact time. Hypochlorite was added to 15 samples (5 sampling points and 3 replicates). As control, one sample for each treatment stage without addition of hypochlorite was included. After 3 days, the free chlorine residuals were above 6 mg Cl2 per L, for all samples, ensuring that all available, reactive DOM had reacted during the contact time.
2.4 Water analysis
2.5 Detailed organic matter analysis
![[thin space (1/6-em)]](https://www.rsc.org/images/entities/char_2009.gif) 000
000![[thin space (1/6-em)]](https://www.rsc.org/images/entities/char_2009.gif) 000), mass error (<0.2 ppm) and various requirements to eliminate unrealistic formulae based on chemical prerequisites (number of C, H and O > 0, O/C ratio ≤1, H/C ratio ≤2.5 and double bond equivalences (DBE) ≥ 0). In addition, the so-called nitrogen rule was applied.26 To identify chlorine and bromine containing DBPs, a filtration approach was used where the 37Cl or 81Br isotope variants of each chlorine (35Cl) or bromine (79Br) containing molecular formula were used to verify each DBP. This verification process has been further described elsewhere.27 For the analysis of DOM removal, formulae containing carbon, hydrogen, oxygen, nitrogen (≤1) and sulfur (≤1) were considered but DBP assessment was limited to halogenated formulae with carbon, hydrogen and oxygen only. In the text, molecular formulae containing carbon, oxygen and hydrogen atoms are referred to as CHO formulae, without specifying the number of individual atoms. However, the number of chlorine and/or bromine atoms are specified, e.g., CHOCl2 refers to a molecular formula with carbon, oxygen, hydrogen and 2 chlorine atoms.
000), mass error (<0.2 ppm) and various requirements to eliminate unrealistic formulae based on chemical prerequisites (number of C, H and O > 0, O/C ratio ≤1, H/C ratio ≤2.5 and double bond equivalences (DBE) ≥ 0). In addition, the so-called nitrogen rule was applied.26 To identify chlorine and bromine containing DBPs, a filtration approach was used where the 37Cl or 81Br isotope variants of each chlorine (35Cl) or bromine (79Br) containing molecular formula were used to verify each DBP. This verification process has been further described elsewhere.27 For the analysis of DOM removal, formulae containing carbon, hydrogen, oxygen, nitrogen (≤1) and sulfur (≤1) were considered but DBP assessment was limited to halogenated formulae with carbon, hydrogen and oxygen only. In the text, molecular formulae containing carbon, oxygen and hydrogen atoms are referred to as CHO formulae, without specifying the number of individual atoms. However, the number of chlorine and/or bromine atoms are specified, e.g., CHOCl2 refers to a molecular formula with carbon, oxygen, hydrogen and 2 chlorine atoms.
3. Results and discussion
3.1 DOM removal by the pilot treatment (experiment 1)
| Sample collected | DOC (mg L−1) | UVA254 (cm−1) | SUVA (L mg−1 m−1) | AOX (μg Cleq per L) | |
|---|---|---|---|---|---|
| a Lovö DW is chloraminated. b Long-term monitoring showed slightly higher SUVA values, reported in section 3.1.1. | |||||
| Conventional full-scale | RW | 6.9 | 0.191 | 2.8 | 19 |
| Lovö DW | 3.9 | 0.077 | 2.0 | 55a | |
| Novel pilot-scale | RW | 6.9 | 0.191 | 2.8 | 19 |
| SIXout | 2.5 | 0.048 | 1.9b | 8.7 | |
| Ozoneout | 2.6 | 0.032 | 1.2 | NA | |
| CeraMacout | 2.0 | 0.013 | 0.7 | NA | |
| GACout | 0.4 | 0.001 | 0.3 | <4 | |
Apart from lowering DOC, the pilot treatment also decreased UVA254 and SUVA, which indicate that the treatment is effective in removing UV-absorbing compounds, e.g., aromatic compounds. SUVA values after SIX® and the conventional treatment were similar at the time of sampling (Table 1). However, long-term monitoring of the pilot and conventional process show slightly different average SUVA values (2.4 ± 0.3 L mg−1 m−1 (n = 98) after SIX® and 1.8 L mg−1 m−1 after coagulation, average based on 2 years of monitoring), indicating that coagulation has an overall higher selectivity towards removing UV-absorbing compounds compared to SIX®. This is in line with previous findings.29 No quantitative removal of DOM was observed upon ozonation, however, UVA254 and SUVA decreased, highlighting changes in DOM characteristics. In-line coagulation over the CeraMac® membrane (where the main effect on DOM is attributed to in-line coagulation29) and GAC further decreased UVA254 and SUVA, reflecting a selectivity towards UV-absorbing compounds also in these processes, resulting in almost blank absorbance at 254 nm after GAC. The level of AOX in Lake Mälaren was 19 μg Cleq per L (Table 1). That corresponds to the lower AOX range in a study based on 135 lakes in southern Sweden, where AOX varied between 11–185 μg Cleq per L and levels between 20–60 μg Cleq per L were most common.30 AOX was decreased with approximately 50% during SIX® treatment (Table 1).
| Experiment 1 | ||||||
|---|---|---|---|---|---|---|
| Number of DOM compositions | RW | SIXout | Ozoneout | CeraMacout | GACout | Lovö DW |
| Total | 2731 | 2856 | 2841 | 2398 | 1841 | 2371 |
| CHO | 1823 | 1914 | 1649 | 1403 | 1426 | 1398 |
| CHNO | 528 | 570 | 563 | 594 | 334 | 525 |
| CHOS | 375 | 362 | 609 | 386 | 81 | 444 |
| CHNOS | 5 | 10 | 20 | 15 | 0 | 4 |
| Percentage of DOM compositions | ||||||
| CHO [%] | 66.8 | 67.0 | 58.0 | 58.5 | 77.5 | 59.0 |
| CHNO [%] | 19.3 | 20.0 | 19.8 | 24.8 | 18.1 | 22.1 |
| CHOS [%] | 13.7 | 12.7 | 21.4 | 16.1 | 4.4 | 18.7 |
| CHNOS [%] | 0.2 | 0.4 | 0.7 | 0.6 | 0.0 | 0.2 |
| Characteristics of DOM compositions | ||||||
| Average H [%] | 42.8 | 45.3 | 45.3 | 45.4 | 43.9 | 44.5 |
| Average C [%] | 37.2 | 36.8 | 36.1 | 35.8 | 35.9 | 36.8 |
| Average O [%] | 19.9 | 17.7 | 18.3 | 18.6 | 20.1 | 18.4 |
| Average N [%] | 0.1 | 0.1 | 0.1 | 0.1 | 0.1 | 0.1 |
| Average S [%] | 0.1 | 0.1 | 0.2 | 0.1 | 0.1 | 0.1 |
| Computed average H/C ratio | 1.15 | 1.23 | 1.25 | 1.27 | 1.22 | 1.21 |
| Computed average O/C ratio | 0.53 | 0.48 | 0.51 | 0.52 | 0.56 | 0.50 |
| Computed average N/C ratio | 0.003 | 0.003 | 0.003 | 0.003 | 0.002 | 0.003 |
| Computed average S/C ratio | 0.003 | 0.003 | 0.005 | 0.003 | 0.002 | 0.004 |
| Average carbon oxidation state (COS) | −0.07 | −0.25 | −0.23 | −0.22 | −0.10 | −0.20 |
| Average DBE | 9.17 | 8.60 | 8.03 | 7.65 | 8.59 | 8.58 |
| Average DBE/C | 0.48 | 0.44 | 0.43 | 0.42 | 0.44 | 0.45 |
| Average AImod | 0.28 | 0.26 | 0.23 | 0.21 | 0.22 | 0.26 |
| Mass weighted average [Da] | 419.0 | 414.5 | 405.6 | 393.7 | 434.4 | 407.3 |
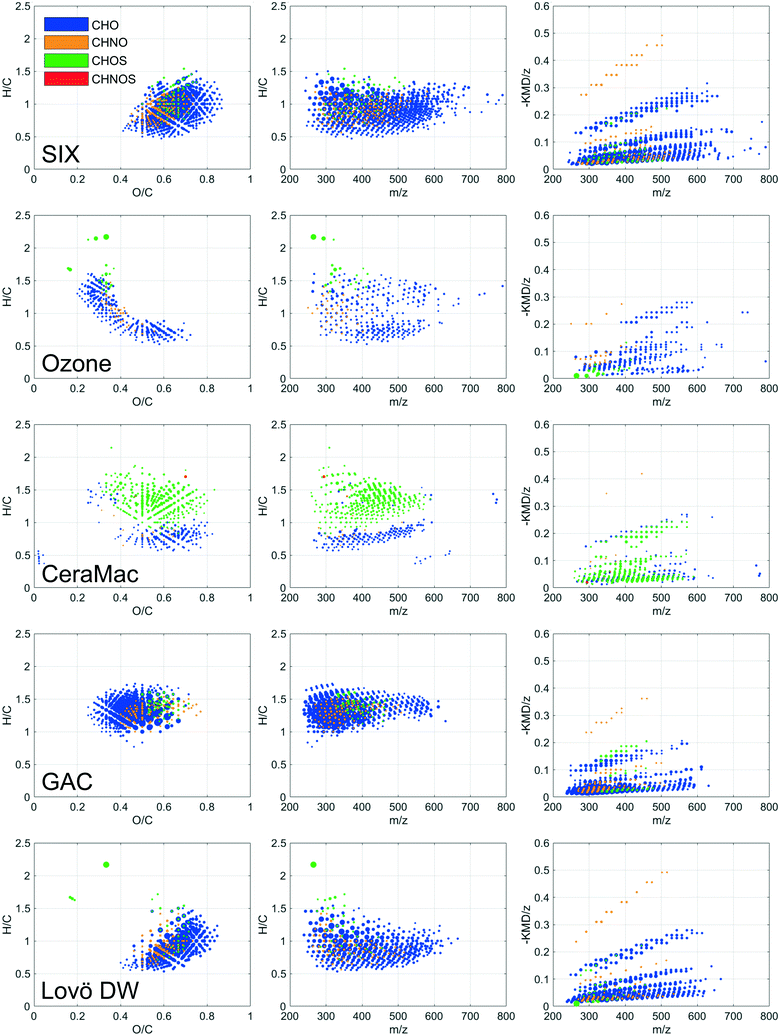
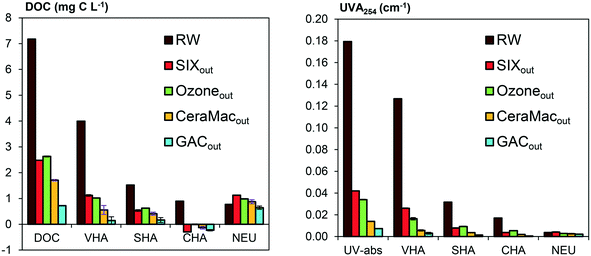
DOM compositions detected after SIX® showed higher hydrogen and lower oxygen content compared to the raw water, indicating a selective removal of unsaturated oxygen rich compounds (Table 2). Oxygenated molecules of a wide mass range (250–650 m/z) (Fig. 2) and a high average carbon oxidation state (Fig. S5†) decreased in relative abundance after SIX®, mainly because molecules with oxygen containing functional groups are likely to be deprotonated and charged and therefore easily removed with ion exchange. A separate rapid fractionation experiment (Fig. 3) further showed that SIX® removed large portions of the very and slightly hydrophobic acids (VHA, SHA), and all the hydrophilic charged (CHA) molecules.
Ozonation selectively transformed DOM in the mass range of 600–750 Da (Fig. S1 and S3†), which resulted in a decrease in average mass (Table 2). Molecular compositions that decreased in relative abundance upon ozonation had low H/C and O/C ratios (Fig. 2), indicating that ozone preferably reacted with aromatic compounds and/or highly unsaturated molecules (compounds with multiple double bonds). This is in line with previous findings where electrophilic addition of ozone to unsaturated bonds has been identified as the main reaction pathway between ozone and DOM, leading to the formation of aldehydes, ketones and carboxylic acids.31,32 Interestingly, the average carbon oxidation state was rather unchanged after ozonation (Table 2). This is explained by the formation of oxygen-rich end products, like short chained aldehydes and carboxylic acids and finally CO2 and H2O, not captured with FT-ICR MS.32,33 Hence, the oxidation of freshwater DOM leads to a defunctionalisation of the remaining, extractable DOM.
In-line coagulation and CeraMac® (where in-line coagulation, rather than CeraMac® has the major effect on DOM) further removed high molecular weight DOM (Fig. S1 and S3,†Table 2) including very and slightly hydrophobic acids (Fig. 3), unsaturated, oxygenated CHO-molecules (van Krevelen diagram, Fig. 2 and DBE, AImod and COS plots, Fig. S5†) and rather saturated CHOS-molecules (van Krevelen diagram, Fig. 2 and DBE and AImod plots Fig. S5†). The pronounced removal of CHOS-molecules observed by in-coagulation and CeraMac® might be linked to the higher abundance of CHOS-molecules detected before this treatment (Table 2), as the number of detected CHOS formulae were higher after ozonation compared to the other treatment stages.
The effect of GAC on DOM compositions requires careful evaluation. Before sample collection, the GAC filter had been operated a limited amount of time (approximately 30 days of continuous operation), which means that the GAC filter still had a substantial adsorptive capacity, which is in contrast to many full-scale WTPs in Sweden, where activated carbon filters are often operated as biological filters only, i.e., as BAC filters. We therefore expect that the GAC filter in this pilot study removed higher DOC levels than would be economically feasible in a full-scale BAC application. FT-ICR MS indicate that GAC, at a stage where removal was dominated by adsorption, was selective in removing molecules of mid to high H/C ratios (1–1.7) (Fig. 2 and S3†). Also, less oxygenated compounds were selectively removed while the average mass increased after GAC (Fig. S5,†Table 2), suggesting a selective removal of low molecular weight compounds of low oxidation state. This is in line with previous studies where small, neutral hydrophobic molecules were preferentially removed after GAC operated through adsorption.31,34 The fractionation experiment showed that the major components found after GAC constituted neutral hydrophilic compounds (Fig. 3). Consequently, while we expect to capture a majority of DOM upon extraction with Bond Elut PPL and subsequent FT-ICR MS analysis, the largest fraction of DOM remaining after GAC, may not have been efficiently captured. However, overall amounts of DOC remaining after GAC were low.
The pilot treatment was compared with finished water from the full-scale conventional treatment at Lovö, where coagulation has the highest impact on DOM abundance and composition (Table 2; Fig. 2 and S3–S5†).16 The selectivity of the conventional treatment partly resembled that of SIX® (Fig. 2), which likely can be linked to the removal of humic substances of both treatments.29 However, the conventional process selectively removed aromatic DOM (Fig. 2) of higher molecular weight (Table 2), when compared to SIX®, which is consistent with previous findings.29 Previous studies based on FT-ICR MS showed that coagulation was selective to compounds of H/C and O/C ratios of 0.4–1.4 and 0.4–0.9, respectively, which were attributed to polyphenol-like DOM, resembling our findings.12,17
Analysis of DOM fractions using LC-OCD were performed to further compare the selectivity between SIX® and coagulation. In general, LC-OCD showed that SIX® is less selective compared to coagulation (Fig. 4). Coagulation removed a part of the early eluting fraction constituting larger molecules, described as biopolymers in the method defined by Huber et al. 2011,21 which were not affected by SIX® (Fig. 4). Furthermore, coagulation showed higher selectivity to remove larger humic substances (shorter retention times), while SIX® removed medium-sized humic substances (longer retention times) more effectively compared to coagulation. Finally, SIX® affected the removal of building blocks and low molecular weight humic substances to a higher extent than coagulation (Fig. 4). These differences in selectivity are in agreement with previous work,10,29 but variations in selectivity have been observed for different raw waters depending on DOM characteristics.29
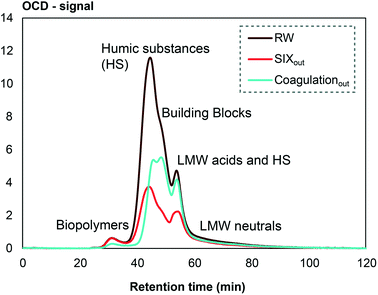 | ||
| Fig. 4 Selectivity of pilot-scale SIX® compared to full-scale conventional coagulation and rapid sand filtration analyzed by LC-OCD. LMW = low molecular weight. | ||
The differences in selectivity can be linked to the interactions and forces involved in these two processes, respectively. Ion exchange primarily removes DOM based on charge, while the coagulation process also depends on the hydrophobicity of DOM and specific structural characteristics, such as the number and positions of carboxyl and hydroxyl groups, affecting the complexation reaction with the coagulant salt to form larger aggregates.35,36 Concerning size, a large molecular size leads to decreased charge density, which affect the removal efficiency of ion exchange.37 The size of DOM also affects the propensity of a molecule to enter the ion exchange resin pores, e.g., the gel type resins (the type used in this study) typically has smaller pores compared to macroporous resins.38,39 For coagulation, large DOM molecules are instead favoured for removal, partly because molecules of high molecular weight likely have higher hydrophobicity and abundance of carboxylic groups, leading to increased aggregation through hydrophobic interactions and electrostatic forces, respectively.35,40 Furthermore, high-molecular weight compounds can adsorb to multiple other particles, linking them together and thereby increase aggregation during coagulation.40
3.2 Normal-dose chlorination and chloramination (experiment 2)
| Experiment 2 | Pilot treatment | Pilot treatment | Lovö DW |
|---|---|---|---|
| HOCl | NH2Cl | NH2Cl | |
| Conc. (μg L−1) | Conc. (μg L−1) | Conc. (μg L−1) | |
| Trichloromethane | <1.0 | <1.0 | <1.0 |
| Bromodichloromethane | <1.0 | <1.0 | <1.0 |
| Dibromochloromethane | 1.6 | <1.0 | <1.0 |
| Tribromomethane | 2.8 | <1.0 | <1.0 |
| Total THMs | 5.5 | <4.0 | <4.0 |
The diversity of available precursors was greatly affected by the pilot treatment (as described in section 3.1), and the removal of large quantities of DOM affected the Br−/DOC ratio, which also explains the impact of the pilot treatment on DBP speciation. SIX® removed 34 ± 10% bromide (from 56 to 37 μg L−1) through sorption to the ion exchange resin but the even higher decrease of DOC (63 ± 3%, computed based on average DOC removal during the entire test period) still resulted in a net increase of the Br−/DOC ratio from 0.008 to 0.014 ± 0.003 mg Br−/mg DOC. There was no significant effect on bromide levels after ozonation, coagulation or GAC filtration (demonstrated by separate experiments performed at Norrvatten). This is why we expect that the bromide level remained rather constant after SIX®, resulting in a final Br−/DOC ratio of about 0.07 mg Br−/mg DOC after GAC. Of the different processes, GAC likely had the greatest impact on the Br−/DOC ratio, due to the decreased DOC and unchanged Br− levels and therefore likely contributed most to the observed shift towards higher relative abundances of Br-DBPs. According to the experiments described above, the conventional full-scale treatment was not expected to have a significant effect on bromide.
3.3 High-dose chlorination (experiment 3)
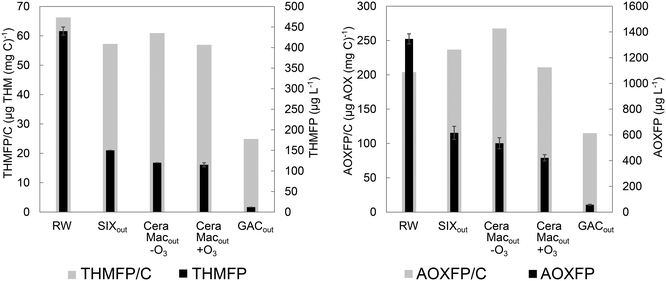
The patterns of THMFP and AOXFP largely corresponded, but SIX® decreased THMFP to a higher extent, compared to AOXFP (Fig. S10†). This indicates that SIX® more efficiently removed precursors associated with the formation of THMs, i.e., hydrophilic low molecular weight compounds46,47 – the selective SIX®-induced removal of medium-sized humic substances, building blocks and low molecular weight humic substances was specifically shown in the LC-OCD fractionation experiment (Fig. 4). Previous research has found that coagulation has a substantially higher impact on reducing the formation potential of haloacetic acids (HAA) compared to SIX®, which can be related to the more efficient removal of aromatic precursors by coagulation, while the effect on THMFP was rather similar.29 Thus, the strength of correlations between AOX and specific DBP species will depend on the DOM characteristics of individual waters and the disinfectant type employed, which both affect DBP speciation.42,48
The formation potential per mg carbon (AOXFP/C or THMFP/C), show the relative DOM reactivity, and was primarily reduced through GAC filtration (Fig. 6), demonstrating a selective removal of THM and AOX precursors by this treatment under prevailing conditions. Changes in THMFP/C and AOXFP/C between processes were slightly different, e.g., THMFP/C decreased while AOXFP/C increased after SIX®, further emphasizing that SIX® selectively removes THM reactive precursors.
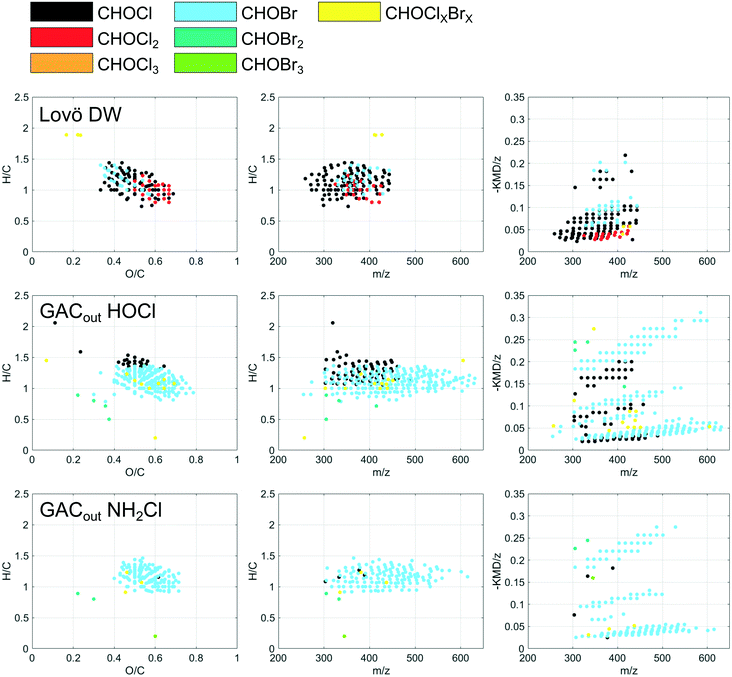
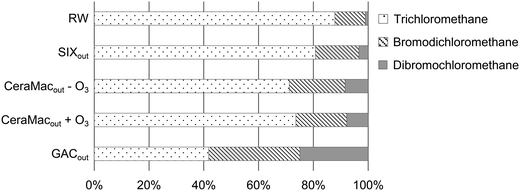
The relative formation of bromine containing DBP species (Br-DBPs) increased along the treatment stages and especially after GAC (Fig. 7). However, the high chlorine residual drives the formation towards Cl-DBPs and therefore this pattern was even more distinct when chlorination was performed at a normal dose (experiment 2), when tribromomethane and dibromochloromethane were the only THM species detected after GAC (Table 3). In addition to the increased Br−/DOC ratio (discussed in 3.2.2), this shift might be explained by UVA254 and SUVA reductions caused by the pilot treatments. Bromine substitution has been found to decrease with increasing SUVA for a range of DBP classes.49 This is because chlorine substitution reactivity is associated with aromatic, hydrophobic DOM (which is related to SUVA), while bromine substitution reactivity is associated with carboxylate-rich hydrophilic DOM.45
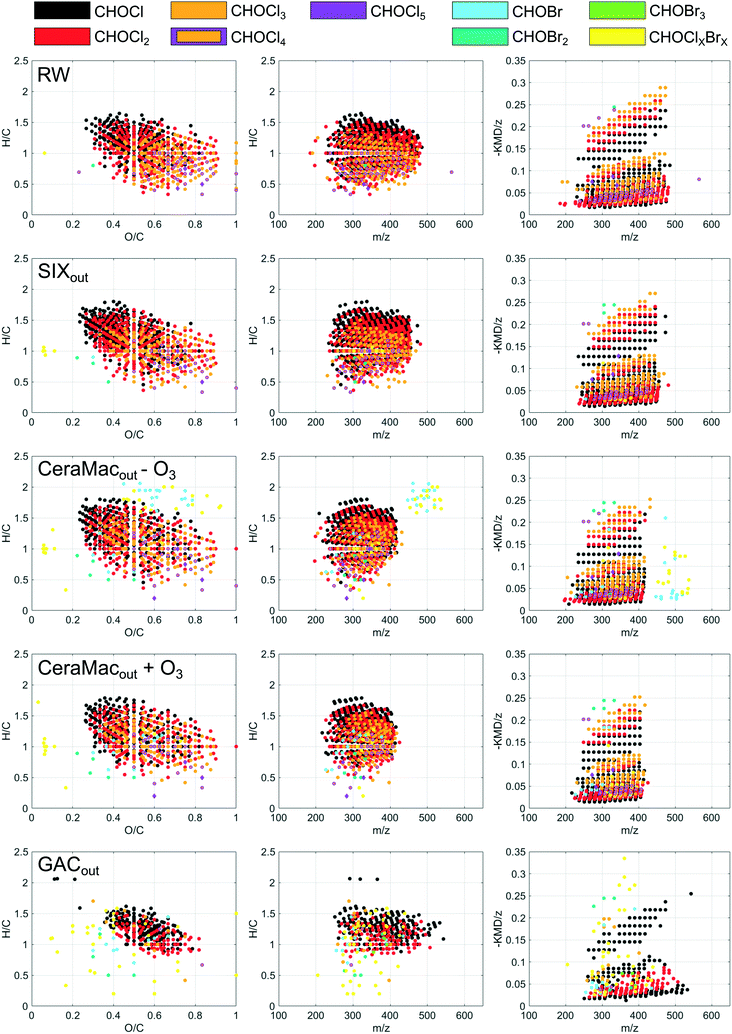
At a first glance, the distribution of DBPs formed upon chlorination of raw water and after SIX® appeared overall comparable as shown in van Krevelen diagrams (Fig. 8). However, the computed weighted average elemental ratios and indices revealed higher H/C ratios and lower O/C ratios as well as lower DBE and AImod among DBPs formed after SIX® (Table S3†). This matches with the observation that SIX® selectively removes DOM compositions of high O/C and low H/C ratios (Fig. 2). However, the weighted average m/z did not change notably (Table S3†). In-line coagulation and CeraMac® limited the m/z distribution of DBPs formed (Fig. 8) and the average m/z was shifted from 358 to 340 Da (Table S3†), further demonstrating that in-line coagulation preferentially removes high molecular weight precursors.
No changes in DBE, AImod or average mass of verified DBPs after ozonation were observed (Table S3†). GAC filtration showed the largest impact on the formation of FT-ICR MS amenable DBPs. After GAC, the detected DBPs appeared in a more restricted chemical space in the van Krevelen diagram (DBPs with O/C below 0.4 or H/C below 1.0 were rarely found) and less DBPs with three, four and five chlorines were formed, in favor of mixed chlorine–bromine DBPs (Fig. 8).
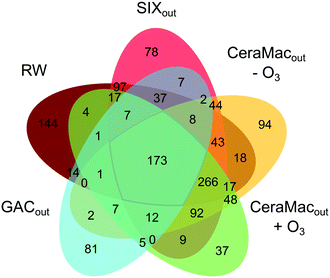
By comparing the individual DBP formulae formed after chlorination at different treatment stages (RW, SIXout, CeraMacout − O3, CeraMacout + O3, GACout, Fig. 1) in a Venn diagram (Fig. 9), it is possible to distinguish between unique DBPs, i.e., DBP formulae formed after a single treatment, and shared DBPs, i.e., DBP formulae formed after more than one treatment stage. 173 DBPs were detected following chlorination at all stages, which means that the precursors producing these DBPs remained throughout the pilot treatment. This group of DBPs comprised one and two chlorine containing DBPs with H/C ratios above one, in a mass range of 270–400 Da. The largest group of common DBPs (266 formulae) was shared between all treatment stages except GAC, further emphasizing that GAC had the biggest impact on DBP diversity of the individual treatment processes. DBPs detected after chlorination of raw water only were dominated by unsaturated compounds, underlining that SIX® treatment removed this group of precursors.
3.4 Outlook and summary
The connection between selective precursor removal and DBP formation is not straightforward.50 Bond et al. (2010) showed that DOM constituents of similar physiochemical properties (that were equally removed during treatment) could have completely different DBP formation potential.50 Therefore, DBP formation potential tests remain important to evaluate effective removal of DBP precursors. In the present study, patterns of selective DOM removal by the treatments and subsequent DBP formation could be linked via ultrahigh-resolution mass spectrometry, but the different patterns of THM and AOX formation highlight that the selective DOM removal affect the formation of various DBP groups differently.The challenge remains in distinguishing the most relevant precursor groups to remove. Therefore, the extracts chemically analysed in the present study were also analysed with various bioassays to measure the toxic effects from the mixture of DBPs formed.51 The DBPs were activating an oxidative stress response system (the Nrf2 pathway), which is an early cell response that can cause, e.g., genotoxicity.52 The results from the high-dose chlorination experiment showed that SIX® reduced the Nrf2 induced activity of formed DBPs by ∼70%, which is similar to the decreases in THM formation potentials. However, the treatments that solely reduced UVA254, e.g., ozonation, affected Nrf2 induced activity more than AOX and THM formation potentials.51 The drastic decrease in THM and AOX formation after GAC due to the high DOC removal did not resonate with a similar drop in Nrf2 induced activity from DBPs formed. We suggest that this observation can be explained by the shift towards higher relative abundances of more toxic Br-DBPs after GAC, observed through both THM and non-target FT-ICR MS analysis in this study. The following statements summarize our findings:
– Quantity matters 1: overall, the largest attenuation of DBP formation potential was associated with decreased DOC concentration, which was also reflected by UVA254 and SUVA reductions.
– Quantity matters 2: SIX® and GAC were the treatments that had the highest effect on decreasing THM and AOX formation potentials, but the formation potential per mg DOC was remarkably similar after all treatment steps except GAC (with a relatively new filter).
– Quality matters 1: different treatments showed distinct selectivity in DOM removal, regarding e.g. molecular weight and hydrophilic/hydrophobic properties, which together with the Br−/DOC ratio, affected the types of DBPs formed.
– Quality matters 2: genotoxic responses are not necessarily associated with the quantitative sum of DBP formation and toxic effects can be associated with qualitative rather than quantitative properties of DBPs.
4. Conclusions
This study implies that qualitative aspects of DBP formation, i.e., which DBPs that are formed, can be highly affected by increased DOM removal during drinking water treatment. Because DBP speciation influences toxicological responses, qualitative aspects of DBP formation need to be considered in water quality assessments. Furthermore, the interplay between quantitative and qualitative aspects are important, e.g., for experimental design and subsequent evaluations. At low doses of reactive chlorine, formation of Br-DBPs is induced to the extent possible given the Br− presence and the excess and characteristics of DOC, whereas at high chlorine concentrations, chemical equilibria favour formation of Cl-DBPs. Consequently, the dosage of chlorine will highly influence which types of DBPs that are formed. To avoid formation of Br-DBPs, the balance between raw water Br− levels, Br− removal through treatment and DOM levels and characteristics need to be considered. In conclusion, apart from removing DOM from water, it is also important to consider how the DOM removal influence which types of DBPs that are formed in order to reduce health effects associated with DBPs. Further studies combining quantitative and detailed qualitative aspects of DBP formation appear needed to reach the optimal solution for each water treatment.Conflicts of interest
There are no conflicts of interest to declare.Acknowledgements
This project was funded by the Swedish Research Council for Sustainable Development, FORMAS (grant no. 2013-1077), Svenskt Vatten Utveckling (project no. 16-104), Norrvatten, and Stockholm Vatten och Avfall. This is contribution of the University of Maryland Center for Environmental Science No, 5737 (Ref. No. [UMCES] CBL 2020-025). We thank Kristina Dahlberg for input on experimental design and practical assistance during sample collection and Ulf Eriksson for helpful input on process related issues. We also thank the staff at Lovö WTP for very accommodating support during the days of sample collections, experiments and extractions, and Susanne Karlsson, Nguyen Than Duc, Mårten Dario, and Ingrid Sundgren for valuable help and advice. Finally, gratitude goes to Elias Andersson who offered major practical assistance.References
- S. D. Richardson, M. J. Plewa, E. D. Wagner, R. Schoeny and D. M. DeMarini, Occurrence, genotoxicity, and carcinogenicity of regulated and emerging disinfection by-products in drinking water: a review and roadmap for research, Mutat. Res., 2007, 636(1), 178–242 CAS.
- C. M. Villanueva, S. Cordier, L. Font-Ribera, L. A. Salas and P. Levallois, Overview of Disinfection By-products and Associated Health Effects, Curr. Environ. Health Rep., 2015, 2(1), 107–115 CrossRef CAS.
- F. Bove, Y. Shim and P. Zeitz, Drinking water contaminants and adverse pregnancy outcomes: A review, Environ. Health Perspect., 2002, 110(SUPPL. 1), 61–74 CrossRef.
- L. Liang and P. C. Singer, Factors influencing the formation and relative distribution of haloacetic acids and trihalomethanes in drinking water, Environ. Sci. Technol., 2003, 37(13), 2920–2928 CrossRef CAS PubMed.
- C. Postigo, S. D. Richardson and D. Barceló, Formation of iodo-trihalomethanes, iodo-haloacetic acids, and haloacetaldehydes during chlorination and chloramination of iodine containing waters in laboratory controlled reactions, J. Environ. Sci., 2017, 58, 127–134 CrossRef PubMed.
- M. B. Heeb, J. Criquet, S. G. Zimmermann-Steffens and U. Von Gunten, Oxidative treatment of bromide-containing waters: Formation of bromine and its reactions with inorganic and organic compounds - A critical review, Water Res., 2014, 48(1), 15–42 CrossRef CAS PubMed.
- J. Tan, S. Allard, Y. Gruchlik, S. McDonald, C. A. Joll and A. Heitz, Impact of bromide on halogen incorporation into organic moieties in chlorinated drinking water treatment and distribution systems, Sci. Total Environ., 2016, 541, 1572–1580 CrossRef CAS PubMed.
- S. J. Köhler, E. Lavonen, A. Keucken, P. Schmitt-Kopplin, T. Spanjer and K. Persson, Upgrading coagulation with hollow-fibre nanofiltration for improved organic matter removal during surface water treatment, Water Res., 2016, 89, 232–240 CrossRef PubMed.
- C. D. Evans, D. T. Monteith and D. M. Cooper, Long-term increases in surface water dissolved organic carbon: Observations, possible causes and environmental impacts, Environ. Pollut., 2005, 137(1), 55–71 CrossRef CAS PubMed.
- G. Galjaard, E. Koreman, D. Metcalfe, G. Moore and P. Ericsson, Nom-removal by the six®-process, Water Pract. Tech., 2018, 13(3), 524–541 CrossRef.
- C. Rockey, D. C. Metcalfe, G. Galjaard, H. Shorney-Darby and J. Zheng, Ceramic microfiltration; a novel and compact process for the treatment of surface water, Water Sci. Technol.: Water Supply, 2018, 18(6), 2035–2043 CAS.
- M. Gonsior, P. Schmitt-Kopplin, H. Stavklint, S. D. Richardson, N. Hertkorn and D. Bastviken, Changes in Dissolved Organic Matter during the Treatment Processes of a Drinking Water Plant in Sweden and Formation of Previously Unknown Disinfection Byproducts, Environ. Sci. Technol., 2014, 48(21), 12714–12722 CrossRef CAS PubMed.
- B. D. Harris, T. A. Brown, J. L. McGehee, D. Houserova, B. A. Jackson and B. C. Buchel, et al. Characterization of Disinfection By-Products from Chromatographically Isolated NOM through High-Resolution Mass Spectrometry, Environ. Sci. Technol., 2015, 49(24), 14239–14248 CrossRef CAS PubMed.
- E. E. Lavonen, M. Gonsior, L. J. Tranvik, P. Schmitt-Kopplin and S. J. Köhler, Selective chlorination of natural organic matter: Identification of previously unknown disinfection byproducts, Environ. Sci. Technol., 2013, 47(5), 2264–2271 CrossRef CAS PubMed.
- H. Zhang, Y. Zhang, Q. Shi, J. Hu, M. Chu and J. Yu, et al. Study on transformation of natural organic matter in source water during chlorination and its chlorinated products using ultrahigh resolution mass spectrometry, Environ. Sci. Technol., 2012, 46(8), 4396–4402 CrossRef CAS PubMed.
- E. E. Lavonen, D. N. Kothawala, L. J. Tranvik, M. Gonsior, P. Schmitt-Kopplin and S. J. Köhler, Tracking changes in the optical properties and molecular composition of dissolved organic matter during drinking water production, Water Res., 2015, 85, 286–294 CrossRef CAS PubMed.
- H. Zhang, Y. Zhang, Q. Shi, S. Ren, J. Yu and F. Ji, et al. Characterization of low molecular weight dissolved natural organic matter along the treatment trait of a waterworks using Fourier transform ion cyclotron resonance mass spectrometry, Water Res., 2012, 46(16), 5197–5204 CrossRef CAS PubMed.
- N. Cortés-Francisco, M. Harir, M. Lucio, G. Ribera, X. Martínez-Lladó and M. Rovira, et al. High-field FT-ICR mass spectrometry and NMR spectroscopy to characterize DOM removal through a nanofiltration pilot plant, Water Res., 2014, 67, 154–165 CrossRef PubMed.
- N. Hertkorn, M. Frommberger, M. Witt, B. P. Koch, P. Schmitt-Kopplin and E. M. Perdue, Natural organic matter and the event horizon of mass spectrometry, Anal. Chem., 2008, 80(23), 8908–8919 CrossRef CAS PubMed.
- C. W. K. Chow, R. Fabris and M. Drikas, A rapid fractionation technique to characterise natural organic matter for the optimisation of water treatment processes, J. Water Supply: Res. Technol.--AQUA, 2004, 53(2), 85–92 CrossRef CAS.
- S. A. Huber, A. Balz, M. Abert and W. Pronk, Characterisation of aquatic humic and non-humic matter with size-exclusion chromatography - organic carbon detection - organic nitrogen detection (LC-OCD-OND), Water Res., 2011, 45(2), 879–885 CrossRef CAS PubMed.
- E. Lavonen, I. Bodlund, K. Dahlberg, U. Eriksson, A. Andersson and S. Bertilsson, et al., Dricksvattenberedning med nya reningstekniker - en pilotstudie, 2018, Contract No.: 2018–07 Search PubMed.
- B. Chen and P. Westerhoff, Predicting disinfection by-product formation potential in water, Water Res., 2010, 44(13), 3755–3762 CrossRef CAS PubMed.
- S. J. Köhler, D. Kothawala, M. N. Futter, O. Liungman and L. Tranvik, In-Lake Processes Offset Increased Terrestrial Inputs of Dissolved Organic Carbon and Color to Lakes, PLoS One, 2013, 8(8), e70598 CrossRef PubMed.
- J. L. Weishaar, G. R. Aiken, B. A. Bergamaschi, M. S. Fram, R. Fujii and K. Mopper, Evaluation of specific ultraviolet absorbance as an indicator of the chemical composition and reactivity of dissolved organic carbon, Environ. Sci. Technol., 2003, 37(20), 4702–4708 CrossRef CAS PubMed.
- K. Mopper, A. Stubbins, J. D. Ritchie, H. M. Bialk and P. G. Hatcher, Advanced instrumental approaches for characterization of marine dissolved organic matter: Extraction techniques, mass spectrometry, and nuclear magnetic resonance spectroscopy, Chem. Rev., 2007, 107(2), 419–442 CrossRef CAS PubMed.
- A. Andersson, M. Harir, M. Gonsior, N. Hertkorn, P. Schmitt-Kopplin and H. Kylin, et al. Waterworks-specific composition of drinking water disinfection by-products, Environ. Sci.: Water Res. Technol., 2019, 5(5), 861–872 RSC.
- B. P. Koch and T. Dittmar, From mass to structure: An aromaticity index for high-resolution mass data of natural organic matter, Rapid Commun. Mass Spectrom., 2006, 20(5), 926–932 CrossRef CAS.
- D. Metcalfe, C. Rockey, B. Jefferson, S. Judd and P. Jarvis, Removal of disinfection by-product precursors by coagulation and an innovative suspended ion exchange process, Water Res., 2015, 87, 20–28 CrossRef CAS PubMed.
- G. Asplund and A. Grimvall, Organohalogens in nature, Environ. Sci. Technol., 1991, 25(8), 1346–1350 CrossRef CAS.
- T. Bond, E. H. Goslan, S. A. Parsons and B. Jefferson, Treatment of disinfection by-product precursors, Environ. Technol., 2011, 32(1), 1–25 CrossRef CAS PubMed.
- U. Von Gunten, Ozonation of drinking water: Part I. Oxidation kinetics and product formation, Water Res., 2003, 37(7), 1443–1467 CrossRef CAS PubMed.
- X. Zhong, C. Cui and S. Yu, Exploring the pathways of aromatic carboxylic acids in ozone solutions, RSC Adv., 2017, 7(55), 34339–34347 RSC.
- J. E. Kilduff, T. Karanfil, Y. P. Chin and W. J. Weber Jr., Adsorption of natural organic polyelectrolytes by activated carbon: A size-exclusion chromatography study, Environ. Sci. Technol., 1996, 30(4), 1336–1343 CrossRef CAS.
- D. Wang, Y. Zhao, J. Xie, C. W. K. Chow and J. Van Leeuwen, Characterizing DOM and removal by enhanced coagulation: A survey with typical Chinese source waters, Sep. Purif. Technol., 2013, 110, 188–195 CrossRef CAS.
- J. Song, X. Jin, X. C. Wang and P. Jin, Preferential binding properties of carboxyl and hydroxyl groups with aluminium salts for humic acid removal, Chemosphere, 2019, 234, 478–487 CrossRef CAS PubMed.
- J. P. Croué, D. Violleau, C. Bodaire and B. Legube, Removal of hydrophobic and hydrophilic constituents by anion exchange resin, Water Sci. Technol., 1999, 207–214 CrossRef.
- H. Humbert, H. Gallard, V. Jacquemet and J. P. Croué, Combination of coagulation and ion exchange for the reduction of UF fouling properties of a high DOC content surface water, Water Res., 2007, 41(17), 3803–3811 CrossRef CAS PubMed.
- D. L. Separations, DOWEX Ion Exchange Resins - Fundamentals of Ion Exchange, 2000 Search PubMed.
- J. K. Edzwald, Water quality & treatment. a handbook on drinking water, McGraw-Hill, 6th edn, 2012 Search PubMed.
- Livsmedelsverket. Livsmedelsverkets föreskrifter om dricksvatten, SLVFS, 2001, 30 2015 [Available from: http://www.livsmedelsverket.se/globalassets/om-oss/lagstiftning/dricksvatten---naturl-mineralv---kallv/slvfs-2001-30-kons-2015-3-webb.pdf.
- X. Zhang, S. Echigo, R. A. Minear and M. J. Plewa, Characterization and comparison of disinfection by-products of four major disinfectants, ACS Symp. Ser., 2000, 299–314 CrossRef CAS.
- C. M. M. Bougeard, E. H. Goslan, B. Jefferson and S. A. Parsons, Comparison of the disinfection by-product formation potential of treated waters exposed to chlorine and monochloramine, Water Res., 2010, 44(3), 729–740 CrossRef CAS PubMed.
- X. Zhu and X. Zhang, Modeling the formation of TOCl, TOBr and TOI during chlor(am)ination of drinking water, Water Res., 2016, 96, 166–176 CrossRef CAS PubMed.
- G. Hua and D. A. Reckhow, Effect of pre-ozonation on the formation and speciation of DBPs, Water Res., 2013, 47(13), 4322–4330 CrossRef CAS PubMed.
- G. Hua and D. A. Reckhow, Characterization of disinfection byproduct precursors based on hydrophobicity and molecular size, Environ. Sci. Technol., 2007, 41(9), 3309–3315 CrossRef CAS PubMed.
- J. P. Croué, D. Violleau and L. Labouyrie, Disinfection by-product formation potentials of hydrophobic and hydrophilic natural organic matter fractions: A comparison between a low- and a high-humic water, ACS Symp. Ser., 2000, 139–153 CrossRef.
- N. Ates, S. S. Kaplan, E. Sahinkaya, M. Kitis, F. B. Dilek and U. Yetis, Occurrence of disinfection by-products in low DOC surface waters in Turkey, J. Hazard. Mater., 2007, 142(1–2), 526–534 CrossRef CAS PubMed.
- M. S. Ersan, C. Liu, G. Amy and T. Karanfil, The interplay between natural organic matter and bromide on bromine substitution, Sci. Total Environ., 2019, 646, 1172–1181 CrossRef CAS PubMed.
- T. Bond, E. H. Goslan, S. A. Parsons and B. Jefferson, Disinfection by-product formation of natural organic matter surrogates and treatment by coagulation, MIEX® and nanofiltration, Water Res., 2010, 44(5), 1645–1653 CrossRef CAS PubMed.
- J. Lundqvist, A. Andersson, A. Johannisson, E. Lavonen, G. Mandava and H. Kylin, et al. Innovative drinking water treatment techniques reduce the disinfection-induced oxidative stress and genotoxic activity, Water Res., 2019, 155, 182–192 CrossRef CAS PubMed.
- B. I. Escher, M. Dutt, E. Maylin, J. Y. M. Tang, S. Toze and C. R. Wolf, et al. Water quality assessment using the AREc32 reporter gene assay indicative of the oxidative stress response pathway, J. Environ. Monit., 2012, 14(11), 2877–2885 RSC.
Footnote |
| † Electronic supplementary information (ESI) available. See DOI: 10.1039/c9ew00931k |
| This journal is © The Royal Society of Chemistry 2020 |

