 Open Access Article
Dual-wavelength efficient two-photon photorelease of glycine by π-extended dipolar coumarins†
Maxime
Klausen
*,
Victor
Dubois
,
Guillaume
Clermont
,
Claire
Tonnelé
 ,
Frédéric
Castet
 and
Mireille
Blanchard-Desce
 *
*
Univ. Bordeaux, Institut des Sciences Moléculaires (UMR5255 CNRS), 351 cours de la Libération, F-33405, Talence, France. E-mail: mireille.blanchard-desce@u-bordeaux.fr
First published on 13th March 2019
Abstract
Photolabile protecting groups (PPGs) releasing bioactive compounds upon two-photon excitation have emerged as increasingly popular tools to control and study physiological processes. Yet the limited two-photon photosensitivity of many cages is still a critical issue for applications. We herein report the design, synthesis and photophysical study of polarized extended coumarinyl derivatives which show large two-photon sensitivity (up to 440 GM) at two complementary wavelengths in the NIR spectral range. DFT calculations demonstrate that subtle tuning of polarization in the ground-state and confinement of the photo-induced intramolecular charge transfer upon excitation is responsible for enhancing two-photon absorption while maintaining large uncaging efficiency. These findings open a new engineering route towards efficient coumarinyl PPGs.
Introduction
Among the light-responsive organic structures available, uncagers1–3 represent key tools for biological and biomedical studies. These compounds act as photolabile protecting groups (PPGs) towards bioactive messengers, drugs4–6 or neurotransmitters,7–9 by masking their biological function. Suitable light irradiation then triggers the physiological response by releasing the free molecule with remarkable temporal and spatial control. In this respect, two-photon excitation (2PE) with near infrared (NIR) light provides significant advantages.10–14 As opposed to UV-visible light, NIR wavelengths allow deeper penetration in tissues, reduced photo-damage and intrinsic 3D resolution.10–14 The photolytic efficiency of a cage upon 2PE is quantified by its two-photon uncaging (2PU) cross-sections δu defined as δu = σ2Φu; where σ2 is the two-photon absorption (2PA) cross-section (in GM) and Φu the uncaging quantum yield.15Until recently, the use of most cages described in the literature was somewhat limited for in vivo applications due to their low 2PU cross-sections (with δmaxu values below 1 GM).1,15 To overcome this limitation and avoid the use of deleterious excitation powers, two main engineering strategies have been developed in the last decade: the modification of the π-conjugated backbone of known cages16–18 or the design of 2P sensitized tandem systems.19,20 Both strategies led in several cases to innovative PPGs with δu values over a dozen GM. In addition, the recent design of spectrally orthogonal cages is also of major promise for applications in neurosciences.21,22 In this regard, we have been interested in the design of cages with two complementary activation wavelengths, able to photorelease key amino-acids both at 700 nm and at 900 nm. Such cages would profitably complement the photochemical toolbox for neuroscientists. In particular, glycine (Gly) plays an important co-agonistic role, along with glutamate, in NMDA extrasynaptic receptors and is thus a key inhibitor neurotransmitter.23
This motivated our effort towards the design of versatile and efficient Gly PPGs with very large 2P sensitivity (i.e. over 100 GM) at these two main working wavelengths where efficient uncaging of agonist (Glu) or antagonist (GABA) was previously accomplished.21
Among the variety of structures available, coumarinylmethyl PPGs are among the most widely studied molecular architectures.1,24 The coumarin heterocyclic backbone, recognized as an efficient caging group,9,24–26 can undergo a wide panel of chemical functionalization modulating its optical properties. Introducing an electron-withdrawing group (EWG) at the 3-position of the coumarin cage21,27,28 was shown an influential way to red-shift both 1P and 2PA maxima respectively to the visible and the NIR,27,29–31 as evidenced by DEAC450 (Fig. 1).21 Indeed, the design of DEAC450, which allows the photorelease of caged acids (Glu, GABA) with blue light irradiation (instead of UV irradiation for seminal compound DEAC) or upon 2P excitation at 900 nm, was a crucial step forward in the development of efficient cages of interest for neuroscientists. In addition, DEAC450 was demonstrated to show a very good uncaging quantum yield for glutamate release (39%), while DEAC had an uncaging quantum yield of 12%. This demonstrated that the extension of the coumarinyl moiety at the 3-position could indeed shift the absorption spectra towards the visible but also significantly affect the photolysis efficiency. Yet, albeit causing a substantial increase of uncaging quantum yield for amino-acid release, the acrylamide extension implemented in DEAC450 appeared to have limited effects on its 2PA properties, as indicated by the reported δu value (0.5 GM at 900 nm in physiological conditions).21 This consideration led us to build our strategy on the increase of the 2PA response in new D–π–A extended DEAC derivatives, by (i) modulating the intramolecular charge transfer in the ground-state to achieve optimum polarization leading to maximal 2PA32 and (ii) further extending the π-conjugated system (Fig. 1). A major questioning was to assess how the photochemistry of the original cage is affected by such changes, and to determine to what extent the electronic distribution of the PPG can be tuned in order to maximize the σ2 without impeding the photolytic process. We thus prepared a small library of extended dipolar coumarinylmethyl derivatives bearing dedicated electron-withdrawing end-groups (EWG) at the 3-position (Fig. 1). To fulfil this role, we chose nitrogen-based aromatic heterocycles such as thiazoles and derivatives33 (Fig. 1). These new PPGs were then used to cage and release Fmoc-protected glycine with two primary goals: (i) performing a model study of the parameters regulating their photolytic efficiency, and (ii) enlightening the experimental results with DFT calculations in pursuance of rationale in the design of such coumarinyl PPGs.
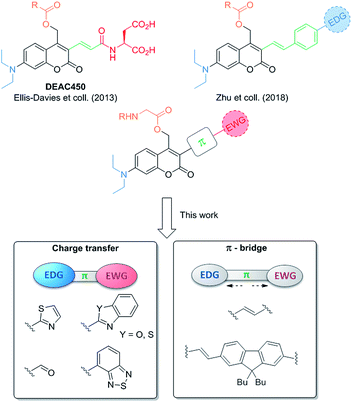 | ||
| Fig. 1 Recent evolution in the structure of π-extended coumarin PPGs and structures designed in the present work. | ||
Results and discussion
Design and synthesis
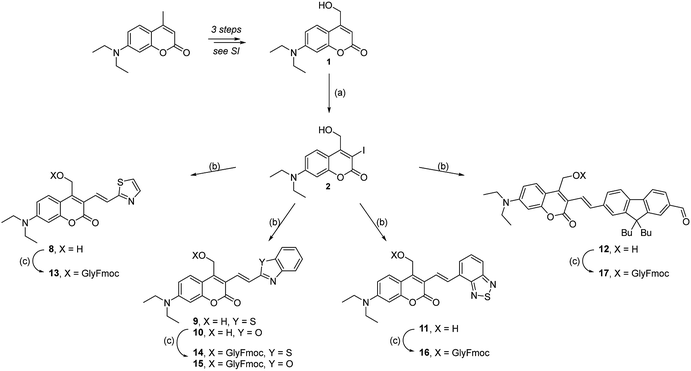
The synthetic layout of the new “free” DEAC cages involves three main challenges: the introduction of the fundamental 4-hydroxymethyl group on the aminocoumarin skeleton, the synthesis of the vinyl-acceptor moiety, and finally functionalization at the 3-position with the double bond. The formation of the alcohol 1 was achieved starting from the commercially available 7-diethylamino-4-methylcoumarin using an original pathway involving the formation of an intermediate enamine34 which was found to be much cleaner, more efficient and convenient than the usual selenium dioxide oxidation35 in our hands (Scheme S1†). The extension of the π-conjugated system at the 3-position of the coumarin scaffold was then achieved by Heck cross-coupling using the iodinated substrate 2.Iodination of the free alcohol 1 was successfully performed in good yield and large scale by using N-iodosuccinimide in the presence of a strong Lewis acid, which provided a highly activated source of electrophilic iodine (Scheme 1).
The vinyl-based electron-accepting modules were synthesized by different procedures, depending on the synthon. 2-Vinylbenzothiazole, -benzoxazole, and -benzothiadiazole derivatives (4, 5 and 6) were synthesized by Suzuki coupling with potassium vinyl trifluoroborate.36,37 2-Vinylthiazole (3) and 9,9-dibutyl-7-vinyl-9H-fluorene-2-carbaldehyde (7) were obtained by Wittig reactions starting from the corresponding aldehydes (see ESI†). Heck reaction using Jeffery conditions21,38 between intermediates 2 and 3–7 finally afforded compounds 8–12 in good to excellent yields, often without extensive purification (Scheme 1).
Eventually, condensation of intermediate 12 with 2-aminothiophenol hydrochloride yielded without additional protection step a fluorene-containing derivative 18, which was then esterified with Fmoc-Gly-OH to yield the final PPG 19 (Scheme 2).
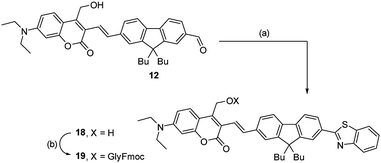 | ||
| Scheme 2 Synthesis of cage 19. Reagents and conditions: (a) 2-aminothiophenol hydrochloride, DMF, 120 °C (42%). (b) Fmoc-Gly-OH, EDC·HCl, DMAP (cat.), (64%). | ||
Photophysical properties
With all compounds in hands, the photophysical one- and two-photon absorption properties were investigated. Dimethylsulfoxide was chosen as solvent for the photophysical study due to its high polarity (thus closer to water than low-polarity organic solvents) reasonable viscosity (favourable to fluorescence) and optimal solubility of the whole series of compounds.All new PPGs show intense absorption in the visible and fluorescence properties (see spectra in ESI†). Experimental data are summarized in Table 1. As expected, the extension of the π-conjugated system with a vinyl-acceptor group at the 3-position induced a marked bathochromic and hyperchromic shift in absorption and red-shifted emission as compared to DEAC. This trend is amplified by the addition of the fused benzenic ring in the heterocyclic end-group, responsible for an additional 13 to 28 nm red-shift of the absorption band from thiazole to benzothiadiazole compared to DEAC450. A significant hyperchromic effect is also observed, as supported by the 40% enhancement of the εmax value in 14 compared to DEAC450. Interestingly, the elongated fluorenyl compounds 17 and 19 showed an intermediary behaviour, with absorption coefficients falling in the same range as the vinyl derivatives 14 and 15 but with less marked bathochromic shifts of their absorption/emission compared to DEAC450. Among the series, compound 16 which bears the strongest EWG shows a singular behaviour, with an absence of hyperchromic effect but a marked red-shifted and much weaker emission compared to DEAC450. This suggests that strong photo-induced ICT takes place after excitation prior to emission. This leads to a strongly polarized emissive excited-state which is stabilized by polar environments. This is confirmed by the pronounced positive fluorescent solvatochromic behaviour of this compound, not observed in other derivatives (see ESI†), and further demonstrated by DFT calculations (vide infra).
| Cpd | λ maxabs (nm) | ε max (M−1 cm−1) | λ maxem (nm) | Φ f | λ max2PA (nm) | σ max2 (GM) |
|---|---|---|---|---|---|---|
| a Fluorescence quantum yield (standard: fluorescein in 0.1 M NaOH (Φf = 0.9)). b Fluorescence quantum yield (standard: rhodamine 6G in EtOH (Φf = 0.94)). c 2PA cross-section at λmax2PA derived from 2PEF experiments in DMSO. d 2PA measurement performed in toluene. | ||||||
| DEAC450 | 444 | 3.4 × 10⁴ | 523 | 0.82a | 890 | 123 |
| 13 | 457 | 3.6 × 10⁴ | 541 | 0.95a | 950 | 164 |
| 700 | 191 | |||||
| 14 | 472 | 4.7 × 10⁴ | 562 | 0.87a | 970 | 371 |
| 710 | 441 | |||||
| 15 | 467 | 4.6 × 10⁴ | 552 | 0.92a | 970 | 267 |
| 700 | 367 | |||||
| 16 | 472 | 3.3 × 10⁴ | 692 | 0.13b | 970 | 215 |
| 730 | 191 | |||||
| 17 | 457 | 4.6 × 10⁴ | 553 | 0.56a | 940 | 147 |
| 730 | 621 | |||||
| 19 | 458 | 4.2 × 10⁴ | 547 | 0.59a | 940 | 143 |
| 730 | 988 | |||||
Uncaging properties
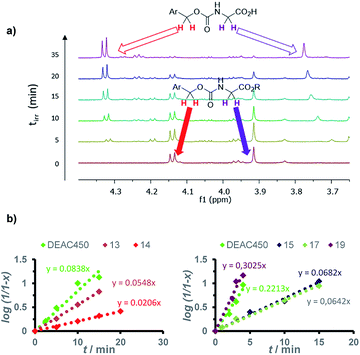
One-photon uncaging efficiencies were then assessed by irradiating samples of the new compounds and reference PPG at 455 nm, and monitoring unambiguously the release rate of the caged Fmoc-Gly-OH upon irradiation by 1H NMR (Fig. 2a). For the sake of comparison, we performed the photolysis in a CD3CN/D2O (9/1, v/v) mixture which is commonly used in the literature.27,39–41 In this model study, we also decided to preserve the protecting group on the glycine ester, which quite conveniently allowed the quantitation of the released species (rather than degradation of the cage) either by monitoring the CH2 of the amino-acid itself or that of the Fmoc protecting group.First order kinetics were observed in all cases (Fig. 2b), allowing the derivation of the one-photon uncaging sensitivity ε455Qrelu from the slope values compared to those of DEAC450-Gly irradiated in the exact same conditions (see ESI†),42 and subsequently, the ratio of the relative uncaging quantum yield Qrelu value toward the reference uncaging quantum yield Φrefu (Table 2).
| Cpd | ε 455 nm (M−1 cm−1) | Q relu/Φrefua | Q relu | ε maxu (M−1 cm−1) | λ max2PA (nm) | δ maxu (GM) |
|---|---|---|---|---|---|---|
| a Ratio of uncaging quantum yield values derived from comparative 1P photolysis experiments in CD3CN/D2O (9/1, v/v) at 455 nm. b Uncaging quantum yield values calculated using Φrefu = 0.39 for DEAC450-[Gly]. c One-photon uncaging sensitivity at λmax. d Two-photon uncaging sensitivity at λmax2PA estimated from comparative 1P photolysis experiments and 2PEF measurements. | ||||||
| DEAC450 | 3.2 × 10⁴ | 1 | 0.39 | 13 × 103 | 890 | 48 |
| 13 | 3.6 × 10⁴ | 0.50 | 0.20 | 7.8 × 10³ | 950 | 32 |
| 700 | 37 | |||||
| 14 | 4.1 × 10⁴ | 0.21 | 0.08 | 4.0 × 10³ | 970 | 30 |
| 710 | 36 | |||||
| 15 | 4.1 × 10⁴ | 0.24 | 0.09 | 4.5 × 10³ | 970 | 25 |
| 700 | 35 | |||||
| 16 | 3.0 × 10⁴ | <0.02 | — | — | 970 | — |
| 730 | — | |||||
| 17 | 4.6 × 10⁴ | 0.23 | 0.09 | 4.2 × 10³ | 940 | 13 |
| 730 | 56 | |||||
| 19 | 4.3 × 10⁴ | 1.14 | 0.45 | 21 × 103 | 940 | 64 |
| 730 | 442 | |||||
All compounds except 19 proved to have lesser uncaging rates than DEAC450-Gly. Yet, the relative uncaging quantum yields still reached 20% for compound 13, which remains higher than most PPGs described so far. A marked reduction of the Qrelu value was revealed by benzo-compounds 14 and 15 whose efficacy is largely reduced (by about 50% compared to compound 13) indicating that the presence of the fused ring on the EWG is detrimental to the photorelease efficiency. Most markedly, compound 16 did not proceed to uncaging of glycine upon excitation, and proved unsuitable for uncaging applications.
The benzothiadiazolyl end-group, the strongest EWG in the series, is clearly detrimental to photolysis, indicating that a strongly polarized excited-state and marked photo-induced ICT is unfavourable for this specific purpose. This behaviour was further confirmed by DFT calculations, which revealed that the elongation of the C–O bond upon excitation in compound 16 is 2–3 times smaller than in the other compounds (vide infra).
Surprisingly, a different behaviour was observed for extended derivatives 17 and 19 bearing a fluorenyl unit in the conjugated π-connector. While the aldehyde derivative 17 displays a moderate but still reasonable Qrelu of 9%, the benzothiazolyl derivative 19 shows an uncaging efficiency comparable to that of DEAC450 (Table 2). Indeed, 19 proved slightly faster than reference compound DEAC450 upon 1P photolysis, leading to a Qrelu value of 45%, whereas its vinyl counterpart 14 displayed a Qrelu value of only 8%. This suggests that the introduction of an intermediate fluorenyl π-bridge in compound 19 is responsible for a redistribution in the electron density,43 favouring significant increase of Φu.
Dark stability
Importantly, whereas amino acid esters have sometimes been reported unstable in aqueous media,9 all of our new compounds proved to be stable towards dark hydrolysis in this photolysis medium, as no significant degradation of the chromophores was observed after several days in solution in the dark at room temperature (see ESI†).DFT calculations
DFT calculations conducted at the M06-2X/6-311G(d) level44 were performed to gain further insight into the polarization and electronic structures of the ground and first excited states of these derivatives. Table 3 reports the vertical spectroscopic properties of the investigated compounds, together with the electric dipoles of the S0 and S1 states (μ0 and μvert1) and their difference (Δμvert01). The computed absorption spectra are reported in ESI.† In every compound, the first optically allowed excited state (S1) is dominated by a HOMO → LUMO π–π* excitation. Excitations implying the HOMO−1 and LUMO+1 also contribute to the S0 → S1 transition in extended derivatives 17 and 19 (see ESI† for details). The isodensity surfaces of the frontier orbitals are sketched in Fig. 3 and show that both HOMO and LUMO are delocalized along the conjugated part of the molecule.| Cpd | λ exp | ΔEexp | ΔE01 | λ 01 | f 01 | μ 01 | μ 0 | μ vert1 | Δμvert01 | q CT | d CT |
|---|---|---|---|---|---|---|---|---|---|---|---|
| DEAC450 | 444 | 2.793 | 3.125 | 397 | 1.39 | 10.81 | 6.76 | 14.99 | 8.25 | 0.584 | 2.940 |
| 13 | 457 | 2.713 | 2.935 | 422 | 1.70 | 12.36 | 6.38 | 12.41 | 6.70 | 0.540 | 2.581 |
| 14 | 472 | 2.627 | 2.874 | 431 | 1.87 | 13.09 | 7.52 | 14.89 | 8.09 | 0.568 | 2.967 |
| 15 | 467 | 2.655 | 2.902 | 427 | 1.84 | 12.94 | 8.05 | 14.97 | 7.59 | 0.566 | 2.789 |
| 16 | 472 | 2.627 | 2.941 | 422 | 1.55 | 11.78 | 12.92 | 22.51 | 10.53 | 0.581 | 3.775 |
| 17 | 457 | 2.713 | 3.012 | 412 | 2.23 | 13.99 | 14.39 | 21.28 | 7.18 | 0.551 | 2.714 |
| 19 | 458 | 2.707 | 3.004 | 413 | 2.57 | 15.02 | 11.22 | 17.10 | 6.35 | 0.544 | 2.433 |
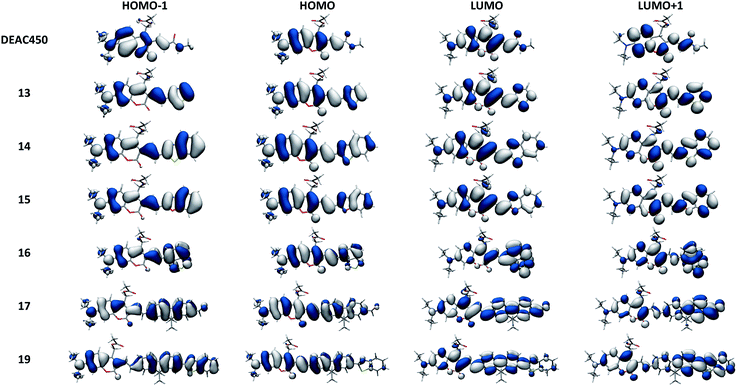 | ||
| Fig. 3 Graphical representations of the frontier orbitals of the investigated compounds, calculated at the IEFPCM:M06-2X/6-311G(d) level. | ||
As shown in Table 3, TDDFT calculations qualitatively reproduce the red-shifts measured experimentally upon substitution at the 3-position of the coumarin cage. With respect to the reference compound DEAC450, adding a fused benzenic ring on the terminal EWG (from thiazole in compound 13, to benzothiazole in compound 14) results in computed bathochromic shifts of 0.08 and 0.17 eV, respectively, which compares well with the measured bathochromic displacements of 0.19 and 0.25 eV. Besides, the associated increase of the oscillator strength is also in accordance with the hyperchromic shift observed experimentally. The absence of further red-shift of the absorption band in the more extended compounds 17 and 19 is similarly well reproduced. Finally, TDDFT calculations support the specific spectroscopic properties of compound 16, which shows a marked bathochromic but no significant hyperchromic shift with respect to DEAC450. These spectral evolutions can be traced back to the magnitude of the photo-induced ICT, which is quantified by the dipole moment variation Δμvert01. In particular, the largest Δμvert01 value is found for 16, which is mostly related to an increased charge transfer distance dCT in this compound. The total charge transferred is however of similar magnitude for all compounds (Table 3).
In order to gain better insight into the difference of photochemical behavior between derivatives, relaxed geometries of the S1 states were calculated. Table 4 reports the photo-induced elongation of the C–O single bond connecting the glycine ester to the coumarinylmethyl protecting moiety, defined as the difference between the C–O distances issued from S1 and S0 gas phase optimizations  . The adiabatic (Eadia) and 0–0 energies (E0–0) are also reported, as well as the excited-state dipole moment (μopt1) and photo-induced dipole moment variation (Δμopt01) calculated using relaxed gas phase geometries (Δμopt01 = μopt1 − μ0). Finally, these last two quantities were further refined to account for solvent effects, by performing IEF-PCM:TD-DFT single-point calculations (Table 4, last columns).
| Gas | Acetonitrile | ||||||
|---|---|---|---|---|---|---|---|
| Δ CO | E adia | E 0–0 | μ opt1 | Δμopt01 | μ opt+s1 | Δμopt+s01 | |
| DEAC450 | 0.018 | 3.309 | 3.221 | 9.11 | 4.27 | 13.97 | 7.26 |
| 13 | 0.015 | 3.061 | 2.987 | 6.85 | 2.60 | 11.05 | 5.37 |
| 14 | 0.013 | 2.983 | 2.909 | 8.19 | 2.95 | 13.79 | 6.98 |
| 15 | 0.014 | 3.021 | 2.944 | 7.75 | 2.23 | 13.60 | 6.23 |
| 16 | 0.008 | 2.895 | 2.828 | 15.13 | 5.90 | 22.99 | 10.99 |
| 17 | 0.015 | 2.971 | 2.907 | 13.37 | 2.85 | 20.48 | 6.97 |
| 19 | 0.014 | 2.928 | 2.863 | 9.80 | 2.61 | 16.35 | 6.53 |
We note a slight elongation of the C–O bond in all compounds in relaxed excited state S1 from which photochemistry and fluorescence occur. It is interesting to note that compound 16 exhibits the smallest ΔCO value within the series (more than twice smaller than that of DEAC450), together with the largest excited-state dipole moment (μopt+s1 = 23 D, about twice larger than that of DEAC450), and photo-induced dipole moment variation. This result confirms that the large photo-induced ICT occurring within this compound is detrimental to its uncaging efficiency. On the other hand, all other new derivatives (13–15, 17, 19) show similar ΔCO values, close to that of DEAC450.
Neither the excited dipole moments values, nor the variation of dipole moment appear to show direct correlation with uncaging efficiency. However, closer examination of HOMO–LUMO43 does reveal interesting features. For compounds 13–16, photo-induced ICT extends to the EW end-groups; the sharpest effect being observed for compound 16 which bears the strongest terminal EWG. In contrast, the photo-induced ICT remains mostly limited to the extended conjugated system in compound 17 and 19. Furthermore, comparison of the dCT values of these two compounds (Table 3) indicates that extension of the photo-induced ICT leads to a decrease of uncaging efficiency (Fig. 4).
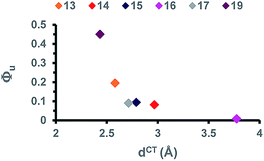 | ||
| Fig. 4 Correlation between the extent of photo-induced ICT (dCT) and the relative uncaging quantum yields Qrelu in compounds 13–17 and 19. | ||
To further investigate the origin of difference in uncaging efficiency between derivatives 13–17, and 19, calculation of the carbocations that are presumed key intermediates in the photolysis mechanism45,46 was undertaken (see ESI†). Starting from the relaxed geometries of the S1 photo-activated state, rigid energy scans were first performed by elongating progressively the C–O bond up to the photolytic dissociation limit, in order to evaluate the bond dissociation energy (BDE) in the excited electronic state. Geometry optimizations of the carbocations were also conducted in the S0 state to compare their relative stability with respect to the parent coumarinyl derivatives (see ESI†). These two series of calculations led to very similar conclusions. Interestingly, fluorenyl-based compounds 17 and 19 give rise to the lowest BDE and to the most stable carbocations within the series whereas compounds 14 and 15 lead to the largest BDE and to the least stable carbocations. We note however that the compound DEAC450 falls out of the correlation (as was the case for dCT) suggesting that different mechanisms might be involved.
Two-photon absorption
The two-photon absorption spectra of the new PPGs 13–17 and 19 were determined by conducting two-photon excited fluorescence experiments (2PEF) in DMSO solution (Table 1). DMSO was chosen as a viscous non-protic solvent, thus promoting fluorescence (Table 1) and allowing accurate and reliable 2PA measurements. At opposite, the presence of water, although beneficial to photorelease, logically reduces fluorescence.All compounds exhibit two intense 2PA bands in the spectral range of interest (690–1000 nm) which is not the case of DEAC450 (Fig. 5a and b) which is blue-shifted compared to the series of compounds investigated.
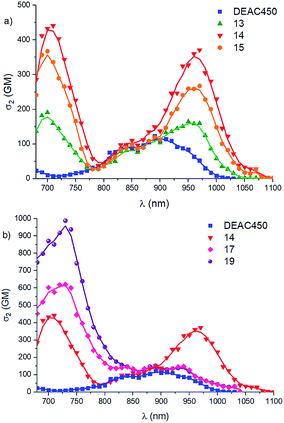 | ||
| Fig. 5 Comparison of the 2PA spectra of (a) vinyl derivatives 13–15 and DEAC450 in DMSO; (b) dipolar compounds 14, 17, 19 and DEAC450 in DMSO. | ||
An intense band located at about twice the maximum wavelength of 1PA (see ESI†) is observed around 940–970 nm with maximum 2PA cross-sections varying between 140 and 370 nm. Firstly, we note that the maximum 2PA cross-section measured for DEAC450 in DMSO (123 GM at 890 nm) is almost two orders of magnitude larger than the one derived from δu and Φu values reported in buffered water (i.e., 1.3 GM). This difference may partly be related to solvent effect as water may significantly affect 2PA. We note that 2PA measurements reported earlier for coumarin 1, a 4-methyl analogue of DEAC yielded a maximum 2PA cross-section in ethanol of 103 GM at 755 nm.47 Our measurements gave a σmax2 value of 44 GM at 760 nm for DEAC450 in DMSO (see ESI†), illustrating the influence of the environment and electric field effects on 2PA. These values are consistent with the larger maximum 2PA cross-section measured for extended DEAC450 at 890 nm (123 GM). The almost two-orders of magnitude smaller σmax2 value derived from the reported δu value (1.3 GM) suggests that formation of dimers of DEAC450 may occur in the aqueous environment where δu measurements were conducted. Indeed formation of dimers of dipolar chromophores may significantly reduce 2PA properties.48
Secondly, we observe that all new derivatives show red-shifted and more intense 2PA responses than DEAC450 (Fig. 5). While compound 13 shows slightly larger σmax12 value (165 GM instead of 123 GM) than DEAC450, the additional fused benzenic ring on the EWG in 14 and 15 induces a two to three fold enhancement of this value (i.e., 370 GM and 270 GM respectively). In contrast, the εmax values were found to increase by only 40%, evidencing stronger effect on 2PA. As a result, extended coumarin derivatives 14 and 15 show unprecedented 2PA responses at 970 nm, over one order of magnitude larger than coumarin fluorochromes commonly used in bioimaging.49 We also note that compound 14 shows a 37% larger σmax12 value as compared to compound 15, confirming that the benzothiazole EWG leads to larger 2PA responses than benzoxazole.
Compound 16, which bears the strongest EWG in the series and shows the largest polarization for derivatives of similar length (see Table 3, μ0 = 12.9 D), shows a broader and weaker 2PA band than compounds 14 and 15, with a σmax12 reaching 215 GM. This indicates that derivatives 14 and 15 are close to optimum polarization (μg = 7.5 and 8.0 D) leading to maximal 2PA, while compound 16 is most probably too polarized (i.e. over optimum ICT in the ground state).32 In contrast, extended derivatives 17 and 19 show σmax12 values which are similar and only slightly larger than that of DEAC450 (i.e. 150 and 140 GM). Hence the presence of the fluorenyl bridge is detrimental to the low energy 2PA band, in relation with lesser ICT in the ground state due to the higher cost associated with charge separation along the full length of molecules 17 and 19.32
Strikingly, a second and even more intense higher energy band is observed around 700–730 nm for all new PPGs (Fig. 5). This higher energy band is strongly 2P allowed and corresponds to a strongly 1P allowed excited-state only for extended compounds 17 and 19 (see ESI†). The addition of a fused benzenic ring in the terminal EWG induces a significant increase of the σmax22 bands (Fig. 5a), as indicated by the comparison of compounds 13 and 14. The nature of the heterocyclic moiety, also significantly influences the σmax22 values as witnessed by the 19% increase observed in the benzothiazole PPG 14 (440 GM) compared to its benzoxazole counterpart 15 (370 GM).
Again, compound 16 shows a different behaviour. Due to its far-red/NIR emission in DMSO, which prevented access to the higher energy band located around 700 nm by 2PEF measurements, 2PA measurements were conducted in toluene (a solvent in which compound 16 emits in the visible, see ESI†). The resulting measurements in the full 700–1100 nm range do reveal a second high energy band, as in the other dipolar compounds. As was the case for the low-energy 2PA band, the σmax22 value (around 200 GM, see Table 1) is again much lower than for analogues 14 and 15 of similar size.
In contrast, a spectacular influence of the fluorenyl bridge is evidenced in compounds 17 and 19 (Fig. 5b). Unlike their lower-energy 2PA bands, the transitions located at 730 nm show very high maxima, with a σmax22 value twice larger for the benzothiazolyl derivative 19 than for its shorter analogue 14. With a remarkable σmax2 value of 990 GM, compound 19 also exhibits a 60% higher 2PA cross-section than its aldehyde counterpart 17, hereby evidencing the role of the EWG in the phenomenon. The differences in the 2PA higher energy maxima of these three compounds can be related to the nature of the second optically allowed absorption band, as rationalized by DFT calculations (see ESI†). In compound 19, the S0 → S2 transition is strongly optically allowed (as indicated by its large oscillator strength, f02 = 0.55), and associated to a large photo-induced dipole variation (Δμ02 = 6.89 D). In compound 17, absorption towards the second bright excited state (which corresponds to the S0 → S3 transition) also gives rise to a significant reorganization of the electron density (Δμ03 = 8.58 D) but with a twice-smaller intensity (f03 = 0.29). In 14, the intensity of the S0 → S2 transition is much weaker (f02 = 0.13) and associated to a negligible Δμ02 value (0.46 D).
Two-photon uncaging
As discussed above, the nature of the EWGs as well as the presence of a conjugated linker significantly affects both the 2PA response and the uncaging efficiency. In particular optimum polarization leads to very large 2PA responses both at 970 nm (370 and 270 GM for compounds 14 and 15 respectively) and 700 nm (440 GM and 370 GM for compounds 14 and 15) while insertion of the fluorenyl unit in the conjugated system leads to very large 2PA responses at 730 nm. Besides, the extension of electronic redistribution (dCT) is detrimental to the uncaging efficiency. Hence both tuning of ICT in the ground-state and limitation of electronic redistribution upon excitation are key parameters which control the two-photon sensitivity (δu = σ2 × Φu).Extrapolated 2P uncaging sensitivities derived from previous measurements of 2PA cross-section and uncaging quantum yield are reported in Table 2. Although the nature of solvent does affect the 2PA response (vide supra), these values give consistent trends among the series of derivatives and allow direct comparison with DEAC450. For PPGs of the vinyl series 13–15, the increase in σmax2 is somewhat counterbalanced by a drop of Qrelu. Yet, in all three cases, the calculated δu values reach about 35 GM for irradiation in the higher energy band and 25–30 GM for the lowest energy band. These values are only slightly smaller than that extrapolated for DEAC450;50 their main advantage being that they can be used either at 700–720 nm (like DEAC or MNI)8,25 or at 950 nm, thus offering improved penetration depth and interesting sequential alternatives for in vivo experiments. As such they represent promising uncaging tools to be used in conjunction with complementary cages that would photorelease antagonists and coagonists of Gly.
Eventually, thanks to its very large 2PA cross-sections in the 700–750 nm range (over 700 GM) combined with a slightly improved uncaging quantum yield with respect to DEAC450, the extended fluorenyl derivative 19 shows a record estimated δu of about 440 GM at 730 nm. To confirm the potential use of this new derivative in 2P uncaging experiments, we performed the irradiation of 19 at both 2P maxima for 7 h in similar conditions, and compared the conversion of the photolysis reaction with two appropriate standards, i.e. DEAC at 730 nm and DEAC450 at 940 nm (Fig. 6). Irradiation of the samples at 730 nm clearly evidenced a sevenfold enhancement in 2P photosensitivity between compound 19 and parent DEAC, in agreement with δu values derived from 1P uncaging studies and 2PEF measurements using the δu = σ2 × Φu relationship. Furthermore, we observe a major enhancement (by about a factor 8) of the 2P sensitivity of compound 19 at 730 nm compared to is 2P photosensitivity at 940 nm. Again, this is consistent with the relative δu values derived at 730 and 940 nm for this compound, thus validating our study. Finally, comparative irradiation of DEAC450 and compound 19 at 940 nm indicate an enhancement of 2P sensitivity by over a factor 2, as anticipated from comparison of δu values of both compounds derived from 1P uncaging and 2PEF studies.
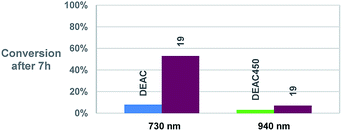 | ||
| Fig. 6 Comparative histogram showing the conversion of the uncaging reaction (Gly release) after 7 h of two-photon irradiation at 730 and 940 nm in similar conditions (1.2 mL, 1 W). | ||
This study demonstrates that by tuning ICT in the ground state and electronic redistribution in the photoactive excited state, we could indeed enhance both uncaging efficiency and 2PA properties. As a result, coumarin derivative 19 shows unprecedented 2P sensitivity at 730 nm while retaining similar 2P sensitivity at 890 nm as DEAC450. In contrast, shorter derivative 13 shows similar 2P sensitivity, comparable to DEAC450, at two complementary wavelengths (700 and 950 nm).
Conclusion
This work unveils a new direction towards dipolar coumarin cages with unique two-photon uncaging sensitivity. The combination of experimental spectroscopic investigation with computational chemistry revealed surprising structure–property relationships where subtle tuning of the ground-state polarization and containment of photo-induced redistribution in the excited state triggers both the photolysis and the 2PA ability. These achievements open the route to unique opportunities in neurosciences. Further work along that direction is currently in progress.Computational methods
The geometry of the ground (S0) and first singlet excited (S1) states were optimized in the gas phase in the framework of the Density Functional Theory (DFT) using the M06-2X exchange–correlation functional44 and the 6-311G(d) basis set. All structures were characterized as real minima of the potential energy surface on the basis on their positive vibrational force constants. Ground state optimized geometries were used to compute the vertical transition energies and excited state properties by employing the Time-Dependent Density Functional Theory (TD-DFT) at the M06-2X/6-311G(d) level. Solvent effects (acetonitrile) were taken into account in these calculations by using the Integral Equation Formalism of the Polarizable Continuum Model (IEF-PCM).51 The photo-induced charge transfer was analyzed on the basis of vertical electronic transitions, by considering the difference Δμvert01 in the electric dipoles of the S0 and S1 states. Using the approach reported in ref. 52 and 53, Δμvert01 was further decomposed as Δμvert01 = qCT × dCT, where qCT is the photo-induced charge transfer, i.e. the global amount of charge transferred upon light excitation, and dCT is the distance over which this charge is transferred.Then, the effects of structural relaxation on the electronic structure of the S1 state were addressed. The adiabatic energies, defined as the energy difference of the S1 and S0 states in their respective minimum  , were calculated on the basis of the gas phase geometries. The 0–0 energies were then evaluated as the sum of the adiabatic contribution and the difference of zero-point vibrational energy (ZPVE) between S1 and S0 (E0–0 = Eadia + ΔEZPVE). Finally, IEF-PCM:TD-DFT single-point calculations in acetonitrile were performed on the (gas phase) relaxed geometries of S1, to evaluate the excited-state dipole moment and photo-induced dipole moment variation Δμopt+s01 accounting for geometrical relaxation effects. All calculations were performed using the Gaussian 09 package.54
Conflicts of interest
The authors declare no conflicts of interest.Acknowledgements
MBD gratefully acknowledges the Conseil Régional d'Aquitaine for funding (“Chaire d'Accueil d'excellence” grant). We also acknowledge the University of Bordeaux for fellowships to MK and VD. CT thanks the LAPHIA Centre of Excellence, managed by the ANR under the initiative of excellence (IdEx) program (reference ANR-10-IDEX-0003-02), for her postdoctoral fellowship. Computer time was provided by the Pôle Modélisation HPC facilities of the Institut des Sciences Moléculaires, co-funded by the Nouvelle Aquitaine region.Notes and references
- P. Klán, T. Šolomek, C. G. Bochet, A. Blanc, R. Givens, M. Rubina, V. Popik, A. Kostikov and J. Wirz, Photoremovable Protecting Groups in Chemistry and Biology: Reaction Mechanisms and Efficacy, Chem. Rev., 2013, 113, 119–191 CrossRef PubMed.
- G. C. R. Ellis-Davies, Caged compounds: photorelease technology for control of cellular chemistry and physiology, Nat. Methods, 2007, 4, 619–628 CrossRef CAS PubMed.
- H. Yu, J. Li, D. Wu, Z. Qiu and Y. Zhang, Chemistry and biological applications of photo-labile organic molecules, Chem. Soc. Rev., 2010, 39, 464–473 RSC.
- R. Horbert, B. Pinchuk, P. Davies, D. Alessi and C. Peifer, Photoactivatable Prodrugs of Antimelanoma Agent Vemurafenib, ACS Chem. Biol., 2015, 10, 2099–2107 CrossRef CAS PubMed.
- D. E. McLain, A. C. Rea, M. B. Widegren and T. M. Dore, Photoactivatable, biologically-relevant phenols with sensitivity toward 2-photon excitation, Photochem. Photobiol. Sci., 2015, 14, 2151–2158 RSC.
- Y. Venkatesh, S. Karthik, Y. Rajesh, M. Mandal, A. Jana and N. D. P. Singh, Three-Arm, Biotin-Tagged Carbazole–Dicyanovinyl–Chlorambucil Conjugate: Simultaneous Tumor Targeting, Sensing, and Photoresponsive Anticancer Drug Delivery, Chem.–Asian J., 2016, 11, 3482–3486 CrossRef CAS PubMed.
- E. M. Callaway and L. C. Katz, Photostimulation using caged glutamate reveals functional circuitry in living brain slices, Proc. Natl. Acad. Sci. U. S. A., 1993, 90, 7661–7665 CrossRef CAS.
- M. Matsuzaki, G. C. R. Ellis-Davies, T. Nemoto, Y. Miyashita, M. Iino and H. Kasai, Dendritic spine geometry is critical for AMPA receptor expression in hippocampal CA1 pyramidal neurons, Nat. Neurosci., 2001, 4, 1086–1092 CrossRef CAS PubMed.
- T. Furuta, S. S.-H. Wang, J. L. Dantzker, T. M. Dore, W. J. Bybee, E. M. Callaway, W. Denk and R. Y. Tsien, Brominated 7-hydroxycoumarin-4-ylmethyls: Photolabile protecting groups with biologically useful cross-sections for two photon photolysis, Proc. Natl. Acad. Sci. U. S. A., 1999, 96, 1193–1200 CrossRef CAS.
- F. Terenziani, C. Katan, E. Badaeva, S. Tretiak and M. Blanchard-Desce, Enhanced Two-Photon Absorption of Organic Chromophores: Theoretical and Experimental Assessments, Adv. Mater., 2008, 20, 4641–4678 CrossRef CAS.
- M. Pawlicki, H. A. Collins, R. G. Denning and H. L. Anderson, Two-Photon Absorption and the Design of Two-Photon Dyes, Angew. Chem., Int. Ed., 2009, 48, 3244–3266 CrossRef CAS PubMed.
- S. Yao and K. D. Belfield, Two-Photon Fluorescent Probes for Bioimaging, Eur. J. Org. Chem., 2012, 2012, 3199–3217 CrossRef CAS.
- D. Kim, H. G. Ryu and K. H. Ahn, Recent development of two-photon fluorescent probes for bioimaging, Org. Biomol. Chem., 2014, 12, 4550–4566 RSC.
- H. M. Kim and B. R. Cho, Small-Molecule Two-Photon Probes for Bioimaging Applications, Chem. Rev., 2015, 115, 5014–5055 CrossRef CAS PubMed.
- G. Bort, T. Gallavardin, D. Ogden and P. I. Dalko, From One-Photon to Two-Photon Probes: “Caged” Compounds, Actuators, and Photoswitches, Angew. Chem., Int. Ed., 2013, 52, 4526–4537 CrossRef CAS PubMed.
- L. Donato, A. Mourot, C. M. Davenport, C. Herbivo, D. Warther, J. Léonard, F. Bolze, J.-F. Nicoud, R. H. Kramer, M. Goeldner and A. Specht, Water-Soluble, Donor–Acceptor Biphenyl Derivatives in the 2-(o-Nitrophenyl)propyl Series: Highly Efficient Two-Photon Uncaging of the Neurotransmitter γ-Aminobutyric Acid at λ = 800 nm, Angew. Chem., Int. Ed., 2012, 51, 1840–1843 CrossRef CAS PubMed.
- K. M. Schelkle, T. Griesbaum, D. Ollech, S. Becht, T. Buckup, M. Hamburger and R. Wombacher, Light-Induced Protein Dimerization by One- and Two-Photon Activation of Gibberellic Acid Derivatives in Living Cells, Angew. Chem., Int. Ed., 2015, 54, 2825–2829 CrossRef CAS PubMed.
- Q. Lin, L. Yang, Z. Wang, Y. Hua, D. Zhang, B. Bao, C. Bao, X. Gong and L. Zhu, Coumarin Photocaging Groups Modified with an Electron-Rich Styryl Moiety at the 3-Position: Long-Wavelength Excitation, Rapid Photolysis, and Photobleaching, Angew. Chem., Int. Ed., 2018, 57, 3722–3726 CrossRef CAS PubMed.
- K. A. Korzycka, P. M. Bennett, E. J. Cueto-Diaz, G. Wicks, M. Drobizhev, M. Blanchard-Desce, A. Rebane and H. L. Anderson, Two-photon sensitive protecting groups operating via intramolecular electron transfer: uncaging of GABA and tryptophan, Chem. Sci., 2015, 6, 2419–2426 RSC.
- E. Cueto Diaz, S. Picard, M. Klausen, V. Hugues, P. Pagano, E. Genin and M. Blanchard-Desce, Cooperative Veratryle and Nitroindoline Cages for Two-Photon Uncaging in the NIR, Chem.–Eur. J., 2016, 22, 10848–10859 CrossRef CAS PubMed.
- J. P. Olson, H.-B. Kwon, K. T. Takasaki, C. Q. Chiu, M. J. Higley, B. L. Sabatini and G. C. R. Ellis-Davies, Optically Selective Two-Photon Uncaging of Glutamate at 900 nm, J. Am. Chem. Soc., 2013, 135, 5954–5957 CrossRef CAS PubMed.
- J. P. Olson, M. R. Banghart, B. L. Sabatini and G. C. R. Ellis-Davies, Spectral Evolution of a Photochemical Protecting Group for Orthogonal Two-Color Uncaging with Visible Light, J. Am. Chem. Soc., 2013, 135, 15948–15954 CrossRef CAS PubMed.
- J. W. Johnson and P. Ascher, Glycine potentiates the NMDA response in cultured mouse brain neurons, Nature, 1987, 325, 529–531 CrossRef CAS PubMed.
- R. S. Givens, M. Rubina and J. Wirz, Applications of p-hydroxyphenacyl (pHP) and coumarin-4-ylmethyl photoremovable protecting groups, Photochem. Photobiol. Sci., 2012, 11, 472–488 RSC.
- V. Hagen, B. Dekowski, V. Nache, R. Schmidt, D. Geißler, D. Lorenz, J. Eichhorst, S. Keller, H. Kaneko, K. Benndorf and B. Wiesner, Coumarinylmethyl Esters for Ultrafast Release of High Concentrations of Cyclic Nucleotides upon One- and Two-Photon Photolysis, Angew. Chem., Int. Ed., 2005, 44, 7887–7891 CrossRef CAS PubMed.
- G. P. Hess, B. K. Carpenter, V. Shembekar and Y. Chen, US Pat., 2007243519 (A1), 2007.
- L. Fournier, I. Aujard, T. Le Saux, S. Maurin, S. Beaupierre, J.-B. Baudin and L. Jullien, Coumarinylmethyl Caging Groups with Redshifted Absorption, Chem.–Eur. J., 2013, 19, 17494–17507 CrossRef CAS PubMed.
- Y. Chitose, M. Abe, K. Furukawa and C. Katan, Design, Synthesis, and Reaction of π-Extended Coumarin-based New Caged Compounds with Two-photon Absorption Character in the Near-IR Region, Chem. Lett., 2016, 45, 1186–1188 CrossRef CAS.
- M.-S. Schiedel, C. A. Briehn and P. Bäuerle, Single-Compound Libraries of Organic Materials: Parallel Synthesis and Screening of Fluorescent Dyes, Angew. Chem., Int. Ed., 2001, 40, 4677–4680 CrossRef CAS PubMed.
- J. Yu and Y. Shirota, A New Class of High-Performance Red-Fluorescent Dyes for Organic Electroluminescent Devices, [7-Diethylamino-3-(2-thienyl)chromen-2-ylidene]-2,2-dicyanovinylamine and {10-(2-Thienyl)-2,3,6,7-tetrahydro-1H,5H-chromeno[8,7,6-ij]quinolizin-11-ylidene}-2,2-dicyanovinylamine, Chem. Lett., 2002, 31, 984–985 CrossRef.
- A. Gandioso, S. Contreras, I. Melnyk, J. Oliva, S. Nonell, D. Velasco, J. García-Amorós and V. Marchán, Development of Green/Red-Absorbing Chromophores Based on a Coumarin Scaffold That Are Useful as Caging Groups, J. Org. Chem., 2017, 82, 5398–5408 CrossRef CAS PubMed.
- M. Barzoukas and M. Blanchard-Desce, Molecular engineering of push–pull dipolar and quadrupolar molecules for two-photon absorption: A multivalence-bond states approach, J. Chem. Phys., 2000, 113, 3951–3959 CrossRef CAS.
- K. D. Belfield, A. R. Morales, B.-S. Kang, J. M. Hales, D. J. Hagan, E. W. Van Stryland, V. M. Chapela and J. Percino, Synthesis, Characterization, and Optical Properties of New Two-Photon-Absorbing Fluorene Derivatives, Chem. Mater., 2004, 16, 4634–4641 CrossRef CAS.
- G. H. Mcgall and A. D. Barone, US Pat., 2011028350 (A1), 2011.
- P. Stegmaier, J. M. Alonso and A. del Campo, Photoresponsive Surfaces with Two Independent Wavelength-Selective Functional Levels, Langmuir, 2008, 24, 11872–11879 CrossRef CAS PubMed.
- G. A. Molander and M. R. Rivero, Suzuki Cross-Coupling Reactions of Potassium Alkenyltrifluoroborates, Org. Lett., 2002, 4, 107–109 CrossRef CAS PubMed.
- J. J. Smith, D. Best and H. W. Lam, Copper-catalyzed borylative coupling of vinylazaarenes and N-Boc imines, Chem. Commun., 2016, 52, 3770–3772 RSC.
- T. Jeffery, On the efficiency of tetraalkylammonium salts in Heck type reactions, Tetrahedron, 1996, 52, 10113–10130 CrossRef CAS.
- C. Bao, G. Fan, Q. Lin, B. Li, S. Cheng, Q. Huang and L. Zhu, Styryl Conjugated Coumarin Caged Alcohol: Efficient Photorelease by Either One-Photon Long Wavelength or Two-Photon NIR Excitation, Org. Lett., 2012, 14, 572–575 CrossRef CAS.
- M. Petit, C. Tran, T. Roger, T. Gallavardin, H. Dhimane, F. Palma-Cerda, M. Blanchard-Desce, F. C. Acher, D. Ogden and P. I. Dalko, Substitution Effect on the One- and Two-photon Sensitivity of DMAQ “Caging” Groups, Org. Lett., 2012, 14, 6366–6369 CrossRef CAS.
- S. Picard, E. Genin, G. Clermont, V. Hugues, O. Mongin and M. Blanchard-Desce, Octupolar chimeric compounds built from quinoline caged acetate moieties: a novel approach for 2-photon uncaging of biomolecules, New J. Chem., 2013, 37, 3899–3913 RSC.
- S. R. Adams, J. P. Y. Kao, G. Grynkiewicz, A. Minta and R. Y. Tsien, Biologically useful chelators that release Ca2+ upon illumination, J. Am. Chem. Soc., 1988, 110, 3212–3220 CrossRef CAS.
- T. Šolomek, J. Wirz and P. Klán, Searching for Improved Photoreleasing Abilities of Organic Molecules, Acc. Chem. Res., 2015, 48, 3064–3072 CrossRef PubMed.
- Y. Zhao and D. G. Truhlar, The M06 suite of density functionals for main group thermochemistry, thermochemical kinetics, noncovalent interactions, excited states, and transition elements: two new functionals and systematic testing of four M06-class functionals and 12 other functionals, Theor. Chem. Acc., 2008, 120, 215–241 Search PubMed.
- B. Schade, V. Hagen, R. Schmidt, R. Herbrich, E. Krause, T. Eckardt and J. Bendig, Deactivation Behavior and Excited-State Properties of (Coumarin-4-yl)methyl Derivatives. 1. Photocleavage of (7-Methoxycoumarin-4-yl)methyl-Caged Acids with Fluorescence Enhancement, J. Org. Chem., 1999, 64, 9109–9117 CrossRef CAS.
- R. Schmidt, D. Geissler, V. Hagen and J. Bendig, Kinetics Study of the Photocleavage of (Coumarin-4-yl)methyl Esters, J. Phys. Chem. A, 2005, 109, 5000–5004 CrossRef CAS PubMed.
- A. Fischer, C. Cremer and E. H. K. Stelzer, Fluorescence of coumarins and xanthenes after two-photon absorption with a pulsed titanium–sapphire laser, Appl. Opt., 1995, 34, 1989–2003 CrossRef CAS PubMed.
- F. Terenziani, M. Morone, S. Gmouh and M. Blanchard-Desce, Linear and Two-Photon Absorption Properties of Interacting Polar Chromophores: Standard and Unconventional Effects, ChemPhysChem, 2006, 7, 685–696 CrossRef CAS PubMed.
- A. S. Melnikov, P. Y. Serdobintsev, A. D. Vedyaykin and M. A. Khodorkovskii, Two-photon absorption cross section for Coumarins 102, 153 and 307, J. Phys.: Conf. Ser., 2017, 917, 062029 CrossRef.
- The extrapolated δu value for DEAC450, determined from measurements conducted in MeCN/H2O (90/10, v/v) is two orders larger than the one reported in the literature for direct δu measurements conducted in biological medium. Although the 2PA response of DEAC450 was found to depend on the solvent (see ESI†), this could not account for such a discrepancy. Our study suggests that the reported δu value for DEAC450 may be significantly underestimated, making it one of the best 2P uncagers currently available.
- J. Tomasi, B. Mennucci and R. Cammi, Quantum Mechanical Continuum Solvation Models, Chem. Rev., 2005, 105, 2999–3094 CrossRef CAS.
- T. Le Bahers, C. Adamo and I. Ciofini, A Qualitative Index of Spatial Extent in Charge-Transfer Excitations, J. Chem. Theory Comput., 2011, 7, 2498–2506 CrossRef CAS.
- D. Jacquemin, T. L. Bahers, C. Adamo and I. Ciofini, What is the “best” atomic charge model to describe through-space charge-transfer excitations?, Phys. Chem. Chem. Phys., 2012, 14, 5383–5388 RSC.
- M. J. Frisch, G. W. Trucks, H. B. Schlegel, G. E. Scuseria, M. A. Robb, J. R. Cheeseman, G. Scalmani, V. Barone, B. Mennucci, G. A. Petersson, H. Nakatsuji, M. Caricato, X. Li, H. P. Hratchian, A. F. Izmaylov, J. Bloino, G. Zheng, J. L. Sonnenberg, M. Hada, M. Ehara, K. Toyota, R. Fukuda, J. Hasegawa, M. Ishida, T. Nakajima, Y. Honda, O. Kitao, H. Nakai, T. Vreven, J. A. Montgomery Jr, J. E. Peralta, F. Ogliaro, M. Bearpark, J. J. Heyd, E. Brothers, K. N. Kudin, V. N. Staroverov, R. Kobayashi, J. Normand, K. Raghavachari, A. Rendell, J. C. Burant, S. S. Iyengar, J. Tomasi, M. Cossi, C. Rega, J. M. Millam, M. Klene, J. E. Knox, J. B. Cross, V. Bakken, C. Adamo, J. Jaramillo, R. Gomperts, R. E. Stratmann, O. Yazyev, A. J. Austin, R. Cammi, C. Pomelli, J. W. Ochterski, R. L. Martin, K. Morokuma, V. G. Zakrzewski, G. A. Voth, P. Salvador, J. J. Dannenberg, S. Dapprich, A. D. Daniels, Ö. Farkas, J. B. Foresman, J. V. Ortiz, J. Cioslowski and D. J. Fox, Gaussian 09 revision D01, Gaussian Inc., Wallingford CT, 2009 Search PubMed.
Footnote |
| † Electronic supplementary information (ESI) available: Experimental details of synthesis, photophysical and photochemical studies. DFT calculations. See DOI: 10.1039/c9sc00148d |
| This journal is © The Royal Society of Chemistry 2019 |

