Brilliant blue, green, yellow, and red fluorescent diamond particles: synthesis, characterization, and multiplex imaging demonstrations†
Nicholas
Nunn
 *a,
Neeraj
Prabhakar
 b,
Philipp
Reineck
 c,
Valentin
Magidson
 d,
Erina
Kamiya
 e,
William F.
Heinz
d,
Marco D.
Torelli
a,
Jessica
Rosenholm
 b,
Alexander
Zaitsev
f and
Olga
Shenderova
*a
aAdámas Nanotechnologies, Inc., 8100 Brownleigh Drive, Suite 120, Raleigh, NC 27617, USA. E-mail: nnunn@adamasnano.com; oshenderova@adamasnano.com
bPharmaceutical Sciences Laboratory, Faculty of Science and Engineering, Åbo Akademi University, Tykistokatu 6A, Turku 20520, Finland
cARC Centre of Excellence for Nanoscale BioPhotonics & School of Science, RMIT University, Melbourne, VIC 3001, Australia
dOptical Microscopy and Analysis Laboratory, Cancer Research Technology Program, Frederick National Laboratory for Cancer Research, Frederick, MD 21702, USA
eOptical Microscopy and Analysis Laboratory, Office of Science and Technology Resources, Center for Cancer Research, National Cancer Institute, National Institutes of Health, Frederick, MD 21702, USA
fCollege of Staten Island (CUNY), 2800 Victory Blvd., Staten Island, NY 10312, USA
First published on 6th June 2019
Abstract
Until recently, the number of emission colors available from fluorescent diamond particles was primarily limited to red to near-infrared fluorescence from the nitrogen-vacancy color center in type Ib synthetic diamond and green fluorescence associated with the nitrogen-vacancy-nitrogen center in type Ia natural diamond. Using our recently reported rapid thermal annealing technique, we demonstrate the capability of producing fluorescent diamond particles that exhibit distinctive blue, green, yellow, and red fluorescence from the same synthetic diamond starting material. Utilizing these multiple colored diamonds, we analyze their fluorescence characteristics both in-solution as well as on-substrate and additionally evaluate their viability in simple multiplex imaging and cellular bioimaging experiments. While there are still challenges associated with their immediate use in traditional multiplex imaging, this novel approach opens new opportunities to enhance the capability and flexibility of fluorescent diamond particles at the nanoscale.
1. Introduction
Targeted fluorescent imaging is widely used in biomedical research and is being investigated for translational implementation in clinical applications, with several ongoing clinical trials.1 Demand exists for fluorescent labels which are non-toxic, bright, photostable, targetable, and possess the capability for multiplex imaging. Targeted labeling coupled with multiplex fluorescence imaging can provide profound insight into complex biological structures and interactions at the cellular and organelle level, allowing for selective study of specific biomarkers amidst surrounding components simultaneously, ideally without a priori knowledge of the spatial arrangement of the biological moieties under study.2–6 However, it is rare that traditionally used fluorescent labels satisfy all of the necessary requirements for photostability, biocompatibility, brightness, ease of targeting, and multiplexing capability. To this end, the use of combinatorial labeling2,3 of biological targets or spectral unmixing algorithms7,8 based on fluorescent brightness and even differences in photostability have been demonstrated to achieve multiplexed imaging.Fluorescent nanodiamonds (FNDs) containing color centers are biocompatible fluorophores which exhibit infinite photostability, robust chemical stability, and readily functionalizable surfaces for targeted delivery in biological applications.9–12 Fluorescence in diamond originates from atomic defects within the crystalline lattice. Hundreds of such optically active centers have been and continue to be identified.13,14 However, their use in true multiplexing applications has been limited to demonstrations of dual-modal imaging with either red and green emitting FNDs using cathodoluminescence15 or red and near-infrared (NIR) emitting FNDs.16 This lack of extension into multiplexing applications is primarily due to the difficulty in producing more structurally complex defect centers which emit in the visible and NIR spectral regions. The majority of focus has been on the nitrogen vacancy (NV), nitrogen-vacancy-nitrogen (NVN, or H3), and silicon-vacancy (SiV) centers, providing emission in the red, green, and NIR, respectively. We recently reported a novel rapid thermal annealing (RTA) method of producing multicolor FNDs exhibiting fluorescence across the visible spectrum from blue to red using electron irradiated type Ib high-pressure high temperature (HPHT) synthetic diamond.17 This method involves heating and cooling irradiated diamond particles to predetermined high temperatures very rapidly (on the order of seconds to a few minutes) such that the simultaneous diffusion of specific atomic species (e.g. vacancies and nitrogen) can be facilitated and more precisely controlled as compared to traditional annealing approaches, resulting in controlled formation of specific color centers or combinations of multiple types of color centers within particles. As a result, the formation of more structurally complex color centers, such as the three-nitrogen vacancy complex (N3 center), providing blue fluorescence, or the two-nitrogen vacancy complex (NVN center) are possible. Importantly, these results were achieved in type Ib synthetic diamond. Previously, the formation of N3 and NVN centers was only possible in type Ia natural diamonds, which impart inherent unpredictability as a result of their natural origin.
While our earlier efforts primarily focused on the demonstration of the RTA technique on particles greater than 10 μm in size,17 the present manuscript demonstrates an extension of this technique to the nanoscale, with particular emphasis placed on the materials characterization as well as demonstrations in a multiplex imaging experiment. Herein we report the synthesis, characterization, and demonstration of multicolored fluorescent diamond particles exhibiting green, yellow, and red fluorescence in particles less than approximately 150 nm in size. The capability of producing nanoscale blue fluorescent diamond particles is demonstrated in brief. Evaluation of the particles’ photoluminescence characteristics at both the ensemble (in-solution) and particulate (on-substrate) level is performed, as well as demonstration with a simple labeling experiment with poly(styrene) microbeads and in vitro cellular imaging.
2. Experimental
2.1. Synthesis
Synthetic type Ib HPHT diamond particles with initial substitutional nitrogen content of ∼100 ppm were used for the production of all fluorescent colors in this study. Particles were irradiated with high energy electrons (3 MeV) to fluences of 1 × 10¹⁹ e cm−2 to generate vacancies, and subsequent various annealing regimes were used to generate specific color center combinations. Red, green, and yellow FNDs were all prepared from 100–140 nm starting particle sizes, and blue fluorescent diamond particles were prepared by milling 15–25 μm particles. Red FNDs were prepared by annealing at 850 °C for 2-hours under vacuum to form NV centers, as is well-established in literature.18,19 Green, yellow, and blue fluorescent particles were annealed using our previously reported17 RTA approach at 1800 °C for 2 min, 1700 °C for 3 min, and 1900 °C for 4 min, respectively. Subsequent oxidation using standard procedures well-established in literature20,21 was used to remove graphitic carbon and provide a carboxylated (–COOH) terminal surface chemistry on the particles.For reference in on-substrate analysis, type Ia natural green FNDs (NAT-green) of approximately 140 nm prepared via helium ion beam irradiation were used.22 These natural FND particles were used as a comparison to the green fluorescent particles produced by RTA. In particular, the fluorescence uniformity and contributions of NV versus H3 fluorescence was investigated.
2.2. Photoluminescence characterization
Photoluminescence characterization consisted of in-solution based as well as on-substrate based (dry particles on substrate) analyses. Details of the experimental setups for each approach are described separately below.Fluorescence emission spectra were collected with either laser excitation (WhiteLase SC400, NKT Photonics) at 400 nm (23.6 mW), 450 nm (34.2 mW), 500 nm (47.5 mW), and 550 nm (49.7 mW) or with broad excitation from a mercury lamp using 365 nm (nominal) (UV Excitation, UV-2A filter cube, Nikon), 470/28 nm (blue excitation, Semrock), or 517/20 nm (green excitation, Semrock) excitation filters with long pass 420 nm (Nikon), 488 nm (Semrock), and 561 nm (Semrock) nm filters, respectively. In the case of laser-based excitation, spectra were collected with an Ocean Optics Flame spectrometer (Ocean Optics, Germany). Spectra from the mercury lamp excitation source were collected with an Ocean Optics HR2000 USB spectrometer affixed to a widefield Olympus IX-71 inverted epifluorescence microscope. In the case of Fig. 2a, spectra of solutions under broadband UV excitation (nominal 365 nm) were collected with an Acton SP2150 Spectrometer (Princeton Instruments). Specific integration times used are noted in the Discussion section or in the ESI† where appropriate.
Brightness comparisons were performed for red and green FND against standard organic dyes. Alexa Fluor™ 647 (AF647, Thermo Fisher) and Fluorescein isothiocyanate (FITC, Sigma-Aldrich) were used for comparison to the red and green fluorescent diamonds, respectively, by integrating over the corresponding fluorescence spectra. Comparisons were done at both equal weight and equal molar concentrations. Nominal particle sizes of 140 nm were assumed (based on dynamic light scattering) for the red and green FNDs, both at concentrations of 0.1 mg mL−1 in deionized water. AF647 was prepared in deionized water, and FITC was prepared in 10 mM sodium hydroxide due to its poor solubility at neutral pH. The green FNDs and FITC were excited at 450 nm, with emission collected from a 500 nm long pass filter (all filters from Edmund Optics), whereas the red FNDs and AF647 were excited at 550 nm and 600 nm, respectively, with the FND emission collected through a 600 nm long pass and dye emission without a filter. Additional details related to the brightness comparison are shown in Table S1 (ESI†).
Lifetime measurements were collected for the red and green FNDs and compared against the aforementioned organic dyes. All samples were prepared, excited, and their fluorescence collected as described above. The yellow FNDs were also suspended in DI water (0.1 mg mL−1) and analyzed at 450 nm and 550 nm excitation, as they contain a mixture of red and green emitting color centers. Fluorescence decay traces were collected using a single photon counting avalanche photodiode (SPCM-AQRH-XX-TR, Excelitas, USA) and a correlator card (PicoHarp260, PicoQuant, Germany) synchronized to the laser excitation pulses at 5 MHz repetition rate. Lifetime values were determined from double exponential (FNDs) and single exponential (dyes) fits to the decay traces as previously reported.23 Due to a low amount of available material, the ‘fancy blue’ particles were not characterized for lifetime.
For correlative analysis, topographic images of FNDs in the same fields that were imaged as described above were collected with an atomic force microscope (AFM) (Cypher VRS, Asylum Research) operating in tapping mode in air using an OTESPA-R3 probe (Olympus) after each coverslip was trimmed with a diamond scribe tip and glued to the appropriate sample holder. Image alignment and analysis was performed using ImageJ, ThunderSTORM24 (default settings with peak intensity threshold set to 5), and MATLAB. See the ESI† for source code and additional information.
Characterization of the blue fluorescent diamond particles consisted of only particulate based photoluminescent spectroscopy using the aforementioned Olympus IX-71 epifluorescence microscope with UV excitation (350/50 nm) and long pass emission filter (405 nm).
2.3. Imaging demonstrations
Separately, 2 mL suspensions at ∼0.25 mg mL−1 in deionized water of each of three colors of diamond particles were pelleted with centrifugation at 15.8k rcf for 10 min. The particles were reconstituted into 1 mL of dry dimethylformamide (DMF, Millipore Sigma) and pelleted once more at the same centrifugation conditions before a final reconstitution into 1 mL of dry DMF. This second pelleting was done to facilitate removal of residual water. A 100 mg mL−1 stock solution of 1,1′-carbonyldiimidazole (CDI, Millipore Sigma) was prepared in dry DMF, and 1 mL of this suspension was aliquoted into each of the three 2 mL microcentrifuge tubes containing FNDs in DMF. These solutions were then incubated for one hour each on a shaker plate. After the one-hour CDI-activation of the diamond particles was completed, they were pelleted at 15.8k rcf per 10 min, and reconstituted in to approximately 100 μL of dry DMF, before being added to each of the three prepared solutions of SA-beads (one for each of the respective colors of diamond particles used). The combined SA-beads and diamond solutions were incubated overnight at room temperature on a shaker plate. The following day, the FND-labeled SA-beads were washed with 1% bovine serum albumin in PBS to remove unconjugated diamond for fluorescence imaging. This labeling approach can lead to labeling of the amines of biotin-NH2 as well as those present in streptavidin, leading to a higher labeling density overall. As a control experiment to determine, qualitatively, the uniformity of SA coating on the microbeads, a separate solution of SA-beads (the same amount as used with diamond labeling) was incubated with excess Cyanine-5-Biotin (cy5-Biotin) for 30 minutes and subsequently washed and imaged.
Microscopy of the labeled beads was performed with an Olympus IX-71 inverted epifluorescence microscope with mercury lamp excitation. 10 μL droplets of the labeled beads were placed on coverslip glass (Gold Seal™, Thermo Fisher) for imaging. Micrographs were captured with a 5-Megapixel CCD fluorescence microscope camera (MT5000-CCD, AmScope). Different emission filters were used depending on the specific instance of imaging, and are thus specifically noted in figures and in the discussion section where appropriate. All filters and dichroics used for these experiments are listed in Table S2 (ESI†). Images were taken with different objectives (10×, 40×, and 100×; with or without 1.6× multiplier lens), and these are noted specifically in figure captions and in the discussion section. Specific details of the models and types of objective lenses used are listed in Table S4 (ESI†).
3. Results & discussion
3.1 Synthesis
Our previous work discussed many of the aspects related to the RTA treatment on electron irradiated particulate diamond;17 therefore, an extended discussion on the specifics of the synthesis technique is not provided here. Generally, the observations of our previous work are confirmed in this study and extended to smaller particle sizes. In particular, at annealing temperatures above approximately 1700 °C, significant changes in the luminescence become apparent due to the onset of radiation-stimulated diffusion of nitrogen. Importantly, this annealing technique is again demonstrated as suitable for even reasonably small particulate sizes on the order of 100–140 nm in diameter for the formation of NV, H3 (NVN), and N3 color centers providing red/orange, green, and blue fluorescence, respectively, in type Ib synthetic diamond (see Fig. S1, ESI,† for particle size distributions of red, green, and yellow FNDs used in this study).During rapid annealing, combinations of these various color centers form and result in diamond particulates exhibiting fluorescence across the visible spectrum. In the case of this work, the yellow FNDs are representative of a combination of NV and H3 centers, providing a combination of red/orange and green fluorescence, thereby resulting in a net yellow fluorescence under appropriate excitation conditions.
3.2 In-solution based photoluminescence characterization
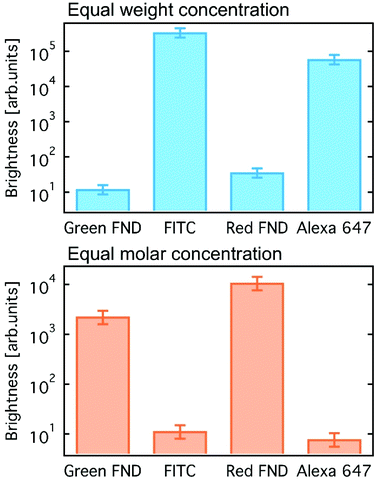
A comparison of fluorescent brightness intensity between fluorescent diamond and organic dyes by both equal molar concentrations and equal weight (mass) concentrations are shown in Fig. 1. In the equal weight consideration, FITC and AF647 are approximately four orders of magnitude brighter than green and red fluorescent diamonds, respectively. This is a result of a single diamond particle having significantly greater mass than a single dye molecule; therefore, by mass we are effectively comparing millions of dye molecules with a single diamond particle. In the equivalent molar consideration, one dye is implicitly compared to one FND particle, green and red fluorescent diamonds are effectively two and three orders of magnitude brighter than FITC and AF647, respectively. In this case, it is important to consider that a single diamond particle contains hundreds of fluorescent centers (H3 or NV centers for green or red diamonds, respectively) and is compared with one dye molecule only. These brightness comparisons at equal weight (mass) concentrations as well as equal molar concentrations are consistent with previously reported comparisons between fluorescent diamond and organic dyes,25,26 and thorough analysis of fluorescence characteristics of nanodiamond particles as compared to other fluorescent materials was previously reported.25 The mass and molar brightness comparisons are important considerations in both experimental design and utility, for example labeling targets expressed at low levels. We note that the yellow FNDs were not considered for this comparison, because, unlike a typical yellow dye (e.g. Rhodamine 6G), the yellow FNDs are a combination of red and green fluorescence emission from NV and H3 centers. Thus, a direct comparison to a yellow fluorescent dye is less instructive. Table S1 (ESI†) contains the quantitative parameters used for brightness comparison.Fig. 2 shows the emission spectra for each diamond type collected under UV excitation (365 nm) using an optical long pass (405 nm) filter and blue excitation (470/28 bandpass) using an optical long pass (488 nm) filter. The laser excitation wavelength (λex) dependence of the fluorescence of each diamond type is highlighted in Fig. S2 (ESI†). In the case of laser excitation, Raman scattering from water becomes continually more pronounced at lower excitation wavelengths; this Raman scattering effect for all laser excitation wavelengths is shown in Fig. S3 (ESI†) for water. Because of this, the emission spectrum of the diamond particles in-solution at 400 nm is particularly skewed by the water Raman, shown in Fig. S2 (ESI†). Fig. S4 (ESI†) directly compares the effect of different excitation wavelengths on the FND fluorescence spectra based on the data plotted in Fig. S2 (ESI†). A close examination of the emission spectra reveals several interesting characteristics of each of the diamond particle types, and each is now discussed separately.
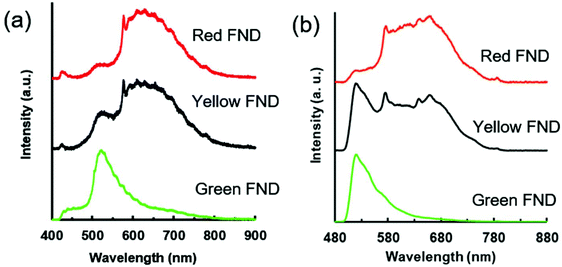 | ||
| Fig. 2 (a) Fluorescence spectra for red, yellow, and green FNDs suspended in water (1 mg mL−1) under broadband UV excitation (nominal 365 nm, 0.8 s integration time). (b) Fluorescence spectra for red, yellow, and green FNDs suspended in water (1 mg mL−1) under broadband blue excitation (470/28 nm, 3 s integration time). The spectrometer used to collect the spectra in panel (a) provides higher resolution than the one shown in panel (b), thus the spectroscopic features appear sharper in comparison. Characteristics of filters and spectrometers used in collection of spectra are summarized in Table S3 (ESI†). | ||
The green FNDs, as expected, exhibit a predominance of H3 related emission centered around 520 nm emission under 450 nm excitation. An optical filter cuts off this emission below 550 nm in the case of 500 nm excitation; however, there is a clear shoulder extending upwards attributed to the H3 center. Under 550 nm excitation, the green FNDs still exhibit detectable amounts of NV related fluorescence. This is expected given the high thermal stability of NV centers observed with previous RTA treatments of diamond.17 From a materials engineering perspective, it may be challenging to completely remove all NV centers because of their temperature stability and graphitization that can occur when exposing the particles to high temperature at atmospheric pressure for extended times. However, it is possible reduce their concentration in the diamond lattice to levels below the detection limit under specific imaging conditions. For example, in the case of broadband blue excitation (Fig. 2b), the NV related emission is effectively undetectable. Demonstrations with confocal optical microscopy illustrate this point further (see section 3.4).
The yellow FNDs exhibit a combination of emission from H3 and NV centers, most apparent under 450 nm excitation. However, the relative brightness of the yellow particles is significantly lower than that of the green particles under 450 nm excitation (Fig. S2b ESI†). Under 400 nm excitation, the majority of the signal collected below 550 nm in the yellow FNDs may be attributed to water Raman scattering. However, there is a more pronounced shoulder for yellow FNDs from approximately 500–550 nm in comparison to red FNDs, and this is attributed to H3 centers (Fig. S2a ESI†). Moreover, the green FNDs exhibit a well-pronounced peak under the same excitation. This suggests that the relative amounts of H3 centers in the yellow FNDs are lower in comparison to the green particles, since an increase in the H3 contribution will lead to dominant green fluorescence. Yellow light can be made by an approximate 50/50 mix of red and green light; thus, it might be expected that under the appropriate excitation and emission conditions, the spectral intensities of fluorescence contribution from NV and H3 centers would be approximately similar in the case of the yellow particles. This would appear to be the case in Fig. 2b under broadband blue excitation. Nevertheless, it is important to note that observed fluorescence emission is strongly excitation wavelength dependent (Fig. S2 ESI†), and the observed fluorescence of the yellow FNDs in particular can change dramatically depending on the excitation wavelength and optical filter set used. In comparing 500 and 550 nm excitation (Fig. S2c and d ESI†), the yellow diamond exhibits a lower amount of NV0 (neutrally charged NV center) related fluorescence (shoulder from approximately 550 nm to 625 nm) than the red diamond particles. Thus, the relative NV0 contribution is apparently higher in the red FNDs as compared to the yellow FNDs. This may be explained by either a structural difference or processing difference in the yellow FNDs. Structurally, the presence of H3 centers may affect NV0 emission. From a processing standpoint, the red FNDs were annealed at a much lower temperature (850 °C) compared to the 1700 °C temperature of the yellow FNDs, and the higher temperature annealing clearly affects defect center configurations.
Under 360 nm UV excitation, the shoulder associated with the H3 center (∼500–550 nm) is observed in both the red and yellow FNDs. The peak is more pronounced in the yellow FNDs than the red FNDs; moreover, both are significantly lower in comparison to the H3 peak observed for the green FNDs (Fig. 2a). Under blue excitation (Fig. 2b), the H3 related peak is more pronounced in the yellow FNDs as compared to the same diamonds under UV excitation (Fig. 2a). This is due to the weak excitation efficiency of H3 centers with the 365 nm excitation source as compared excitation lines closer to 480 nm (e.g. the blue excitation used in Fig. 2b). Interestingly, NV0 absorption extends all the way to the bandgap energy (5.6 eV, ∼220 nm),13 which explains why the NV0 contribution is still so pronounced under UV excitation.
Lastly, the appearance of a weak shoulder from approximately 530–580 nm in the red FNDs under blue excitation (Fig. S2d ESI†) is a shorter wavelength component of the NV0 center.
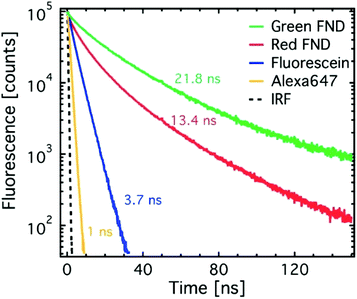
Fig. 3 shows time-resolved fluorescence decay traces for the red and green diamonds in comparison to standard dyes. The dyes exhibit lifetimes on the order of literature reported values.27 The green diamonds (H3 center) exhibit longer fluorescence lifetimes than the red diamonds (NV center), which has previously been shown in literature.28–31 The lifetime value of 21.8 ns determined here for the green FNDs (H3 center) differs from previously reported lower value of 16 ns for the H3 center in bulk diamond.28 However, precedence for increased lifetimes from the NV center has been shown in nanoparticles as compared to bulk diamond.32 The significant difference in fluorescence lifetime of green and red FNDs implies that fluorescence lifetime imaging microscopy (FLIM) can be used to enhance contrast between red and green diamonds. Fluorescence lifetime imaging has previously been demonstrated with the NV center in particular.31,33
3.3 On-substrate based particulate fluorescence characterization
While in-solution based photoluminescent spectroscopy generates a wealth of information with respect to the average luminescence of many particles, substrate based particle characterization yields information about individual particles, revealing the degree of heterogeneity within each group of FNDs. Inhomogeneous FNDs used as targeted fluorescent labels for cells or other biological features can complicate identification and imaging, particularly at higher magnifications. Due to processing, even state-of-the-art fluorescent nanodiamonds exhibit some degree of non-uniformity. This non-uniformity can arise from the starting material, processing conditions, and particle size and shape, among other factors.23 Novel irradiation approaches have been demonstrated as a means to improve fluorescence uniformity,34 and the RTA approach may offer a unique post processing step to facilitate higher particle fluorescence uniformity, or, at the very least, brighter particles, which are also greatly needed.From Fig. 4, several observations can be made: (1) the red FNDs exhibit the brightest fluorescence in the far-red channels, (2) the yellow FNDs also exhibit high brightness in the far-red emission channel; however, they also exhibit higher fluorescence in the green channel under 488 nm excitation as compared to red FNDs. Thus, the yellow FNDs apparently contain both NV and H3 centers, which is consistent with the in-solution based spectroscopy. (3) Comparison between the RTA synthesized green FNDs versus the green FNDs synthesized from natural diamond indicates that the RTA treated green FNDs containing H3 centers show more intense green fluorescence compared to natural diamonds containing H3 centers. They also exhibit more NV related fluorescence in comparison to the natural diamonds. The higher brightness observed in the RTA synthesized green FNDs can be associated with the lower nitrogen content of type Ib diamond compared to type Ia natural diamond. It has previously been observed that increasing nitrogen content can suppress both the luminescence intensity as well as the fluorescence lifetime of the H3 center in diamond.35,36 In particular, the effects of high nitrogen content in the form of A centers (N–N pairs) on lattice strain fields has been suggested as a mechanism for this quenched emission.35 The presence of NV centers in the RTA treated sample is also an indication of the very high temperature stability of the NV center, which can persist even a very high temperatures once formed.13 Fig. S5 (ESI†) contains a complete picture of all excitation/emission combinations used for this substrate based analyses as well as intensity normalized AFM-confocal images. Fig. S6 (ESI†) shows the emission intensity of fluorescent particles as a function of size as determined by correlative AFM and spinning disk confocal microscopy.
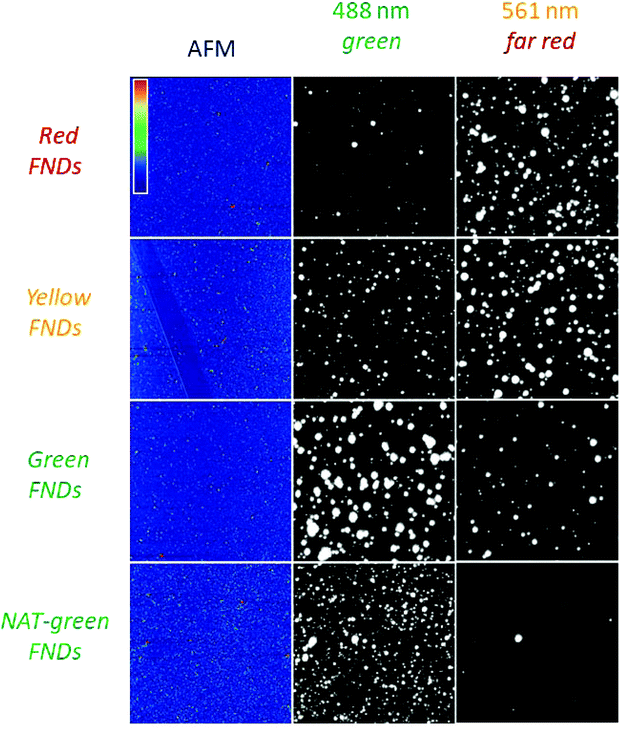 | ||
| Fig. 4 Correlative fluorescence microscopy and AFM of individual FNDs (red, yellow, green, NAT-green). Each field of FNDs was imaged with a spinning disk confocal microscope at different combinations of excitation laser and emission collection channels. For each excitation/emission combination, gray-levels are scaled up to present estimates of relative brightness per unit laser power per unit of emission bandwidth. See MATLAB source code (ESI†) for details of grayscale adjustment. Emission bands are typical spectral ranges used on commercial microscopes to collect “green” (e.g., GFP) and “far red” (e.g., AF647). Each square is 30 μm × 30 μm. The color range in the AFM field (violet to red) corresponds to a height of (0–100 nm). | ||
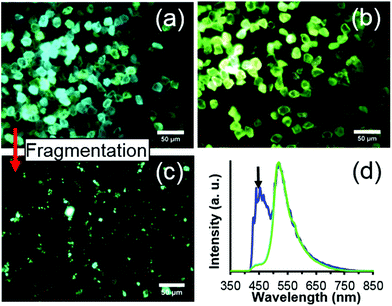
Lastly, Fig. 5 demonstrates the possibility of ‘fancy blue’ fluorescent diamond particles. Fancy blue particles contain a mixture of N3 and H3 centers, providing an aquamarine fluorescence under UV excitation which is distinct from that of particles containing predominantly H3 centers. Importantly, this fancy blue fluorescence does not appear to be significantly altered upon fragmentation, and this suggests the possibility of achieving nanoscale sized particles with a new and distinct fluorescence that was not previously achieved at that size scale. For this study, only a very small amount of the fancy blue material was produced, thus, a more extensive evaluation of the material was not performed, but will be the subject of future studies.
3.4 Imaging demonstrations
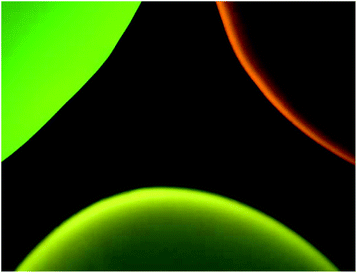
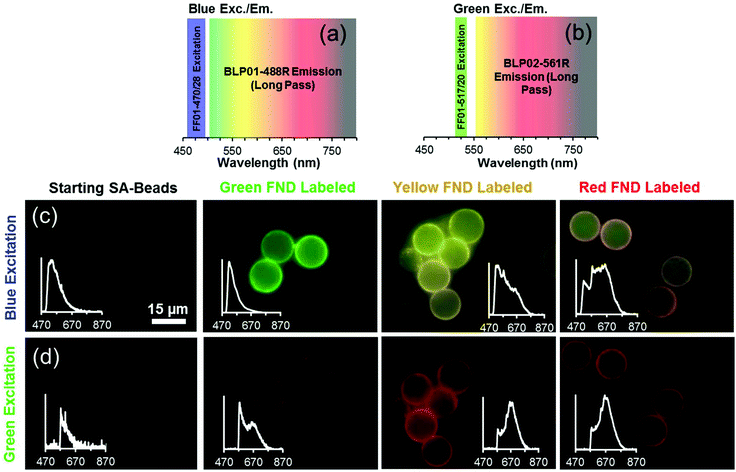
Fig. 6 illustrates that three distinct colors – green, yellow, and orange – can be observed from each of the three diamond types (green, yellow, and red, respectively) under broadband blue excitation. The orange appearance of the red diamonds is due to preferential emission of NV0 centers at this excitation wavelength. It should be noted that blue illumination preferentially excites the green diamonds, and this causes the emission intensities of the red and yellow diamonds to appear lower in comparison to green FNDs at the same exposure time; however, it is still possible to distinguish the three colors by eye.Fig. 7 depicts the FND labeled SA-Beads under broadband blue excitation (Fig. 7c) and broadband green excitation (Fig. 7d) using the filters shown in Fig. 7a and b, respectively. Under blue excitation, clear delineation between green labeled and red or yellow labeled beads is observed. Discerning red FND and yellow FND labeled beads under blue excitation is more challenging, with the red labeled beads exhibiting a slight orange as opposed to a stronger yellow fluorescence. Under green excitation, the contribution from green FND labeled beads is strongly diminished; however, it is slightly brighter than the autofluorescence of the starting beads, indicating a small amount of NV related contribution from the green FNDs, which is validated spectrally. Red FND and yellow FND labeled beads are of similar brightness under green excitation. The slight ‘halo’ effect observed surrounding the beads is indicative of surface labeling of the beads. This does mean that the predominantly green autofluorescence from the bulk of the beads can contribute to the observed coloration to some extent.
A consequence of the intrinsic bead autofluorescence and the relatively weak H3 related fluorescence in the yellow particles is that they inhibit the ability to clearly separate yellow from red labeled beads under blue excitation when the separately labeled beads are mixed and observed in the same field of view. An attempt was made to use band pass filters for differentiation; however, this was not successful due to the autofluorescence of the beads. Nevertheless, it was clear which beads were labeled with green FND particles, given their significantly higher emission intensity under blue excitation. The band pass filter spectral results are summarized in Fig. S8 (ESI†).
Spectral validation to confirm the presence of diamond on the beads was performed and is inset within the micrographs (Fig. 7c and d). The spectral profiles clearly demonstrate the presence of diamond, with typical profiles and spectral characteristics for NV centers such as the zero phonon lines (ZPLs) at 575 nm and 638 nm. Although intensity values are not shown on the inset plots, the green FND labeled beads exhibited an order of magnitude higher fluorescent intensity as compared to the starting beads exhibiting autofluorescence.
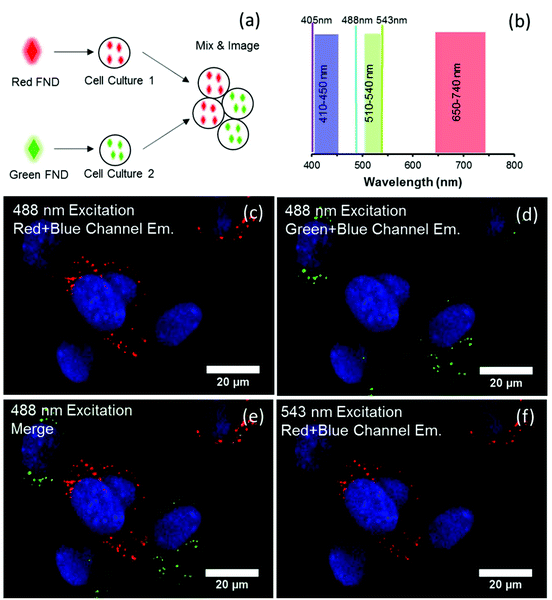
In contrast to the cell labeling with either green or red FND (Fig. 8), labeling with the yellow FNDs which contain both NV and H3 centers has distinct behavior. The same particles demonstrate green emission under 488 nm excitation and red emission under 561 nm excitation (Fig. 9); thus, dual-color emission as opposed to the singular color emission of either red or green FNDS which contain either a dominance of NV or H3 centers, respectively. This dual-color emission allows for differentiation of the yellow FNDs from the background fluorescence. In the “yellow” channel (567–590 nm), the particles demonstrate yellow emission.
 | ||
| Fig. 9 Yellow diamond particles demonstrating emission in three channels with two different excitation wavelengths. | ||
Nanodiamond particles with combined red and green emission may find application in correlative light-electron microscopy (CLEM) since they are bright and electron-dense in nature. Therefore, they could be detectable with light in two emission channels and by and electron microscopes. FNDs have been reported for use in both STED and STORM super-resolution microscopy.6,37,38 They could be useful as a fiducial marker for two-color STED-CLEM. In a recent report, super-resolution STED-CLEM has been demonstrated with red FNDs in a combination of green fluorophore.38 However, yellow FNDs could potentially facilitate CLEM experimental setups with combination of green and red fluorophores since dual color emitting fiducials can be well distinguished, and having a CLEM fiducial marker with an emission distinct from that of a labeling fluorophore is critical for selective identification of labeled features.
4. Conclusions
Herein we reported, to the best of our knowledge, demonstrations of multicolor FNDs in practical imaging modalities (wide field and confocal fluorescence microscopy). Blue and yellow fluorescent diamond particles at smaller size ranges, as well as a practical demonstration of green FNDs synthesized via rapid thermal annealing were shown. Successful dual-color imaging of a mixture of cells labeled with either green or red FNDs was achieved in confocal cellular imaging. Cells labeled with green FNDs were visible only in the green channel, while cells labeled with red FNDs could be observed only in the red channel. The yellow fluorescent particles exhibiting spectral combination of both red (NV) and green (H3) fluorescence could be detected simultaneously in green and red channels under appropriate excitation.While the focus of this work was on the use of these particles in fluorescence labeling and imaging, particles exhibiting combinations of color centers may have significant implications in super-resolution microscopy and in magnetic/microwave modulated fluorescence imaging. With regard to modulated fluorescence imaging, it was previously demonstrated that the NV− center can be driven to a dark state in appropriate conditions for signal enhancement against an auto fluorescent background.39 Yellow FNDs containing appreciable amounts of both NV and H3 centers may exhibit the possibility of a ‘chromatic-shifting’ fluorescent label, whereby the observed emission of the particles can be modulated by suppression or enhancement of the NV− center emission. Beyond biological applications, such a fluorescent material may find use in tracing, authentication, and anticounterfeiting.
Conflicts of interest
O.S. is the president and CTO of Adámas Nanotechnologies. N. N. and M. D. T. are both employees of Adámas Nanotechnologies.Acknowledgements
This work has been funded in whole or in part by the National Cancer Institute (NCI) of the National Institutes of Health (NIH) under Award Number R43CA232901, the National Heart, Lung, and Blood Institute (NHLBI), Department of Health and Human Services, under Contract No. HHSN268201500010C, and with Federal funds from the National Cancer Institute, National Institutes of Health, under Contract No. HHSN261200800001E. NP and JR acknowledge funding from the Academy of Finland (Grant No. 309374) and the Sigrid Jusélius Foundation. EK acknowledges support from the NIH Post-Baccalaureate Intramural Research Training Award Program at the National Cancer Institute. The content of this publication does not necessarily reflect the views or policies of the Department of Health and Human Services, nor does mention of trade names, commercial products, or organizations imply endorsement by the U.S. Government. PR acknowledges funding through the RMIT University Vice Chancellor's Research Fellowship.References
- B. P. Joshi and T. D. Wang, Contrast Media Mol. Imaging, 2018, 2018, 1–19 CrossRef PubMed.
- J. Livet, T. A. Weissman, H. Kang, R. W. Draft, J. Lu, R. A. Bennis, J. R. Sanes and J. W. Lichtman, Nature, 2007, 450, 56 CrossRef CAS PubMed.
- E. Lubeck and L. Cai, Nat. Methods, 2012, 9, 743 CrossRef CAS PubMed.
- F. Collman, J. Buchanan, K. D. Phend, K. D. Micheva, R. J. Weinberg and S. J. Smith, J. Neurosci., 2015, 35, 5792–5807 CrossRef CAS PubMed.
- X. Wan, R. P. O'Quinn, H. L. Pierce, A. P. Joglekar, W. E. Gall, J. G. DeLuca, C. W. Carroll, S.-T. Liu, T. J. Yen, B. F. McEwen, P. T. Stukenberg, A. Desai and E. D. Salmon, Cell, 2009, 137, 672–684 CrossRef CAS PubMed.
- J. Yi, A. Manna, V. A. Barr, J. Hong, K. C. Neuman and L. E. Samelson, Mol. Biol. Cell, 2016, 27, 3591–3600 CrossRef CAS PubMed.
- A. Orth, R. N. Ghosh, E. R. Wilson, T. Doughney, H. Brown, P. Reineck, J. G. Thompson and B. C. Gibson, Biomed. Opt. Express, 2018, 9, 2943–2954 CrossRef CAS PubMed.
- A. M. Valm, R. Oldenbourg and G. G. Borisy, PLoS One, 2016, 11, e0158495 CrossRef PubMed.
- H. C. Chang, W. W. Hsiao and M. C. Su, Fluorescent Nanodiamonds, Johhn Wiley & Sons Ltd., 2019 Search PubMed.
- W. W.-W. Hsiao, Y. Y. Hui, P.-C. Tsai and H.-C. Chang, Acc. Chem. Res., 2016, 49, 400–407 CrossRef CAS PubMed.
- M. Chipaux, K. J. van der Laan, S. R. Hemelaar, M. Hasani, T. Zheng and R. Schirhagl, Small, 2018, 14, 1704263 CrossRef PubMed.
- O. A. Shenderova, A. I. Shames, N. A. Nunn, M. D. Torelli, I. Vlasov and A. Zaitsev, J. Vac. Sci. Technol., B: Nanotechnol. Microelectron.: Mater., Process., Meas., Phenom., 2019, 37, 030802 Search PubMed.
- A. M. Zaitsev, in Optical Properties of Diamond: A Data Handbook, Springer Berlin Heidelberg, Berlin, Heidelberg, 2001, pp. 125–376, DOI:10.1007/978-3-662-04548-0_5.
- G. Davies, S. C. Lawson, A. T. Collins, A. Mainwood and S. J. Sharp, Phys. Rev. B: Condens. Matter Mater. Phys., 1992, 46, 13157–13170 CrossRef CAS.
- Y. Nawa, W. Inami, S. Lin, Y. Kawata, S. Terakawa, C.-Y. Fang and H.-C. Chang, ChemPhysChem, 2014, 15, 721–726 CrossRef CAS PubMed.
- K. Bray, L. Cheung, K. R. Hossain, I. Aharonovich, S. M. Valenzuela and O. Shimoni, J. Mater. Chem. B, 2018, 6, 3078–3084 RSC.
- L. Dei Cas, S. Zeldin, N. Nunn, M. Torelli, A. I. Shames, A. M. Zaitsev and O. Shenderova, Adv. Funct. Mater., 2019, 1808362 CrossRef.
- G. Dantelle, A. Slablab, L. Rondin, F. Lainé, F. Carrel, P. Bergonzo, S. Perruchas, T. Gacoin, F. Treussart and J. F. Roch, J. Lumin., 2010, 130, 1655–1658 CrossRef CAS.
- X. Song, G. Wang, X. Liu, F. Feng, J. Wang, L. Lou and W. Zhu, Appl. Phys. Lett., 2013, 102, 133109 CrossRef.
- S. Osswald, G. Yushin, V. Mochalin, S. O. Kucheyev and Y. Gogotsi, J. Am. Chem. Soc., 2006, 128, 11635–11642 CrossRef CAS PubMed.
- A.-Y. Jee and M. Lee, Curr. Appl. Phys., 2009, 9, e144–e147 CrossRef.
- T.-L. Wee, Y.-W. Mau, C.-Y. Fang, H.-L. Hsu, C.-C. Han and H.-C. Chang, Diamond Relat. Mater., 2009, 18, 567–573 CrossRef CAS.
- P. Reineck, L. F. Trindade, J. Havlik, J. Stursa, A. Heffernan, A. Elbourne, A. Orth, M. Capelli, P. Cigler, D. A. Simpson and B. C. Gibson, Part. Part. Syst. Charact., 2019, 1900009 CrossRef.
- M. Ovesny, P. Krizek, J. Borkovec, Z. Svindrych and G. M. Hagen, Bioinformatics, 2014, 30, 2389–2390 CrossRef CAS PubMed.
- P. Reineck, A. Francis, A. Orth, D. W. M. Lau, R. D. V. Nixon-Luke, I. D. Rastogi, W. A. W. Razali, N. M. Cordina, L. M. Parker, V. K. A. Sreenivasan, L. J. Brown and B. C. Gibson, Adv. Opt. Mater., 2016, 4, 1549–1557 CrossRef CAS.
- N. Mohan, Y.-K. Tzeng, L. Yang, Y.-Y. Chen, Y. Y. Hui, C.-Y. Fang and H.-C. Chang, Adv. Mater., 2010, 22, 843–847 CrossRef CAS PubMed.
- ISS Inc., Lifetime data of selected fluorophores, http://www.iss.com/resources/reference/data_tables/LifetimeDataFluorophores.html, 2019.
- S. C. Rand and L. G. DeShazer, Opt. Lett., 1985, 10, 481–483 CrossRef CAS PubMed.
- G. Liaugaudas, A. T. Collins, K. Suhling, G. Davies and R. Heintzmann, J. Phys.: Condens. Matter, 2009, 21, 364210 CrossRef PubMed.
- G. Liaugaudas, G. Davies, K. Suhling, R. U. A. Khan and D. J. F. Evans, J. Phys.: Condens. Matter, 2012, 24, 435503 CrossRef CAS PubMed.
- J. Storteboom, P. Dolan, S. Castelletto, X. Li and M. Gu, Opt. Express, 2015, 23, 11327–11333 CrossRef CAS PubMed.
- J. Tisler, G. Balasubramanian, B. Naydenov, R. Kolesov, B. Grotz, R. Reuter, J.-P. Boudou, P. A. Curmi, M. Sennour, A. Thorel, M. Börsch, K. Aulenbacher, R. Erdmann, P. R. Hemmer, F. Jelezko and J. Wrachtrup, ACS Nano, 2009, 3, 1959–1965 CrossRef CAS PubMed.
- R. Beams, D. Smith, T. W. Johnson, S.-H. Oh, L. Novotny and A. N. Vamivakas, Nano Lett., 2013, 13, 3807–3811 CrossRef CAS PubMed.
- J. Stursa, J. Havlik, V. Petrakova, M. Gulka, J. Ralis, V. Zach, Z. Pulec, V. Stepan, S. A. Zargaleh, M. Ledvina, M. Nesladek, F. Treussart and P. Cigler, Carbon, 2016, 96, 812–818 CrossRef CAS.
- G. Davies and M. Crossfield, J. Phys. C: Solid State Phys., 1973, 6, L104–L108 CrossRef CAS.
- M. D. Crossfield, G. Davies, A. T. Collins and E. C. Lightowlers, J. Phys. C: Solid State Phys., 1974, 7, 1909–1917 CrossRef CAS.
- S. Arroyo-Camejo, M.-P. Adam, M. Besbes, J.-P. Hugonin, V. Jacques, J.-J. Greffet, J.-F. Roch, S. W. Hell and F. Treussart, ACS Nano, 2013, 7, 10912–10919 CrossRef CAS PubMed.
- N. Prabhakar, M. Peurla, S. Koho, T. Deguchi, T. Näreoja, H.-C. Chang, J. M. Rosenholm and P. E. Hänninen, Small, 2018, 14, 1701807 CrossRef PubMed.
- S. K. Sarkar, A. Bumb, X. Wu, K. A. Sochacki, P. Kellman, M. W. Brechbiel and K. C. Neuman, Biomed. Opt. Express, 2014, 5, 1190–1202 CrossRef PubMed.
Footnote |
| † Electronic supplementary information (ESI) available. See DOI: 10.1039/c9nr02593f |
| This journal is © The Royal Society of Chemistry 2019 |

