Paper-based SERS analysis with smartphones as Raman spectral analyzers
Fanyu
Zeng†
ab,
Taotao
Mou†
cd,
Chengchen
Zhang
e,
Xiaoqing
Huang
d,
Bing
Wang
d,
Xing
Ma
 *ab and
Jinhong
Guo
 *f
*f
aState Key Laboratory of Advanced Welding and Joining, Harbin Institute of Technology (Shenzhen), Shenzhen 518055, China. E-mail: maxing@hit.edu.cn
bResearch Center for Flexible Printed Electronics, Harbin Institute of Technology (Shenzhen), Shenzhen 518055, China
cBeijing Engineering Research Center of Optoelectronic Information and Instruments, Beijing Key Laboratory for Optoelectronics Measurement Technology, Beijing Information Science and Technology University, Beijing, 100016, China
dCloudMinds Inc., Wangjing SOHO Tower, Chaoyang District, Beijing 100022, China
eSchool of Life Science and Technology, University of Electronic Science and Technology of China, Chengdu 611731, China
fSchool of Information and Communication Engineering, University of Electronic Science and Technology of China, Chengdu, 611731, China. E-mail: guojinhong@uestc.edu.cn
First published on 16th November 2018
Abstract
SERS (Surface Enhanced Raman Spectroscopy) can realize fingerprint recognition of molecular samples with high detection accuracy and sensitivity. However, rapid and convenient measurement of the Raman spectra of analytes for a point-of-care test (POCT) has put forward a high demand for portable Raman spectrometers, as well as reliable SERS substrates. Hereby, we first utilize a smartphone as a miniaturized Raman spectral analyzer, which has the revolutionary advantages of a friendly human–machine interface, fast measurement time, and good sensitivity. Meanwhile, a paper-based SERS chip was prepared based on commonly used filter paper and silver nanoparticles (AgNP), which was successfully used to detect low concentrations of typical SERS analyte model molecules including rhodamine 6G and crystal violet. The current method of smartphone-based SERS spectroscopy as a POCT device will greatly promote the application of Raman technology in a variety of scenarios, such as safety inspections, pesticide residue detection, water pollution monitoring, and so on. Coupled with paper-based SERS chips with advantages of facile preparation, low cost and good reliability, the current work proves to have a great potential for industrial production and for meeting the vast marketing demand of Raman based POCT technology.
Introduction
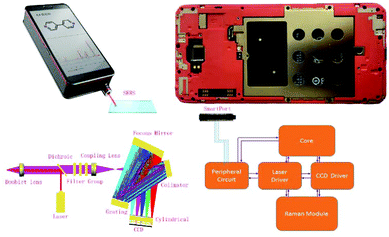
Raman spectroscopy, which can identify molecules by the fingerprint information of a molecular vibration spectrum, is a highly sensitive, non-contact trace detection tool that has a wide range of applications in analytical chemistry,1 biochemical sensing,2 material science,3 environmental monitoring4,5 and so forth. Thus, it has been regarded as an ideal analytical technique for the field of point-of-care tests (POCTs).6–11 However, although large Raman spectrometer instruments, such as confocal Raman spectrometers, have the apparent advantages of good accuracy, high sensitivity, excellent resolution and multiple excitation wavelengths, due to their large sizes and high requirements for operation, they can only be used in scientific research institutes or analytical laboratories by professional technicians, which greatly limits the expansion of Raman technology towards POCTs. The need for on-site and real-time Raman spectroscopy has led to the production of portable Raman devices. Companies such as Thermo Fischer, BW TEK, GE, Ahura, Smiths Detection, DeltaNu, and Inphotonics have developed their own portable Raman spectrometers.12–17 However, most current portable Raman spectrometers are still quite large in size and heavy in weight with multiple accessories, and professionals are still required for their operation. Furthermore, due to the miniaturization of all of the optical components, these portable Raman instruments usually suffer from a reduced sensitivity, and thus for the effective detection of analytes using portable Raman devices, Raman signal enhancement is rather necessary. The above-mentioned drawbacks apparently limit the wide use of Raman technology in the field of POCTs.Hereby, we present a smartphone based portable Raman spectrometer equipped with a laser of 785 nm wavelength and operated on a touch-screen via a well-developed application (APP) as the human–machine interface. The Raman detection module can be attached or removed from the smartphone through the smartport interface, which means that the function of the Raman measurement does not even affect the normal use of the smartphone. The presented device has the same size as the smartphone with a weight of about 420 g, so is the smallest Raman device compared to all other counterparts. The specification of this Raman analyzer is given here. The volume of the Raman cellphone is 159 mm × 78.9 mm × 27 mm. The working distance is usually 8 mm from the lens. The laser power is 5700 mA h. The size of the focal spot on the SERS base is just about 100 μm. The spectral resolution is 8–11 cm−1 and the spectral range is from 200 cm−1 to 1800 cm−1. In order to achieve a Raman signal with notable intensity, we prepared surface enhanced Raman scattering (SERS) chips by using low-cost filter paper and silver nanoparticles (AgNPs). The technology of SERS is based on the nano-structures of precious metals, such as gold, silver and copper.18–25 The price of gold is relatively high, and problems of oxidation and the stability of copper have not been solved yet. Although silver nanoparticles have problems of oxidation, which may affect their SERS efficiency in biosensing,26 they have still been widely used as effective SERS substrates. With the advantages of a good SERS effect and relatively low price, silver has also been regarded as an ideal SERS substrate material. Although silver sol is often used for SERS in scientific research, due to inconveniences of the preservation of silver sol and the removal of surfactants, real-time detection with solid substrates is preferred for POCT applications. Paper is a low-cost and renewable resource and is suitable for mass production in future industrial applications.27–33 We chose filter paper as the supporting material to fabricate a paper-based SERS chip by combining it with silver nanoparticles (AgNPs). Using the smartphone-based Raman spectrometer together with paper-based SERS chips, typical dye molecules of low concentrations were detected, such as Crystal Violet (CV) and Rhodamine 6G (RDM 6G), which demonstrates their great potential as a new type of POCT technology.
Experiment and results
Optical path and working principle of mobile Raman devices
As shown in Fig. 1, the 785 nm parallel laser emitted by the laser device is irradiated through a dichroic filter, so that the incident laser can be reflected to the doublet lens located at a 45 degree angle and then focused on the measured target. The Raman signal scattered from the sample is returned to the original optical path and changed into a collimated beam after passing through the doublet lens. Then, about 95% elastic scattering light (785 nm) is filtered through a dichroic mirror. The Raman signal in the optical signal after the dichroic mirror is unobstructed through the filter group (Semrock) (more than 790 nm transmittance), while the laser signal OD10 (residual laser 10−10) is filtered. The Raman signal light is focused by the coupling lens to the spectrometer slit for the next step of the spectrometric measurement. The spectrometer consists of a slit, a collimator, a grating, a focus mirror, a cylindrical lens, and a detector. The Raman probe focuses the signal light into the slit to achieve spatial filtering. There is a collimating mirror incident to the interior of a spectrometer at a divergence angle to the signal light from the slit. The beam collimated by a collimator is diffracted by a grating, and different wavelengths of light have different diffraction angles. The diffracted light of all wavelengths is reflected and focused by the focus mirror, reaching the CCD detector to realize light splitting detection. The incident laser was activated by the Raman APP on the smartphone, and then the Raman signal was collected by the CCD. When the laser is switched off, the CCD gathers the background signal and converts the analog signal into a digital signal via an ADC chip, and further transmits the signal to the smartphone via a peripheral circuit. After deducting the background noise and the spectral baseline by a pretreatment algorithm, the spectral results are obtained and presented on the smartphone.Fabrication and characterization of paper-based SERS chips
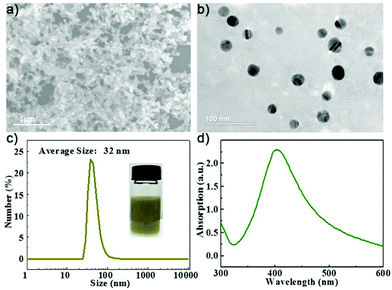
The AgNPs were first prepared by a strategy according to a previous reported method with minor modification.34 Typically, 10 mL polyvinylpyrrolidone (PVP, Mw ∼ 8000) solution and 10 mL AgNO3 solution were added to a beaker in an ice bath to stir for 10 minutes, and then 10 mL NaBH4 (20 mM) was injected into the mixture by a syringe pump. After one hour of stirring, the formed AgNPs were collected by centrifugation and washed with deionized (DI) water. The micromorphology of the AgNPs was observed by transmission electron microscopy (TEM, Tecnai G2 Spirit) at 120 kV and scanning electron microscopy (SEM, FESEM S4700) at 15 kV, respectively. The particle size of the AgNPs was measured by dynamic light scattering (DLS, Malvern Zetasizer Nano ZS90).The SEM and TEM images of the prepared AgNPs are shown in Fig. 2(a and b), respectively. The synthesized AgNPs exhibit spherical morphologies with particle sizes less than 50 nm. The AgNP solution has a brown yellow color due to the optical adsorption effect. The DLS size distribution is shown in Fig. 2(c). The hydrodynamic size of the AgNPs was found to be 32 nm with a polydispersity index (PDI) value of 0.405 according to DLS analysis. We recorded a UV-vis adsorption spectrum of the AgNPs suspended in aqueous solution and found a strong adsorption peak at 400 nm attributed to the plasmonic resonance of the AgNPs.35 Then, the AgNP solution was used for the preparation of paper-based SERS chips.
 | ||
| Fig. 2 (a) SEM image, (b) TEM images, (c) distribution of size and a physical picture, (d) UV-vis spectrum of the Ag NPs. | ||
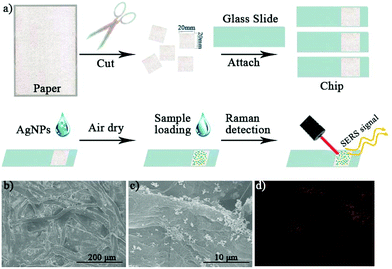
As shown in Fig. 3(a), ordinary filter paper was used for the preparation of the paper-based SERS chips. The filter paper was cut into squares (2 cm × 2 cm) with scissors, which were cleaned with ethanol by sonication and dried in an oven at 70 °C for 2 h. The as-prepared paper squares were attached to a glass slide (2.5 cm × 7.5 cm) for the sake of convenient handling. Then, 50 μL ethanol solution containing AgNPs (1 mg mL−1) was evenly coated onto the paper and dried to make paper-based SERS chips. The paper chips without addition of AgNPs were used as a control for the Raman measurements. The prepared paper-based SERS chips were characterized by SEM as well. We clearly observed the microstructure of the overlapped cellulose fibers (Fig. 3(b)), which provides lots of micro-sized cavities and gaps for the quick adsorption of solution samples by capillary force in future use. In Fig. 3(c), the added AgNPs were coated on the surface of the cellulose fibers. Instead of being evenly distributed on the cellulose surface, due to the quick evaporation of the ethanol solvent, the AgNPs formed many aggregates. The formation of clusters would significantly increase the number of SERS “hotspots”, which is highly favorable for SERS measurements. Using energy dispersive X-ray spectroscopy (EDX) analysis, we confirmed the uneven distribution of the silver element on the chip surface as shown in Fig. 3(d).
SERS measurements by smartphone Raman spectroscopy
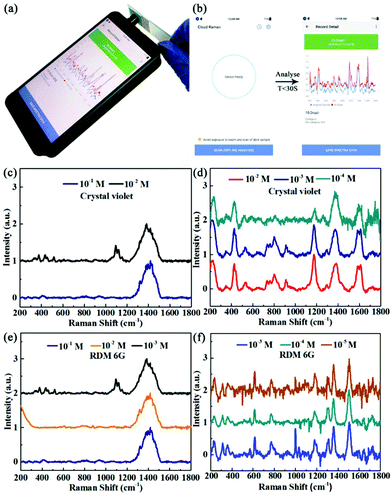
We chose two frequently used SERS analyte model molecules, rhodamine 6G (RDM 6G) and crystal violet, for the SERS measurements. The model molecule solution (20 μL) was dropped onto the detection area of a paper-based SERS chip and air dried quickly before measurement. By simply holding the glass slide containing the SERS chip, the 785 nm laser was directly pointed onto the detection area of the chip for the measurement, as shown in Fig. 4(a). The collected spectra range is between 200 and 1800 cm−1 with a resolution of 8–11 cm−1, and the integral number of spectra is 10 times, all of which parameters can be set through the APP on the smartphone and saved for future use. After we set all of the parameters, we were able to start the measurement by clicking “SCAN” and the signal collection and analysis time took less than 30 s for each measurement. By calculation, the average measurement time is 15 s for one sample. The easy operation and quick signal collection time enable the smartphone-based Raman device to be used for future Raman spectroscopy based POCT applications.Although this smartphone-based Raman spectrometer can easily detect Raman signals and recognize many pure substances, it has difficulty directly detecting substances of low or ultra-low concentrations due to the low Raman scattering intensity as well as the reduced sensitivity caused by the miniaturization of the whole device. Therefore, it is necessary to combine a portable Raman device with SERS chips to enhance the Raman signal of analytes with low concentrations.
Hereby, we used low concentrations of RDM 6G and crystal violet as model molecules to test the performance of the paper-based SERS chips. First, we carried out measurements on these two model molecules using control chips without AgNPs. The Raman spectra of the crystal violet with a concentration of 10−1 M and 10−2 M are shown in Fig. 4(c). Neither of the two Raman spectra showed a characteristic peak for crystal violet and there was a broad background peak around 1400 cm−1 corresponding to the filter paper only. However, as shown in Fig. 4(d), the smartphone-based Raman spectrometer managed to collect characteristic peaks for crystal violet at concentrations of 10−2 M, 10−3 M and 10−4 M using the paper-based SERS chips with AgNPs. As shown in Table 1, the SERS spectra of crystal violet clearly show peaks at 528 cm−1 and 912 cm−1 corresponding to skeleton vibrations of the benzene ring, peaks at 864 cm−1 and 1174 cm−1 corresponding to the bending vibrations of the C–H bonds, a peak at 1374 cm−1 corresponding to the N-phenyl bond vibration, and peaks at 1614 cm−1 and 1586 cm−1 corresponding to the benzene ring C–C bond stretching reducing vibrations. Although the Raman spectrum of the crystal violet with a concentration of 10−4 M has a relatively poor signal–noise ratio, the Raman characteristic peaks of the crystal violet can be clearly identified as well. Therefore, the detection limit of the SERS spectrometer for crystal violet was extended ten thousand times with the help of the paper-based SERS chips. As shown in Fig. 4(e and f), the same method was used to measure the Raman spectra of RDM 6G at different concentrations. Similarly, we could not detect any feature peaks of RDM 6G without the addition of AgNPs. However, when we used the SERS chips with AgNPs, the SERS spectra of RDM 6G presented characteristic peaks at 613 cm−1 corresponding to the bending vibration of the C–C–C bond, a peak at 772 cm−1 corresponding to the out-of-plane deformation of C–H, and peaks at 1310 cm−1, 1360 cm−1, 1508 cm−1 and 1646 cm−1 corresponding to the C–C stretching vibration of the benzene ring. Furthermore, we managed to collect fingerprint peaks for RDM 6G at concentrations as low as 10−5 M. Although the current sensitivity is still lower than that of large instruments, such as confocal Raman spectrometers, which are usually equipped with high power laser sources and much more sensitive detectors, the detection limit is already capable of being used for on-site quick Raman measurements.
| SERS band (cm−1) | Assignment | |
|---|---|---|
| CV | 528, 912 | Skeleton vibrations of the benzene ring |
| 864, 1174 | Bending vibration of C–H bonds | |
| 1374 | N-Phenyl bond vibration | |
| 1586, 1614 | Benzene ring C–C bond stretching reducing vibrations | |
| RH 6G | 613 | Bending vibration of C–C–C bonds |
| 772 | Out-of-plane deformation of C–H | |
| 1310, 1360, 1508, 1646 | C–C stretching vibrations of the benzene ring | |
Conclusions
We present a smartphone-based portable Raman spectrometer, which has a friendly human–machine interface, easy operation, rapid response time, and most importantly a very small size for on-site use. We have achieved real-time, rapid and convenient detection for POCTs combined with low cost and facile preparation of paper-based SERS chips. Two typical dye molecules, including crystal violet and RDM 6G, were chosen for evaluating the smartphone-based SERS spectroscopy. We managed to detect very low concentrations of the analytes. The detection limit of the Raman spectrometer for crystal violet and RDM 6G can be extended ten thousand times and one hundred thousand times by using the paper-based SERS chips, respectively. Taking into further consideration the small size and easy operation of the smartphone-based Raman spectrometer, the current technique has great significance and potential for the wide application of SERS based POCT applications, such as monitoring environmental pollutants, detection of pesticide residues, biochemical sensing and so on. Our future work will be focused on the development of functional SERS chips that are capable of detecting realistic analytes with improved sensitivity and selectivity.Conflicts of interest
There are no conflicts to declare.Acknowledgements
The authors are thankful for the support from the National Natural Science Foundation of China (51802060) and the Shenzhen Peacock Innovation Project (KQJSCX20170726104623185).References
- S. Chen, G. Wang, X. Cui and Q. Liu, Stepwise method based on Wiener estimation for spectral reconstruction in spectroscopic Raman imaging, Opt. Express, 2017, 25(2), 1005–1018 CrossRef CAS PubMed.
- S. Chen, Y. H. Ong and Q. Liu, A Method to Create a Universal Calibration Dataset for Raman Reconstruction Based on Wiener Estimation, IEEE J. Sel. Top. Quantum Electron., 2016, 22(3), 164–170 Search PubMed.
- S. Chen, Y. Ong, X. Lin and Q. Liu, Optimization of advanced Wiener estimation methods for Raman reconstruction from narrow-band measurements in the presence of fluorescence background, Biomed. Opt. Express, 2015, 6(7), 2633–2648 CrossRef PubMed.
- R. A. Halvorson and P. J. Vikesland, Surface-Enhanced Raman Spectroscopy (SERS) for Environmental Analyses, Environ. Sci. Technol., 2010, 44(20), 7749–7755 CrossRef CAS PubMed.
- T. Vo-Dinh, SERS chemical sensors and biosensors: new tools for environmental and biological analysis, Sens. Actuators, B, 1995, 29(1), 183–189 CrossRef CAS.
- X. Zhao, J. Xue, Z. Mu, Y. Huang, M. Lu and Z. Gu, Gold nanoparticle incorporated inverse opal photonic crystal capillaries for optofluidic surface enhanced Raman spectroscopy, Biosens. Bioelectron., 2015, 72, 268–274 CrossRef CAS PubMed.
- S. Zong, Z. Wang, H. Chen, G. Hu, M. Liu, P. Chen and Y. Cui, Colorimetry and SERS dual-mode detection of telomerase activity: combining rapid screening with high sensitivity, Nanoscale, 2014, 6, 1808–1806 RSC.
- S.-W. Hu, S. Qiao, J.-B. Pan, B. Kang, J.-J. Xu and H.-Y. Chen, A paper-based SERS test strip for quantitative detection of Mucin-1 in whole blood, Talanta, 2018, 179, 9–14 CrossRef CAS PubMed.
- J. F. Sun, X. Liu, Z. R. Guo, J. Dong, Y. Huang, J. Zhang, H. Jin and N. Gu, Exploiting LBL-assembled Au nanoparticles to enhance Raman signals for point-of-care testing of osteoporosis with excreta sample, Appl. Phys. A, 2017, 123(2), 141–150 CrossRef.
- D. Zhang, L. Huang, B. Liu, H. Ni, L. Sun, E. Su, H. Chen, Z. Gu and X. Zhao, Quantitative and ultrasensitive detection of multiplex cardiac biomarkers in lateral flow assay with core-shell SERS nanotags, Biosens. Bioelectron., 2018, 106, 204–211 CrossRef CAS PubMed.
- G. J. Kost, N. K. Tran and R. F. Louie, Point-of-Care Testing: Principles, Practice, and Critical-Emergency-Disaster Medicine, in Encyclopedia of Analytical Chemistry, John Wiley & Sons, Ltd, 2008 Search PubMed.
- E. L. Izake, Forensic and homeland security applications of modern portable Raman spectroscopy, Forensic Sci. Int., 2010, 202(1), 1–8 CrossRef CAS PubMed.
- D. S. Moore and R. J. Scharff, Portable Raman explosives detection, Anal. Bioanal. Chem., 2009, 393(6), 1571–1578 CrossRef CAS PubMed.
- M. Pérez-Alonso, K. Castro and J. M. Madariaga, Investigation of degradation mechanisms by portable Raman spectroscopy and thermodynamic speciation: The wall painting of Santa María de Lemoniz (Basque Country, North of Spain), Anal. Chim. Acta, 2006, 571(1), 121–128 CrossRef PubMed.
- K. Carron and R. Cox, Qualitative Analysis and the Answer Box: A Perspective on Portable Raman Spectroscopy, Anal. Chem., 2010, 82(9), 3419–3425 CrossRef PubMed.
- M. Gnyba, J. Smulko, A. Kwiatkowski and P. Wierzba, Portable Raman spectrometer - design rules and applications, Bull. Pol. Acad. Sci.: Tech. Sci., 2011, 59(3), 325–329 Search PubMed.
- M. Hajjou, Y. Qin, S. Bradby, D. Bempong and P. Lukulay, Assessment of the performance of a handheld Raman device for potential use as a screening tool in evaluating medicines quality, J. Pharm. Biomed. Anal., 2013, 74, 47–55 CrossRef CAS PubMed.
- Q. Su, X. Ma, J. Dong, C. Jiang and W. Qian, A Reproducible SERS SubstrateBased on Electrostatically Assisted APTES-Functionalized Surface-Assembly of Gold Nanostars, ACS Appl. Mater. Interfaces, 2011, 3(6), 1873–1879 CrossRef CAS PubMed.
- S. Shanmukh, L. Jones, J. Driskell, Y. Zhao, R. Dluhy and R. A. Tripp, Rapid and Sensitive Detection of Respiratory Virus Molecular Signatures Using a Silver Nanorod Array SERS Substrate, Nano Lett., 2006, 6(11), 2630–2636 CrossRef CAS PubMed.
- M. L. Coluccio, G. Das, F. Mecarini, F. Gentile, A. Pujia, L. Bava, R. Tallerico, P. Candeloro, C. Liberale, F. De Angelis and E. Di Fabrizio, Silver-based surface enhanced Raman scattering (SERS) substrate fabrication using nanolithography and site selective electroless deposition, Microelectron. Eng., 2009, 86(4), 1085–1088 CrossRef CAS.
- T. Wang, X. Hu and S. Dong, A Renewable SERS Substrate Prepared by Cyclic Depositing and Stripping of Silver Shells on Gold Nanoparticle Microtubes, Small, 2008, 4(6), 781–786 CrossRef CAS PubMed.
- W. J. Cho, Y. Kim and J. K. Kim, Ultrahigh-Density Array of Silver Nanoclusters for SERS Substrate with High Sensitivity and Excellent Reproducibility, ACS Nano, 2012, 6(1), 249–255 CrossRef CAS PubMed.
- L.-Y. Chen, J.-S. Yu, T. Fujita and M.-W. Chen, Nanoporous Copper with Tunable Nanoporosity for SERS Applications, Adv. Funct. Mater., 2009, 19(8), 1221–1226 CrossRef CAS.
- Q. Shao, R. Que, M. Shao, L. Cheng and S.-T. Lee, Copper Nanoparticles Grafted on a Silicon Wafer and Their Excellent Surface-Enhanced Raman Scattering, Adv. Funct. Mater., 2012, 22(10), 2067–2070 CrossRef CAS.
- A. Kudelski, J. Bukowska, M. Janik-Czachor, W. Grochala, A. Szummer and M. Dolata, Characterization of the copper surface optimized for use as a substrate for surface-enhanced Raman scattering, Vib. Spectrosc., 1998, 16(1), 21–29 CrossRef CAS.
- K. Wansun, L. Jae-Chul, L. Gi-Ja, P. Hun-Kuk, L. Anbok and C. Samjin, Low-Cost Label-Free Biosensing Bimetallic Cellulose Strip with SILAR-Synthesized Silver Core–Gold Shell Nanoparticle Structures, Anal. Chem., 2017, 89(12), 6448–6454 CrossRef PubMed.
- E. P. Hoppmann, W. W. Yu and I. M. White, Highly sensitive and flexible inkjet printed SERS sensors on paper, Methods, 2013, 63(3), 219–224 CrossRef CAS PubMed.
- W. W. Yu and I. M. White, Inkjet-printed paper-based SERS dipsticks and swabs for trace chemical detection, Analyst, 2013, 138(4), 1020–1025 RSC.
- M.-L. Cheng, B.-C. Tsai and J. Yang, Silver nanoparticle-treated filter paper as a highly sensitive surface-enhanced Raman scattering (SERS) substrate for detection of tyrosine in aqueous solution, Anal. Chim. Acta, 2011, 708(1), 89–96 CrossRef CAS PubMed.
- Y. H. Ngo, D. Li, G. P. Simon and G. Garnier, Effect of cationic polyacrylamides on the aggregation and SERS performance of gold nanoparticles-treated paper, J. Colloid Interface Sci., 2013, 392, 237–246 CrossRef CAS PubMed.
- Y. Zhu, M. Li, D. Yu and L. Yang, A novel paper rag as ‘D-SERS’ substrate for detection of pesticide residues at various peels, Talanta, 2014, 128, 117–124 CrossRef CAS PubMed.
- L. Polavarapu, A. L. Porta, S. M. Novikov, M. Coronado-Puchau and L. M. Liz-Marzán, Pen-on-Paper Approach Toward the Design of Universal Surface Enhanced Raman Scattering Substrates, Small, 2014, 10(15), 3065–3071 CrossRef CAS PubMed.
- Y. H. Ngo, D. Li, G. P. Simon and G. Garnier, Gold Nanoparticle–Paper as a Three-Dimensional Surface Enhanced Raman Scattering Substrate, Langmuir, 2012, 28(23), 8782–8790 CrossRef CAS PubMed.
- H. Wang, X. Qiao, J. Chen, X. Wang and S. Ding, Mechanisms of PVP in the preparation of silver nanoparticles, Mater. Chem. Phys., 2005, 94(2), 449–453 CrossRef CAS.
- D. K. Bhui, H. Bar, P. Sarkar, G. P. Sahoo, S. P. De and A. Misra, Synthesis and UV–vis spectroscopic study of silver nanoparticles in aqueous SDS solution, J. Mol. Liq., 2009, 145(1), 33–37 CrossRef CAS.
Footnote |
| † The authors contributed equally to this work. |
| This journal is © The Royal Society of Chemistry 2019 |


