Enhancing the performance of the electron acceptor ITIC-Th via tailoring its end groups†
Zeyuan
Li‡
a,
Shuixing
Dai‡
a,
Jingming
Xin
b,
Lin
Zhang
b,
Yang
Wu
b,
Jeromy
Rech
 c,
Fuwen
Zhao
d,
Tengfei
Li
a,
Kuan
Liu
a,
Qiao
Liu
a,
Wei
Ma
b,
Wei
You
 c,
Chunru
Wang
 d and
Xiaowei
Zhan
 *a
*a
aDepartment of Materials Science and Engineering, College of Engineering, Key Laboratory of Polymer Chemistry and Physics of Ministry of Education, Peking University, Beijing 100871, China. E-mail: xwzhan@pku.edu.cn
bState Key Laboratory for Mechanical Behavior of Materials, Xi’an Jiaotong University, Xi’an 710049, China
cDepartment of Chemistry, University of North Carolina at Chapel Hill, Chapel Hill, North Carolina 27599-3290, USA
dInstitute of Chemistry, Chinese Academy of Sciences, Beijing, 100190, China
First published on 12th January 2018
Abstract
We choose the high-performance nonfullerene acceptor ITIC-Th as an example, and incorporate electron-donating methoxy and electron-withdrawing F groups onto the terminal group 1,1-dicyanomethylene-3-indanone (IC) to construct a small library of four fused-ring electron acceptors. With this series, we systematically investigate the effects of the substituents on the end-groups on the electronic properties, charge transport, film morphology, and photovoltaic properties of the ITIC-Th series. The electron-withdrawing ability increases from methoxylated to unsubstituted, fluorinated, and difluorinated IC, leading to a downshift of energy levels and a redshift of absorption spectra. Optimized organic solar cells based on the ITIC-Th series show power conversion efficiencies ranging from 8.88% to 12.1%.
Introduction
Organic solar cells (OSCs) are a promising technology for clean and renewable energy conversion. OSCs possess some advantages, such as low cost, semi-transparency, flexibility, and light weight.1–5 Fullerene derivatives (e.g., PC61BM and PC71BM) are the classical electron acceptors used in OSCs for a long period of time.6,7 Blends of electron donating polymers or small molecules and fullerene derivatives exhibit power conversion efficiencies (PCEs) over 11%. However, their shortcomings, such as weak absorption in the visible region and limited tunability in energy levels, restrict the further development of OSCs.Nonfullerene acceptors present several advantages, such as enhanced absorption in the visible and even near-infrared (NIR) regions, adjustable energy levels and good device stability.8 For example, perylene diimide and naphthalene diimide small molecules and polymers are one class of high-performance nonfullerene acceptors, and have exhibited PCEs as high as 9–10%.9–29
Since 2015, we have developed original fused-ring electron acceptors (FREAs) with an acceptor–donor–acceptor structure based on indacenodithiophene and indacenodithieno[3,2-b]-thiophene, end-capped with two electron-withdrawing terminal groups, 1,1-dicyanomethylene-3-indanone (IC).30–40 These FREAs exhibit broad and strong light absorption, and their LUMO and HOMO energy levels can be readily tuned. OSCs based on blends of FREAs and some high-performance donors have exhibited PCEs over 12%.41–47 For instance, we reported a high-performance nonfullerene acceptor, ITIC-Th,34 which showed a PCE of 9.6%, when blended with a wide-bandgap polymer, PDBT-T1. ITIC-Th was also used by other groups and afforded PCEs of 10–11%.42,48
IC is the most commonly used electron-withdrawing terminal group in FREAs, and chemical modification on IC was employed to adjust molecular energy levels. For instance, the benzene on IC could be replaced with thiophene49,50 and naphthalene;51 the benzene on IC could be decorated by fluorine,52,53 chlorine,54 methyl55 and methoxy groups.56 However, there have been rare systematic studies on the effects of substituents on IC.57,58
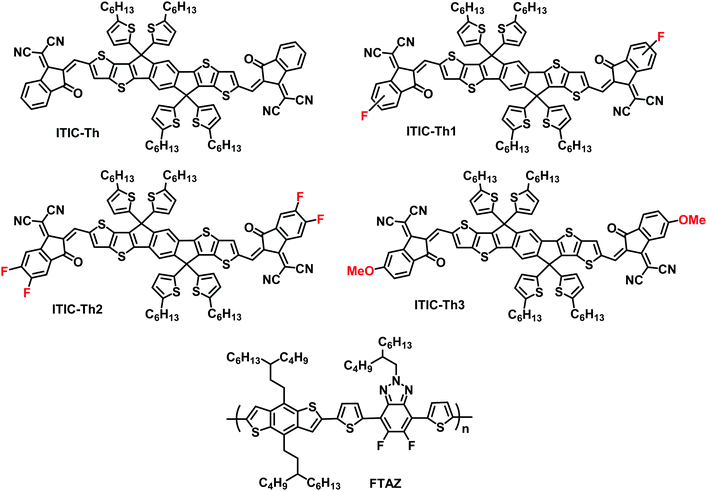
In this work, we choose the widely used ITIC-Th as an example, and incorporate electron-donating methoxy and electron-withdrawing F groups onto IC to construct a small library of four FREAs (ITIC-Th series, Fig. 1). With this series, we are able to systematically investigate the effects of the substituents on the end-groups on the electronic properties, charge transport, film morphology, and photovoltaic properties of the ITIC-Th series. The electron-withdrawing ability increases from methoxylated to unsubstituted, fluorinated, and difluorinated IC, leading to a downshift of energy levels and a redshift of absorption. Furthermore, optimized OSCs based on the ITIC-Th series show PCEs ranging from 8.88% to 12.1%.
Results and discussion
Synthesis and characterization
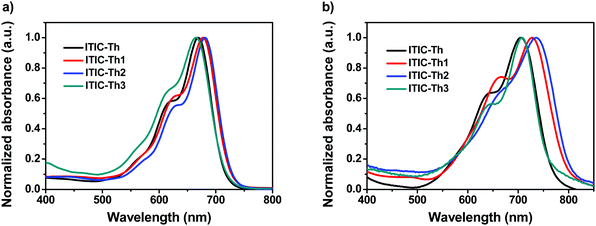
Two new FERAs, ITIC-Th2 and ITIC-Th3, were synthesized via the Knoevenagel condensation reaction (see Scheme S1 in the ESI†). ITIC-Th2 and ITIC-Th3 were fully characterized by spectroscopic methods and elemental analysis. Both ITIC-Th2 and ITIC-Th3 show good solubility in common organic solvents, such as chloroform and dichloromethane. The thermal stability of ITIC-Th2 and ITIC-Th3 was investigated using thermogravimetric analysis (TGA) and differential scanning calorimetry (DSC) (Fig. S1 in the ESI†). ITIC-Th2 and ITIC-Th3 show decomposition temperatures (Td, 5% weight loss) at 299 °C and 333 °C, respectively.The UV-vis absorption spectra of the ITIC-Th series in chloroform solution and as thin films were measured (Fig. 2); 4 molecules in solution show absorption peaks in the 664 to 680 nm range with molar extinction coefficients varying from 1.4 × 10⁵ to 3.6 × 10⁵ M−1 cm−1 (Table 1). All molecules in thin films show broader and redshifted absorption relative to their solutions. The optical bandgaps of the ITIC-Th series are calculated to be 1.63 to 1.54 eV from the absorption edge (Table 1). Relative to the parent ITIC-Th, fluorinated ITIC-Th1 and ITIC-Th2 have reduced bandgaps, while methoxylated ITIC-Th3 has a slightly larger bandgap.
| Compound | T d (°C) | λ s,max (nm) | λ f,max (nm) | ε max (M−1 cm−1) | E g (eV) | HOMOf (eV) | LUMOg (eV) | μ e (cm2 V−1 s−1) |
|---|---|---|---|---|---|---|---|---|
| a Decomposition temperature measured from TGA. b Absorption maximum in solution. c Absorption maximum in films. d Molar extinction coefficient at λmax in solution. e Optical bandgap calculated from the absorption edge of the thin film. f Estimated from the onset oxidation potential. g Estimated from the onset reduction potential. h Electron mobility measured by the SCLC method. i Taken from ref. 34. j Taken from ref. 53. | ||||||||
| ITIC-Th | 310i | 668 | 706 | 1.5 × 10⁵ | 1.60 | −5.66 | −3.93 | 2 × 10⁻⁴ |
| ITIC-Th1 | 271j | 677 | 728 | 1.8 × 10⁵ | 1.55 | −5.74 | −4.01 | 5 × 10⁻⁴ |
| ITIC-Th2 | 299 | 680 | 735 | 3.6 × 10⁵ | 1.54 | −5.75 | −4.07 | 2 × 10⁻⁴ |
| ITIC-Th3 | 333 | 664 | 698 | 1.4 × 10⁵ | 1.63 | −5.67 | −3.73 | 5 × 10⁻⁴ |
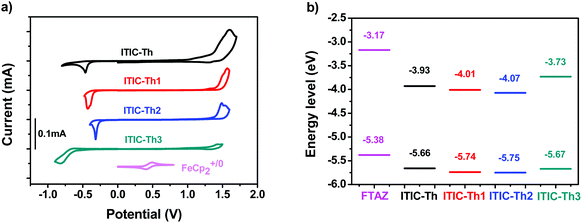
The electrochemical properties of the four FERAs were investigated by cyclic voltammetry (Fig. 3a). Assuming the absolute energy level of FeCp2+/0 to be 4.8 eV below vacuum, the HOMO and LUMO energy levels were calculated from the onset oxidation and reduction potentials, respectively. The HOMO energy levels of the 4 molecules range from −5.66 eV to −5.75 eV, while the LUMO energy levels range from −3.73 eV to −4.07 eV (Table 1). Relative to the parent ITIC-Th, methoxylated ITIC-Th3 exhibits a similar HOMO but a significantly upshifted LUMO, due to the electron-donating effect of the methoxy group. Relative to the parent ITIC-Th, fluorinated ITIC-Th1 and ITIC-Th2 exhibit a downshifted HOMO and a downshifted LUMO, due to the electron-withdrawing effect of the fluorine atom (Fig. 3b).
The electron mobilities of the 4 compounds were measured using the space charge-limited current (SCLC) method (Fig. S2, ESI†). The electron mobilities of ITIC-Th, ITIC-Th1, ITIC-Th2 and ITIC-Th3 are 2 × 10⁻⁴, 5 × 10⁻⁴, 2 × 10⁻⁴, and 5 × 10⁻⁴ cm2 V−1 s−1, respectively (Table 1). Monofluorinated ITIC-Th1 and methoxylated ITIC-Th3 exhibit higher mobilities than the parent ITIC-Th and difluorinated ITIC-Th2.
Photovoltaic properties
Our previously reported wide-bandgap polymer donor FTAZ (Fig. 1) exhibits strong absorption at 400–620 nm with a molar extinction coefficient of 9.8 × 10⁴ M−1 cm−1,59 which complements the absorption spectra of the ITIC-Th series. The energy levels of FTAZ match with those of the ITIC-Th series (Fig. 3b). Moreover, FTAZ exhibits a hole mobility as high as 1.2 × 10⁻³ cm2 V−1 s−1.60 Thus, we used FTAZ as the donor and the ITIC-Th series as the acceptors to fabricate bulk heterojunction (BHJ) OSCs with an inverted device structure of indium tin oxide (ITO)/ZnO/FTAZ:acceptor/MoOx/Ag. The optimized FTAZ/acceptor weight ratio is 1![[thin space (1/6-em)]](https://www.rsc.org/images/entities/char_2009.gif) :
:![[thin space (1/6-em)]](https://www.rsc.org/images/entities/char_2009.gif) 1.5, and the optimized content for the processing additive, 1,8-diiodooctane (DIO), is 0.25% (v/v) when using chloroform as processing solvent. The J–V curves of the best devices based on blends of the FTAZ:ITIC-Th series are shown in Fig. 4a.
1.5, and the optimized content for the processing additive, 1,8-diiodooctane (DIO), is 0.25% (v/v) when using chloroform as processing solvent. The J–V curves of the best devices based on blends of the FTAZ:ITIC-Th series are shown in Fig. 4a.
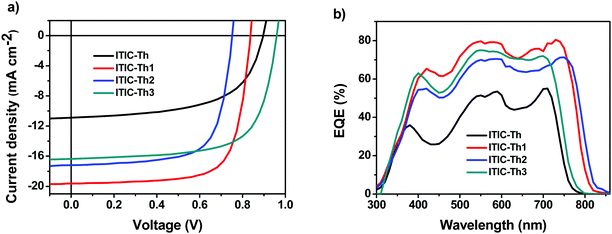 | ||
| Fig. 4 Current density versus voltage characteristics (a) and EQE curves of devices based on FTAZ:ITIC-Th series blends (b). | ||
Relative to the ITIC-Th-based devices (0.915 V), the ITIC-Th1 and ITIC-Th2-based OSCs exhibit lower open-circuit voltages (VOC) (0.849 V and 0.751 V, respectively), due to the lower LUMOs of ITIC-Th1 and ITIC-Th2 (Table 2); while the ITIC-Th3-based OSCs exhibit higher VOC (0.962 V), due to the elevated LUMO of ITIC-Th3. Compared to the ITIC-Th and ITIC-Th3-based devices, the ITIC-Th1 and ITIC-Th2-based devices show higher short-circuit current density (JSC) and higher fill factors (FF), which are partially caused by redshifted and stronger absorption and the stronger intermolecular interaction caused by the fluorine atoms. The best PCE of the OSCs based on the parent ITIC-Th is 8.88%, while the best PCEs of the OSCs based on monofluorinated ITIC-Th1 and difluorinated ITIC-Th2 are 12.1% and 9.06%, respectively, and the best PCE of the OSCs based on methoxylated ITIC-Th3 is 10.7%. Fluorination and methoxylation of the IC unit indeed enhance device performance; in particular, the monofluorinated ITIC-Th1 performs best.
| Device | V OC (V) | J SC (mA cm−2) | FF (%) | PCE (%) |
|---|---|---|---|---|
a FTAZ/acceptor = 1![[thin space (1/6-em)]](https://www.rsc.org/images/entities/char_2009.gif) : :![[thin space (1/6-em)]](https://www.rsc.org/images/entities/char_2009.gif) 1.5 (w/w), 0.25% DIO (v/v); average data in brackets are obtained from 20 devices. 1.5 (w/w), 0.25% DIO (v/v); average data in brackets are obtained from 20 devices.
|
||||
| FTAZ:ITIC-Th | 0.915 (0.914 ± 0.003) | 15.84 (15.67 ± 0.23) | 61.26 (61.14 ± 0.86) | 8.88 (8.67 ± 0.15) |
| FTAZ:ITIC-Th1 | 0.849 (0.847 ± 0.002) | 19.33 (19.22 ± 0.18) | 73.73 (72.56 ± 0.29) | 12.1 (11.9 ± 0.1) |
| FTAZ:ITIC-Th2 | 0.751 (0.748 ± 0.004) | 17.19 (16.97 ± 0.25) | 70.07 (69.34 ± 0.77) | 9.06 (8.93 ± 0.15) |
| FTAZ:ITIC-Th3 | 0.962 (0.960 ± 0.003) | 16.34 (16.26 ± 0.13) | 68.33 (68.12 ± 0.25) | 10.7 (10.6 ± 0.15) |
The external quantum efficiency (EQE) spectra of the OSCs based on blends of the FTAZ:ITIC-Th series are shown in Fig. 4b. The OSCs based on these four ITIC-Th series acceptors show a broad photoresponse extending from 300 to 850 nm. In the NIR region, the EQE spectra are broadened and enhanced from ITIC-Th and ITIC-Th3 to ITIC-Th1 and ITIC-Th2, resembling their absorption profiles in the NIR region (Fig. 2b).
We measured JSC as a function of incident light intensity (P) and the data were fitted to the power law: JSC ∝ Pα, to study charge recombination in the devices (Fig. 5a).61 The exponent α for ITIC-Th series-based cells is 0.98 to 0.99, indicating very weak bimolecular recombination under short circuit conditions in the active layers of all devices. We also measured the photocurrent density (Jph) versus the effective voltage (Veff) to investigate their charge generation, dissociation and extraction properties (Fig. 5b). It is assumed that all the photogenerated excitons are dissociated into free charge carriers and collected by electrodes at a high Veff (that is, Veff = 2 V), so the saturation photocurrent density (Jsat) is only limited by the total amount of absorbed incident photons.62 The Jsat values of the ITIC-Th, ITIC-Th1, ITIC-Th2 and ITIC-Th3-based solar cells are 16.37, 20.51, 17.93, and 16.52 mA cm−2, respectively. Fluorinated ITIC-Th1 and ITIC-Th2 show relatively higher Jsat, partially due to better light harvesting and exciton generation. The JSC/Jsat values for the ITIC-Th series are >95%, indicating excellent charge extraction in all devices.
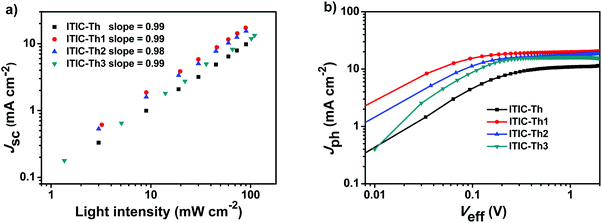 | ||
| Fig. 5 Dependence of JSC on light intensity (a); and photocurrent density versus effective voltage curves (b). | ||
The hole mobilities and electron mobilities of the blended films were measured using the SCLC method (Fig. S3 and Table S1, ESI†). The blended films based on FTAZ:modified ITIC-Th exhibit higher electron mobility and therefore more balanced charge transport relative to the one based on FTAZ:parent ITIC-Th, which is responsible for the higher FFs of their devices.
Film morphology
Atomic force microscopy (AFM) images of FTAZ:ITIC-Th series blends are shown in Fig. S4 (ESI†). The root-mean-square roughnesses of ITIC-Th, ITIC-Th1, ITIC-Th2 and ITIC-Th3-based blended films are 0.80, 0.76, 0.99 and 0.82 nm, respectively. All films have a smooth and uniform surface.Grazing incidence wide angle X-ray scattering (GIWAXS) measurements were employed to characterize the molecular packing and crystallinity of the neat and blended films (Fig. 6).63 Overall, the neat films of fluorinated ITIC-Th1 and ITIC-Th2 show decreased crystallinity, while methoxyl-modified ITIC-Th3 exhibits strong ordered packing with three sharp lamellar stacking peaks. After being blended with FTAZ, almost all the peaks of FTAZ:ITIC-Th1 are stronger/sharper, compared with FTAZ:ITIC-Th. The (010) peaks for FTAZ:ITIC-Th, FTAZ:ITIC-Th1 and FTAZ:ITIC-Th2 locate at ∼1.8 Å with coherence lengths of 3.7, 4.0 and 2.0 nm, respectively. Similar to the neat film, the FTAZ:ITIC-Th3 blend shows a sharp (010) peak at 1.78 Å−1 with a coherence length of 4.3 nm. The improved molecular packing is known to benefit the charge transport. Thus, FTAZ:modified ITIC-Th blends show higher mobility, which leads to higher FFs, relative to the FTAZ:parent ITIC-Th blend.
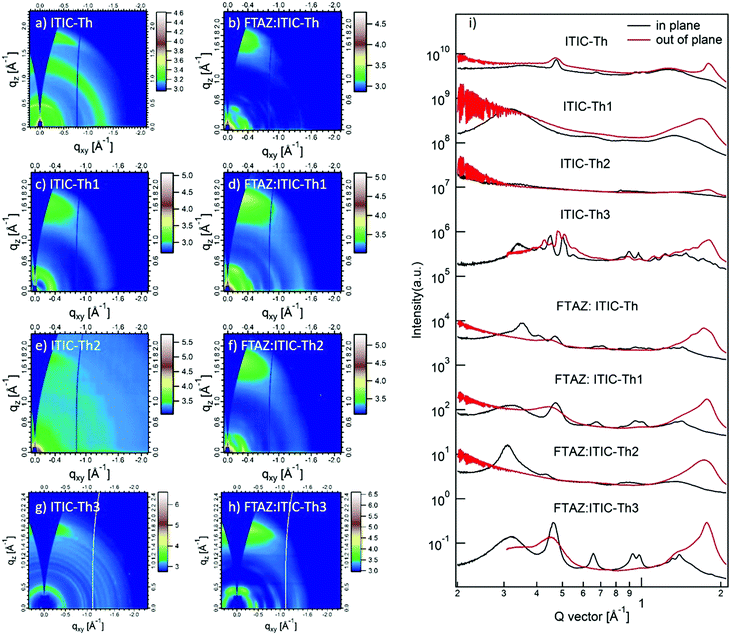 | ||
| Fig. 6 2D GIWAXS patterns and scattering profiles (in-plane and out-of-plane) for ITIC-Th series neat and blended films. | ||
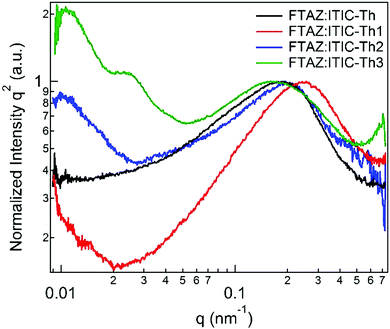
Resonant soft X-ray scattering (R-SoXS) was utilized to characterize the phase separation in the active layer of four blends.64 The photon energy of 286.8 eV is selected to enhance the material contrasts. The phase separation length scale ξ, so-called domain spacing, can be obtained from the equation ξ = 2π/q and the domain size is half of ξ. The scattering profiles are fitted by log normal distributions (Fig. 7). The mode domain sizes of ITIC-Th, ITIC-Th1, ITIC-Th2 and ITIC-Th3 based blend films are calculated to be 15, 13, 15 and 20 nm, respectively. As the exciton diffusion length is limited to 10–20 nm, smaller domain size is favorable for the charge separation. Therefore, FTAZ:ITIC-Th1 achieves the highest JSC.
Conclusions
We incorporate electron-donating methoxy and electron-withdrawing F groups onto the terminal group IC in the widely used nonfullerene acceptor ITIC-Th, and investigate the effects of the substituents on the end-groups on the electronic properties, charge transport, film morphology, and photovoltaic properties of the ITIC-Th series. Compared with the parent ITIC-Th, fluorinated ITIC-Th1 and ITIC-Th2 show lower HOMO and lower LUMO energy levels, red-shifted absorption, and smaller bandgaps, while ITIC-Th3 exhibits a similar HOMO but a higher LUMO level, slightly blue-shifted absorption and a slightly larger bandgap. Monofluorinated ITIC-Th1 and methoxylated ITIC-Th3 exhibit higher mobility than the parent ITIC-Th and difluorinated ITIC-Th2. FTAZ:modified ITIC-Th blended films exhibit stronger molecular packing and longer coherence length, leading to higher electron mobilities and balanced charge transport, which are responsible for the higher FFs of their devices relative to FTAZ:parent ITIC-Th. Moreover, FTAZ:ITIC-Th1 films present relatively smaller domain sizes to afford more D/A interfaces for exciton dissociation. OSCs based on FTAZ:ITIC-Th1 exhibit PCEs as high as 12.1%, higher than those based on FTAZ:ITIC-Th (8.88%), FTAZ:ITIC-Th2 (9.06%) and FTAZ:ITIC-Th3 (10.7%). Our results demonstrate that subtle tailoring on end-groups can significantly boost the performance of the nonfullerene acceptor.Conflicts of interest
There are no conflicts to declare.Acknowledgements
X. Z. wish to thank NSFC (No. 21734001 and 51761165023). W. Y. thanks NSF (DMR-1507249 and CBET-1639429). W. M. thanks the Ministry of Science and Technology of China (2016YFA0200700) and NSFC (21504066 and 21534003). X-ray data was acquired at beamlines 7.3.3 and 11.0.1.2 at the Advanced Light Source, which was supported by the Director, Office of Science, Office of Basic Energy Sciences, of the U. S. Department of Energy under Contract No. DE-AC02-05CH11231. The authors thank Chenhui Zhu at beamline 7.3.3, and Cheng Wang at beamline 11.0.1.2 for assistance with data acquisition.References
- G. Li, R. Zhu and Y. Yang, Nat. Photonics, 2012, 6, 153 CrossRef CAS.
- Y. Lin, Y. Li and X. Zhan, Chem. Soc. Rev., 2012, 41, 4245 RSC.
- F. C. Krebs, N. Espinosa, M. Hösel, R. R. Søndergaard and M. Jørgensen, Adv. Mater., 2014, 26, 29 CrossRef CAS PubMed.
- L. Lu, T. Zheng, Q. Wu, A. M. Schneider, D. Zhao and L. Yu, Chem. Rev., 2015, 115, 12666 CrossRef CAS PubMed.
- J. Wang, K. Liu, L. Ma and X. Zhan, Chem. Rev., 2016, 116, 14675 CrossRef CAS PubMed.
- J. E. Anthony, A. Facchetti, M. Heeney, S. R. Marder and X. Zhan, Adv. Mater., 2010, 22, 3876 CrossRef CAS PubMed.
- Y. He and Y. Li, Phys. Chem. Chem. Phys., 2011, 13, 1970 RSC.
- Y. Lin and X. Zhan, Mater. Horiz., 2014, 1, 470 RSC.
- X. Zhan, Z. a. Tan, B. Domercq, Z. An, X. Zhang, S. Barlow, Y. Li, D. Zhu, B. Kippelen and S. R. Marder, J. Am. Chem. Soc., 2007, 129, 7246 CrossRef CAS PubMed.
- X. Zhan, A. Facchetti, S. Barlow, T. J. Marks, M. A. Ratner, M. R. Wasielewski and S. R. Marder, Adv. Mater., 2011, 23, 268 CrossRef CAS PubMed.
- T. Earmme, Y.-J. Hwang, N. M. Murari, S. Subramaniyan and S. A. Jenekhe, J. Am. Chem. Soc., 2013, 135, 14960 CrossRef CAS PubMed.
- H. Li, F. S. Kim, G. Ren, E. C. Hollenbeck, S. Subramaniyan and S. A. Jenekhe, Angew. Chem., Int. Ed., 2013, 52, 5513 CrossRef CAS PubMed.
- X. Zhang, Z. Lu, L. Ye, C. Zhan, J. Hou, S. Zhang, B. Jiang, Y. Zhao, J. Huang, S. Zhang, Y. Liu, Q. Shi, Y. Liu and J. Yao, Adv. Mater., 2013, 25, 5791 CrossRef CAS PubMed.
- E. Zhou, J. Cong, K. Hashimoto and K. Tajima, Adv. Mater., 2013, 25, 6991 CrossRef CAS PubMed.
- P. Cheng, L. Ye, X. Zhao, J. Hou, Y. Li and X. Zhan, Energy Environ. Sci., 2014, 7, 1351 CAS.
- P. E. Hartnett, A. Timalsina, H. S. S. R. Matte, N. Zhou, X. Guo, W. Zhao, A. Facchetti, R. P. H. Chang, M. C. Hersam, M. R. Wasielewski and T. J. Marks, J. Am. Chem. Soc., 2014, 136, 16345 CrossRef CAS PubMed.
- Y. Lin, Y. Wang, J. Wang, J. Hou, Y. Li, D. Zhu and X. Zhan, Adv. Mater., 2014, 26, 5137 CrossRef CAS PubMed.
- R. Shivanna, S. Shoaee, S. Dimitrov, S. K. Kandappa, S. Rajaram, J. R. Durrant and K. S. Narayan, Energy Environ. Sci., 2014, 7, 435 CAS.
- H. Li, Y.-J. Hwang, B. A. E. Courtright, F. N. Eberle, S. Subramaniyan and S. A. Jenekhe, Adv. Mater., 2015, 27, 3266 CrossRef CAS PubMed.
- Y. Liu, C. Mu, K. Jiang, J. Zhao, Y. Li, L. Zhang, Z. Li, J. Y. L. Lai, H. Hu, T. Ma, R. Hu, D. Yu, X. Huang, B. Z. Tang and H. Yan, Adv. Mater., 2015, 27, 1015 CrossRef CAS PubMed.
- D. Sun, D. Meng, Y. Cai, B. Fan, Y. Li, W. Jiang, L. Huo, Y. Sun and Z. Wang, J. Am. Chem. Soc., 2015, 137, 11156 CrossRef CAS PubMed.
- Y. Zhong, M. T. Trinh, R. Chen, G. E. Purdum, P. P. Khlyabich, M. Sezen, S. Oh, H. Zhu, B. Fowler, B. Zhang, W. Wang, C.-Y. Nam, M. Y. Sfeir, C. T. Black, M. L. Steigerwald, Y.-L. Loo, F. Ng, X. Y. Zhu and C. Nuckolls, Nat. Commun., 2015, 6, 8242 CrossRef CAS PubMed.
- L. Gao, Z.-G. Zhang, L. Xue, J. Min, J. Zhang, Z. Wei and Y. Li, Adv. Mater., 2016, 28, 1884 CrossRef CAS PubMed.
- Y. Guo, Y. Li, O. Awartani, J. Zhao, H. Han, H. Ade, D. Zhao and H. Yan, Adv. Mater., 2016, 28, 8483 CrossRef CAS PubMed.
- J. Liu, S. Chen, D. Qian, B. Gautam, G. Yang, J. Zhao, J. Bergqvist, F. Zhang, W. Ma, H. Ade, O. Inganäs, K. Gundogdu, F. Gao and H. Yan, Nat. Energy, 2016, 1, 16089 CrossRef CAS.
- D. Meng, H. Fu, C. Xiao, X. Meng, T. Winands, W. Ma, W. Wei, B. Fan, L. Huo, N. L. Doltsinis, Y. Li, Y. Sun and Z. Wang, J. Am. Chem. Soc., 2016, 138, 10184 CrossRef CAS PubMed.
- Q. Wu, D. Zhao, A. M. Schneider, W. Chen and L. Yu, J. Am. Chem. Soc., 2016, 138, 7248 CrossRef CAS PubMed.
- D. Zhao, Q. Wu, Z. Cai, T. Zheng, W. Chen, J. Lu and L. Yu, Chem. Mater., 2016, 28, 1139 CrossRef CAS.
- H. Zhong, C.-H. Wu, C.-Z. Li, J. Carpenter, C.-C. Chueh, J.-Y. Chen, H. Ade and A. K. Y. Jen, Adv. Mater., 2016, 28, 951 CrossRef CAS PubMed.
- Y. Lin, J. Wang, Z. G. Zhang, H. Bai, Y. Li, D. Zhu and X. Zhan, Adv. Mater., 2015, 27, 1170 CrossRef CAS PubMed.
- Y. Lin and X. Zhan, Adv. Energy Mater., 2015, 5, 1501063 CrossRef.
- Y. Lin, Q. He, F. Zhao, L. Huo, J. Mai, X. Lu, C. J. Su, T. Li, J. Wang, J. Zhu, Y. Sun, C. Wang and X. Zhan, J. Am. Chem. Soc., 2016, 138, 2973 CrossRef CAS PubMed.
- Y. Lin, T. Li, F. Zhao, L. Han, Z. Wang, Y. Wu, Q. He, J. Wang, L. Huo, Y. Sun, C. Wang, W. Ma and X. Zhan, Adv. Energy Mater., 2016, 6, 1600854 CrossRef.
- Y. Lin, F. Zhao, Q. He, L. Huo, Y. Wu, T. C. Parker, W. Ma, Y. Sun, C. Wang, D. Zhu, A. J. Heeger, S. R. Marder and X. Zhan, J. Am. Chem. Soc., 2016, 138, 4955 CrossRef CAS PubMed.
- P. Cheng, M. Zhang, T.-K. Lau, Y. Wu, B. Jia, J. Wang, C. Yan, M. Qin, X. Lu and X. Zhan, Adv. Mater., 2017, 29, 1605216 CrossRef PubMed.
- J. Zhu, Z. Ke, Q. Zhang, J. Wang, S. Dai, Y. Wu, Y. Xu, Y. Lin, W. Ma, W. You and X. Zhan, Adv. Mater., 2018, 30, 1704713 CrossRef PubMed.
- Y. Lin, F. Zhao, Y. Wu, K. Chen, Y. Xia, G. Li, S. K. K. Prasad, J. Zhu, L. Huo, H. Bin, Z.-G. Zhang, X. Guo, M. Zhang, Y. Sun, F. Gao, Z. Wei, W. Ma, C. Wang, J. Hodgkiss, Z. Bo, O. Inganäs, Y. Li and X. Zhan, Adv. Mater., 2017, 29, 1604155 CrossRef PubMed.
- T. Li, Z. Ke, L. Yang, J. Wang, C. Yan, W. Ma and X. Zhan, Adv. Mater., 2018, 30, 1705969 CrossRef PubMed.
- J. Wang, W. Wang, X. Wang, Y. Wu, Q. Zhang, C. Yan, W. Ma, W. You and X. Zhan, Adv. Mater., 2017, 29, 1702125 CrossRef PubMed.
- W. Wang, C. Yan, T.-K. Lau, J. Wang, K. Liu, Y. Fan, X. Lu and X. Zhan, Adv. Mater., 2017, 29, 1701308 CrossRef PubMed.
- H. Bin, L. Gao, Z.-G. Zhang, Y. Yang, Y. Zhang, C. Zhang, S. Chen, L. Xue, C. Yang, M. Xiao and Y. Li, Nat. Commun., 2016, 7, 13651 CrossRef CAS PubMed.
- Z. Li, K. Jiang, G. Yang, J. Y. L. Lai, T. Ma, J. Zhao, W. Ma and H. Yan, Nat. Commun., 2016, 7, 13094 CrossRef CAS PubMed.
- Y. Yang, Z. G. Zhang, H. Bin, S. Chen, L. Gao, L. Xue, C. Yang and Y. Li, J. Am. Chem. Soc., 2016, 138, 15011 CrossRef CAS PubMed.
- W. Zhao, D. Qian, S. Zhang, S. Li, O. Inganäs, F. Gao and J. Hou, Adv. Mater., 2016, 28, 4734 CrossRef CAS PubMed.
- D. Baran, R. S. Ashraf, D. A. Hanifi, M. Abdelsamie, N. Gasparini, J. A. Rohr, S. Holliday, A. Wadsworth, S. Lockett, M. Neophytou, C. J. M. Emmott, J. Nelson, C. J. Brabec, A. Amassian, A. Salleo, T. Kirchartz, J. R. Durrant and I. McCulloch, Nat. Mater., 2017, 16, 363 CrossRef CAS PubMed.
- B. Kan, H. Feng, X. Wan, F. Liu, X. Ke, Y. Wang, Y. Wang, H. Zhang, C. Li, J. Hou and Y. Chen, J. Am. Chem. Soc., 2017, 139, 4929 CrossRef CAS PubMed.
- Y. Liu, Z. Zhang, S. Feng, M. Li, L. Wu, R. Hou, X. Xu, X. Chen and Z. Bo, J. Am. Chem. Soc., 2017, 139, 3356 CrossRef CAS PubMed.
- T. Liu, Y. Guo, Y. Yi, L. Huo, X. Xue, X. Sun, H. Fu, W. Xiong, D. Meng, Z. Wang, F. Liu, T. P. Russell and Y. Sun, Adv. Mater., 2016, 28, 10008 CrossRef CAS PubMed.
- D. Xie, T. Liu, W. Gao, C. Zhong, L. Huo, Z. Luo, K. Wu, W. Xiong, F. Liu, Y. Sun and C. Yang, Solar RRL, 2017, 1, p. 1700044 Search PubMed.
- H. Yao, L. Ye, J. Hou, B. Jang, G. Han, Y. Cui, G. M. Su, C. Wang, B. Gao, R. Yu, H. Zhang, Y. Yi, H. Y. Woo, H. Ade and J. Hou, Adv. Mater., 2017, 29, 1700254 CrossRef PubMed.
- H. Feng, N. Qiu, X. Wang, Y. Wang, B. Kan, X. Wan, M. Zhang, A. Xia, C. Li, F. Liu, H. Zhang and Y. Chen, Chem. Mater., 2017, 29, 7908 CrossRef CAS.
- S. Dai, F. Zhao, Q. Zhang, T. K. Lau, T. Li, K. Liu, Q. Ling, C. Wang, X. Lu, W. You and X. Zhan, J. Am. Chem. Soc., 2017, 139, 1336 CrossRef CAS PubMed.
- F. Zhao, S. Dai, Y. Wu, Q. Zhang, J. Wang, L. Jiang, Q. Ling, Z. Wei, W. Ma, W. You, C. Wang and X. Zhan, Adv. Mater., 2017, 29, 1700144 CrossRef PubMed.
- Y. Cui, C. Yang, H. Yao, J. Zhu, Y. Wang, G. Jia, F. Gao and J. Hou, Adv. Mater., 2017, 29, 1703080 CrossRef PubMed.
- L. Ye, W. Zhao, S. Li, S. Mukherjee, J. H. Carpenter, O. Awartani, X. Jiao, J. Hou and H. Ade, Adv. Energy Mater., 2017, 7, 1602000 CrossRef.
- S. Li, L. Ye, W. Zhao, S. Zhang, H. Ade and J. Hou, Adv. Energy Mater., 2017, 7, 1700183 CrossRef.
- Y. Yi, H. Feng, M. Chang, H. Zhang, X. Wan, C. Li and Y. Chen, J. Mater. Chem. A, 2017, 5, 17204 CAS.
- F. Yang, C. Li, W. Lai, A. Zhang, H. Huang and W. Li, Mater. Chem. Front., 2017, 1, 1389 RSC.
- S. C. Price, A. C. Stuart, L. Yang, H. Zhou and W. You, J. Am. Chem. Soc., 2011, 133, 4625 CrossRef CAS PubMed.
- W. Li, S. Albrecht, L. Yang, S. Roland, J. R. Tumbleston, T. McAfee, L. Yan, M. A. Kelly, H. Ade, D. Neher and W. You, J. Am. Chem. Soc., 2014, 136, 15566 CrossRef CAS PubMed.
- I. Riedel, J. Parisi, V. Dyakonov, L. Lutsen, D. Vanderzande and J. C. Hummelen, Adv. Funct. Mater., 2004, 14, 38 CrossRef CAS.
- V. D. Mihailetchi, L. J. A. Koster, J. C. Hummelen and P. W. M. Blom, Phys. Rev. Lett., 2004, 93, 216601 CrossRef CAS PubMed.
- A. Hexemer, W. Bras, J. Glossinger, E. Schaible, E. Gann, R. Kirian, A. MacDowell, M. Church, B. Rude and H. Padmore, J. Phys.: Conf. Ser., 2010, 247, 012007 CrossRef.
- V. D. Mihailetchi, L. J. A. Koster, J. C. Hummelen and P. W. M. Blom, Phys. Rev. Lett., 2004, 93, 216601 CrossRef CAS PubMed.
Footnotes |
| † Electronic supplementary information (ESI) available: Synthesis and characterization of ITIC-Th2 and ITIC-Th3, device fabrication procedures, TGA and DSC curves, SCLC data, and AFM images. See DOI: 10.1039/c7qm00547d |
| ‡ Zeyuan Li and Shuixing Dai contributed equally. |
| This journal is © the Partner Organisations 2018 |

