A ratiometric fluorogenic probe for the real-time detection of SO32− in aqueous medium: application in a cellulose paper based device and potential to sense SO32− in mitochondria†
Soham
Samanta
a,
Senjuti
Halder
a,
Poulomi
Dey
b,
Utsab
Manna
a,
Aiyagari
Ramesh
*b and
Gopal
Das
 *a
*a
aDepartment of Chemistry, Indian Institute of Technology Guwahati, Guwahati 781039, India. E-mail: gdas@iitg.ernet.in; Fax: +91 361 2582349; Tel: +91 361 2582313
bDepartment of Biosciences and Bioengineering, Indian Institute of Technology Guwahati, Guwahati 781039, India. E-mail: aramesh@iitg.ernet.in; Fax: +91 361 2582249; Tel: +91 361 2582205
First published on 8th November 2017
Abstract
A new water soluble and fluorogenic probe (L) that can demonstrate a specific ratiometric detection of a SO2 derivative (SO32−) in 100% aqueous medium and live cells has been designed and synthesized. The detection process can be visualized by the naked eye, as the orange-red fluorescence of L turns into a strong blue fluorescence upon interaction with SO32−. L displayed several beneficial attributes such as detection in complete aqueous medium, extremely fast response time along with high selectivity and sensitivity. The ratiometric sensing was attributed to the selective nucleophilic addition reaction of SO32− with L. The probe was further used to develop a low cost microfluidic sensor device (μPAD). The probe was biocompatible and its potential to sense SO32− in mitochondria was captured in live HeLa cells.
Introduction
Sulfur dioxide (SO2) is a well-known air pollutant, which is prevalent in the atmosphere owing to the extensive combustion of fossil fuels across the globe. From a toxicological point of view, increasing SO2 levels are detrimental to the environment and climate and according to the US-EPA, continuous release of sulfur dioxide into the atmosphere is a major reason for increasing acid rain, which causes severe damage to crops, trees, lakes, rivers, and animals. SO2 is highly soluble in water (40 g L−1) and the SO2 related toxicity can be mainly attributed to its derivatives, sulfite (SO32−) and bisulfite (HSO3−) (3![[thin space (1/6-em)]](https://www.rsc.org/images/entities/char_2009.gif) :
:![[thin space (1/6-em)]](https://www.rsc.org/images/entities/char_2009.gif) 1 M/M, in neutral fluid).1,2 It is very likely that sulfurous acid produced in the respiratory tract from inhaled hydrated SO2 may trigger the generation of these two derivatives. Epidemiological studies suggest that even though SO2 renders physiological benefits such as vasodilatation and lowering of blood pressure,3,4 prolonged SO2 exposure may lead to respiratory ailments,5 lung cancer, cardiovascular diseases6,7 and various neurological disorders including migraine headaches, stroke and brain cancer.8 Recent studies have revealed that SO2 gas can be generated endogenously from sulfur-containing amino acids9 through biosynthetic pathways10,11 like transamination by aspartate amino-transferase (AAT).12 So, SO2 has been identified as the fourth gasotransmitter after nitric oxide (NO), carbon monoxide (CO) and hydrogen sulfide (H2S), respectively. However, the exact role of SO2 in the context of tumour cell physiology and in normal cells has not been resolved yet. Thus the rapid detection of SO2 and its hydrated derivatives (sulfite and bisulfite) in biological, environmental and food/beverage samples has sparked immense research interest. Fluorescence-based sensing probes can facilitate the rapid, non-invasive and sensitive detection of target analytes, which underlines their utility and superiority over other sensing systems for the detection of biological species.13–19 However, a fluorescence based sensor must overcome the influence of various factors such as the localization of the probe, changes of the environment around the probe (pH, polarity, temperature, and so forth), emission collection efficiency, effective cell thickness in the optical beam and changes in the excitation intensity in order to demonstrate efficient cellular imaging.20,21 In this regard, developing a ratiometric fluorescent probe is ideal as it not only reduces the influence of such factors but also offers precise quantification of the target. Very little progress has been made in developing efficient fluorescent sensors for detecting SO2 (or sulfite and bisulfite) in biological and environmental samples as most of these reported detection systems suffer from drawbacks in terms of selectivity, detection limit, response time (5 min to 1 h) and background signal inside a cell.22–29 More recently, some new and reliable sensors for the detection of SO2 in live cells have been reported.30–35 However, these probes require a considerable amount of organic solvents (10% DMF, 30% DMF, 40% glycerol, 30% DMF, 20% EtOH and 15% EtOH) as co-solvents along with water, which can curb their application potential in biological samples. Moreover, even though some of the reported probes exhibited the intracellular detection of SO2 derivatives, the possibility of engineering low cost devices using these chemo-sensors has seldom been explored.
1 M/M, in neutral fluid).1,2 It is very likely that sulfurous acid produced in the respiratory tract from inhaled hydrated SO2 may trigger the generation of these two derivatives. Epidemiological studies suggest that even though SO2 renders physiological benefits such as vasodilatation and lowering of blood pressure,3,4 prolonged SO2 exposure may lead to respiratory ailments,5 lung cancer, cardiovascular diseases6,7 and various neurological disorders including migraine headaches, stroke and brain cancer.8 Recent studies have revealed that SO2 gas can be generated endogenously from sulfur-containing amino acids9 through biosynthetic pathways10,11 like transamination by aspartate amino-transferase (AAT).12 So, SO2 has been identified as the fourth gasotransmitter after nitric oxide (NO), carbon monoxide (CO) and hydrogen sulfide (H2S), respectively. However, the exact role of SO2 in the context of tumour cell physiology and in normal cells has not been resolved yet. Thus the rapid detection of SO2 and its hydrated derivatives (sulfite and bisulfite) in biological, environmental and food/beverage samples has sparked immense research interest. Fluorescence-based sensing probes can facilitate the rapid, non-invasive and sensitive detection of target analytes, which underlines their utility and superiority over other sensing systems for the detection of biological species.13–19 However, a fluorescence based sensor must overcome the influence of various factors such as the localization of the probe, changes of the environment around the probe (pH, polarity, temperature, and so forth), emission collection efficiency, effective cell thickness in the optical beam and changes in the excitation intensity in order to demonstrate efficient cellular imaging.20,21 In this regard, developing a ratiometric fluorescent probe is ideal as it not only reduces the influence of such factors but also offers precise quantification of the target. Very little progress has been made in developing efficient fluorescent sensors for detecting SO2 (or sulfite and bisulfite) in biological and environmental samples as most of these reported detection systems suffer from drawbacks in terms of selectivity, detection limit, response time (5 min to 1 h) and background signal inside a cell.22–29 More recently, some new and reliable sensors for the detection of SO2 in live cells have been reported.30–35 However, these probes require a considerable amount of organic solvents (10% DMF, 30% DMF, 40% glycerol, 30% DMF, 20% EtOH and 15% EtOH) as co-solvents along with water, which can curb their application potential in biological samples. Moreover, even though some of the reported probes exhibited the intracellular detection of SO2 derivatives, the possibility of engineering low cost devices using these chemo-sensors has seldom been explored.
In order to address these issues, herein we report a versatile fluorogenic probe that can rapidly sense SO32− through a highly selective and ratiometric response in 100% aqueous medium and live cells. This study also describes the engineering of a cellulose paper-based microfluidic device for the facile detection of SO32−.
Experimental
General information and materials
All the materials for synthesis were purchased from commercial suppliers and used without further purification. The absorption spectra were recorded on a PerkinElmer Lambda-25 UV-Vis spectrophotometer using 10 mm path length quartz cuvettes in the range of 300–800 nm wavelength, whereas fluorescence measurements were performed on a Horiba Fluoromax-4 spectrofluorometer using 10 mm path length quartz cuvettes with a slit width of 3 nm at 298 K. The mass spectrum of the probe L was obtained using a Waters Q-ToF Premier mass spectrometer. Nuclear magnetic resonance (NMR) spectra were recorded on a Bruker Advance 600 MHz instrument. Chemical shifts were recorded in parts per million (ppm) on the scale. The following abbreviations are used to describe spin multiplicities in 1H NMR spectra: s = singlet; d = doublet; t = triplet; q = quartet, and m = multiplet.Synthesis of the probe L
3-Ethyl-1,1,2-trimethyl-1H-benzo[e]indol-3-ium was prepared following the procedure reported in our previously published literature work (step 1 of Scheme S1, ESI†).36 In the next step, 2.0 mmol of 3-ethyl-1,1,2-trimethyl-1H-benzo[e]indol-3-ium obtained in the first step was dissolved in dry EtOH by gentle warming. Then, 1.0 mmol of isophthalaldehyde was added to it and the resulting mixture was refluxed for 10 h to obtain a brown-red solid L. Calculated yield: 68%. 1H NMR [600 MHz, DMSO-d6, J (Hz), δ (ppm)]: 8.97 (1H, s), 8.65 (2H, d, J = 16.8), 8.55 (2H, d, J = 7.8), 8.49 (2H, d, J = 8.4), 8.36 (2H, d, J = 9.0), 8.26 (2H, d, J = 7.8), 8.22 (2H, d, J = 9.0), 7.94 (2H, d, J = 16.2), 7.87–7.84 (3H, m), 7.78 (2H, t, J = 7.8), 4.98 (4H, q, J = 7.2), 2.10 (12H, s), 1.60 (6H, t, J = 7.2). 13C NMR [150 MHz, DMSO-d6, TMS, δ (ppm)]: 182.02, 151.01, 139.19, 138.14, 135.39, 133.63, 133.43, 131.27, 130.11, 130.04, 128.60, 127.58, 126.73, 123.34, 113.61, 113.57, 113.42, 54.19, 43.08, 25.36, 14.21. ESI-MS (positive mode, m/z) calculated for C42H42N22+: 287.1674. Found: 287.1726.Crystallization of L
A small amount of brown-red solid L was taken in a test tube containing a DCM–EtOH mixture and sonicated for 5 min to obtain a clear solution. Then the solution was allowed to evaporate slowly at room temperature and after one week X-ray mountable plate shaped orange-red colored crystals appeared at the bottom of the test tube.Crystallographic refinement details
In this case, a crystal of suitable size was selected from the mother liquor and immersed in silicone oil, then mounted on the tip of a glass fiber and cemented using epoxy resin. Intensity data for all the crystals were collected using Mo-Kα radiation (λ = 0.71073 Å) at 298(2) K, with increasing ω (width of 0.3° per frame) at a scan speed of 6 s per frame on a Bruker SMART APEX diffractometer equipped with a CCD area detector. Data integration and reduction were processed with SAINT37 software. An empirical absorption correction was applied to the collected reflections with SADABS.38 The structures were solved by direct methods using SHELXTL39 and were refined on F2 by the full-matrix least-squares technique using the SHELXL-97 program package.40 Graphics were generated using MERCURY 3.0.41 In all cases, non-hydrogen atoms are treated anisotropically. The hydrogen atoms were located on a difference Fourier map and refined. In other cases, the hydrogen atoms are geometrically fixed.UV-vis and fluorescence spectroscopic studies
Stock solutions of various analytes (1 × 10⁻¹ mol L−1) were prepared in methanol or Millipore water depending on the preferred solubility of the analytes chosen. A stock solution of L (5 × 10⁻³ mol L−1) was prepared in DMSO. The solution of L was then diluted to 10 × 10−6 mol L−1 for spectral studies by taking only 4.0 μL stock solution of L and making the final volume up to 2.0 mL by adding aqueous phosphate buffered saline (PBS) solution (pH 7.4). In the fluorescence selectivity experiment, the test samples were prepared by placing appropriate amounts of the stock solutions of the respective anions/analytes into 2.0 mL of probe solution (10 × 10−6 mol L−1). For UV-visible and fluorescence titration experiments, another set of SO32− standard solution having 2.5 mM and 5.0 mM concentrations was prepared by diluting the previously prepared stock solutions (1 × 10⁻¹ mol L−1) in Millipore water. Quartz optical cells of 1.0 cm path length were filled with 1.0 mL and 2.0 mL solutions of L for UV-visible and fluorescence titration experiments, respectively, to which the newly prepared stock solutions of the analytes (2.5 mM and 5.0 mM) were gradually added using a micropipette as necessary. For fluorescence measurements, excitation was provided at 380 nm and emission was acquired from 400 nm to 750 nm. Spectral data were recorded within 1 min after addition of the ions except for kinetic studies.Detection limit
Detection limits were calculated on the basis of fluorescence titration. The fluorescence emission spectrum of L was recorded 10 times, and the standard deviation of the blank measurement was estimated (λem = 470 nm). To measure the slope, the fluorescence emission at 470 nm was plotted as a function of the concentration of SO32− from the titration experiment. The detection limit was then calculated using the following equation:| Detection limit = 3σ/k | (1) |
Microfluidic device (μPAD) fabrication
A microfluidic device (μPAD) was developed from simple Whatman 42 filter paper based on the inbuilt capillary behavior of cellulose papers. We have followed a slightly modified device fabrication process compared to several reported systems.42,43 Firstly, a filter paper was immersed into a 1% polystyrene solution (in toluene) for several hours (Scheme S2, ESI†). The paper was then air-dried and a polystyrene coated hydrophobic cellulose paper was obtained. Subsequently, the paper was cut into a square (2.5 cm × 2.5 cm) to which another normal filter paper (properly cut) having a sampling area and a detection area connected by a straight micro-channel was pasted (see the graphical representation in Scheme S2, ESI†). Then, the probe L was carefully dropcast on the detection area by a drop on demand (DOD) method. The device was then used in application studies.Cytotoxicity studies with L, L–SO32− adduct and Na2SO3
HeLa cells (human cervical carcinoma cells) were propagated in a 25 cm2 tissue culture flask in DMEM medium supplemented with 10% (v/v) FBS, penicillin (100 μg mL−1) and streptomycin (100 μg mL−1) under a humidified atmosphere of 5% CO2 until the cells were approximately 80% confluent. Prior to the MTT assay, cells were trypsinized and seeded into 96 well tissue culture plates at 104 cells per well and incubated with varying concentrations (1.0 μM–64 μM) of L made in DMEM for a period of 24 h. Following incubation, growth media were carefully aspirated and fresh DMEM containing MTT solution was added to the wells. The plate was subsequently incubated for 4 h at 37 °C. Following incubation, the supernatant was discarded and the insoluble colored formazan product was solubilized in DMSO and its absorbance was measured in a microtiter plate reader (Infinite M200, TECAN, Switzerland) at 550 nm with a reference of 670 nm. For each concentration of the test samples, the MTT assay was performed in six independent sets. Data analysis and determination of the standard deviation were accomplished using Microsoft Excel 2016 (Microsoft Corporation). In the MTT assay, the absorbance for the control cells was considered as 100% cell viability and the absorbance obtained for the treated cells was used to ascertain % cell viability with respect to the control. The MTT assay was also conducted in a parallel experiment to determine the cytotoxic potential of the L–SO32− adduct in cells. To this end, HeLa cells seeded into 96 well tissue culture plates (104 cells per well) were incubated with varying concentrations of 1.0 μM–64 μM of L made in DMEM for 30 min under 5% CO2. Subsequently, sodium sulfite salt was added to HeLa cells pre-incubated with L so as to achieve an L–sulfite adduct in the ratios of 1![[thin space (1/6-em)]](https://www.rsc.org/images/entities/char_2009.gif) :
:![[thin space (1/6-em)]](https://www.rsc.org/images/entities/char_2009.gif) 5, 1
5, 1![[thin space (1/6-em)]](https://www.rsc.org/images/entities/char_2009.gif) :
:![[thin space (1/6-em)]](https://www.rsc.org/images/entities/char_2009.gif) 10 and 1
10 and 1![[thin space (1/6-em)]](https://www.rsc.org/images/entities/char_2009.gif) :
:![[thin space (1/6-em)]](https://www.rsc.org/images/entities/char_2009.gif) 20. The cells were then incubated for a period of 24 h under 5% CO2 and subjected to the MTT assay as mentioned before. In a separate experiment, HeLa cells treated with Na2SO3 salt alone (5.0 μM–1280 μM) were also subjected to the MTT assay.
20. The cells were then incubated for a period of 24 h under 5% CO2 and subjected to the MTT assay as mentioned before. In a separate experiment, HeLa cells treated with Na2SO3 salt alone (5.0 μM–1280 μM) were also subjected to the MTT assay.
Detection of sulfite in HeLa cells by cell imaging
HeLa cells (human cervical carcinoma cells) were initially cultured in a 25 cm2 tissue culture flask containing DMEM medium supplemented with 10% FBS, penicillin (100 μg mL−1) and streptomycin (100 μg mL−1) in a CO2 incubator. Prior to imaging studies, HeLa cells were seeded onto a 6 well plate and grown in DMEM medium at 37 °C until 80% confluency in a CO2 incubator. Subsequently, the cells were washed once with sterile PBS and incubated with 10 μM of L in DMEM at 37 °C for 5.0 min in a CO2 incubator. The cells were further washed with sterile PBS in order to remove excess L and their images were acquired using a fluorescence microscope (Eclipse Ti-U, Nikon, USA) with filters that allowed blue and red light emission. In a separate experiment, HeLa cells pre-treated with 100 μM of sodium sulfite (prepared in sterile PBS) for 5 min were further incubated with 10 μM of L for 5.0 min to achieve the final 1![[thin space (1/6-em)]](https://www.rsc.org/images/entities/char_2009.gif) :
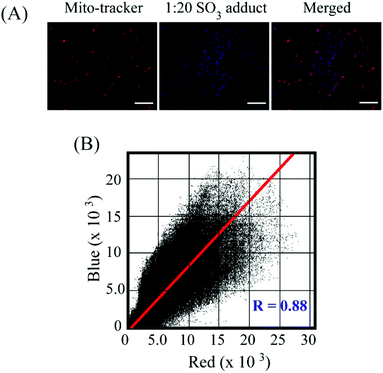
:![[thin space (1/6-em)]](https://www.rsc.org/images/entities/char_2009.gif) 10 ratio of L–SO32−. Subsequently, the cells were washed with sterile PBS in order to remove excess salt and then their images were acquired using a fluorescence microscope (Eclipse Ti-U, Nikon, USA) with filters that allowed blue and red light emission. In order to ascertain cellular localization of the L–SO32− adduct, HeLa cells were stained with 1.0 μM MitoTracker dye in DMEM at 37 °C for 30 min in a CO2 incubator. The cells were again washed with sterile PBS and treated with 200 μM of sodium sulfite in sterile DMEM for a period of 5.0 min followed by treatment with 10 μM of L and incubated further for 5.0 min to facilitate L–SO32− adduct formation. The cells were again washed with sterile PBS in order to remove excess dye and their images were acquired using a fluorescence microscope with a filter that allowed red light emission. The co-localization of the images for the MitoTracker and the L–SO32− adduct was performed using ImageJ software and the JACoP plugin.44
10 ratio of L–SO32−. Subsequently, the cells were washed with sterile PBS in order to remove excess salt and then their images were acquired using a fluorescence microscope (Eclipse Ti-U, Nikon, USA) with filters that allowed blue and red light emission. In order to ascertain cellular localization of the L–SO32− adduct, HeLa cells were stained with 1.0 μM MitoTracker dye in DMEM at 37 °C for 30 min in a CO2 incubator. The cells were again washed with sterile PBS and treated with 200 μM of sodium sulfite in sterile DMEM for a period of 5.0 min followed by treatment with 10 μM of L and incubated further for 5.0 min to facilitate L–SO32− adduct formation. The cells were again washed with sterile PBS in order to remove excess dye and their images were acquired using a fluorescence microscope with a filter that allowed red light emission. The co-localization of the images for the MitoTracker and the L–SO32− adduct was performed using ImageJ software and the JACoP plugin.44
Results and discussion
Design, synthesis and structure of the probe L
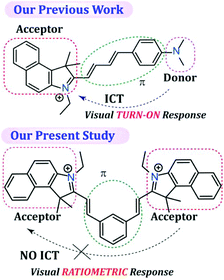
SO2 derivatives (SO32− and HSO3−) are regarded as good nucleophiles that can readily react with α,β-unsaturated compounds very rapidly in aqueous solution.45 Hence, the fundamental principle of the probe design was based on a nucleophilic addition reaction, which can subsequently be monitored by a rapid change in fluorescence. The probe L was synthesized by the condensation reaction of isophthalaldehyde with 3-ethyl-1,1,2-trimethyl-1H-benzo[e]indol-3-ium in dry ethanol (Scheme S1, ESI†), wherein 1H-benzo[e]indol-3-ium was used not only as a signalling moiety but also to improve the solubility of the fluorescent probe in aqueous medium. It is worth mentioning that in our previous report even though we were able to acquire a ratiometric fluorescence response by exciting the sensor at two different wavelengths, under UV light the probe36 demonstrated only a TURN-ON response (conspicuous to the naked eye) as the native probe exhibited very low fluorescence due to the existing twisted intramolecular charge transfer (TICT) process. As a result, in our previous study we were unable to achieve a dual channel ratiometric bio-imaging and the probe was able to exhibit only a TURN-ON fluorescence response inside live HeLa cells. Hence, unlike our previous work,36 in the present probe design we have purposely avoided involvement of the intramolecular charge transfer (ICT) process by designing an acceptor–π-acceptor fluorogenic system rather than a donor–π-acceptor system (Scheme 1), so that a dual channel ratiometric intracellular detection of SO32− is feasible.It should also be highlighted here that when benzaldehyde was used in place of isophthalaldehyde in the probe design (by Suna et al.),46 it only rendered a TURN-ON response rather than a ratiometric response owing to the non-fluorescent character of the free probe, which justifies the introduction of an acceptor–π-acceptor fluorogenic system in the present study by incorporating isophthalaldehyde in the probe structure. The single X-ray crystal structure clearly revealed that L has a ‘bat’ like structural orientation (Fig. 1A) and an almost planar geometry, which negates the possibility of TICT. The packing diagram of L around the ‘c’ axis manifested a ‘honeycomb’ like structure (Fig. 1B).
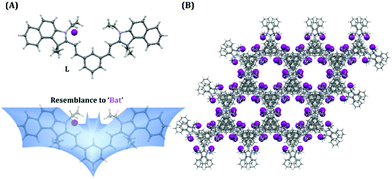 | ||
| Fig. 1 (A) X-ray crystal structure of L and its structural resemblance to a ‘bat’. (B) Packing diagram shown in the ‘c’ axis. | ||
Colorimetric response of the probe L towards SO32−
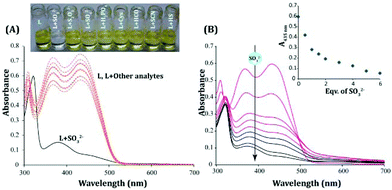
The probe displayed excellent aqueous solubility as anticipated, and its increased water solubility can perhaps be ascribed to the incorporation of an extra 1H-benzo[e]indol-3-ium moiety in the probe design (Scheme 1). The UV-vis spectra of the probe L recorded in almost 100% (actual 99.8% aqueous medium containing 0.2% DMSO) aqueous medium (PBS, pH 7.4) revealed two well defined strong absorbance maxima at 370 nm and 435 nm, which might be attributed to π–π* and n–π* transitions, respectively (Fig. 2A).The addition of excess (20 equivalents) of SO32− to L resulted in a significant obliteration of the absorbance peak at 435 nm, while the absorbance maximum at 370 nm (Fig. 2A) too had concurrently reduced substantially. This spectral change was complemented by a conspicuous change in the color of the experimental solution from orange-red (only L) to colorless (L+, SO32−) (Fig. 2A). Interestingly, no other analytes (H2PO4−, SO42−, HSO4−, F−, NO3−, ClO4− and SH−) were able to produce any significant change in the absorbance spectra upon interacting with L (Fig. 2A). A titration experiment with an incremental addition of SO32− resulted in a systematic reduction of the absorbance peaks of L at 435 nm and 370 nm (Fig. 2B). Hence, the UV-visible spectral studies essentially suggested that the probe L could have potentially undergone nucleophilic attack by SO32− to exhibit such colorimetric changes owing to the loss of extended conjugation in L. A detailed fluorescence study was pursued to further investigate the analytical prospect of L.
Fluorescence spectral response of the probe L towards various analytes
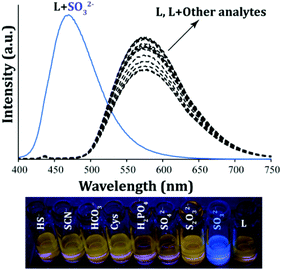
The free probe L (10 μM) showed a well-defined strong emission peak at 573 nm (λex = 380 nm, Fig. 3) and yielded a bright orange fluorescence in ∼100% aqueous PBS (pH 7.4) which can be accredited to the existing uninterrupted extended π conjugation in the system. The selectivity of the probe was ascertained in the presence of an excess of various analytes which included F−, Cl−, Br−, I−, NO2−, NO3−, CH3COO−, H2PO4−, PF6−, PPi, HCO3−, SO42−, HSO4−, ClO4−, SCN−, S2O32−, S2O82−, C6H7O6− (ascorbate), SO32−, SH−, Cys, Hcy and GSH. A fluorescence selectivity experiment clearly depicted that no noteworthy change could be observed in the spectral nature of L in the presence of the aforementioned analytes except for the SO2 derivative, SO32− (Fig. 3). Interestingly, the addition of SO32− to L resulted in the generation of a high intensity new emission peak at 470 nm, whereas the original emission maximum of L at 573 nm had disappeared completely (Fig. 3).This selective fluorogenic response of L towards SO32− was also evident visually as the orange emitting solution of L turned into a strong bluish-green fluorescent solution upon interacting with SO32− (Fig. 3, bottom panel). It should be mentioned here that the fluorescence response of L towards SO32− in solution was very rapid as all the fluorescence spectra were recorded within 1 min of the addition of the analytes. Moreover, the fluorescence kinetic studies of L with and without the addition of SO32− indicated that a significant increase in the emission intensity could be observed within seconds after the addition of SO32− to L, which underlines the real-time detection ability of L (Fig. S8, ESI†) as compared to several reported probes.22–29 Interestingly, this instantaneous fluorescence response could be witnessed by the naked eye also (a supporting video is provided in the ESI† of the manuscript). L showed a similar but diminished fluorescence response towards HSO3− like SO32− (Fig. S9, ESI†). However, it may be mentioned that this experiment was conducted in ∼100% aqueous buffer at pH 7.4 and at this pH, the HSO3− species is likely to exist as SO32− in solution. Also, a variable pH study suggested that L can sense SO32− in the pH range of 6.0 to 8.0 through TURN-ON fluorescence responses (Fig. S10, ESI†) as SO32− is the predominant species in this pH range.
Meanwhile, the addition of ammonia to L only serves as the addition of a base (like NaOH) to the probe and does not interfere with the sensing of SO32− (Fig. S11, ESI†). It is worth mentioning that even the addition of huge excess (200 equivalents) of some inorganic sulfur compounds (SCN−, S2O32−, and S2O82−), reactive sulfur species (HS−, Cys, Hcy and GSH) and a reducing agent (sodium ascorbate) to L induced a negligible change in the emission behavior of L, which reaffirmed the selectivity of L towards SO32−. We have also checked the selectivity of the probe L towards CN− and OCl− as some of the recent literature studies47–49 suggested that these reactive species could also potentially undergo a reaction with cyanine based compounds. It is encouraging to note that OCl− and CN− rendered a very insignificant change in the fluorescence when added in excess to L (Fig. S12, ESI†). Hence, the selectivity of L is solely specific towards SO32−.
In order to acquire a quantitative understanding of the fluorescence spectral change of L upon interaction with varying levels of SO32−, a fluorescence titration experiment was carried out. With incremental addition of SO32− to the solution of L in ∼100% aqueous PBS there was a systematic enhancement in its emission intensity at 470 nm and a concurrent decrease in the original emission peak of L at 573 nm (Fig. 4). This concomitant change in the emission intensities at two different wavelengths (470 nm and 573 nm) provided an additional handle to track SO32− concentration. Essentially, the ratio of the fluorescence emission intensities at two different wavelengths (I470/I573) varied from 0.0094 to 12.06 up to the addition of 10 equivalents of SO32−. This significant change (∼1282 fold increase) in the emission signal ratios not only introduced high sensitivity into the detection system but also provided a wide dynamic range for the ratiometric sensing of SO32− under physiological conditions by measuring the signal ratios at two wavelengths. Further, it is notable that the two emission bands are widely spaced (over 103 nm), which also enhances the feasibility of a dual emission ratiometric imaging in cells. The detection limit for SO32− was determined from the fluorescence titration experiment (the slope was obtained from the change in the intensity at 470 nm only) and it was found to be 1.056 × 10⁻⁷ M or 8.45 ppb (Fig. S13, ESI†), which is much lower compared to several reported fluorescent probes for SO2 derivatives.22–30,33
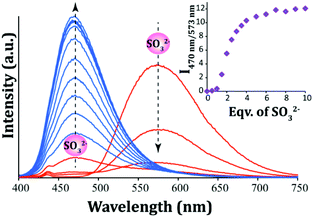 | ||
| Fig. 4 Fluorescence spectra of L (10 μM) in the presence of varying concentrations of SO32−. Inset: Changes in the emission intensity ratio (I470/I573) with the addition of equivalents of SO32−. | ||
Engineering cellulose paper based sensor devices
The ultra-sensitive, rapid, ratiometric and naked eye detecting ability of the probe L provided us the opportunity to develop a user-friendly and low-cost detection device for the on-site analysis of SO2 derivatives. Cellulose paper (Whatman 42 filter paper), being a low-cost, abundantly available, and disposable substrate, has been preferentially selected by us as the core material of the device over glass or a polymer.42,43 A preliminary experiment revealed that L (10 μM) could retain its fluorogenic behavior by exhibiting a visible orange fluorescence, when dropcast on a cellulose paper (Fig. 5A). Subsequent addition of one drop of SO32− (50 μM in water) rapidly altered the orange fluorescence of L into a highly bluish-green emitting spot, which underlines the effectiveness of utilizing the probe in a low cost device fabrication. Hence, we took a step further to engineer a cellulose paper-based microfluidic analytical device wherein liquid transport would be entirely driven by capillary flow and there will be no additional requirement for external pumping. A simple polystyrene coated microfluidic device (μPAD) was developed (Fig. 5B) by dropcasting L in the detection area (Experimental section and Scheme S2, ESI†). It was remarkable to note that the device could successfully sense the trace SO2 derivative (SO32−) imported in the sampling part of the μPAD through a rapid and conspicuous change in fluorescence (Fig. 5C).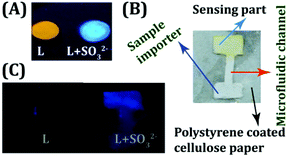 | ||
| Fig. 5 (A) L dropcast on cellulose paper with and without the addition of SO32−. (B) Design of the developed μPAD. (C) μPAD device before and after treatment with SO32−. | ||
Plausible sensing mechanism
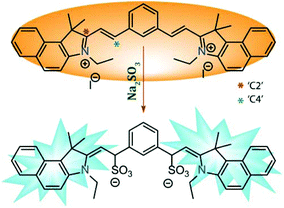
Even though it is well established that α,β-unsaturated compounds can undergo nucleophilic attack by reactive anionic species like SO32− in aqueous medium,45 there are some contradicting claims about which probe–SO32− adduct is formed. Some of the reports suggested that nucleophilic attack takes place at the ‘C2’ site whereas the majority of the reports asserted the reaction took place at the ‘C4’ site. A few reports even advocated the subsequent ‘C![[double bond, length as m-dash]](https://www.rsc.org/images/entities/char_e001.gif) C’ reduction after nucleophilic addition at the ‘C4’ site. Hence, even though ratiometric fluorescence based sensing of the anionic SO32− by L in the present case is primarily attributed to the nucleophilic addition reaction, in order to gain insight into the mechanism of sensing, we have isolated the pure colorless product (L–SO32− adduct) and characterized the same by NMR and mass spectroscopy experiments (Fig. S14 and S15, ESI†).
C’ reduction after nucleophilic addition at the ‘C4’ site. Hence, even though ratiometric fluorescence based sensing of the anionic SO32− by L in the present case is primarily attributed to the nucleophilic addition reaction, in order to gain insight into the mechanism of sensing, we have isolated the pure colorless product (L–SO32− adduct) and characterized the same by NMR and mass spectroscopy experiments (Fig. S14 and S15, ESI†).
Both the 1H-NMR and mass spectral studies validated the detection mechanism depicted in Scheme 2 by confirming the formation of the presented L–SO3 adduct. So, the present study also supported the notion of the majority of the reports that the reaction at the ‘C4’ site (without further reduction) was the key phenomenon for the observed fluorescence response.
Dual channel ratiometric live cell imaging
Encouraged by solution-based studies, our next endeavour was to ascertain the potential of L in the detection of sulfite in cells by fluorescence-based imaging. To this end, evaluation of cytotoxic potential by an MTT assay illustrated that neither L alone nor the L–SO32− adduct (in ratios of 1![[thin space (1/6-em)]](https://www.rsc.org/images/entities/char_2009.gif) :
:![[thin space (1/6-em)]](https://www.rsc.org/images/entities/char_2009.gif) 5, 1
5, 1![[thin space (1/6-em)]](https://www.rsc.org/images/entities/char_2009.gif) :
:![[thin space (1/6-em)]](https://www.rsc.org/images/entities/char_2009.gif) 10 and 1
10 and 1![[thin space (1/6-em)]](https://www.rsc.org/images/entities/char_2009.gif) :
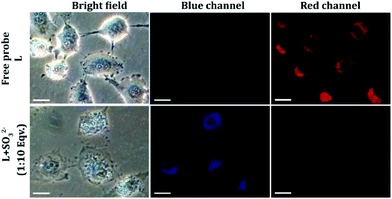
:![[thin space (1/6-em)]](https://www.rsc.org/images/entities/char_2009.gif) 20) could exert any toxic effect on live HeLa cells up to a concentration of 64 μM (Fig. S16, ESI†), which validated the biocompatibility of the probe. In cell imaging studies, HeLa cells incubated with L for just 5 minutes showed negligible fluorescence in the blue emission channel and a bright red fluorescence in the red channel, which was perinuclear and essentially localized in the cytoplasm (Fig. 6). This suggested that L could rapidly traverse across the cell membrane. However, when HeLa cells pre-treated with Na2SO3 (100 μM) for 5 minutes were incubated with L for less than 5 minutes, they displayed an intense blue fluorescence in the blue channel with a concomitant and a dramatic drop of red channel fluorescence (Fig. 6). In a co-localization experiment, the merged images obtained with the mitochondrial dye MitoTracker and L–SO32− adduct revealed that the fluorescence of MitoTracker and L–SO32− co-localized well with a high Pearson coefficient of 0.88 (Fig. 7), which suggested the potential of the probe in detecting SO32− in mitochondria. It may be highlighted that unlike several reported probes, the biocompatible probe L exhibited rapid cellular uptake and rendered an extremely fast ratiometric intracellular sensing of SO32−.
20) could exert any toxic effect on live HeLa cells up to a concentration of 64 μM (Fig. S16, ESI†), which validated the biocompatibility of the probe. In cell imaging studies, HeLa cells incubated with L for just 5 minutes showed negligible fluorescence in the blue emission channel and a bright red fluorescence in the red channel, which was perinuclear and essentially localized in the cytoplasm (Fig. 6). This suggested that L could rapidly traverse across the cell membrane. However, when HeLa cells pre-treated with Na2SO3 (100 μM) for 5 minutes were incubated with L for less than 5 minutes, they displayed an intense blue fluorescence in the blue channel with a concomitant and a dramatic drop of red channel fluorescence (Fig. 6). In a co-localization experiment, the merged images obtained with the mitochondrial dye MitoTracker and L–SO32− adduct revealed that the fluorescence of MitoTracker and L–SO32− co-localized well with a high Pearson coefficient of 0.88 (Fig. 7), which suggested the potential of the probe in detecting SO32− in mitochondria. It may be highlighted that unlike several reported probes, the biocompatible probe L exhibited rapid cellular uptake and rendered an extremely fast ratiometric intracellular sensing of SO32−.
Conclusions
In summary, the rationally designed probe L demonstrated specific ratiometric sensing of the SO2 derivative (SO32−), which can be visualized even by the naked eye. L could provide several unique advantages like sensing in completely aqueous medium and extremely fast response time along with very high selectivity and sensitivity. The probe was successfully employed in developing a low cost μPAD sensor device for detecting the trace SO2 derivative (SO32−), which might be useful for preliminary environmental monitoring. In addition, the excellent biocompatibility, cell permeability as well as fast response time of the probe could be leveraged for the ratiometric intracellular imaging of SO32− in live HeLa cells.Conflicts of interest
There are no conflicts to declare.Acknowledgements
We thank the Council of Scientific and Industrial Research (01/2727/13/EMR-II), the Science & Engineering Research Board (SR/S1/OC-62/2011) and the Department of Biotechnology (BT/PR13560/COE/34/44/2015) for research grants and the Central Instruments Facility (CIF), IIT Guwahati for providing analytical facilities. SS, SH, PD and UM thank IIT Guwahati for research fellowships.Notes and references
- Z. Q. Meng, G. H. Qin, B. Zhang and J. L. Bai, Mutagenesis, 2004, 19, 465 CrossRef CAS PubMed.
- X. Shi, J. Inorg. Biochem., 1994, 56, 155 CrossRef CAS PubMed.
- Z. Meng and H. Zhang, Inhalation Toxicol., 2007, 19, 979 CrossRef CAS PubMed.
- S. Du, H. Jin, D. Bu, X. Zhao, B. Geng, C. Tang and J. Du, Acta Pharmacol. Sin., 2008, 29, 923 CrossRef CAS PubMed.
- S. Iwasawa, Y. Kikuchi, Y. Nishiwaki, M. Nakano, T. Michikawa, T. Tsuboi, S. Tanaka, T. Uemura, A. Ishigami, H. Nakashima, T. Takebayashi, M. Adachi, A. Morikawa, K. Maruyama, S. Kudo, I. Uchiyama and K. Omae, J. Occup. Health, 2009, 51, 38 CrossRef CAS PubMed.
- G. Li and N. Sang, Ecotoxicol. Environ. Saf., 2009, 72, 236 CrossRef CAS PubMed.
- J. Li, R. Li and Z. Meng, Eur. J. Pharmacol., 2010, 645, 143 CrossRef CAS PubMed.
- N. Sang, Y. Yun, H. Li, L. Hou, M. Han and G. K. Li, Toxicol. Sci., 2010, 114, 226 CrossRef CAS PubMed.
- M. H. Stipanuk, J. E. Dominy Jr., J. Lee and R. M. Coloso, J. Nutr., 2006, 136, 1652S CAS.
- M. H. Stipanuk, Annu. Rev. Nutr., 2004, 24, 539 CrossRef CAS PubMed.
- H. Kimura, Exp. Physiol., 2011, 96, 833 CrossRef CAS PubMed.
- D. Liu, Y. Huang, D. Bu, A. D. Liu, L. Holmberg, Y. Jia, C. Tang, J. Du and H. Jin, Cell Death Dis., 2014, 5, e1251 CrossRef CAS PubMed.
- S. Samanta, S. Goswami, Md. N. Hoque, A. Ramesh and G. Das, Chem. Commun., 2014, 50, 11833 RSC.
- S. Samanta, T. Ray, F. Haque and G. Das, J. Lumin., 2016, 171, 13–18 CrossRef CAS.
- S. Samanta, S. Goswami, A. Ramesh and G. Das, J. Photochem. Photobiol., A, 2015, 310, 45 CrossRef CAS.
- S. Samanta, S. Goswami, A. Ramesh and G. Das, Sens. Actuators, B, 2014, 194, 120 CrossRef CAS.
- S. Samanta, C. Kar and G. Das, Anal. Chem., 2015, 87, 9002–9008 CrossRef CAS PubMed.
- S. Samanta, U. Manna, T. Ray and G. Das, Dalton Trans., 2015, 44, 18902 RSC.
- S. Samanta, B. K. Datta, M. Boral, A. Nandan and G. Das, Analyst, 2016, 141, 4388 RSC.
- T. Kowada, H. Maeda and K. Kikuchi, Chem. Soc. Rev., 2015, 44, 4953 RSC.
- K. Kikuchi, Chem. Soc. Rev., 2010, 39, 2048 RSC.
- X. Cheng, H. Jia, J. Feng, J. Qin and Z. Li, Sens. Actuators, B, 2013, 184, 274 CrossRef CAS.
- X. Ma, C. Liu, Q. Shan, W. Guo, D. Wei and Y. Du, Sens. Actuators, B, 2013, 188, 1196 CrossRef CAS.
- M. G. Choi, J. Hwang, S. Eor and S. K. Chang, Org. Lett., 2010, 12, 5624 CrossRef CAS PubMed.
- H. Tian, J. Qian, Q. Sun, H. Bai and W. Zhang, Anal. Chim. Acta, 2013, 788, 165 CrossRef CAS PubMed.
- Y. Q. Sun, J. Liu, J. Zhang, T. Yang and W. Guo, Chem. Commun., 2013, 49, 2637 RSC.
- J. Xu, K. Liu, D. Di, S. Shao and Y. Guo, Inorg. Chem. Commun., 2007, 10, 681 CrossRef CAS.
- Y. Sun, C. Zhong, R. Gong, H. Mu and E. Fu, J. Org. Chem., 2009, 74, 7943 CrossRef CAS PubMed.
- L. E. Santos-Figueroa, C. Gimenez, A. Agostini, E. Aznar, M. D. Marcos, F. Sancenon, R. Martinez-Manez and P. Amoros, Angew. Chem., Int. Ed., 2013, 52, 13712 CrossRef CAS PubMed.
- X. Zhu, L. Zhu, H.-W. Liu, X. Hu, R.-Z. Peng, J. Zhang, X.-B. Zhang and W. Tan, Anal. Chim. Acta, 2016, 937, 136 CrossRef CAS PubMed.
- U. Diwan, V. Kumar, R. K. Mishra, N. K. Rana, B. Koch, M. K. Singh and K. K. Upadhyay, Anal. Chim. Acta, 2016, 929, 39 CrossRef CAS PubMed.
- L. Zhu, J. Xu, Z. Sun, B. Fu, C. Qin, L. Zeng and X. Hu, Chem. Commun., 2015, 51, 1154 RSC.
- Y. Liu, K. Li, M. Y. Wu, Y. H. Liu, Y. M. Xie and X. Q. Yu, Chem. Commun., 2015, 51, 10236 RSC.
- X. Yang, Y. Zhou, X. Zhang, S. Yang, Y. Chen, J. Guo, X. Li, Z. Qing and R. Yang, Chem. Commun., 2016, 52, 10289 RSC.
- W. Xu, C. L. Teoh, J. Peng, D. Su, L. Yuan and Y.-T. Chang, Biomaterials, 2015, 56, 1 CrossRef CAS PubMed.
- S. Samanta, P. Dey, A. Ramesh and G. Das, Chem. Commun., 2016, 52, 10381 RSC.
- G. M. Sheldrick, SAINT and XPREP, 5.1, Siemens Industrial Automation Inc., Madison, WI, 1995 Search PubMed.
- G. M. Sheldrick, SADABS, software for Empirical Absorption Correction, University of Gottingen, Institute fur Anorganische Chemie der Universitat, Tammanstrasse 4, D-3400 Gottingen, Germany, 1999–2003 Search PubMed.
- G. M. Sheldrick, SHELXTL Reference Manual: Version 5.1, Bruker AXS, Madison, WI, 1997 Search PubMed.
- G. M. Sheldrick, SHELXL-97: Program for Crystal Structure Refinement, University of Gottingen, Gottingen, Germany, 1997 Search PubMed.
- Mercury 2.3 Supplied with Cambridge Structural Database, CCDC, Cambridge, UK, 2011–2012 Search PubMed.
- K. Yamada, T. G. Henares, K. Suzuki and D. Citterio, Angew. Chem., Int. Ed., 2015, 54, 5294 CrossRef CAS PubMed.
- K. Yamada, S. Takaki, N. Komuro, K. Suzuki and D. Citterio, Analyst, 2014, 139, 1637 RSC.
- S. Bolte and F.P. Cordelieres, J. Microsc., 2006, 224, 213 CrossRef CAS PubMed.
- M. Morton and H. Landfield, J. Am. Chem. Soc., 1952, 74, 3523 CrossRef CAS.
- Y. Suna, S. Fan, S. Zhang, D. Zhao, L. Duan and R. Li, Sens. Actuators, B, 2014, 193, 173 CrossRef.
- X. Lv, J. Liu, Y. Liu, Y. Zhao, Y. Q. Sun, P. Wang and W. Guo, Chem. Commun., 2011, 47, 12843 RSC.
- Z. Yang, Z. Liu, Y. Chen, X. Wang, W. He and Y. Lu, Org. Biomol. Chem., 2012, 10, 5073 CAS.
- Z. Lou, P. Li, P. Song and K. Han, Analyst, 2013, 138, 6291 RSC.
Footnote |
| † Electronic supplementary information (ESI) available: Experimental section and supporting plots and figures. CCDC 1534470. For ESI and crystallographic data in CIF or other electronic format see DOI: 10.1039/c7an01368j |
| This journal is © The Royal Society of Chemistry 2018 |

