 Open Access Article
Creative Commons Attribution 3.0 Unported Licence
Microwave assisted fabrication of a nanostructured reduced graphene oxide (rGO)/Fe2O3 composite as a promising next generation energy storage material†
Mohit
Saraf
a,
Kaushik
Natarajan
a and
Shaikh M.
Mobin
*abc
aDiscipline of Metallurgical Engineering and Materials Science, Indian Institute of Technology Indore, Simrol-453552, India. E-mail: xray@iiti.ac.in; Tel: +91 731 2438 762
bDiscipline of Chemistry, School of Basic Sciences, Indian Institute of Technology Indore, Simrol-453552, India
cCentre for Biosciences and Biomedical Engineering, Indian Institute of Technology Indore, Simrol-453552, India
First published on 23rd December 2016
Abstract
Herein, we report a facile two-step process involving homogenous precipitation followed by microwave assisted reduction to fabricate a rGO–Fe2O3 composite. The applicability of the composite as an electrode material for supercapacitors has been evaluated by a cyclic voltammetry (CV) and galvanostatic charging–discharging (GCD) study. The composite displays excellent supercapacitor performance compared to bare rGO and generates a high specific capacitance of 577.5 F g−1, at a current density of 2 A g−1. A high rate performance is also observed by retaining a specific capacitance of 437.5 F g−1, at a high current density of 10 A g−1. Finally, the electrodes have been analyzed through electrochemical impedance spectroscopy (EIS) to probe the charge transfer characteristics and the results have been found to be consistent with other electrochemical measurements. The remarkable electrochemical performance of the rGO–Fe2O3 composite can be attributed to the positive synergistic effects between rGO platelets and Fe2O3 nanoparticles.
Introduction
Recent times have witnessed an increasing energy demand as a result of global warming, depletion of natural energy resources, the development of a global economy and increasing pollution. Therefore, the focus is on the development of clean and sustainable energy resources based on efficient renewable technologies.1–3 In this respect, the field of energy storage has drawn wide research interest to compensate this demand.3–5 Among the various available energy storage devices, supercapacitors have gained significant attention in recent times due to their high power density, long cycle life, excellent reversibility, and fast charging/discharging rate, which may result in the eventual exit of traditional capacitors and batteries.1,6–12 Specifically, hybrid supercapacitors have emerged as a potential candidate involving two storage mechanisms: electrical double-layer capacitance (EDLC) and pseudocapacitance.13–15 Currently, EDLC capacitors consist of carbon materials such as graphene, carbon nanotubes or activated carbon in which the capacitance arises due to the charge accumulated at the electrolyte/electrode interface.16 Although, they exhibit good cyclic stability, but suffer from poor capacitance. On the other hand, conducting polymers or transition metal oxides are generally used as pseudocapacitor materials which undergoes reversible faradic redox reactions.15 Though, pseudocapacitors display high capacitance but the response time is considerably longer than EDLC capacitors. Therefore, to overcome these issues, a perfect combination of metal oxides and carbon materials is required, which can enhance the energy storage efficiency synergistically.Concerning this point, iron oxide (Fe2O3) has drawn wide attention owing to its fascinating features i.e. higher theoretical specific capacitance (1005 mA h g−1), facile synthetic approach, high corrosion resistance, earth-abundance, environmental friendliness and low processing cost.18–22 However, Fe2O3 alone as nanoparticles suffer from severe issues like low conductivity, high agglomeration and structural degradation during the charge and discharge cycling process which causes rapid loss of capacity caused by volume changes.21 In this respect, highly thermal and electrically conductive graphene or rGO has been considered as the suitable support matrix for metal oxides to absorb the volume changes and to enhance the structural stability of the electrodes.13,23–31 It has been investigated that rGO confines the Fe2O3 nanoparticles and allows in situ transformation between Fe2O3 nanoparticles and Fe atoms, which can maintain the structural integrity.13,19 The rGO–Fe2O3 composites perfectly exhibit the synergistic effects of EDLC and faradaic pseudocapacitance, which significantly improves the electrochemical performance. For example, Lee and co-workers fabricated Fe2O3 nanotubes anchored on rGO with a specific capacitance seven times higher than that of bare Fe2O3.17 Gao and co-workers developed porous Fe2O3 on graphene and achieved a specific capacitance of 343.7 F g−1 at a current density of 3 A g−1.19 Similarly, Wang and co-workers reported hybrid of Fe2O3 mesocrystals/graphene which displayed higher specific capacitance (226 F g−1) than rGO (116 F g−1) when employed as supercapacitor electrode material.32 Although rGO–Fe2O3 composites have been explored for other applications,33–38 very few reports exist on the use of such composites as a supercapacitor electrode material.16–19
Herein, we report a facile synthesis of rGO–Fe2O3 composite involving homogenous precipitation of FeCl3 in graphene oxide (GO)/urea suspension and subsequently hydrazine assisted reduction of GO under microwave irradiation. In general, the hydrothermal method has been used for synthesizing rGO–Fe2O3 composites, but to the best of our knowledge, this is the first example of microwave-driven synthesis of rGO–Fe2O3 composite employed as a supercapacitor electrode material. Moreover, for the first time, a detailed impedimetric evaluation has been correlated with other electrochemical techniques. The results show that the Fe2O3 nanoparticles are uniformly distributed on the rGO matrix, which exhibits excellent capacitive and charge discharge behavior, making it suitable for charge storage devices.
Experimental
Chemicals
All chemicals were purchased from Merck. Throughout the synthesis, deionized water (DI water, 18.2 MΩ cm) was used. Digital ultrasonic cleaner LMUC SERIES (Labman Scientific Instruments) was used throughout the experiment. Microwave reactor (Anton Paar, Monowave 300) was employed for microwave irradiation.Characterization
Powder X-ray diffraction (PXRD) spectra were recorded on a Bruker D2 phaser X-ray diffractometer equipped with Cu-Kα radiations (1.54 Å). Surface morphology was determined using Supra55 Zeiss Field-Emission Scanning Electron Microscope equipped with EDX facility. Transmission electron microscopy (TEM) results were obtained through TECNAI-120 kV system. Thermogravimetric analysis (TGA) was conducted on METTLER TOLEDO (TGA/DSC 1) by using software STARe system.Electrochemical measurements
All electrochemical experiments were conducted at room temperature on computer controlled Autolab PGSTAT 204N using NOVA software (version 1.10). The standard three electrode configuration was used where Ag/AgCl electrode was used as a reference electrode and platinum wire was incorporated as a counter electrode. Electrochemical testing was performed on glassy carbon electrodes (GCE of 3 mm diameter). Cyclic voltammetry (CV) study were performed at room temperature at different scan rates in 1 M Na2SO4. Galvanostatic charging discharging test was performed by chronopotentiometry technique at different current densities. The equations to calculate supercapacitor parameters are given in ESI.†Synthesis of rGO
The rGO was synthesized by employing modified Hummer's method. In a typical synthesis, 4 g graphite powder and 2 g NaNO3 were mixed together and slowly added into concentrated 170 mL H2SO4 on an ice bath. Thereafter, 12 g KMnO4 was drop wise added into the mixture under vigorous stirring keeping its temperature less than 20 °C. After some times, the ice bath was removed and mixture was continuously stirred for next 18 h. As a result, the mixture became viscous and brownish colored appeared. Subsequently, the mixture was diluted with 220 mL DI water by maintaining the temperature below 50 °C. Further, the mixture was treated with 10 mL of 30% H2O2, which induced bubble formation and the mixture color turned into bright yellow indicating the reaction completion. The mixture was further stirred for next 4 h and then it was filtered and carefully washed with 10% HCl, DI water and ethanol to remove any other impurity ions. The as-formed product i.e. graphite oxide was vacuum dried and collected.11,39 Later on, 300 mg graphite oxide was first dispersed in DI water and then sonicated for 1 h to transform it into graphene oxide (GO). The reduction of graphene oxide was carried out by dissolving 3 g NaBH4 in 18 mL DI water, further gradually added into the GO dispersion and then refluxed at 100 °C for 24 h under continuous stirring. Finally, the refluxed product was filtered and thoroughly washed with DI water and ethanol. The washed powder was vacuum dried and referred to as rGO.8,11,39Synthesis of rGO–Fe2O3 composite
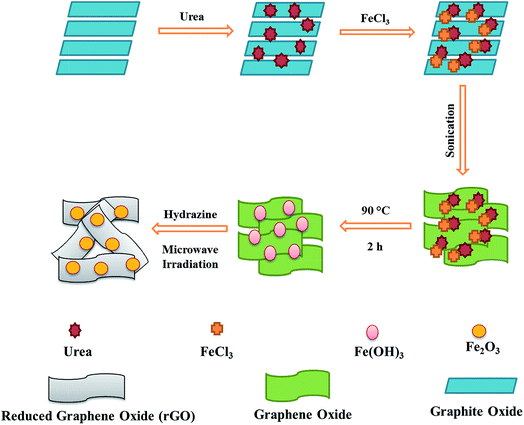
The rGO–Fe2O3 composite was prepared by homogeneous precipitation followed by reduction with hydrazine hydrate under microwave irradiation. In a typical synthesis, FeCl3 (5 mmol; 405 mg) and urea (150 mmol; 4.5 g) were separately dissolved in DI water (25 mL). Further, both solutions were slowly and sequentially added to graphite oxide suspension (25 mL, 2 mg mL−1) under continuous stirring and the as formed mixture was sonicated for 1 h. After sonication, the brown colored mixture was heated at 90 °C for 2 h and then cooled down to room temperature. Further, hydrazine hydrate (0.5 mL) was introduced to the mixture under constant stirring. After 2 h of stirring, the mixture was irradiated for 2 min in a microwave reactor at 150 °C with a power of 300 W, which transformed the mixture color from brown to black and it was filtered and washed properly with DI water to remove any unreacted part and rGO–Fe2O3 composite was obtained by drying at 60 °C for 24 h under vacuum.39Fabrication of modified glassy carbon electrodes
The rGO–Fe2O3 composite was further employed as a modifier for glassy carbon electrode (GCE) under optimized conditions. In this process, first 20 mg of rGO–Fe2O3 composite was dispersed in 8 mL ethanol using ultra-sonication to form a stable suspension and then 10 μL of this suspension was drop cast onto the working area of GCE by micropipette and then dried under infrared lamp irradiation. After drying, the modified GCE (rGO–Fe2O3/GCE) was rinsed over several times with DI water and dried before employing it for electrochemical testing. Similarly other electrode of rGO (rGO/GCE) was also prepared.Results and discussion
The rGO–Fe2O3 composite was in situ prepared by a facile method including homogeneous precipitation followed by hydrazine hydrate assisted reduction under microwave irradiation (Scheme 1). In most of earlier reports, hydrothermal method was used for the composite fabrication which is a time-consuming process and reactions take place at harsh conditions such as high temperature and pressure, whereas in the present work a simple microwave reaction for 2 min was used. Further, the composite was characterized by various techniques and then used as a modifier for the GCE to form modified electrode rGO–Fe2O3/GCE to study its electrochemical activity. The results were compared with separately prepared electrode of rGO (rGO/GCE).Characterization of rGO and rGO–Fe2O3 composite
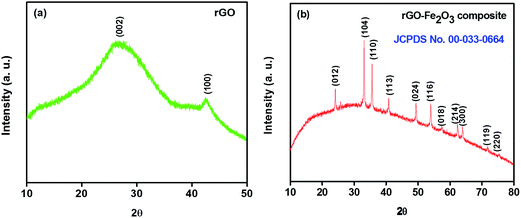
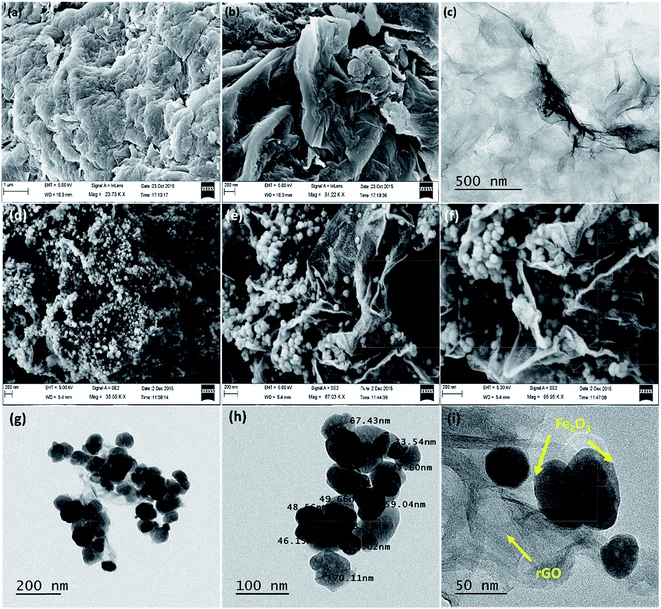
The crystallinity and phase purity analysis of rGO and rGO–Fe2O3 composite were examined by powder X-ray diffractometer (XRD) in the range of 10–80°. Fig. 1a represents the diffraction pattern of bare rGO, where the peaks located at 2θ = ∼25° and ∼43° correspond to (002) and (100) planes confirm the formation of rGO.27 The XRD spectrum of graphene oxide (GO) is shown in Fig. S1,† exhibiting its characteristic peak at ∼10° corresponding to 001 plane, which is shifted to ∼25° in the XRD spectrum of rGO, clearly indicates that GO has been successfully reduced into rGO.9 In the XRD spectrum of rGO–Fe2O3 composite, the diffraction peaks obtained at 2θ = 24.07°, 33.05°, 35.62°, 40.78°, 49.35°, 54.03°, 57.41°, 62.42°, 63.96°, 71.80° and 75.44° correspond to lattice planes of (012), (104), (110), (113), (024), (116), (018), (214), (300), (119) and (220), respectively with the lattice parameters a = b = 5.0356 Å, c = 13.7489 Å, α = β = 90° and γ = 120°. The indexed peaks represent as trigonal phase of hematite (JCPDS no. 00-033-0664), which are consistent with previous reports (Fig. 1b).13,32 The average crystallite size is calculated to be 15.1 nm using Debye–Scherrer's equation. Additionally, no peak emerges at around 2θ = 25° in the XRD spectrum of composite, which suggests that the rGO platelets have been homogenously dispersed on the surface of the Fe2O3 nanoparticles. Furthermore, no diffraction peak corresponding to any impurity ions is detected, confirming the high phase purity of material. To further confirm the phase purity of rGO–Fe2O3 composite, EDX analysis was carried out. The EDX result shows the phase purity of rGO–Fe2O3 composite with desired elemental composition as C, O, Fe with no obvious impurities (Fig. S2†), which is consistent with the XRD result.Fig. 2a and b shows the FESEM images of rGO displaying wavy and corrugated appearance forming platelets. This wavy morphology prevents restacking among these platelets and the presence of wrinkles greatly improves the electrochemical performance by enhancing ion transportation on electrode surface by shortening the ion diffusion path.40–42 TEM image (Fig. 2c) further reveals the presence of thin rGO platelets and confirms the wavy wrinkled structures. Fig. 2d–f presents the surface morphology of in situ generated rGO–Fe2O3 composite as an interconnected 3D network structure, which witnesses healthy alliance between the Fe2O3 nanoparticles and rGO nanoplatelets leading to high stability. The average size of these Fe2O3 nanoparticles is determined to be ∼46 nm. These Fe2O3 nanoparticles are seen to be uniformly anchored on the rGO platelets and some nanoparticles are observed to be properly bound to the surface of the rGO platelets (Fig. 2e). Moreover, a considerable portion of the Fe2O3 nanoparticles is encapsulated within the rGO platelets, which possibly prevents the aggregation of nanoparticles (Fig. 2f). These engagements of Fe2O3 nanoparticles within the rGO platelets enhances their interfacial contact and prevents the agglomeration of Fe2O3 nanoparticles, which in turn results in high electrochemical performance and better structural integrity for supercapacitor electrode material.22 TEM images further confirm the proper distribution of Fe2O3 nanoparticles on rGO matrix and disclose the size range between 30–80 nm with an average particle size of 51 ± 25 nm (Fig. 2g–i).
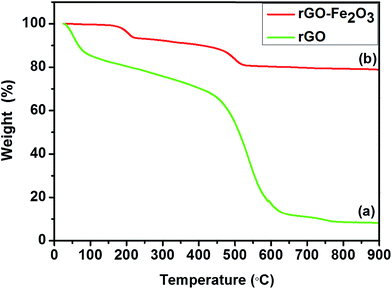
Thermal stability of rGO and rGO–Fe2O3 composite was compared by thermogravimetric analysis (TGA) at a scan rate of 5 °C min−1 under N2 atmosphere up to 900 °C (Fig. 3). As can be seen, rGO initially loses ∼18% of its weight up to 100 °C due to physically absorbed water molecules (Fig. 3a). However, for the rGO–Fe2O3 composite, ∼7% weight loss is observed up to 220 °C, which can be attributed to the loss of physically absorbed water molecules and removal of remaining oxygen groups present on the surface of GO (Fig. 3b). Further, significant weight loss (∼19%) is observed in rGO–Fe2O3 composite between 220–530 °C, which can be associated with the gasification of carbonaceous material due to the oxidation of rGO. Above 530 °C, no significant weight loss occurs and almost constant weight is observed up to 900 °C, whereas more than 90% of the rGO content completely decompose up to 900 °C. Based on the comparison of TGA profile of both rGO and rGO–Fe2O3 composite, the weight percentage of Fe2O3 nanoparticles in the composite is estimated to be 79.32%. From these results, it can be concluded that an alliance between Fe2O3 nanoparticles and rGO platelets leads to positive synergism with a high temperature stability to the as prepared rGO–Fe2O3 composite, as compared to bare rGO.43
Electrochemical properties of rGO and rGO–Fe2O3 composite
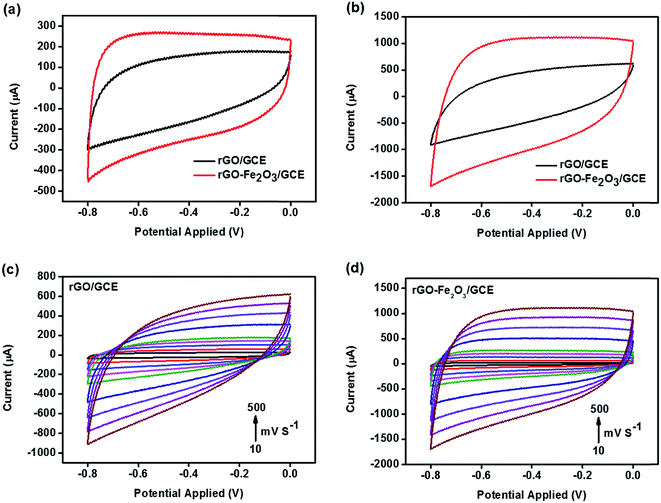
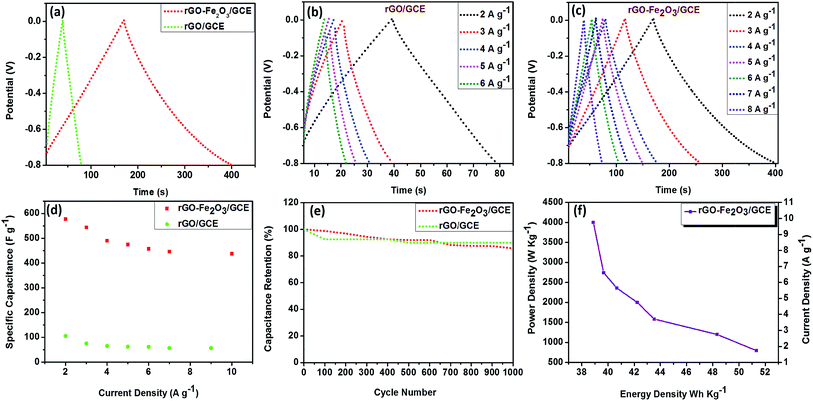
The electrochemical properties of in situ generated rGO–Fe2O3 composite were firstly investigated by cyclic voltammetry (CV) measurements in 1 M Na2SO4 solution in the potential window (−0.8 to 0 V) at different scan rates. The comparison of CV profiles of rGO and rGO–Fe2O3 composite at a scan rate of 100 and 500 mV s−1 is shown in Fig. 4a and b. As expected, rGO–Fe2O3/GCE demonstrates excellent charge propagation and enhanced integrated area compared to rGO/GCE, due to synergistic contribution of rGO nanoplatelets and Fe2O3 nanoparticles. Moreover, no obvious redox peaks were observed exhibiting nearly rectangular shaped profile confirms good supercapacitive properties. The overall charge storage capacity and charge propagation time of rGO–Fe2O3 composite have been considerably improved by the sum of pseudocapacitance of Fe2O3 and the EDLC of rGO. The presence of wrinkles on wavy rGO prevents restacking among the platelets and enhances the ion transportation on electrode surface by shortening the ion diffusion path,40–42 resulting in enhanced electrochemical output. The CVs of both electrodes at different scan rates (10–500 mV s−1) are shown in Fig. 4c and d and it is observed that the area under the CV curves increases with the increasing scan rate in both cases. As expected, CV of rGO/GCE exhibits good charge propagation at the electrode surface following EDLC mechanism. On the other hand, CVs of rGO–Fe2O3/GCE show excellent charge propagation and exhibit quasi-rectangular profile at low scan rates, but interestingly at higher scan rates, it tries to achieve nearly rectangular shape due to faster diffusion of electrolyte ions resulting in enhanced charge storage capacity.8,23 This observation concludes that at higher scan rates EDLC mechanism predominates. It is also observed that even at a highest scan rate of 500 mV s−1, the rGO–Fe2O3/GCE still maintains a good rectangular shape without any distortion suggesting high rate ability, small equivalent resistance and supreme electrochemical reversibility.8To discuss more about the potential of in situ fabricated rGO–Fe2O3 composite as supercapacitor electrode material, galvanostatic charge–discharge (GCD) measurements are performed with 1 M Na2SO4 solution between potential windows (0 to −0.8 V) at different current densities. The comparison of charge–discharge profiles of rGO/GCE and rGO–Fe2O3/GCE at a current density of 2 A g−1 is shown in Fig. 5a. During the charge–discharge process, the charging curve of rGO–Fe2O3/GCE is nearly as symmetrical to its corresponding discharging counterpart as the rGO/GCE electrode, which is representative of excellent capacitive behavior. Additionally, no considerable potential drop occurs, suggesting the lack of any significant internal resistance in rGO–Fe2O3/GCE. Moreover, the charging–discharging time of rGO–Fe2O3/GCE has remarkably enhanced due to positive synergism between Fe2O3 nanoparticles and rGO platelets than the rGO/GCE, this results in higher charge storage efficiency due to involvement of more electrolyte ions. The GCD profiles of rGO/GCE and rGO–Fe2O3/GCE at different current densities display charge–discharge lines with almost constant slopes in the whole range of the potential as shown in Fig. 5b and c, further signifying the nearly ideal capacitive type behavior. The comparison with previous reports clearly depicts that the microwave assisted synthesis of rGO–Fe2O3 composite presented in this paper provides highest symmetrical charge–discharge curves.13,16–21,32 The specific capacitance for rGO/GCE and rGO–Fe2O3/GCE at a current density of 2 A g−1 is calculated to be 105 F g−1 and 577.5 F g−1 respectively, which is much higher than some of the earlier reports based on rGO/Fe2O3 composition.17–21,32 The rate performance of rGO/GCE and rGO–Fe2O3/GCE is also analyzed by plotting specific capacitance against current density. The specific capacitance kept on decreasing with increasing current density due to incomplete utilization of active ionic species at high current densities (Fig. 5d). However, rGO–Fe2O3/GCE exhibits high rate ability by retaining 75.75% (437.5 F g−1) of its initial capacitance even at a high current density of 10 A g−1, suggesting rGO–Fe2O3 composite a promising electrode material for charge storage devices. The electrochemical stability of rGO/GCE and rGO–Fe2O3/GCE is also examined by repeating 1000 charge discharge cycles at a current density of 2 A g−1 (Fig. 5e). The capacitance retention of rGO–Fe2O3/GCE is nearly as high (85.71%) as rGO, suggesting the high long-term cyclic stability of the rGO–Fe2O3/GCE. The maximum energy and power densities for rGO–Fe2O3/GCE are determined to be 51.33 W h kg−1 and 796.55 W kg−1 respectively at a current density of 2 A g−1. A Ragone plot of rGO–Fe2O3/GCE is presented in Fig. 5f, which demonstrates its remarkable rate performance and shows that energy density decreases and power density increases on increasing current density from 2–10 A g−1. The separate plots of energy and power density versus current density rGO–Fe2O3/GCE are presented in Fig. S3.†
A comparative statement of presently fabricated supercapacitor electrode material (rGO–Fe2O3) with previously reported similar electrode materials is shown in Table 1, which clearly shows that microwave assisted fabrication of rGO–Fe2O3 composite has an edge over existing composites as a supercapacitor electrode material.
| Material | Fabrication method | Electrode used | Electrolyte medium | Specific capacitance (F g−1) | Current density (A g−1) | Reference |
|---|---|---|---|---|---|---|
| Fe2O3/N2 doped graphene | Hydrothermal | GCE (5 mm diameter) | 1 M KOH | 618 | 0.5 | 13 |
| Fe2O3 nanotubes-rGO | Hydrothermal | Copper foil | 1 M Na2SO4 | 181 | 3 | 17 |
| α-Fe2O3 mesocrystals/graphene | Hydrothermal | Nickel foam | 1 M Na2SO4 | 306.9 | 3 | 18 |
| α-Fe2O3 with graphene | Hydrothermal | Nickel foam | 1 M Na2SO4 | 343.7 | 3 | 19 |
| N2-doped rGO/Fe2O3 hybrid | Hydrothermal | Nickel foam | 1 M KOH | 268.4 | 2 | 20 |
| Fe2O3–graphene | Hydrothermal | Nickel grid | 2 M KOH | 151.8 | 1 | 21 |
| Fe2O3–graphene | Hydrothermal | Ni foam | 1 M Na2SO4 | 226 | 1 | 32 |
| rGO–Fe 2 O 3 hybrid | Microwave | GCE (3 mm diameter) | 1 M Na 2 SO 4 | 577.5 | 2 | Present work |
EIS analysis
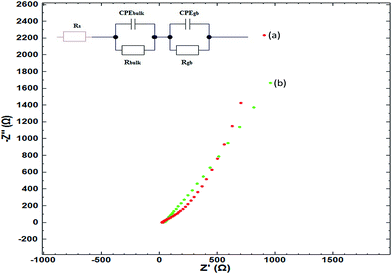
The charge transfer kinetics and capacitive components of prepared materials were further probed by electrochemical impedance spectroscopy (EIS). In EIS, the data is generally expressed by Nyquist plots.44 In the present work, the EIS study was performed by applying an AC signal in the frequency range of 1 Hz to 60 kHz under open circuit potential conditions. The obtained EIS data can be idealized and fitted based on an ideal circuit model with discrete components.45–49 The measurements of impedance provide information on real and imaginary parts of complex impedance in an electrochemical system. Fig. 6 shows the Nyquist plot of rGO/GCE as well as rGO–Fe2O3/GCE.As the semicircles obtained via EIS appear depressed having a center below the real axis, a constant phase element (CPE) is introduced instead of capacitance. The impedance is represented by the below equation:
If a simple equivalent circuit (a series array of parallel RC elements) is applied wherein each RC combination represents contributions due to different components (such as double layer, charge transfer, etc.), then the total complex impedance is represented as the sum of these components as follows:
| ZCPE = A−1(jω)−n |
| CCPE = (AR−(n−1))1/n |
| Parameter | rGO/GCE | rGO–Fe2O3/GCE |
|---|---|---|
| R s (Ω) | 18.6 | 20.63 |
| R bulk (Ω) | 28.27 | 432.5 |
| CPEbulk (F) | 0.511 × 10⁻³ | 0.7317 × 10⁻³ |
| C bulk (F) | 2.274 × 10⁻⁶ | 0.1971 × 10⁻³ |
| n 2 | 0.439 | 0.467 |
| R gb (Ω) | 426![[thin space (1/6-em)]](https://www.rsc.org/images/entities/char_2009.gif) 291 291 |
44![[thin space (1/6-em)]](https://www.rsc.org/images/entities/char_2009.gif) 939 939 |
| CPEgb (F) | 0.7146 × 10⁻³ | 0.6498 × 10⁻³ |
| C gb (F) | 0.01343 | 0.01139 |
| n 3 | 0.632 | 0.8574 |
The values of n are in the range of 0.4 to 0.8, which indicates phase inhomogeneity in the electrode, which is expected given that the electrode consists of at least two phases (including GCE material). However, it should be noted that the average value of n is higher for rGO–Fe2O3/GCE, indicating that the material is more homogenous compared to the purely rGO/GCE. It should also be noted that the value of Rgb (which is the interfacial resistance or grain-boundary resistance) decreases notably for the rGO–Fe2O3/GCE, which is an indicator of good crystallinity of the composite electrode in comparison with purely rGO/GCE. This is consistent with increased currents obtained with rGO–Fe2O3/GCE in CV scan, and indicates greater electronic mobility and conductivity for the rGO–Fe2O3/GCE. It also agrees with the results of the XRD described previously. To the best of our knowledge, there are no similar studies on the materials described here in the context of a supercapacitor application.
Conclusions
In summary, we have described a simple two-step microwave assisted in situ strategy to fabricate rGO–Fe2O3 composite. The positive synergism between rGO and Fe2O3 nanoparticles leads to the formation of mechanically robust, electrically conductive and thermally stable composite. Further, the composite was applied as a working electrode material to demonstrate its potential candidature to be a promising electrode material for high performance hybrid supercapacitors. The rGO–Fe2O3 composite based electrode displays a very high specific capacitance of 577.5 F g−1 at a current density of 2 A g−1. It also demonstrates high rate performance by retaining 75.75% (437.5 F g−1) of its initial capacitance even at a very high current density of 10 A g−1. In addition, these results are supported by the EIS analysis, which suggests high phase homogeneity, high capacitance and improved charge-transfer characteristics. Based on the results, it can be concluded that the microwave-supported synthesis of rGO–Fe2O3 composites could provide effective enhancements in desirable properties for high performance supercapacitor electrode materials.Acknowledgements
S. M. M. acknowledges CSIR, New Delhi and IIT Indore for funding and Sophisticated Instrumentation Centre (SIC), IIT Indore for the characterization facilities. Authors gratefully acknowledge Advance Imaging Center, IIT Kanpur for providing TEM facility. M. S. thanks MHRD, New Delhi, India for providing fellowship.References
- A. Burke, J. Power Sources, 2000, 91, 37–50 CrossRef CAS.
- L. L. Zhang and X. S. Zhao, Chem. Soc. Rev., 2009, 38, 2520–2531 RSC.
- H. Niu, D. Zhou, X. Yang, X. Li, Q. Wang and F. Qu, J. Mater. Chem. A, 2015, 3, 18413–18421 RSC.
- S. Feng, W. Li, J. Wang, Y. Song, A. A. Elzatahry, Y. Xia and D. Zhao, Nanoscale, 2014, 6, 14657–14661 RSC.
- J. R. Miller and P. Simon, Science, 2008, 321, 651–652 CrossRef CAS.
- M. Winter and R. J. Brodd, Chem. Rev., 2004, 104, 4245–4269 CrossRef CAS.
- P. Simon and Y. Gogotsi, Nat. Mater., 2008, 7, 845–854 CrossRef CAS.
- M. Saraf, R. Rajak and S. M. Mobin, J. Mater. Chem. A, 2016, 4, 16432–16445 RSC.
- S. Q. Chen and Y. Wang, J. Mater. Chem., 2010, 20, 9735–9739 RSC.
- K. Xu, X. Zhu, P. She, Y. Shang, H. Sun and Z. Liu, Inorg. Chem. Front., 2016, 3, 1043–1047 RSC.
- M. Saraf, R. A. Dar, K. Natarajan, A. K. Srivastava and S. M. Mobin, ChemistrySelect, 2016, 1, 2826–2833 CrossRef CAS.
- S. Chen, M. Xue, Y. Li, Y. Pan, L. Zhu, D. Zhang, Q. Fang and S. Qiu, Inorg. Chem. Front., 2015, 2, 177–183 RSC.
- Z. Ma, X. Huang, S. Dou, J. Wu and S. Wang, J. Phys. Chem. C, 2014, 118, 17231–17239 CrossRef CAS.
- L. L. Zhang, R. Zhou and X. Zhao, J. Mater. Chem., 2010, 20, 5983–5992 RSC.
- G. Wang, L. Zhang and J. Zhang, J. Chem. Soc. Rev., 2012, 41, 797–828 RSC.
- Y. Gao, D. Wu, T. Wang, D. Jia, W. Xia, Y. Lv, Y. Cao, Y. Tan and P. Liu, Electrochim. Acta, 2016, 191, 275–283 CrossRef CAS.
- K. K. Lee, S. Deng, H. M. Fan, S. Mhaisalkar, H. R. Tan, E. S. Tok, K. P. Loh, W. S. Chin and C. H. Sow, Nanoscale, 2012, 4, 2958–2961 RSC.
- S. Yang, X. Song, P. Zhang, J. Sun and L. Gao, Small, 2014, 10, 2270–2279 CrossRef CAS.
- S. Yang, X. Song, P. Zhang and L. Gao, ACS Appl. Mater. Interfaces, 2015, 7, 75–79 CrossRef CAS.
- H. D. Liu, J. L. Zhang, D. D. Xu, L. H. Huang, S. Z. Tan and W. J. Mai, J. Solid State Electrochem., 2015, 19, 135–144 CrossRef CAS.
- D. Wang, Y. Li, Q. Wang and T. Wang, J. Solid State Electrochem., 2012, 16, 2095–2102 CrossRef CAS.
- L. Xiao, D. Wu, S. Han, Y. Huang, S. Li, M. He, F. Zhang and X. Feng, ACS Appl. Mater. Interfaces, 2013, 5, 3764–3769 CrossRef CAS.
- R. A. Dar, G. A. Naikoo, P. K. Kalambate, L. Giri, F. Khan, S. P. Karna and A. K. Srivastava, Electrochim. Acta, 2015, 163, 196–203 CrossRef CAS.
- X. Xia, J. Tu, Y. Mai, R. Chen, X. Wang, C. Gu and X. Zhao, Chem.–Eur. J., 2011, 17, 10898–10905 CrossRef CAS.
- K. S. Lee, S. Park, W. Lee and Y. S. Yoon, ACS Appl. Mater. Interfaces, 2016, 8, 2027–2034 CrossRef CAS.
- I. V. Lightcap, T. H. Kosel and P. V. Kamat, Nano Lett., 2010, 10, 577–583 CrossRef CAS.
- R. N. Muthu, S. Rajashabala and R. Kannan, RSC Adv., 2016, 6, 79072–79084 RSC.
- S. Wu, W. Chen and L. Yan, J. Mater. Chem. A, 2014, 2, 2765–2772 RSC.
- Z. Li, J. Wang, S. Liu, X. Liu and S. Yang, J. Power Sources, 2011, 196, 8160–8165 CrossRef CAS.
- H. Wang, H. S. Casalongue, Y. Liang and H. Dai, J. Am. Chem. Soc., 2010, 132, 7472–7477 CrossRef CAS.
- B. P. Bastakoti, H. Oveisi, C.-C. Hu, K. C. W. Wu, N. Suzuki, K. Takai, Y. Kamachi, M. Imura and Y. Yamauchi, Eur. J. Inorg. Chem., 2013, 1109–1112 CrossRef CAS.
- Z. Wang, C. Ma, H. Wang, Z. Liu and Z. Hao, J. Alloys Compd., 2013, 552, 486–491 CrossRef CAS.
- Y. Wu, C. Hu, M. Huang, N. Song and W. Hu, Ionics, 2015, 21, 1427–1434 CrossRef CAS.
- L. Wang, Q. Chen, Y. Zhu and Y. Qian, Chin. Sci. Bull., 2014, 59, 4271–4273 CrossRef CAS.
- Y.-l. Dong, X.-f. Zhang, X.-l. Cheng, Y.-m. Xu, S. Gao, H. Zhao and L.-h. Huo, RSC Adv., 2014, 4, 57493–57500 RSC.
- T. Wang, Y. Li, L. Wang, C. Liu, S. Geng, X. Jia, F. Yang, L. Zhang, L. Liu, B. You, X. Ren and H. Yang, RSC Adv., 2015, 5, 60114–60120 RSC.
- G. K. Pradhan, D. K. Padhi and K. M. Parida, ACS Appl. Mater. Interfaces, 2013, 5, 9101–9110 CrossRef CAS.
- S. Zhu, M. Chen, W. Ren, J. Yang, S. Qu, Z. Li and G. Diao, New J. Chem., 2015, 39, 7923–7931 RSC.
- X. Zhu, Y. Zhu, S. Murali, M. D. Stoller and R. S. Ruoff, ACS Nano, 2011, 5, 3333–3338 CrossRef CAS.
- C. Liu, Z. Yu, D. Neff, A. Zhamu and B. Z. Jang, Nano Lett., 2010, 10, 4863–4868 CrossRef CAS.
- Y. Bai, R. B. Rakhi, W. Chen and H. N. Alshareef, J. Power Sources, 2013, 233, 313–319 CrossRef CAS.
- J. Yan, J. Liu, Z. Fan, T. Wei and L. Zhang, Carbon, 2012, 50, 2179–2188 CrossRef CAS.
- X. Wang, J. Mujtaba, F. Fang, M. Ahmad, H. Arandiyan, H. Yang, G. Sune and H. Sun, RSC Adv., 2015, 5, 91574–91580 RSC.
- A. Deep, M. Saraf, Neha, S. K. Bharadwaj and A. L. Sharma, Electrochim. Acta, 2014, 146, 301–306 CrossRef CAS.
- H. Zhang, X. Wang, C. Chen, C. An, Y. Xu, Y. Dong, Q. Zhang, Y. Wang, L. Jiao and H. Yuan, Inorg. Chem. Front., 2016, 3, 1048–1057 RSC.
- M. Saraf, K. Natarajan and S. M. Mobin, Dalton Trans., 2016, 45, 5833–5840 RSC.
- E. J. Abram, D. C. Sinclair and A. R. West, J. Electroceram., 2003, 10, 165–177 CrossRef CAS.
- J. T. S. Irvine, D. C. Sinclair and A. R. West, Adv. Mater., 1990, 2, 132–138 CrossRef.
- A. R. West, D. C. Sinclair and N. Hirose, J. Electroceram., 1997, 1, 65–71 CrossRef CAS.
- T. Lopes, L. Andrade, H. A. Ribeiro and A. Mendes, Int. J. Hydrogen Energy, 2010, 35, 11601–11608 CrossRef CAS.
- M. V. Nikolic, M. P. Slankamenac, N. Nikolic, D. L. Sekulic, O. S. Aleksic, M. Mitric, T. Ivetic, V. B. Pavlovic and P. M. Nikolic, Sci. Sintering, 2012, 44, 307–321 CrossRef CAS.
Footnote |
| † Electronic supplementary information (ESI) available. See DOI: 10.1039/c6ra24766k |
| This journal is © The Royal Society of Chemistry 2017 |

