 Open Access Article
Creative Commons Attribution 3.0 Unported Licence
Controlling the ion release from mixed alkali bioactive glasses by varying modifier ionic radii and molar volume
Raika
Brückner
a,
Maxi
Tylkowski
a,
Leena
Hupa
b and
Delia S.
Brauer
*a
aOtto Schott Institute of Materials Research, Friedrich Schiller University Jena, Fraunhoferstr. 6, 07743 Jena, Germany. E-mail: delia.brauer@uni-jena.de; Fax: +49 3641-948502; Tel: +49 3641-948510
bJohan Gadolin Process Chemistry Centre, Åbo Akademi University, Piispankatu 8, FI-20500 Turku, Finland
First published on 11th March 2016
Abstract
Partially substituting one alkali oxide for another reduces the crystallisation tendency and improves the processing of bioactive glasses. Here, we investigate how we can use alkali ions of varying ionic radii to control glass degradation and ion release from Bioglass 45S5. Partially replacing sodium by lithium reduced ion release in static and dynamic dissolution studies in Tris buffer, while ion release increased with increasing potassium for sodium substitution. While the mixed alkali effect is known to reduce ion release from conventional silicate glasses (compared to compositions containing one alkali oxide only), in the glasses studied here ion release was controlled by the packing of the silicate network, described by glass molar volume and oxygen density. Incorporating an alkali ion of smaller ionic radius (Li for Na or Na for K) resulted in a more compact network of higher oxygen density, which reduced ion release. On the other hand, an alkali ion of larger ionic radius (K for Na or Na for Li) expanded the silicate network, allowing for faster ion release. This can be explained by water molecules penetrating an expanded silicate network more easily than a more compact one, thereby directly influencing the ion exchange between modifier ions and protons from the dissolution medium. This shows that the use of modifier ions of varying ionic radii allows for tailoring bioactive glass ion release and degradation while maintaining silicate network polymerisation and network connectivity. And, indeed, recent literature suggests that this concept can be extended to other modifiers besides alkali metal ions, making it possible to design bioactive glasses of tailored solubility.
1 Introduction
The first bioactive glass, Bioglass® 45S5, developed by Larry Hench1 in 1969, has been in clinical use since the mid-1980s.2 The reason for its clinical success is its ability to release ions, form a surface layer of hydroxycarbonate apatite, which allows for the formation of an intimate bond to the bone, and ultimately degrade in the body.1 Owing to their amorphous structure, glasses are not as dependent on a specific stoichiometry as crystals are, and they allow a larger flexibility in composition. This makes it possible to incorporate varying concentrations of ions showing physiological activity and therapeutic properties into bioactive glasses.3 When the glasses degrade, they continuously release these ions, making bioactive glasses of interest as controlled release devices.4 As glass degradation, ion release and apatite formation are the key properties of bioactive glasses, various studies aimed at elucidating the mechanisms behind them. Static dissolution experiments in various dissolution media (including Tris buffer,5 simulated body fluid6 or cell culture medium7) combined with vibrational6 or solid-state nuclear magnetic resonance spectroscopy8 and X-ray diffraction (XRD) on the treated glass powders gave insight into the relationship between glass structure and ion release and apatite formation. Recent dynamic, i.e. continuous, dissolution experiments helped to further our understanding of the ion release kinetics9 while molecular dynamics simulations gave insight into the mechanism at an atomic scale.10,11The aim of these efforts was to tailor bioactive glass properties by controlling ion release as well as in vitro and in vivo compatibility. The challenge here is that in order to achieve optimum degradation and bioactivity, one needs to stay within a relatively narrow compositional range with regard to silica content, silicate network polymerisation and network connectivity.12 This means that in order to design new bioactive glass compositions with properties tailored to meet clinical requirements, we need to deepen our understanding of how these properties depend on the type of modifier cations present in the glass. Besides the physiological impact of these ions, their properties such as ionic radius, charge and field strength and, subsequently, their influence on the glass structure need to be characterised in detail.
Here, we focus on bioactive glass 45S51 and investigate the influence of three typical modifier ions having the same charge but varying in their ionic radius and, thus, in their field strength: the alkali metal cations lithium (ionic radius of Li+ 76 pm),13 sodium (Na+ 102 pm) and potassium (K+ 138 pm). Varying the type (but not the concentration) of modifier ions can be expected to maintain the silicate network connectivity constant.14 But previous studies have shown that by replacing sodium ions with potassium, a modifier of larger ionic radius, or lithium, a modifier of smaller ionic radius, the packing (or compactness) of the silicate network can be changed dramatically.15 Our hypothesis was that this would directly influence the ion release behaviour (with a more densely packed glass resulting in reduced or slower ion release and vice versa), and subsequently apatite formation. However, the mixed alkali effect (MAE) has also been shown to influence the ion release behaviour of silicate glasses, with mixed alkali compositions showing reduced ion release compared to glasses containing one alkali oxide only.16 We therefore combine static and dynamic dissolution experiments, followed by infrared spectroscopy and XRD on the glass powders, to investigate which factor (alkali ionic radius/network packing or MAE) would be the dominating one in controlling ion release, dissolution and apatite formation.
2 Materials and methods
2.1 Glass synthesis
Glasses in the system SiO2–P2O5–CaO–Na2O–Li2O/K2O were prepared using a melt-quench route.15 Na2O was replaced by Li2O or K2O in increasing amounts (0 to 100% on a molar basis; Table 1). Glasses were prepared in 150 g batches by a melt-quench route as described earlier.15 Briefly, mixtures of SiO2, Ca(H2PO4)2 × H2O, CaCO3, Na2CO3, Li2CO3 and K2CO3 were sintered together in an electric furnace using a platinum crucible at 1250 °C for one hour and then melted for 1 hour at 1350 °C. After melting, the glasses were rapidly quenched in water to prevent crystallisation. After drying, the frit was crushed in a steel mortar and sieved using analytical sieves.| Glass | SiO2 | P2O5 | CaO | Na2O | Li2O | K2O |
|---|---|---|---|---|---|---|
| Li100 | 46.1 | 2.6 | 26.9 | — | 24.4 | — |
| Li75 | 46.1 | 2.6 | 26.9 | 6.1 | 18.3 | — |
| Li50 | 46.1 | 2.6 | 26.9 | 12.2 | 12.2 | — |
| Li25 | 46.1 | 2.6 | 26.9 | 18.3 | 6.1 | — |
| 45S5 (Li0/K0) | 46.1 | 2.6 | 26.9 | 24.4 | — | — |
| K25 | 46.1 | 2.6 | 26.9 | 18.3 | — | 6.1 |
| K50 | 46.1 | 2.6 | 26.9 | 12.2 | — | 12.2 |
| K75 | 46.1 | 2.6 | 26.9 | 6.1 | — | 18.3 |
| K100 | 46.1 | 2.6 | 26.9 | — | — | 24.4 |
Glass monoliths were prepared by re-melting the glass frit at 1350 °C, pouring the melt into a brass mould, placing the resulting glass block in a pre-heated oven set to 30 K below Tg and then allowing it to cool to room temperature in the switched off furnace overnight. The composition of selected glasses was analysed on polished monoliths using energy-dispersive X-ray spectroscopy (EDX; Jeol JSM-7001F scanning electron microscope equipped with an EDAX Trident analysing system).
2.2 Static dissolution experiments
0.062 mol L−1 tris(hydroxymethyl)amino methane (Tris) solution was prepared by dissolving 14.9 g of Tris in 800 mL of deionised water and adding 44.2 mL of 1 mol L−1 HCl solution. The solution was heated to 37 °C, the pH adjusted to 7.40 using 1 mol L−1 HCl solution and the volume made to 1000 mL. 75 mg glass (sieved to <38 μm) was immersed in 50 mL Tris solution for 6, 15, 24 and 72 hours at 37 °C. Before and after each time period, pH was measured (pH meter HI 8314 with pH electrode HI 1217 D, HANNA Instruments, Kehl am Rhein, Germany), and the samples were filtered through a medium porosity filter paper (5 μm particle retention, VWR International) and acidified using nitric acid (69%). Elemental concentrations were analysed using inductively coupled plasma optical emission spectroscopy (ICP-OES, Varian Liberty 150, Agilent Technologies, Böblingen, Germany). Experiments were performed in triplicate, and the results are presented as a percentage of the ions originally present in the glass (mean ± standard deviation, SD).2.3 Powder analysis
Retained powders after treatment in Tris buffer were rinsed with acetone and dried. Treated and untreated glass powders were characterised by Fourier transform infrared spectroscopy (FTIR; Nicolet Avatar 370 DTGS, Thermo Electron Corporation, Waltham, Massachusetts, USA) and powder X-ray diffraction (XRD; D5000, Siemens; CuKα, data collected at room temperature). XRD results were compared to reference patterns including those of calcium carbonate (JCPDS 00-005-0586) and hydroxycarbonate apatite (JCPDS 00-019-0272).2.4 Dynamic dissolution experiments
Dissolution profiles for the glasses were measured using a dynamic flow cell connected to an inductively coupled plasma optical emission spectrometer (Optima 5300 DV, Perkin Elmer) as described previously.17The ion concentrations were measured on-line every 12 s (one replicate per measurement). The experimental set-up is described in detail elsewhere.9,18 The sample cell was filled with glass particles (270 ± 5 mg; particle size range 300 to 500 μm), and random packing was assumed. A peristaltic pump fed the medium vertically upwards through the bed of glass particles. The flow rate was adjusted to 0.2 mL min−1 to achieve a laminar flow;9 temperature was maintained at 37 ± 2 °C.
2.5 Scanning electron microscopy
For scanning electron microscopy analysis (SEM; field-emitting SEM Jeol JSM 7001F) glass monoliths were cut into 0.5 × 0.5 × 1 cm3 pieces. These pieces were cut using a diamond saw, fractured, immediately transferred onto an SEM sample holder, attached to it with conductive silver and placed in the SEM sample chamber. Specimens were not coated with any conductive layer. A maximum voltage of 2 kV was used for imaging to avoid charges on the uncoated samples. The samples were afterwards kept in ambient atmosphere for 2 and 7 days, and SEM analysis was repeated as described above.3 Results
3.1 Glasses
All glasses were amorphous according to powder X-ray diffraction results as shown previously.15 Analysed glass compositions (Table 2) agreed well with the nominal ones, indicating that no significant loss had occurred e.g. owing to vaporisation.| Glass | SiO2 | P2O5 | CaO | Na2O | K2O |
|---|---|---|---|---|---|
| 45S5 | 45.9 ± 1.8 | 2.4 ± 0.2 | 27.9 ± 1.2 | 24.3 ± 1.5 | — |
| K50 | 46.9 ± 1.8 | 2.6 ± 0.2 | 27.0 ± 1.0 | 11.0 ± 0.6 | 12.44 ± 0.5 |
| K100 | 46.0 ± 1.7 | 2.7 ± 0.2 | 26.8 ± 1.0 | — | 24.6 ± 0.9 |
3.2 Static dissolution experiments
All glasses caused the typical pH increase in Tris buffer at early time points. At six hours, the pH increase was more pronounced with increasing K for Na substitution, while Li for Na substitution did not seem to have a pronounced influence on the pH (Fig. 1a). At 24 hours, no pronounced differences in pH were observed with substitution (not shown).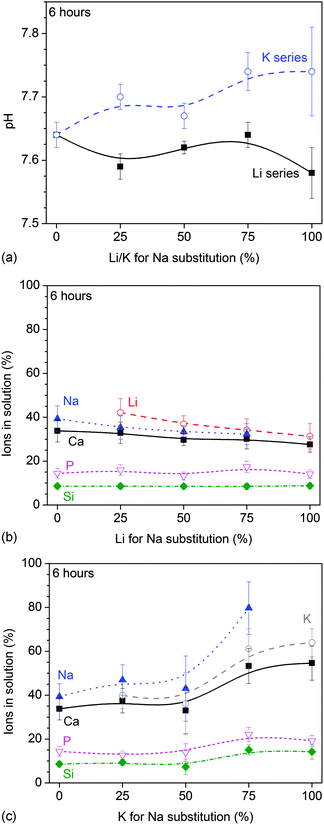 | ||
| Fig. 1 Static dissolution experiments: (a) pH and (b and c) relative ionic concentrations vs. (b) Li and (c) K for Na substitution at 6 hours of immersion in Tris buffer. | ||
Relative ions in solution (shown as a percentage of the ions present in the untreated glass) at 6 hours of immersion decreased with Li (Fig. 1b) and increased with K for Na substitution (Fig. 1c). At 24 hours, no significant differences in relative ion concentrations in solution were observed with lithium substitution while the increase in ionic concentration with potassium substitution was far less pronounced than at 6 hours (not shown).
Ion concentrations increased over time (Fig. 2), with lithium-substituted glasses (shown for Li50 in Fig. 2a) showing a slower increase than potassium-substituted glasses (shown for K50 in Fig. 2b).
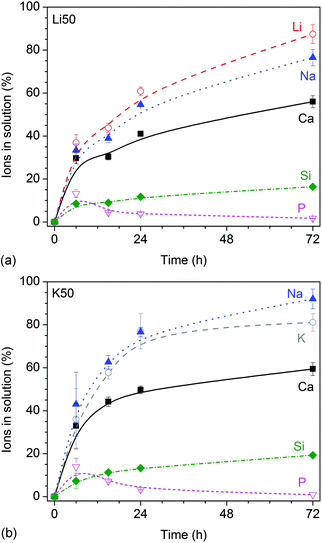 | ||
| Fig. 2 Static dissolution experiments: relative ionic concentrations in Tris buffer vs. time for glasses (a) Li50 and (b) K50. | ||
3.3 Powder analysis
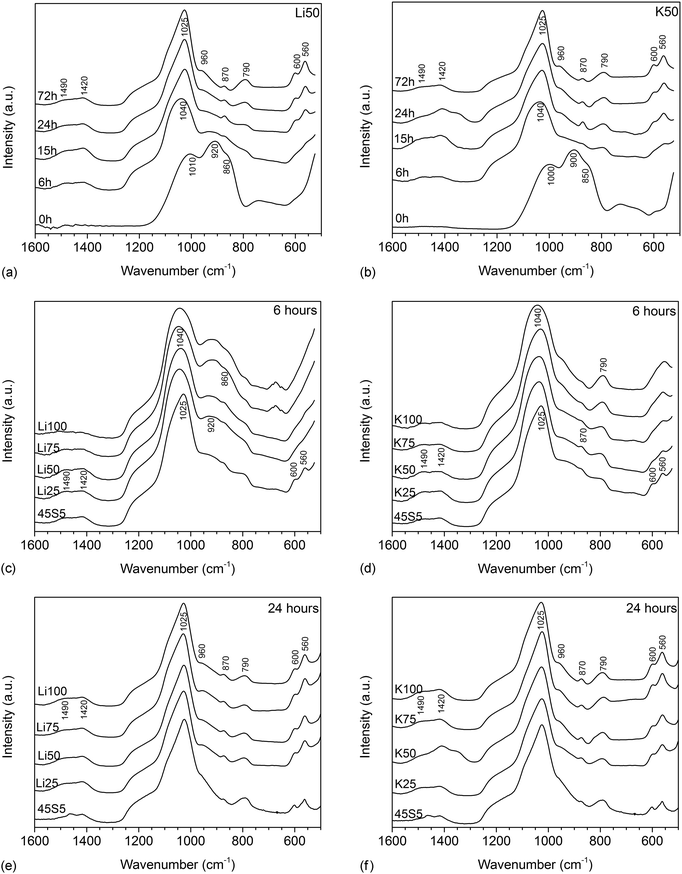
FTIR spectra of untreated glasses (shown for Li50 and K50 in Fig. 3a and b) showed the typical features of bioactive silicate glasses, including two very pronounced non-bridging oxygen (NBO) bands between 840 and 940 cm−1 and a bridging oxygen (BO) band of lower intensity at about 1040 cm−1.19 Upon immersion in Tris buffer, the NBO bands disappeared within the first 6 hours owing to the ion exchange between modifiers from the glass and protons from the solution, while an Si–O–Si band, corresponding to the newly formed silica gel (or ion-depleted glass), appeared at 790 cm−1. At six hours, a single broad band was visible for the spectrum of glass K50 between 560 and 600 cm−1, which is usually taken as an indication of the formation of an amorphous calcium phosphate layer.6 No clear band was observed in this region for glass Li50. From 15 hours, a split phosphate (P–O) bending band appeared in the same region (560 and 600 cm−1) for both glasses, together with a P–O stretch band at 1015 cm−1, overlapping with the BO band. Both suggest the formation of an apatite surface layer.6 In addition, a carbonate band appeared at about 870 cm−1 as well as broad carbonate bands in the region starting from 1400 cm−1, suggesting carbonate substitution in the apatite lattice.20 These apatitic features were more pronounced at 24 hours, but no pronounced change in intensity was observed afterwards, i.e. between 24 and 72 hours.Fig. 3c and d reveal differences with composition, as at 6 hours only 45S5 showed any apatite-related bands. Potassium-substituted glasses (Fig. 3d) showed a broad single band (which may possibly show splitting for lower substitutions) between 560 and 600 cm−1, indicating the formation of an amorphous calcium phosphate layer (or the beginning of the formation of a crystalline apatite layer for lower substitutions). No such band was visible for lithium-substituted glasses (Fig. 3c). At 15 (not shown) and 24 hours (Fig. 3e and f), however, all glasses showed the typical P–O bands indicating the presence of a crystalline apatite surface layer.
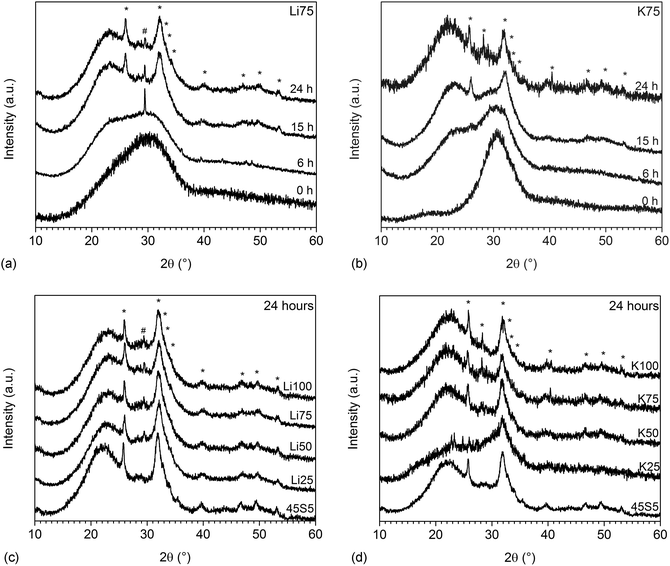
XRD results confirmed that this surface layer was indeed apatite. Fig. 4a and b show the amorphous halo shifting from about 31 to 23° 2θ upon immersion in Tris buffer, as a result of the ion exchange and formation of an ion-depleted silicate layer (silica gel) mentioned above. From 15 hours, the typical broad apatite reflections are visible, indicating the formation of apatite of poor crystallinity. Reflections are broadened owing to substitutions in the lattice8 and possibly because of nanometre sized crystals.21 At 6 hours, Li75 showed a single reflection at about 29° 2θ (Fig. 5b), indicating the presence of calcium carbonate.5 At 24 hours (Fig. 4c and d) all glasses showed the typical reflections corresponding to apatite, while Li50 to Li100 also showed a single reflection at 29.4° θ, which corresponds to the highest intensity peak of calcium carbonate.
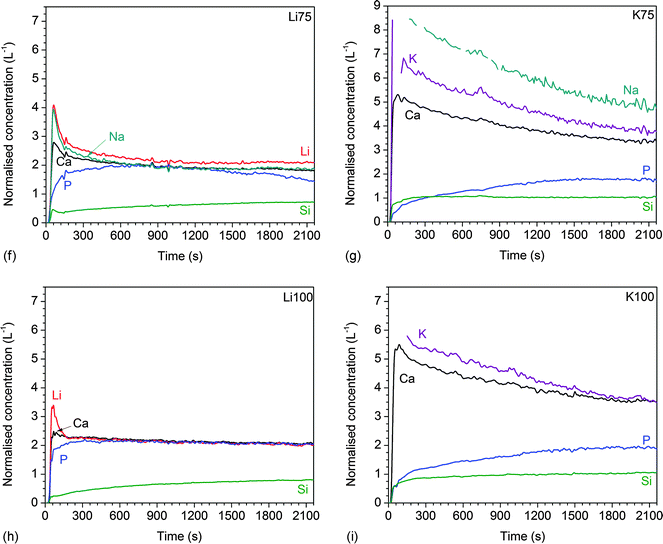 | ||
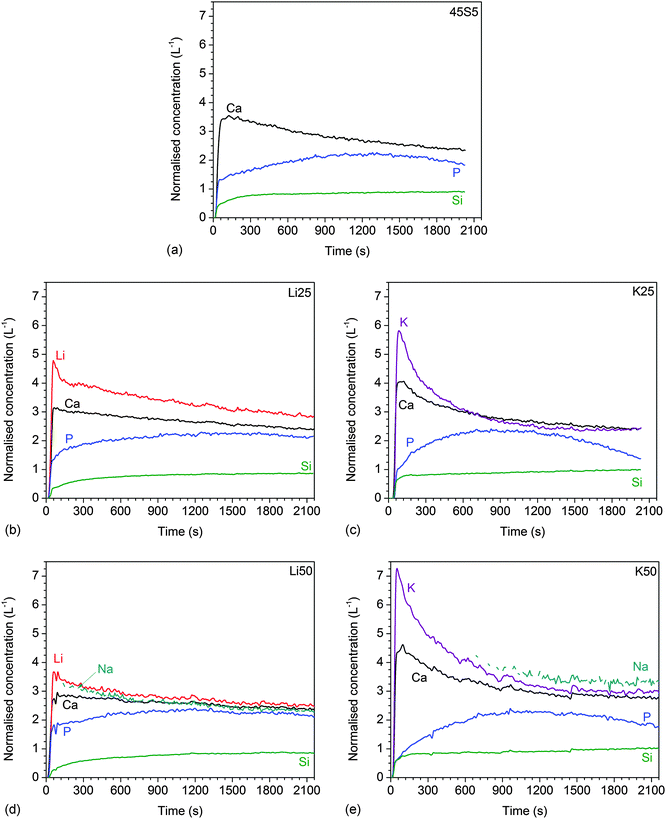
| Fig. 5 Dynamic dissolution: normalised ionic concentrations in Tris buffer solution vs. time for glasses (a) 45S5, (b) Li25, (c) K25, (d) Li50, (e) K50, (f) Li75, (g) K75, (h) Li100, and (i) K100. | ||
3.4 Dynamic dissolution experiments
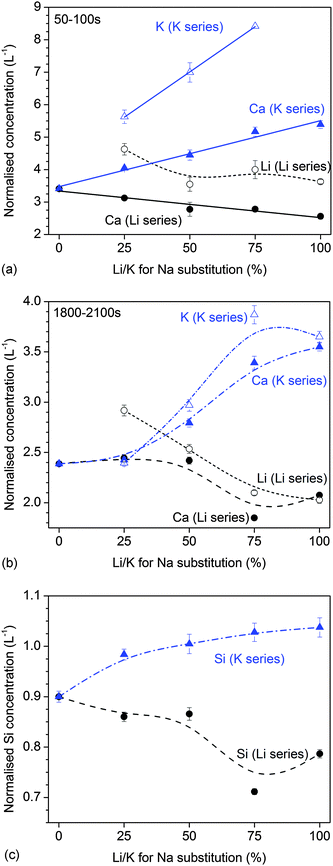
The results of dynamic dissolution experiments (presented as concentrations normalised to the amount of the same element in the glass) are shown in Fig. 5. For 0 and 25% substitutions (and partly for the other compositions), sodium concentrations were above the detection limit and therefore could not be quantified. Modifier concentrations showed a sharp maximum at early time points (about 50 to 100 s), while at later time points the results remained more constant. For phosphate concentrations, the shape of the curve and maximum concentration (about 2 L−1) were comparable for all compositions. Silicon concentrations were lower for the Li series (0.71 to 0.87 L−1) than the K series (0.98 to 1.04 L−1).Fig. 6a and b show normalised modifier concentrations of the initial maximum at 50 to 100 s and at later time points (1800 to 2100 s) vs. Li/K for Na substitution in the glass. Modifier concentrations in solution decreased with increasing lithium substitution (Fig. 6a) and increased with increasing potassium substitution (Fig. 6b). Normalised concentrations of silicon species in dynamic experiments in the final stage of the experiment (1800 to 2100 s) decreased with lithium substitution and increased with potassium substitution (Fig. 6c).
3.5 Scanning electron microscopy
SEM micrographs of lithium-substituted glasses showed droplet-shaped features, shown for compositions Li25 and Li100 in Fig. 7a and b. For Li25 (Fig. 7a) there are two different types of droplet-shaped features. The larger droplets are about 1 μm in diameter; the smaller ones are about 100 to 200 nm. Li100 (Fig. 7b) also shows a distinct structuring of the fractured surface. In comparison to the features present for Li25 the shape of the features is less homogeneous for Li100, and they reach a size of up to 5 μm. The droplet phase present for Li100 also shows secondary structuring of smaller features. In both glasses, the contrast in the SEM pictures is caused mainly by topographic contrast. In the potassium series, glasses K75 (not shown) and K100 (Fig. 7c) show structures similar to the ones observed for the lithium-substituted series; the observed droplets were mostly around 200 nm in size.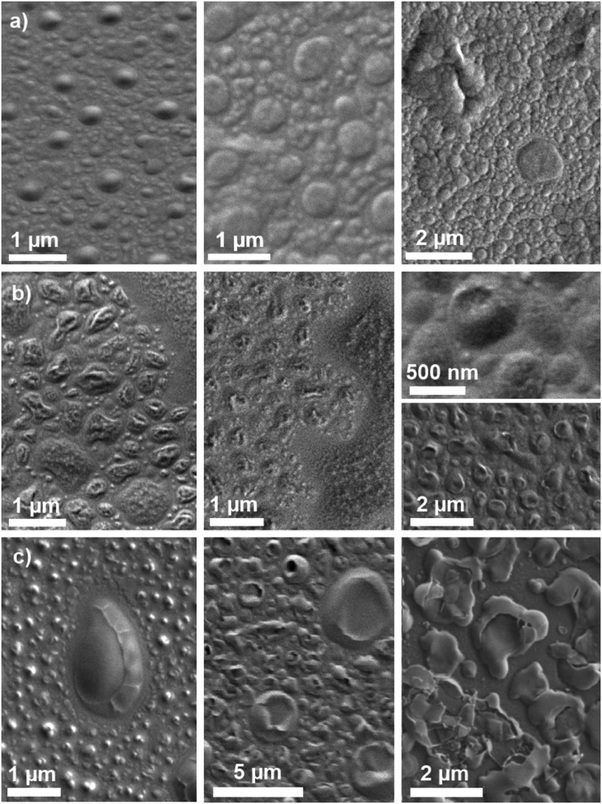 | ||
| Fig. 7 SEM micrographs of glass samples (a) Li25, (b) Li100, and (c) K100 left in ambient atmosphere for 0 days (left), 2 days (centre) and 7 days (right). | ||
The features observed for composition K100 (Fig. 7c) changed with time: they increased in size and the droplets started to show cracks. No such change was observed for composition Li100 (Fig. 7b). Li25 (Fig. 7a) did not show any change at 2 days, but showed some additional features at 7 days, which seemed to have formed on top of the original ones.
4 Discussion
One drawback of bioactive phospho-silicate glasses is their pronounced tendency to undergo crystallisation during heat treatment,14 which limits their processing at elevated temperatures.4 One approach for controlling this crystallization tendency has been the partial replacement of sodium oxide with potassium oxide,22–25 thereby making use of the MAE,26 which resulted in a wider processing window compared to glasses containing one type of alkali oxide only.15 Our results presented here show that combining different alkali metal cations may also help to control and tailor glass solubility and ion release.Bioactive glasses are well-known to cause a pH rise when immersed in aqueous solutions.14 The results from static dissolution experiments showed that this pH rise was more pronounced with increasing potassium substitution and less pronounced with increasing lithium substitution (Fig. 1a). Ion concentrations in static dissolution experiments showed the same trend: at 6 hours, normalised modifier ion concentrations increased with increasing potassium substitution and decreased with increasing lithium substitution (Fig. 1b and c). The results from dynamic dissolution experiments confirmed the findings from static experiments, as they also showed higher normalised modifier concentrations in solution with increasing potassium substitution and lower concentrations with increasing lithium substitution (Fig. 6). Both pH rise and ionic concentrations in solution originate from the ion exchange between modifier cations from the glass and protons from the dissolution medium. As modifier ions are released, protons are incorporated into the glass, bind to non-bridging oxygens (NBO) and form silanol groups (Si–OH). As a result the dissolution medium becomes depleted of protons and the pH increases.14
Modifier cations are bound to NBO but are, in fact, coordinated by several oxygen atoms, including BO and NBO.27,28 Therefore, alkali metal cations, which can charge-balance a single NBO, are actually connected to more than one NBO each.28 This has led to the suggestion of microsegregation within the glass structure, with modifier cations forming clusters in the form of channels.29,30 These channels are energetically favourable pathways for ion transport.31 While the cation generally sits and oscillates within an oxygen coordination polyhedron, it can also occasionally hop from one polyhedron to a recently vacated adjacent one. While actual ion hops occur between neighbouring polyhedra only, ion migration over longer distances occurs through a series of hops along those modifier channels. This ion migration is of importance not only for conductivity but also for ion release.32
When partially substituting one alkali oxide for another in a glass, properties that depend on transport mechanisms (including electrical conductivity, dielectric loss but also thermal properties) typically show non-linear changes, an effect which is referred to as the mixed alkali effect (MAE).26,33 Molecular dynamics simulations have shown that when more than one type of alkali oxide is present in a glass, the alkali ions are intimately mixed within the microsegregation channels,30 which may impede the ion hopping process. The MAE has also been observed to affect the ion release from (non-bioactive) silicate glasses, with mixed alkali compositions showing a less pronounced pH rise as well as less pronounced glass corrosion compared to the compositions containing one alkali oxide only.16,26,34 In the present study, however, the mixed alkali compositions did not show any minima (or maxima) compared to the single alkali compositions. Instead, ion release (as indicated by pH changes and ionic concentrations at early time points during static dissolution experiments as well as ionic concentrations in dynamic dissolution studies) increased with K for Na (or Na for Li) substitution and decreased with Li for Na (or Na for K) substitution.
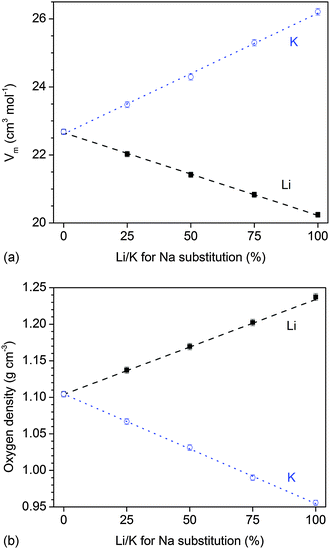
The ionic radius of the alkali ions used in the present study changes in the order Li+ (76 pm), Na+ (102 pm), and K+ (138 pm), which has been previously shown to have a pronounced effect on the packing of the silicate network (presented as molar volume and oxygen density, Fig. 8a and b) of the glasses.15 When substituting a smaller ion for a larger one (e.g. Li+ for Na+ or Na+ for K+), the glass network becomes more compact (shown in terms of a smaller molar volume and an increased oxygen density).15 By contrast, when substituting K+ for Na+ (or Na+ for Li+), the glass network expands, i.e. the molar volume increases and the oxygen density decreases.
In the present study, we decided to characterise the packing of the silicate network or the “packing density” by looking at the oxygen density35 rather than by the atomic packing density, Cg.36Cg describes how much of the glass volume is occupied by atoms. The oxygen density, by contrast, describes the concentration (or mass) of oxygen atoms per unit volume, and depending on the size of the metal cations, the packing of the oxygen atoms, i.e. the oxygen density, can be significantly altered.35 Variations in oxygen density describe how far apart or close together the silicate chains are – for larger modifier ions (e.g. K+) the silicate network “expands”, while for smaller modifier ions (e.g. Li+), the silicate network becomes more compact (Fig. 8). The oxygen density is thus very useful for glass systems where the number of oxygen atoms does not change with composition,14e.g. where the network connectivity is kept constant. Here, we replace sodium oxide by either lithium oxide or potassium oxide on a molar basis, and thus the number of oxygen atoms remains constant.
It has been shown by molecular dynamics simulations that the highly disrupted network of bioactive glasses (together with the large concentration of modifier ions and NBO) allows for strong interaction between water molecules and the glass surface37,38 as well as for easy penetration of water molecules into the silicate network.11 This then leads to an ion exchange between modifier ions in the glass and protons from the dissolution medium39 and, subsequently, to the formation of surface layers, including silica gel and apatite layers. As a result, the dissolution and ion release patterns of bioactive glasses and more cross-linked silicate glasses have been shown to differ considerably,17 and one of the main reasons is that conventional glasses (with their lower concentration of modifiers and NBO and higher network connectivity) allow for ion exchange near the surface only. Bioactive glasses, by contrast, with their more disrupted network, allow for ions to be released from deep within the silicate network, resulting in longer, more constant ion release.
If a more disrupted silicate network facilitates ion release, then the results presented here may indicate that ion release from potassium-substituted glasses was faster owing to a more expanded network (caused by larger modifier ions), allowing for easier water penetration and ion exchange. On the other hand, ion release from lithium-substituted glasses was slower owing to a more compact network impeding penetration of water molecules and, possibly, ion mobility within the network. This suggests that in the bioactive glasses presented here, ion release is directly controlled by the packing of the silicate network via modifier ionic radii.
Different alkali metal atoms also differ in their electronegativity, with M–O bonds increasing in ionic character and decreasing in covalent character in the order lithium, sodium, and potassium.40 This character (i.e., more ionic or more covalent) of the M–O bond may also affect the rate at which the alkali metal ion is released, with more ionic bonds possibly resulting in faster ion release. However, as calcium ions were also released faster from potassium-substituted glasses than from lithium-substituted or sodium-containing ones, the electronegativity of the alkali metal ion or the character of the M–O bond cannot be the main factor here. It is therefore likely that the compactness of the silicate network (via modifier ionic radius) is indeed the main contributing factor.
It is not quite clear why no MAE was observed in the present study. This behaviour is in contrast to the release of ions from more cross-linked, conventional mixed alkali silicate glasses,16,26,34 which showed reduced pH rise and ion release for compositions containing both sodium and potassium, compared to glasses containing sodium only. As the MAE is usually explained by transport mechanisms being affected by the presence of two different alkali ions,41 these results may suggest that ion release from bioactive (Hench-type) and conventional (more cross-linked) glasses may be controlled by differences in the underlying ion transport mechanism. It has been shown by molecular dynamics simulations, for example, that calcium ions lie in sodium microsegregation channels42 and thus can impede sodium ion migration.43 This effect seems to be, however, less pronounced for highly disrupted bioactive silicate glasses with their large concentration of modifier ions and NBO32 compared to highly polymerised silicate glasses44 suggesting some pronounced differences in the ion transport mechanism for silicate glasses of high and low silica content. As the results here showed that the ion release was affected strongly by the packing of the silicate network, these differences in ion transport and release may be directly related to the glass structure. However, further experiments are necessary to investigate the details.
Relative silicon concentrations in static dissolution experiments (Fig. 1) and normalised silicon concentrations in dynamic studies (Fig. 5) were significantly lower than those observed for modifier ions. This shows clearly that the glasses do not dissolve congruently, which is not surprising, as silicate glasses are well known to dissolve by ion exchange between modifier ions and protons from the dissolution medium.45,46 The general trends observed for silicon concentrations were, however, comparable to those observed for modifiers: silicon concentrations in solution increased with increasing potassium substitution in static (Fig. 1c) and dynamic dissolution experiments (Fig. 6c) and decreased with increasing lithium substitutions in dynamic dissolution experiments (Fig. 6c). However, no pronounced changes in silicon concentration with lithium substitution were observed in static dissolution experiments (Fig. 1b).
The mechanism behind the release of silicon-containing species from bioactive glasses has been a matter of debate. It has been suggested that owing to the highly disrupted structure of Hench-type bioactive glasses, small silicate units (e.g. rings or short chains) may be released without the need for Si–O–Si hydrolysis.12,47 However, it has also been shown that bioactive glass implants can degrade completely in vivo,48 even for more cross-linked bioactive glasses such as S53P4.49 The latter point suggests that some Si–O–Si hydrolysis does occur,46 possibly caused by a high pH directly at the glass/water interface.14 As potassium-substituted glasses gave a faster pH increase than lithium-substituted ones in the present study, the higher Si concentrations observed for potassium-substituted glasses may originate from alkaline Si–O–Si hydrolysis. However, previous studies have shown no indication of alkaline Si–O–Si hydrolysis in Tris buffer of pH 9,39 suggesting that the slightly higher overall pH for potassium-substituted glasses here is unlikely to result in a significant increase in silicate network hydrolysis. It is known, however, that the solubility of silicon species is strongly pH dependent,50 and we thus conclude that the higher Si concentrations observed for potassium-substituted glasses compared to lithium-substituted ones during dynamic dissolution studies are simply caused by a slightly higher pH, allowing for higher concentrations of silicon to dissolve into the Tris buffer and stay in solution rather than remain behind as a silica gel layer.
The interpretation of phosphate concentrations in solution is less straightforward. Phosphate gets released from the glass, resulting in increasing phosphate concentrations at early time points of static dissolution experiments. At later time points, however, phosphate concentrations decrease (Fig. 2) owing to phosphate being consumed during apatite formation as discussed below.14 Phosphate concentrations found in solution therefore depend on the phosphate release rates as well as on the rate of apatite formation. Here, the use of dynamic (or continuous) dissolution experiments is a great advantage. The constant flow of dissolution medium through the sample cell impedes the build-up of ions released from the glass, and thus should make it possible to study the ion release without ionic concentrations in solution being affected by precipitation of apatite (or other crystalline) species.9
While the concentrations of modifier ions and silicon species were strongly affected by the oxygen density of the glass, relative phosphate concentrations during dynamic release studies did not show any clear trends with substitution. This suggests that phosphate release was much less affected by the oxygen density of the glasses than the release of modifier ions; however, we cannot currently explain this trend.
Another interesting point is that for highly lithium-substituted glasses, normalised concentrations of lithium, calcium and phosphate ions were nearly the same during dynamic dissolution experiments (Fig. 5d, f and h). This suggests that here modifier and phosphate ions were released at the same rate. All other glasses, particularly glasses K75 and K100, showed much lower normalised phosphate concentrations than modifier concentrations. 31P MAS NMR experiments have shown phosphate to be present as orthophosphate (PO43−, charge-balanced by modifier ions) in the structure of bioactive phospho-silicate glasses23,51–53 (with Si–O–P bonds being present in very small amounts only54 if at all53). Therefore, one would expect phosphate and modifier ions to be released at comparable rates. The differences observed here may be related to possible phase separation, as suggested earlier,15 but this requires further investigation. Another possible explanation could be apatite precipitation. As explained above, owing to the continuous flow set-up, apatite precipitation is unlikely here. However, it is noticeable that phosphate concentrations, unlike the concentrations of modifiers and silicon species, decreased during later points of dynamic dissolution experiments. Apatite precipitation therefore cannot be fully excluded, and more detailed studies are currently under way to investigate this possibility.
Phosphate concentration during static dissolution experiments, particularly the decrease in phosphate concentrations observed at later time points, is usually an indication of apatite formation,6 as phosphate is consumed during apatite precipitation.55 In the present study no pronounced differences in phosphate concentrations were observed with composition at early time points (Fig. 1b and c), except for slightly higher phosphate concentrations for highly potassium-substituted glasses. This point will be discussed in more detail in the following paragraphs.
FTIR results showed distinct differences in apatite formation with substitution at early time points (Fig. 3c and d), suggesting that partially replacing sodium with lithium or potassium decreased the rate of apatite formation. For lithium-substituted glasses, this effect was probably caused by low ionic concentrations in solution: as lithium substitution reduced the ion release, concentrations in solution may simply not be high enough for supersaturation and subsequent apatite precipitation. For potassium-containing glasses, which showed a much higher solubility, ion release cannot be the main factor. The apatite formed on bioactive glasses is usually described as a hydroxyapatite or hydroxycarbonate apatite,6 but it is in fact highly substituted, similar to bone apatite. It is further known that monovalent cations can be incorporated into the apatite lattice,56 with e.g. Na+ replacing Ca2+ while CO32− simultaneously replaces PO43−. The reduced rates of apatite formation observed for potassium-substituted glasses may therefore be related to the incorporation of Na+ or K+ into the apatite lattice. And, indeed, it has been shown that apatite precipitated in the presence of K+ instead of Na+ contained less alkali and carbonate.56 Generally, the incorporation of carbonate and alkali ions into apatite seems to be linked to the ionic radius of the alkali metal cation, decreasing in the order lithium > sodium > potassium > rubidium.56 The presence of amorphous calcium phosphates for potassium-substituted glasses, as indicated by FTIR results, further suggests that apatite precipitation and crystallisation were delayed compared to 45S5, but not inhibited.
The slower apatite formation for lithium- and potassium-substituted glasses compared to 45S5 (Fig. 3 and 4) may therefore have been caused by different factors: the presence of potassium ions may reduce apatite crystallisation owing to its larger ionic radius, making it more difficult to incorporate it into the apatite crystal lattice. By contrast, apatite formation may have been reduced for lithium-containing glasses owing to their much lower solubility, and thus lower concentrations (e.g. of Ca2+ ions) in solution available for apatite precipitation.
It has been shown previously that ion release patterns from dynamic dissolution studies on bioactive glasses can be related to their bioactivity in vivo.17 Lithium- and potassium-substituted glasses gave an initial peak, or spike, of very high modifier release in the present study, followed by lower release. The shape of their release curves places them in the range between “medium” and “slow” bioactivity, based on this previous classification.17 While all glasses in the present study had formed apatite in vitro at 24 hours (based on FTIR and XRD results, Fig. 3 and 4), the substituted compositions did form apatite slower than 45S5, thus confirming the hypothesis that there is some link between dynamic release patterns and bioactivity via apatite formation.
As bioactive phospho-silicate glasses contain orthophosphate groups,52,57 charge-balanced by modifier cations,58 in addition to the silicate network, this raises the question of how these orthophosphate groups are distributed among the silicate structure. Molecular dynamics (MD) simulations have shown clustering of phosphate groups in certain compositions,59 particularly for higher phosphate contents, and recent solid-state NMR experiments confirmed the presence of phosphate nanoclusters in a sodium-free version of 45S5.54 It has been suggested that bioactive phospho-silicate glasses may be phase separated, with a phosphate-rich phase dispersed in a silicate-rich matrix,12 and TEM replica images14 confirmed the presence of droplet phases in some bioactive glasses. Particularly for lithium silicate glasses, droplet phase separation is known to occur, and the size of the droplets has been shown to vary with lithium content.60 The aim of the electron microscopy studies here was therefore to show possible phase separation effects in 45S5 and the mixed alkali glasses, and indeed SEM analysis showed droplet-shaped features (Fig. 7). As the glasses have been previously shown to be amorphous according to XRD results,15 these features are likely to be either related to phase separation or caused by glass corrosion. Although the time between fracturing of the specimens and loading them into the SEM chamber was kept short (around 20 s only), it cannot be excluded that corrosion had already occurred at such early time points. Particularly the fact that the observed droplets have a crumpled surface and look as if they have dried and shrunk points at corrosion-related processes.
Corrosion also continued with storage time in ambient atmosphere, and potassium-substituted glasses showed a higher tendency for corrosion, with surface features changing with time and increasing in size. By contrast, no changes with time were observed for highly lithium-substituted glasses. Only Li25 showed additional structures at 7 days superimposed on the originally observed ones.
The droplet shape of the structures looks similar to surface features observed for phase separated glasses,60,61 including those observed on replica films of mixed alkali bioactive phospho-silicate glasses using transmission electron microscopy.14 This, together with the fact that the morphology of phase separation in soda lime silicate glasses has been shown to affect glass surface corrosion,62 suggests that although the surface features observed in the present study are very likely to be related to corrosion processes, their shape might still be influenced by underlying phase separation.
Influence of modifier ionic radii and molar volume on ion release of bioactive glasses in the literature
Despite various studies on ionic substitutions in bioactive glasses,4,14 their use as a design tool to tailor solubility by using ions of varying ionic radii has been largely neglected. Still, there are several publications available, which actually show effects similar to those observed for mixed alkali compositions in the present study.Several studies on cation substitution in bioactive glasses have been performed recently.3,14 When substituting strontium for calcium on a molar basis,63 the smaller calcium ion (100 pm)13 is replaced with the larger strontium ion (118 pm).13 The overall effect on ion release was not as pronounced as that observed in the present study (owing to the more similar ionic radii of calcium and strontium), but a more pronounced pH increase in simulated body fluid was observed with increasing strontium substitution.64 Dynamic ion release studies on bioactive glass S53P5, where calcium was systematically replaced by strontium, showed increasing release of silicon (normalised to the amount present in the glass) with increasing strontium substitution.65 By replacing calcium ions in the glass with strontium ions, the oxygen density in the glass decreased,66i.e. the molar volume increased, suggesting a less compact glass network, which should facilitate water penetration and ion release – an effect similar to the one observed in the present study. When substituting magnesium ions (72 pm)13 for calcium ions in 45S5, an opposite effect was observed: owing to a more compact network, solubility and ion release were reduced with increasing magnesium substitution.67
Besides the substitution of cations, incorporation of anions of varying ionic radii may also help to tailor ion release. When incorporating calcium fluoride into bioactive glasses, the fluoride ions do not bond to silicon atoms (replacing oxygen atoms), but instead complex modifier ions such as calcium and sodium58 and are present in the form of F− anions between the silicate chains.68 Increasing calcium fluoride contents were shown to result in a lower pH rise during in vitro dissolution studies.8 This was not, however, caused by an ion exchange between fluoride ions from the glass and hydroxyl ions (OH−) from the solution, counterbalancing the ion exchange between modifier cations and protons (H+), as suggested at the time.8 A more detailed study later showed that, instead, the pH rise was caused by ion release from the silicate part of the glass only, with contributions from the calcium fluoride part being negligible.5 Calcium chloride-containing bioactive glasses, by contrast, showed the opposite trend, giving a more pronounced pH rise with increasing calcium chloride content.69 This difference can, again, be explained by differences in ionic radii: chloride ions (ionic radius of Cl− 181 pm) expand the glass network much more than fluoride ions (F− 131 pm) when present between the silicate chains, facilitating water intrusion and ion exchange.
It is important to note, however, that while replacing one ion with another of a smaller or larger ionic radius may result in desired changes in ion release and solubility, care needs to be taken to avoid any adverse effects. Complete substitution of sodium or calcium by other ions may therefore not be desirable in practice; however, partial substitution still may be considered as a useful tool for fine-tuning ion release and solubility, to design new bioactive glass compositions to address clinical needs.
Conclusion
Combining different alkali oxides in bioactive glasses helps to control crystallisation and improve processing, owing to the mixed alkali effect. Here we show that for Hench-type bioactive glasses no mixed alkali effect is observed in static or dynamic ion release studies. Instead, the ionic radii of the modifier ions and subsequent variations in network packing control ion release, glass dissolution but also surface degradation. This suggests that combining different alkali ions – or other modifier ions of varying ionic radii – may allow for controlling glass crystallisation, ion release and degradation, in order to design new functional materials for tissue engineering and regenerative medicine.Acknowledgements
The authors acknowledge funding for a bilateral exchange project between Jena and Turku supported jointly by the German Academic Exchange Service (DAAD) and the Academy of Finland. DS Brauer acknowledges research funding by the Carl Zeiss Foundation, Germany. R. Brückner would like to thank Dr Susanne Fagerlund for support with dynamic dissolution studies.References
- L. L. Hench, R. J. Splinter, W. C. Allen and T. K. Greenlee, J. Biomed. Mater. Res., 1971, 5, 117–141 CrossRef.
- L. L. Hench, J. W. Hench and D. C. Greenspan, J. Australas. Ceram. Soc., 2004, 40, 1–42 CAS.
- A. Hoppe, N. S. Güldal and A. R. Boccaccini, Biomaterials, 2011, 32, 2757–2774 CrossRef CAS PubMed.
- J. R. Jones, Acta Biomater., 2013, 9, 4457–4486 CrossRef CAS PubMed.
- D. S. Brauer, M. Mneimne and R. G. Hill, J. Non-Cryst. Solids, 2011, 357, 3328–3333 CrossRef CAS.
- J. R. Jones, P. Sepulveda and L. L. Hench, J. Biomed. Mater. Res., 2001, 58, 720–726 CrossRef CAS PubMed.
- F. A. Shah, D. S. Brauer, R. M. Wilson, R. G. Hill and K. A. Hing, J. Biomed. Mater. Res., Part A, 2014, 102, 647–654 CrossRef PubMed.
- D. S. Brauer, N. Karpukhina, M. D. O’Donnell, R. V. Law and R. G. Hill, Acta Biomater., 2010, 6, 3275–3282 CrossRef CAS PubMed.
- S. Fagerlund, P. Ek, L. Hupa and M. Hupa, J. Am. Ceram. Soc., 2012, 95, 3130–3137 CrossRef CAS.
- A. Tilocca and A. N. Cormack, Langmuir, 2010, 26, 545–551 CrossRef CAS PubMed.
- A. Tilocca and A. N. Cormack, Proc. R. Soc. A, 2011, 467, 2102–2111 CrossRef CAS.
- R. G. Hill and D. S. Brauer, J. Non-Cryst. Solids, 2011, 357, 3884–3887 CrossRef CAS.
- R. D. Shannon, Acta Crystallogr., Sect. A: Cryst. Phys., Diffr., Theor. Gen. Crystallogr., 1976, 32, 751–767 CrossRef.
- D. S. Brauer, Angew. Chem., Int. Ed., 2015, 54, 4160–4181 ( Angew. Chem. , 2015 , 127 , 4232–4254 ) CrossRef CAS PubMed.
- M. Tylkowski and D. S. Brauer, J. Non-Cryst. Solids, 2013, 376, 175–181 CrossRef CAS.
- M. F. Dilmore, D. E. Clark and L. L. Hench, J. Am. Ceram. Soc., 1978, 61, 439–443 CrossRef CAS.
- S. Fagerlund, L. Hupa and M. Hupa, Acta Biomater., 2013, 9, 5400–5410 CrossRef CAS PubMed.
- S. Fagerlund, P. Ek, M. Hupa and L. Hupa, Glass Technol., 2010, 51, 235–240 CAS.
- J. Serra, P. González, S. Liste, S. Chiussi, B. León, M. Pérez-Amor, H. O. Ylänen and M. Hupa, J. Mater. Sci.: Mater. Med., 2002, 13, 1221–1225 CrossRef CAS PubMed.
- R. Z. LeGeros, O. R. Trautz, E. Klein and J. P. LeGeros, Experientia, 1969, 25, 5–7 CrossRef CAS PubMed.
- M. D. O’Donnell, S. J. Watts, R. G. Hill and R. V. Law, J. Mater. Sci.: Mater. Med., 2009, 20, 1611–1618 CrossRef PubMed.
- M. Brink, T. Turunen, R. P. Happonen and A. Yli-Urpo, J. Biomed. Mater. Res., 1997, 37, 114–121 CrossRef CAS PubMed.
- I. Elgayar, A. E. Aliev, A. R. Boccaccini and R. G. Hill, J. Non-Cryst. Solids, 2005, 351, 173–183 CrossRef CAS.
- D. Groh, F. Döhler and D. S. Brauer, Acta Biomater., 2014, 10, 4465–4473 CrossRef CAS PubMed.
- F. Döhler, D. Groh, S. Chiba, J. Bierlich, J. Kobelke and D. S. Brauer, J. Non-Cryst. Solids, 2016, 432, 130–136 CrossRef.
- D. E. Day, J. Non-Cryst. Solids, 1976, 21, 343–372 CrossRef CAS.
- V. FitzGerald, D. M. Pickup, D. Greenspan, G. Sarkar, J. J. Fitzgerald, K. M. Wetherall, R. M. Moss, J. R. Jones and R. J. Newport, Adv. Funct. Mater., 2007, 17, 3746–3753 CrossRef CAS.
- A. Tilocca, A. N. Cormack and N. H. de Leeuw, Chem. Mater., 2007, 19, 95–103 CrossRef CAS.
- G. N. Greaves, J. Non-Cryst. Solids, 1985, 71, 203–217 CrossRef CAS.
- B. Vessal, G. N. Greaves, P. T. Marten, A. V. Chadwick, R. Mole and S. Houdewalter, Nature, 1992, 356, 504–506 CrossRef CAS.
- G. N. Greaves and K. L. Ngai, J. Non-Cryst. Solids, 1994, 172, 1378–1388 CrossRef.
- A. Tilocca, J. Chem. Phys., 2010, 133, 014701 CrossRef PubMed.
- W. Vogel, Glass chemistry, Springer, Berlin, Heidelberg, New York, London, 2nd edn, 1994 Search PubMed.
- Y. Z. Sun, Y. A. Su and B. Y. He, J. Non-Cryst. Solids, 1986, 80, 335–340 CrossRef CAS.
- N. H. Ray, J. Non-Cryst. Solids, 1974, 15, 423–434 CrossRef CAS.
- T. Rouxel, J. Am. Ceram. Soc., 2007, 90, 3019–3039 CrossRef CAS.
- A. Tilocca and A. N. Cormack, ACS Appl. Mater. Interfaces, 2009, 1, 1324–1333 CAS.
- A. Tilocca and A. N. Cormack, J. Phys. Chem. C, 2008, 112, 11936–11945 CAS.
- L. Bingel, D. Groh, N. Karpukhina and D. S. Brauer, Mater. Lett., 2015, 143, 279–282 CrossRef CAS.
- G. H. Aylward and T. J. V. Findlay, SI chemical data, Wiley-VCH, Weinheim, Berlin, 6th edn, 2007 Search PubMed.
- A. C. Wright and N. M. Vedishcheva, Phys. Chem. Glasses: Eur. J. Glass Sci. Technol., Part B, 2015, 56, 98–107 CrossRef.
- A. Pedone, G. Malavasi, M. C. Menziani, U. Segre and A. N. Cormack, J. Phys. Chem. C, 2008, 112, 11034–11041 CAS.
- F. V. Natrup, H. Bracht, S. Murugavel and B. Roling, Phys. Chem. Chem. Phys., 2005, 7, 2279–2286 RSC.
- A. N. Cormack, J. Du and T. R. Zeitler, J. Non-Cryst. Solids, 2003, 323, 147–154 CrossRef CAS.
- R. Conradt, J. Am. Ceram. Soc., 2008, 91, 728–735 CrossRef CAS.
- L. L. Hench and D. E. Clark, J. Non-Cryst. Solids, 1978, 28, 83–105 CrossRef CAS.
- R. Hill, J. Mater. Sci. Lett., 1996, 15, 1122–1125 CrossRef CAS.
- H. Oonishi, L. L. Hench, J. Wilson, F. Sugihara, E. Tsuji, M. Matsuura, S. Kin, T. Yamamoto and S. Mizokawa, J. Biomed. Mater. Res., 2000, 51, 37–46 CrossRef CAS PubMed.
- N. C. Lindfors, I. Koski, J. T. Heikkila, K. Mattila and A. J. Aho, J. Biomed. Mater. Res., Part B, 2010, 94, 157–164 Search PubMed.
- R. K. Iler, The chemistry of silica: solubility, polymerization, colloid and surface properties, and biochemistry, Wiley, New York, 1979 Search PubMed.
- R. A. Martin, H. L. Twyman, G. J. Rees, J. M. Smith, E. R. Barney, M. E. Smith, J. V. Hanna and R. J. Newport, Phys. Chem. Chem. Phys., 2012, 14, 12105–12113 RSC.
- M. W. G. Lockyer, D. Holland and R. Dupree, J. Non-Cryst. Solids, 1995, 188, 207–219 CrossRef CAS.
- A. Pedone, T. Charpentier, G. Malavasi and M. C. Menziani, Chem. Mater., 2010, 22, 5644–5652 CrossRef CAS.
- F. Fayon, C. Duee, T. Poumeyrol, M. Allix and D. Massiot, J. Phys. Chem. C, 2013, 117, 2283–2288 CAS.
- M. Mneimne, R. G. Hill, A. J. Bushby and D. S. Brauer, Acta Biomater., 2011, 7, 1827–1834 CrossRef CAS PubMed.
- J. C. Elliott, Structure and chemistry of the apatites and other calcium orthophosphates, Elsevier, Amsterdam, New York, London, Tokyo, 1st edn, 1994 Search PubMed.
- M. D. O’Donnell, S. J. Watts, R. V. Law and R. G. Hill, J. Non-Cryst. Solids, 2008, 354, 3554–3560 CrossRef.
- D. S. Brauer, N. Karpukhina, R. V. Law and R. G. Hill, J. Mater. Chem., 2009, 19, 5629–5636 RSC.
- A. Tilocca and A. N. Cormack, J. Phys. Chem. B, 2007, 111, 14256–14264 CrossRef CAS PubMed.
- W. Vogel, Structure and crystallization of glasses, Pergamon Press, Oxford, 1971 Search PubMed.
- W. Vogel, Phys. Status Solidi, 1966, 14, 255–286 CrossRef CAS.
- C. Y. Wang and L. Z. Zhou, J. Non-Cryst. Solids, 1986, 80, 360–370 CrossRef CAS.
- M. D. O’Donnell and R. G. Hill, Acta Biomater., 2010, 6, 2382–2385 CrossRef PubMed.
- Y. C. Fredholm, N. Karpukhina, D. S. Brauer, J. R. Jones, R. V. Law and R. G. Hill, J. R. Soc., Interface, 2012, 9, 880–889 CrossRef CAS PubMed.
- L. Hupa, S. Fagerlund, J. Massera and L. Björkvik, J. Non-Cryst. Solids, 2016, 432, 41–46 CrossRef CAS.
- Y. C. Fredholm, N. Karpukhina, R. V. Law and R. G. Hill, J. Non-Cryst. Solids, 2010, 356, 2546–2551 CrossRef CAS.
- M. Blochberger, L. Hupa and D. S. Brauer, Biomedical Glasses, 2015, 1, 93–107 CrossRef.
- G. Lusvardi, G. Malavasi, M. Cortada, L. Menabue, M. C. Menziani, A. Pedone and U. Segre, J. Phys. Chem. B, 2008, 112, 12730–12739 CrossRef CAS PubMed.
- X. Chen, N. Karpukhina, D. S. Brauer and R. G. Hill, Biomedical Glasses, 2015, 1, 108–118 CrossRef.
| This journal is © The Royal Society of Chemistry 2016 |

