Novel three-dimensional, conducting, biocompatible, porous, and elastic polyaniline-based scaffolds for regenerative therapies
Raana Sarvaria,
Bakhshali Massoumi*a,
Mehdi Jaymand*b,
Younes Beygi-Khosrowshahic and
Mahdi Abdollahid
aDepartment of Chemistry, Payame Noor University, P.O. BOX: 19395-3697, Tehran, Islamic Republic of Iran. E-mail: b_massoumi@pnu.ac.ir; bakhshalim@yahoo.com
bResearch Center for Pharmaceutical Nanotechnology, Tabriz University of Medical Sciences, P.O. BOX: 51656-65811, Tabriz, Islamic Republic of Iran. E-mail: m_jaymand@yahoo.com; m.jaymand@gmail.com; jaymandm@tbzmed.ac.ir; Fax: +98-41-33367929; Tel: +98-41-33367914
cChemical Engineering Department, Faculty of Engineering, Azarbaijan Shahid Madani University, P.O. BOX: 53714-161, Tabriz, Islamic Republic of Iran
dPolymer Reaction Engineering Department, Faculty of Chemical Engineering, Tarbiat Modares University, P.O. BOX: 14115-114, Tehran, Islamic Republic of Iran
First published on 9th February 2016
Abstract
The aim of this study is the fabrication of two novel three-dimensional, conducting, biocompatible, porous, and elastic scaffolds composed of hyperbranched aliphatic polyesters (HAPs), polyaniline (PANI), and poly(ε-caprolactone) (PCL) for tissue engineering applications. First, HAPs (G3 and G6) were synthesized via a melt polycondensation reaction from tris(methylol)propan, and 2,2-bis(methylol)propionic acid. The synthesized HAPs were further reacted with p-anthranilic acid to afford phenylamine-functionalized aliphatic hyperbranched polyester macromonomers (PhAG3M and PhAG6M). The synthesized macromonomers were subsequently employed in both chemical and electrochemical oxidation copolymerizations with aniline monomer to produce two star-shaped PANIs (S-PANIs) with HAPs cores. The solutions of the chemically synthesized S-PANIs were electrospun with PCL solution to produce uniform conductive nanofibers. The biocompatibility of the electrospun nanofibers were evaluated by assessing the adhesion and proliferation of the mouse fibroblast L929 cell line, and in vitro degradabilities. From the results obtained for the conductivities, biocompatibilities, hydrophilicites, and mechanical properties of the fabricated scaffolds it is suggested that the nanofibers are potentially suitable for use in tissue engineering.
1. Introduction
In recent decades, a great deal of research effort has focused on the design and development of biomaterials for the regeneration or replacement of damaged tissues. It is well established that ordinary regeneration and development in the human body is organized by particular communication with different biochemical elements as well as physical effects such as cell and cell–matrix interactions, superficial structure, external adhesive ligands, surface topography, and tension of context in their extracellular matrix (ECM), which can affect various cell responses including proliferation, migration, and differentiation.1–4 In this context, different studies have been carried out on the preparation of a suitable matrix from biopolymers with suitable physical signals for the regeneration of defective tissues. On the other hand, the transmission of messages in neurons depends on a complex conductive system, which is directly relative with the changes in voltammetric potential in the membrane of nerve cells.5,6 This unique feature of nerve cells has prompted polymer scientists to design and develop biodegradable and electrically conductive polymeric scaffolds with suitable physical signals for the regeneration of nerve cells.7,8In this respect, some effort has been made through the incorporation of conductive particles such as carbon based materials,9,10 and gold nanowires11,12 in implantable polymeric scaffolds to modulate cellular behavior. However, the main drawbacks of these systems are the non-biodegradability and in vivo long-term effects of fillers. These problems can be circumvented by employing electrically conductive polymers (ECPs) such as polypyrrole (PPy), polythiophene (PTh), and polyaniline (PANI). Among them, PANI can be considered as a potential prospective candidate for tissue engineering and regenerative medicine, in part due to its excellent electrical conductivity, good redox stability, reversible oxidation, biocompatibility, and hydrophobicity.13–16 It should be pointed out that both the non-conductive emeraldine base, and the conductive salt forms of PANI were found to be biocompatible in their purified form both in vitro and in vivo, which is further enhanced by blending or covalently grafting with other synthetic, semi-synthetic, and natural biodegradable polymers (e.g., poly(ε-caprolactone), poly(ethylene glycol), gelatin, collagen, chitosan, and many more) before being processed.17–19 On the other hand, PANI exhibits brittleness and poor mechanical properties when used on its own. Therefore, blending this conducting polymer with insulating polymers (generally biocompatible polymers) is necessary to fabricate flexible conducting polymer-based scaffolds for biomedical applications.20–23
Among the synthetic biodegradable polymers, aliphatic polyesters may be appropriate candidates, in part due to their biocompatibility, biodegradability, and low cost. In this respect, hyperbranched aliphatic polyesters (HAPs) based on 2,2-bis(methylol)propionic acid have attracted considerable interest, mainly due to their highly branched structures and the large number of functional groups, unique physicochemical properties, and wide range of practical, technological, and biomedical applications.24–28 These hyperbranched polyesters are generally synthesized from ABx functional monomers giving (x − 1) potential branch points per repeating unit via a polycondensation reaction.29,30 In comparison with their linear counterparts the HAPs exhibit a compact structure, less flexibility, a low degree of entanglement, a large number of reactive end groups, a low solution and melt viscosity, a high solubility in common organic solvents, and a different origin of the glass-transition temperature.24,29
In the current study, the fabrication of two novel elastic, porous, and conductive scaffolds composed of hyperbranched aliphatic polyesters (HAPs), polyaniline (PANI), and poly(ε-caprolactone) (PCL) for tissue engineering applications is suggested. The HAPs (G3 and G6) were synthesized by a melt polycondensation reaction, and then reacted with p-anthranilic acid to afford PhAG3M and PhAG6M macromonomers. The S-PANIs were synthesized through the copolymerization of macromonomers with aniline monomer via both chemical and electrochemical oxidation polymerization methods. The solutions of the chemically synthesized S-PANIs, and PCL were electrospun to produce uniform conductive nanofibers. The morphologies, electrical conductivities, in vitro degradabilities, biocompatibilities (adhesion and proliferation of the mouse fibroblast L929 cell line), hydrophilicites, and mechanical properties of the nanofibers were evaluated. It was found that these electrospun nanofibers can be considered as prospective candidates for the fabrication of scaffolds for regenerative medicine applications.
2. Experimental
2.1. Materials
Tris(methylol)propan (TMP), 2,2-bis(methylol)propionic acid (bis-MPA), p-toluenesulfonic acid (p-TSA), and p-anthranilic acid were purchased from Fluka (USA), and were used as received. Aniline monomer was purchased from Merck (Darmstadt, Germany), and was distilled twice under reduced pressure before use. Ammonium peroxydisulfate (APS) from Merck was re-crystallized at room temperature from ethanol. Poly(ε-caprolactone) (PCL) (Mn = 70![[thin space (1/6-em)]](https://www.rsc.org/images/entities/char_2009.gif) 000–90
000–90![[thin space (1/6-em)]](https://www.rsc.org/images/entities/char_2009.gif) 000 gmol−1) was purchased from Sigma-Aldrich (USA), and was used as received. All other reagents were purchased from Merck, and purified according to standard methods.
000 gmol−1) was purchased from Sigma-Aldrich (USA), and was used as received. All other reagents were purchased from Merck, and purified according to standard methods.
2.2. Synthesis of hyperbranched aliphatic polyesters (HAPs) (G3 and G6)
A three-neck round-bottom flask equipped with a stirrer, condenser, and thermometer was charged with a mixture of TMP (0.28 g, 2.2 mmol), bis-MPA (8.0 g, 46.4 mmol) (in stoichiometric correspondence to a perfect generation of third generation), and a catalytic amount of p-TSA (0.05 g, 0.28 mmol). The reaction mixture was heated for about 3 hours at 140 °C ± 3 under argon protection, and the water formed during the reaction was removed. At the end of this time, a glass-like product (defined as G3) was obtained. The aliphatic hyperbranched polyester G6 was synthesized according to the Hult group method,31 with the appropriate amount of TMP (0.14 g, 1.1 mmol), bis-MPA (36.0 g, 208 mmol), and p-TSA (0.2 g, 1.12 mmol).2.3. Synthesis of phenylamine-functionalized hyperbranched aliphatic polyester macromonomers (PhAG3M and PhAG6M)
The PhAG3M and PhAG6M macromonomers were synthesized by the esterification of G3 and G6 with p-anthranilic acid in the presence of p-TSA as the dehydrating agent. Briefly, a 250 ml three-neck round-bottom flask equipped with a dean-stark trap, gas inlet/outlet, and a magnetic stirrer, was charged with G3 (3.0 g, 1.66 mmol), p-anthranilic acid (3.45 g, 25 mmol), and anhydrous dimethylsulfoxide (DMSO; 100 ml). A catalytic amount of p-TSA (0.10 g, 0.56 mmol) as the dehydrating agent was added to the flask, and the reaction mixture was de-aerated by bubbling highly pure argon for 10 minutes. Thereafter, the flask was placed in a silicon oil bath at 140 ± 3 °C, and the reaction mixture was stirred for about 8 hours under an argon atmosphere. The water formed during the reaction was removed as an azeotrope until no more water was formed, which could indicate that the reaction had gone to completion. Then, most of the solvent (DMSO) was distilled off in vacuum, and the product was isolated by precipitation in ethyl acetate, and dried under vacuum at room temperature (Scheme 1).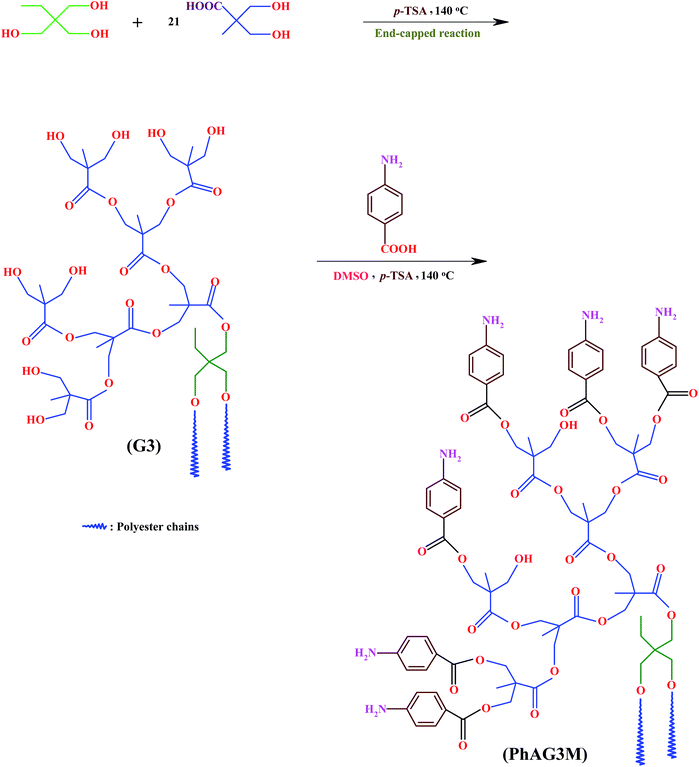 | ||
| Scheme 1 Synthesis of hyperbranched aliphatic polyester (G3), and phenylamine-functionalized hyperbranched aliphatic polyester macromonomer (PhAG3M). | ||
The PhAG6M macromonomer was synthesized by the same procedure with the appropriate amount of G6 (3.0 g, 0.67 mmol), p-anthranilic acid (3.75 g, 25 mmol), and p-TSA (0.10 g, 0.56 mmol).
2.4. Synthesis of star-shaped polyanilines (S-PANIs) with G3 and G6 cores via a chemical oxidation polymerization method
A 250 ml round-bottom flask was charged with PhAG3M macromonomer (0.50 g), tetrahydrofuran (THF, 50 ml), aniline monomer (3 ml, 32 mmol), and p-TSA (12.7 g, 65 mmol). The reaction mixture was stirred vigorously for about 1 hour to obtain an homogeneous solution, and the temperature was reduced to 0 °C. In a separate container, 8.0 g (35 mmol) of APS was dissolved in 50 ml of deionized water, and was slowly added to the above flask at a rate of 5 ml min−1. The reaction mixture was stirred for about 24 hours at 0 °C, and at the end of this time, the reaction was terminated by pouring the contents of the flask into a large amount of methanol. The resultant product was filtered, washed several times with methanol, and dried in vacuum at room temperature (Scheme 2). S-PANI with G6 as the core was synthesized by the same method, with the appropriate amount of PhAG6M (0.50 g), aniline monomer (6 ml, 64 mmol), p-TSA (25.4 g, 130 mmol), and APS (16.0 g, 70 mmol).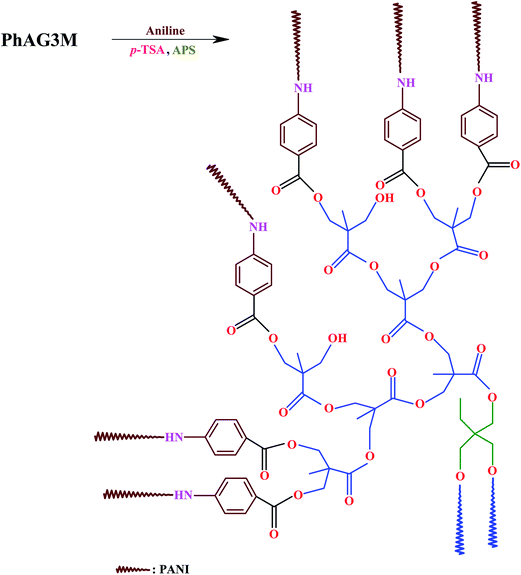 | ||
| Scheme 2 Synthesis of star-shaped polyaniline (S-PANI) with G3 as the core via a chemical oxidation polymerization method. | ||
2.5. Electrochemical system
The electrochemical synthesis and measurements were carried out using Auto-Lab equipment (ECO Chemie, Utrecht, The Netherlands) equipped with a three-electrode cell assembly. A glassy carbon (GC) electrode (with a surface area of 0.03 cm2), a platinum rod, and Ag/AgCl were used as the working, counter, and reference electrodes, respectively. The surface of the working electrode (GC) was polished with emery paper followed by 1.0 and 0.5 μm alumina prior to use. The electrochemical measurements were carried out in an aqueous solution of p-TSA (1.0 mol L−1), by applying a sequential linear potential scan rate of 10–100 mV s−1 between −0.30 and +1.20 V versus the reference electrode. All of the experimental solutions were de-aerated by bubbling with highly pure argon for 10 minutes, and an argon atmosphere was kept over the solutions during the measurements.2.6. Synthesis of S-PANIs with G3 and G6 cores via an electrochemical oxidation polymerization method
G3-PANI and G6-PANI were also synthesized by applying sequential linear potential sweeps with a scan rate of 25 mV s−1 between −0.30 and +1.20 V versus a silver (Ag)/silver chloride (AgCl) electrode. For this purpose, 3% (w/v) solutions of the PhAG3M, and PhAG6M macromonomers were dissolved in THF, and both sides of the electrodes were coated with the macromonomers by drop-coating, and then used as the working electrodes. The samples were synthesized through 10 cycles in the supporting electrolyte. The electrolyte solution consisted of aniline (0.1 mol L−1), and p-TSA (1.0 mol L−1).2.7. Electrospinning of the chemically synthesized G3-PANI, and G6-PANI with PCL
The G3-PANI/PCL, and G6-PANI/PCL nanofibers were prepared by subsequent electrospinning the same volume solutions of G3-PANI, and G6-PANI (1% w/v; in DMSO), and PCL (3% w/v; in CHCl3) under the conditions described in our previous work.322.8. Biocompatibility analysis
![[thin space (1/6-em)]](https://www.rsc.org/images/entities/char_2009.gif) :
:![[thin space (1/6-em)]](https://www.rsc.org/images/entities/char_2009.gif) 1 v/v) and then, the clear blue viable cells were counted using a hemocytometer slide.
1 v/v) and then, the clear blue viable cells were counted using a hemocytometer slide.2.9. Characterization
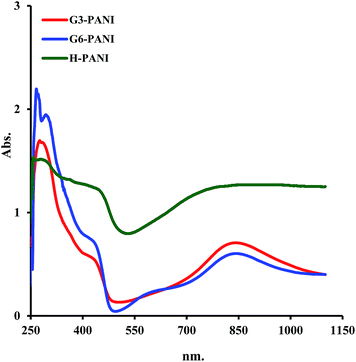
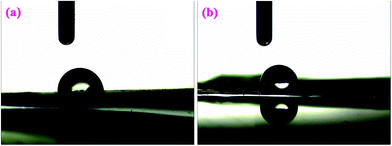
Fourier transform infrared (FTIR) spectra of the samples were collected using a Shimadzu 8101M FTIR instrument (Shimadzu, Kyoto, Japan) between the frequency range of 4000 to 400 cm−1, with an attenuated total reflection facility. The samples were prepared by grinding the dry powders with potassium bromide (KBr), and compressing the mixture into disks. The spectra were recorded at room temperature. The 1H nuclear magnetic resonance (NMR) spectra of the samples were recorded at 25 °C using an FT-NMR (400 MHz) Bruker spectrometer (Bruker, Ettlingen, Germany). The samples for NMR spectroscopy were prepared by dissolving about 10 mg of sample in 1 ml of deuterated dimethylsulfoxide (DMSO-d6), and the chemical shifts were reported in parts per million (ppm) units with tetramethylsilane (TMS) as the internal standard. Ultraviolet-visible (UV-vis) spectroscopy was performed using a Shimadzu 1650 PC UV-vis spectrophotometer (Shimadzu, Kyoto, Japan) at a wavelength range of 1100 to 250 nm. An SEM (type 1430 VP, LEO Electron Microscopy Ltd, Cambridge, UK) was applied to determine the surface morphologies of the synthesized samples, electrospun nanofibers, and the adherent mouse fibroblast L929 cells onto nanofibers. Electrochemical experiments were conducted using an Auto-Lab PGSTA T302N. The conductivities of the synthesized samples were determined using a four-probe technique (Azar Electrode, Urmia, Iran) at room temperature. The ultimate tensile strength and strain to break were determined using a Zwick tensile testing machine (Z 010, Zwick/Roell, Ulm, Germany). The wettabilites of the electrospun nanofibers were investigated by drop water contact angle measurement using an OCA 20 plus contact angle meter system (DataPhysics Instruments GmbH, Filderstadt, Germany). The droplet size was 5 μl, and at least five samples were used for each test.3. Results and discussion
In the last decade, a great deal of research effort has focused on the design and development of new biocompatible conductive organic materials for biomedical applications such as regenerative medicine. The incorporation of biocompatible electroactive materials into a biological system has been the subject of many investigations, in part to provide a physical conductive substrate to allow the local delivery of an electrical stimulus to a specific site to foster cell growth and repair damaged tissue. In addition, the delivery of an electrical stimulus can be considered as a promising approach to aid the in vitro development of tissue for implantation.36,37 In this respect, biocompatible materials based on π-conjugated polymers such as PANI can be considered as prospective candidates. Nevertheless, this field is still growing and many issues remain to be answered. The overall methodology for the fabrication of biocompatible, porous, and electrically conductive scaffolds for regenerative medicine applications is shown in Scheme 3.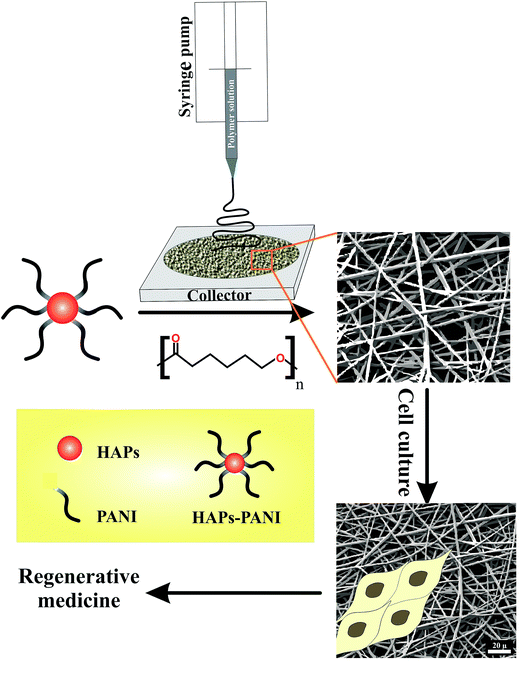 | ||
| Scheme 3 The overall methodology for the fabrication of biocompatible, porous, and electrically conductive scaffolds for regenerative medicine applications. | ||
3.1. Characterization of PhAG3M and PhAG6M macromonomers
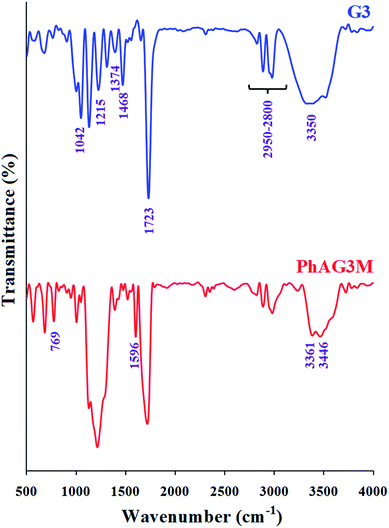
The G3 and G6 polyesters were synthesized by the melt polycondensation method, and the hydroxyl end groups in these polyesters were further reacted with p-anthranilic acid to afford PhAG3M and PhAG6M macromonomers. The FTIR spectra of G3 and PhAG3M macromonomer are shown in Fig. 1. The FTIR spectrum of G3 shows characteristic absorption bands due to the stretching vibration of carbonyl groups at 1723 cm−1, stretching vibrations of aliphatic C–H in the 2950–2800 cm−1 region, C–H bending vibrations at 1374 and 1468 cm−1, and C–O stretching vibrations at 1042 and 1215 cm−1. In addition, the hydroxyl end groups appeared as a broad strong band centered at 3350 cm−1. In comparison with the FTIR spectrum of G3, the most significant changes in the FTIR spectrum of PhAG3M are the appearance of –NH2 stretching vibrations at 3446 and 3361 cm−1, stretching vibrations of aliphatic and aromatic C–H in the 3100–2800 cm−1 region, an aromatic C![[double bond, length as m-dash]](https://www.rsc.org/images/entities/char_e001.gif) C stretching vibration at 1596 cm−1, and γ(C–H) in the aromatic ring at 769 cm−1. In addition, as can be seen in this spectrum the intensity of the hydroxyl stretching vibration has decreased significantly. This verifies that most of the hydroxyl groups had reacted with p-anthranilic acid.
C stretching vibration at 1596 cm−1, and γ(C–H) in the aromatic ring at 769 cm−1. In addition, as can be seen in this spectrum the intensity of the hydroxyl stretching vibration has decreased significantly. This verifies that most of the hydroxyl groups had reacted with p-anthranilic acid.
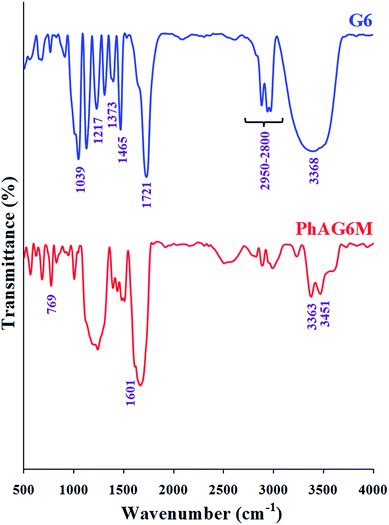
As can be seen from Fig. 2, the FTIR spectra of G6 and PhAG6M macromonomer exhibit similar bands but with minor differences.
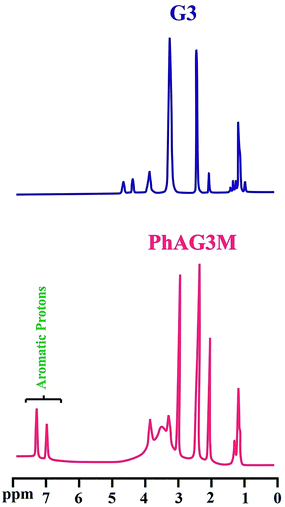
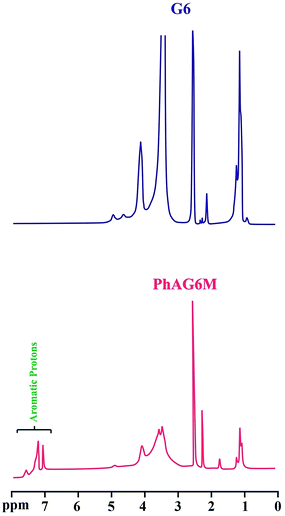
The synthesized polyesters (G3 and G6), and their corresponding macromonomers (PhAG3M and PhAG6M) were further characterized by means of 1H NMR spectroscopy. The 1H NMR spectra of the mentioned compounds are shown in Fig. 3 and 4. In the 1H NMR spectrum of G3 the unreacted linear and terminal hydroxyl groups (OHL and OHT, respectively) appear at 4.75, and 4.45 ppm, respectively. The chemical shifts at 3.95 and 3.35 ppm are related to CH2OR (OR: reacted; i.e. OH) and CH2OH (overlapped with H2O), respectively. The chemical shifts at 0.90 to 1.45 ppm correspond to the methylene and methyl groups in the sample.
The successful synthesis of the PhAG3M macromonomer was verified by the appearance of new chemical shifts at 6.95 to 7.40 ppm, which are related to the aromatic protons of the p-aminobenzoate group. In addition, the chemical shift related to the –NH2 group of p-aminobenzoate appears at 3.55 ppm. As can be seen from Fig. 4, the 1H NMR spectra of G6 and PhAG6M macromonomer exhibit similar chemical shifts but with minor differences.
The degree of polymerization (DPn), and the number average molecular weights (Mn) of the synthesized G3 and G6 can be calculated from 1H NMR data through the following equations. The results obtained are summarized in Table 1.
| Mn = MTMP + DPn × (Mbis–MPA − MH2O) |
3.2. Characterization of G3-PANI and G6-PANI
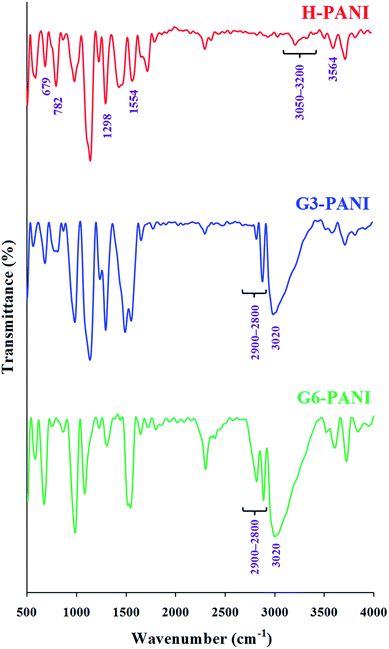
![[double bond, length as m-dash]](https://www.rsc.org/images/entities/char_e001.gif) C in the benzenoid units at 1554 cm−1, Caromatic–N stretching vibration at 1298 cm−1, and weak aromatic overtone and combination bands in the1900 to 1650 cm−1 region.38,39
C in the benzenoid units at 1554 cm−1, Caromatic–N stretching vibration at 1298 cm−1, and weak aromatic overtone and combination bands in the1900 to 1650 cm−1 region.38,39
The FTIR spectra of G3-PANI, and G6-PANI exhibits all the characteristic bands of PANI and the corresponding polyesters (G3 and G6, respectively). The most significant changes in these spectra can be listed as: the stretching vibrations of aliphatic C–H in the 2900–2800 cm−1 region, and the stretching vibration of hydroxyl group as a broad band centered at 3020 cm−1. It is important to note that, other bands of polyesters (G3 and G6) were overlapped with the sharp PANI bands.
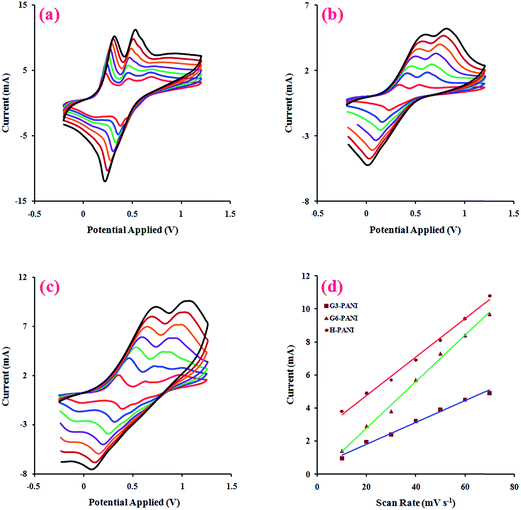
The effect of the potential scanning rate (V) on the peak currents of the chemically synthesized H-PANI, G3-PANI, and G6-PANI samples was investigated under cyclic voltammetric (CV) conditions at a scan rate of 10 to 70 mV s−1, using an aqueous solution of p-TSA (1.0 mol L−1) between −0.20 and +1.20 V versus the reference electrode. The polymer film was prepared on a glassy carbon (GC) microelectrode by casting. As can be seen from Fig. 7a, the typical CVs of H-PANI exhibits two anodic peaks at approximately 0.22 and 0.44 V versus the reference electrode. The CVs of the G3-PANI film (Fig. 7b) exhibits two anodic peaks at approximately 0.42 and 0.67 V versus the reference electrode. The typical CVs of the G6-PANI film (Fig. 7c), exhibited some qualitative similarities to those of the G3-PANI. Two anodic peaks were observed for this sample at approximately 0.65 and 0.95 V versus the reference electrode. It should be pointed out that for all of the samples the anodic peaks shift in the direction of higher potentials with increasing scan rates. Thus, the electrochemical oxidation/reduction of the casted films were chemically reversible, and in the case of G3-PANI and G6-PANI, PANI grafted onto the macromonomers still retained good redox activities, and the resulting polymers had good stabilities.
For additional evidence on the redox activities of the chemically synthesized samples the relationship between the peak current sizes versus the scan rates were determined. The linear relationships between the current and scan rate in the range of 10 to 70 mV s−1 for the chemically synthesized H-PANI, G3-PANI, and G6-PANI samples are shown in Fig. 7d.
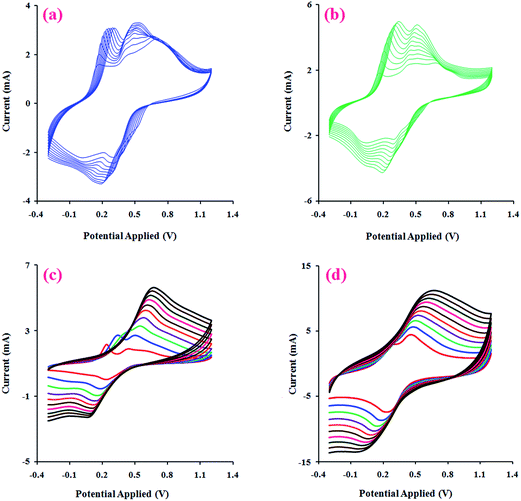
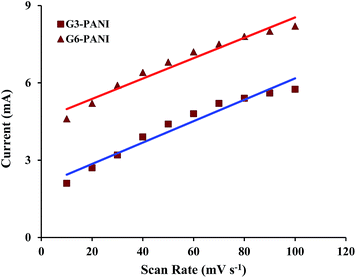
After electropolymerization of PANI onto the PhAG3M and PhAG6M macromonomers under the conditions described in the Experimental section (Fig. 8a and b), the effect of the potential scanning rate (V) on the peak currents for these samples was investigated under cyclic voltammetric conditions. As seen from Fig. 8c and d, both the electrochemically synthesized G3-PANI and G6-PANI show typical redox couples with anodic peaks at approximately 0.25–0.67 and 0.35–0.55 V versus the Ag/AgCl electrode, respectively. The electrocopolymerization possibilities of the PhAG3M, and PhAG6M macromonomers verifies the successful synthesis of the macromonomers. Because the grafting of PANI onto the mentioned macromonomers was initiated by the oxidation of the phenylamine groups coupled onto the polyesters. In addition, the linear relationship between the peak current sizes versus the scan rates for the electrochemically synthesized G3-PANI, and G6-PANI were determined as shown in Fig. 9.
3.3. Characterization of electrospun nanofibers
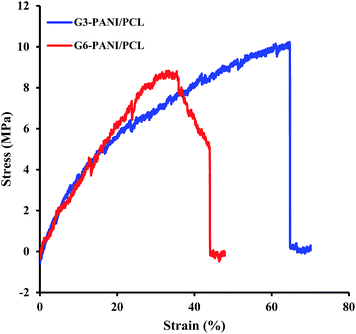
Electrospinning is suggested as an efficient and versatile approach for the preparation of biocompatible, conductive, and porous scaffolds to mimic the architecture and biological functions of the extracellular matrix (ECM). This technique has attracted a great deal of attention in the past decade for the fabrication of conductive scaffolds, mainly due to the high porosity, high surface-to-volume ratio, ultra-thin continuous fibers that can be prepared and the adjustable pore size distribution, as well as the simplicity and cost-effectiveness of this method.41,42The representative mechanical parameters of G3-PANI/PCL, and G6-PANI/PCL electrospun nanofibers are shown in Fig. 12, and the results obtained are summarized in Table 2. As can be seen both samples exhibited a linear elastic behaviour before failure. According to the results presented in Table 2, in comparison with G6-PANI/PCL, G3-PANI has higher tensile strength and elongation at break values, while the G6-PANI/PCL electrospun nanofibers have a higher Young’s modulus.
| Sample | Young’s modulus (MPa) | Tensile strength (MPa) | Elongation at break (%) |
|---|---|---|---|
| G3-PANI/PCL | 44.3 ± 6.7 | 10.2 ± 0.78 | 63.6 ± 11.4 |
| G6-PANI/PCL | 46.7 ± 5.3 | 8.7 ± 0.65 | 44 ± 9.8 |
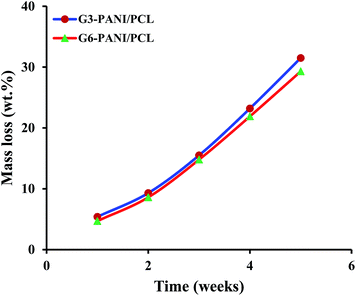
The in vitro degradability of the G3-PANI/PCL, and G6-PANI/PCL electrospun nanofibers was investigated by evaluating the morphological changes, and gravimetric measurements after soaking the nanofibers in phosphate-buffered saline (PBS; pH 7.4; Invitrogen, CA, USA) at 37 °C. The PBS was replaced every five days. After reaching the designed time, the specimens were retrieved, washed several times with double distilled water, dried using a freeze drying system, and then weighed. The mass loss percentage was calculated from: (Wi − Wr)/Wi; where Wi and Wr are the initial and the residual dry weights of the electrospun nanofibers.
As seen in Fig. 14, both G3-PANI/PCL, and G6-PANI/PCL electrospun nanofibers have a fast mass loss up to five weeks with a linear degradation trend. After five weeks the mass loses for G3-PANI/PCL, and G6-PANI/PCL samples were calculated to be 31.5, and 29.3 wt%, respectively.
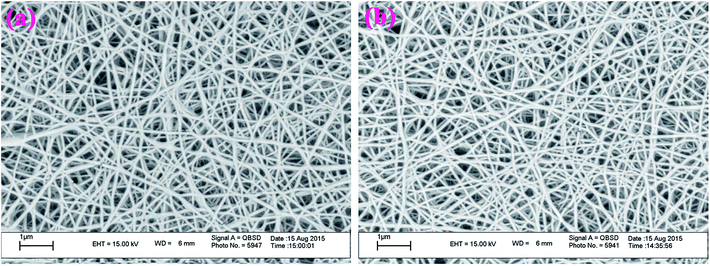
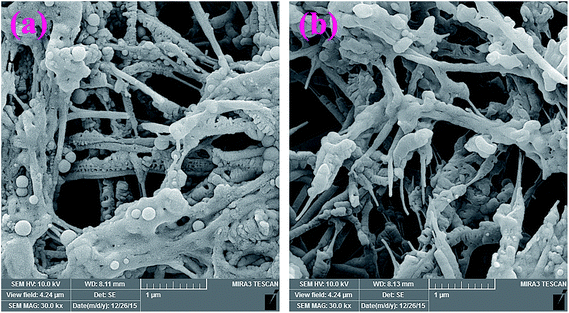
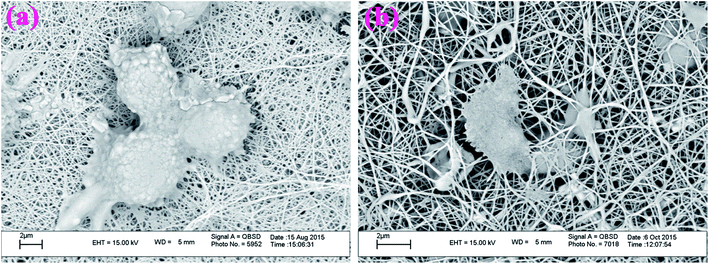
Additional evidence on the in vitro degradability of the electrospun nanofibers was obtained by evaluating the morphological changes after soaking the nanofibers in PBS at 37 °C. Fig. 15, shows the SEM images of the samples after 20 days soaking in PBS. As seen in this figure, both G3-PANI/PCL, and G6-PANI/PCL electrospun nanofibers undergo swelling and degradation after 20 days.
3.4. Electrical conductivity measurement
It is well known that conducting polymers (e.g., PANI) exhibit excellent cellular activities through electrical stimulation such as cell growth and cell migration, and this has led to a considerable interest in using PANI and their derivatives as pro-regenerative tissue scaffolds.17,32,46The electrical conductivities of the synthesized samples, and electrospun nanofibers were measured by a standard four-probe technique at room temperature. The experimental determinations were repeated five times for each sample to evaluate the sample accuracy. In addition, the conductivities were preserved for at least 150 hours post fabrication. Using the values of voltage (V), current passed through outer probes (I), and thicknesses (d) of the samples, the volume specific resistivities (ρ; Ω cm), and subsequently, the electrical conductivities (σ; S cm−1) of the samples were calculated using the following equations:
ρ = (V/I)(π/ln![[thin space (1/6-em)]](https://www.rsc.org/images/entities/char_2009.gif) 2)d 2)d |
| σ = 1/ρ |
The electrical conductivity results are summarized in Table 3. As can be seen from this table, the electrical conductivities of G3-PANI, and G6-PANI were slightly lower than those of H-PANI. Nevertheless, the lower electrical conductivity levels of these samples can be improved but at the price of solubility, processability, and biocompatibility.
| Sample | Volume specific resistivity (ρ; Ω cm) | Electrical conductivity (σ; S cm−1) |
|---|---|---|
| a The electrospun nanofibers were provided as given in Experimental section. | ||
| Chemically synthesized H-PANI | 1.19 | 0.84 |
| Chemically synthesized G3-PANI | 1.28 | 0.78 |
| Chemically synthesized G6-PANI | 1.30 | 0.83 |
| Electrochemically synthesized H-PANI | 1.03 | 0.97 |
| Electrochemically synthesized G3-PANI | 1.16 | 0.86 |
| Electrochemically synthesized G6-PANI | 1.05 | 0.95 |
| G3-PANI/PCL electrospun nanofibersa | 91 | 0.011 |
| G6-PANI/PCL electrospun nanofibersa | 71 | 0.014 |
In addition, as expected after electrospinning, the electrical conductivities of G3-PANI/PCL, and G6-PANI/PCL electrospun nanofibers decreased significantly, since PCL is a non-conductive material. On the other hand, the conductivity in the semiconductor range (∼10−5 S cm−1) might be sufficient to conduct a micro-current for stimulating neuronal cell proliferation, and possibly differentiation because the micro-current intensity is very low in the human body.47,48
3.5. Biocompatibility
4. Conclusion
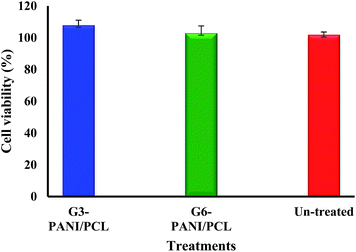
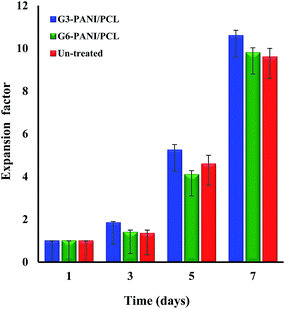
In summary, two novel three-dimensional, conducting, biocompatible, porous, and elastic scaffolds composed of hyperbranched aliphatic polyester, polyaniline, and poly(ε-caprolactone) for tissue regeneration application have been successfully fabricated via electrospinning. The electrical conductivity, electroactivity, and mechanical parameter studies showed that the fabricated scaffolds have suitable conductivities, and mechanical properties for them to be considered as potential materials for tissue engineering. The biocompatibility of the fabricated scaffolds were primarily investigated by assessing the adhesion and proliferation of the mouse fibroblast L929 cell line, and in vitro degradability testing. The biocompatibility analysis results showed that the prepared scaffolds were not able to induce cytotoxicity in the mentioned cell line, and improved the proliferation of cells. As a result, the fabricated scaffolds can be used as model systems for understanding the role of electrical signals in proliferation and differentiation of various cell lines. The intense interest in in situ tissue regeneration with conducting polymer based biomaterials is due to their conductivities, biocompatibilities, biodegradeabilites, versatile materials morphologies, and biomimetic mechanical properties. It is expected that these types of scaffolds will be further developed in the coming decades.Acknowledgements
We express our gratitude to the Payame Noor University, and Research Center for Pharmaceutical Nanotechnology, Tabriz University of Medical Sciences for supporting this project.References
- S. Camarero-Espinosa, B. Rothen-Rutishauser, C. Weder and E. J. Foster, Biomaterials, 2016, 74, 42–52 CrossRef CAS PubMed.
- D. W. Johnson, C. R. Langford, M. P. Didsbury, B. Lipp, S. A. Przyborski and N. R. Cameron, Polym. Chem., 2015, 6, 7256–7263 RSC.
- B. Subia, R. R. Rao and S. C. Kundu, Polym. J., 2015, 47, 819–825 CrossRef CAS.
- M. S. Zafar, Z. Khurshid and K. Almas, Tissue Eng. Regener. Med., 2015, 12, 387–397 CrossRef CAS.
- Y. Braeken, P. Verstappen, L. Lutsen, D. Vanderzande and W. Maes, Polym. Chem., 2015, 6, 6720–6731 RSC.
- E. Mooney, J. Mackle, D. Blond, E. O’Cearbhaill, G. Shaw, W. Blau, F. Barry, V. Barron and J. Murphy, Biomaterials, 2012, 33, 6132–6139 CrossRef CAS PubMed.
- X. Zhao, P. Li, B. Guo and P. X. Ma, Acta Biomater., 2015, 26, 236–248 CrossRef CAS PubMed.
- H. Baniasadi, A. Ramazani and S. Mashayekhan, Int. J. Biol. Macromol., 2015, 74, 360–366 CrossRef CAS PubMed.
- D. A. Stout, J. Yoo, A. N. Santiago-Miranda and T. J. Webster, Int. J. Nanomed., 2012, 7, 5653–5669 CAS.
- P. Gupta, S. Sharan, P. Roy and D. Lahiri, Carbon, 2015, 95, 715–724 CrossRef CAS.
- Y. Ganji, Q. Li, E. S. Quabius, M. Böttner, C. Selhuber-Unkel and M. Kasra, Mater. Sci. Eng., C, 2016, 59, 10–18 CrossRef CAS PubMed.
- S. Kumari and R. P. Singh, Int. J. Biol. Macromol., 2012, 50, 878–883 CrossRef CAS PubMed.
- J. Zhang, K. Qiu, B. Sun, J. Fang, K. Zhang, H. EI-Hamshary, S. S. Al-Deyabd and X. Mo, J. Mater. Chem. B, 2014, 2, 7945–7954 RSC.
- M. Jaymand, Prog. Polym. Sci., 2013, 38, 1287–1306 CrossRef CAS.
- B. Massoumi, N. Sorkhi-Shams, M. Jaymand and R. Mohammadi, RSC Adv., 2015, 5, 21197–21205 RSC.
- E. I. Yslas, P. Cavallo, D. F. Acevedo, C. A. Barbero and V. A. Rivarola, Mater. Sci. Eng., C, 2015, 51, 51–56 CrossRef CAS PubMed.
- J. G. Hardy, S. A. Geissler, D. Aguilar Jr, M. K. Villancio-Wolter, D. J. Mouser, R. C. Sukhavasi, R. C. Cornelison, L. W. Tien, R. C. Preda, R. S. Hayden, J. K. Chow, L. Nguy, D. L. Kaplan and C. E. Schmidt, Macromol. Biosci., 2015, 15, 1490–1496 CrossRef CAS PubMed.
- B. Massoumi, N. Aali and M. Jaymand, RSC Adv., 2015, 5, 107680–107693 RSC.
- N. A. Rahman, M. Gizdavic-Nikolaidis, S. Ray, A. J. Easteal and J. Travas-Sejdic, Synth. Met., 2010, 160, 2015–2022 CrossRef.
- C. Meier, I. Lifincev and M. E. Welland, Biomacromolecules, 2015, 16, 558–563 CrossRef CAS PubMed.
- X. J. Ma, J. Ge, Y. Li, B. L. Guo and P. X. Ma, RSC Adv., 2014, 4, 13652–13661 RSC.
- H. Cui, J. Shao, Y. Wang, P. Zhang, X. Chen and Y. Wei, Biomacromolecules, 2013, 14, 1904–1912 CrossRef CAS PubMed.
- S. Yang, K. F. Leong, Z. Du and C. K. Chua, Tissue Eng., 2001, 7, 679–689 CrossRef CAS PubMed.
- E. Zagar and M. Zigon, Macromolecules, 2002, 35, 9913–9925 CrossRef CAS.
- T. Qiu, L. Tang, Z. Fu, X. Tuo, Y. Li, D. Liu and W. Yang, Polym. Adv. Technol., 2004, 15, 65–69 CrossRef CAS.
- J. A. K. Twibanire and T. B. Grindley, Polymers, 2012, 4, 794–879 CrossRef.
- C. J. Hawker, R. Lee and J. M. J. Fréchet, J. Am. Chem. Soc., 1991, 113, 4583–4588 CrossRef CAS.
- M. G. McKee, S. Unal, G. L. Wilkes and T. E. Long, Prog. Polym. Sci., 2005, 30, 507–539 CrossRef CAS.
- E. Zagar and M. Zigon, Prog. Polym. Sci., 2011, 36, 53–88 CrossRef CAS.
- P. J. Flory, J. Am. Chem. Soc., 1952, 74, 2718–2723 CrossRef CAS.
- E. Malmstrom, M. Johansson and A. Hult, Macromolecules, 1995, 28, 1698–1703 CrossRef.
- B. Massoumi, S. Davtalab, M. Jaymand and A. A. Entezami, RSC Adv., 2015, 5, 36715–36726 RSC.
- V. Kafil, M. Eskandani, Y. Omidi, H. Nazemiyeh and J. Barar, RSC Adv., 2015, 5, 18041–18050 RSC.
- M. Eskandani, J. Abdolalizadeh, H. Hamishehkar, H. Nazemiyeh and J. Barar, Fitoterapia, 2015, 101, 1–11 CrossRef CAS PubMed.
- M. M. Farimani, M. B. Bahadori, S. A. Koulaei, P. Salehi, S. N. Ebrahimi, H. R. Khavasi and M. Hamburger, Fitoterapia, 2015, 106, 1–6 CrossRef CAS PubMed.
- G. G. Wallace and L. A. P. Kane-Maguire, Adv. Mater., 2002, 14, 953–960 CrossRef CAS.
- M. Planellas, M. M. Pérez-Madrigal, L. J. Del Valle, S. Kobauri, R. Katsarava, C. Alemán and J. Puiggalí, Polym. Chem., 2015, 6, 925–937 RSC.
- M. Hatamzadeh and M. Jaymand, RSC Adv., 2014, 4, 28653–28663 RSC.
- B. Massoumi, M. Hosseinzadeh and M. Jaymand, J. Mater. Sci.: Mater. Electron., 2015, 26, 6057–6067 CrossRef CAS.
- I. Rajzer, M. Rom, E. Menaszek and P. Pasierb, Mater. Lett., 2015, 138, 60–63 CrossRef CAS.
- A. T. Rad, N. Ali, H. S. R. Kotturi, M. Yazdimamaghani, J. Smay, D. Vashaee and L. Tayebi, J. Biomed. Mater. Res., Part A, 2014, 102, 4169–4181 CrossRef PubMed.
- E. G. R. Fernandes, V. Zucolotto and A. A. A. De-Queiroz, J. Macromol. Sci., Part A: Pure Appl.Chem., 2010, 47, 1203–1207 CrossRef CAS.
- N. A. Rahman, V. Feisst, M. E. Dickinson, J. Malmström, P. Rod-Dunbar and J. Travas-Sejdic, Mater. Chem. Phys., 2013, 138, 333–341 CrossRef.
- P. M. Gilbert, K. L. Havenstrite, K. E. G. Magnusson, A. Sacco, N. A. Leonardi, P. Kraft, N. K. Nguyen, S. Thrun, M. P. Lutolf and H. M. Blau, Science, 2010, 329, 1078–1081 CrossRef CAS PubMed.
- Q. Li, Z. Chang, G. Oliveira, M. Xiong, L. M. Smith, B. L. Frey and N. V. Welham, Biomaterials, 2016, 81, 104–113 CrossRef CAS PubMed.
- M. Li, Y. Guo, Y. Wei, A. G. MacDiarmid and P. I. Lelkes, Biomaterials, 2006, 27, 2705–2715 CrossRef CAS PubMed.
- L. Huang, J. Hu, L. Lang, X. Wang, P. Zhang, X. Jing, X. Wang, X. Chen, P. I. Lelkes, A. G. MacDiarmid and Y. Wei, Biomaterials, 2007, 28, 1741–1751 CrossRef CAS PubMed.
- T. H. Qazi, R. Rai and A. R. Boccaccini, Biomaterials, 2014, 35, 9068–9086 CrossRef CAS PubMed.
| This journal is © The Royal Society of Chemistry 2016 |

