 Open Access Article
Creative Commons Attribution 3.0 Unported Licence
Impurity effects on solid–solid transitions in atomic clusters†
B. E.
Husic
*ab,
D.
Schebarchov
*a and
D. J.
Wales
*a
aUniversity Chemical Laboratories, Lensfield Road, Cambridge CB2 1EW, UK. E-mail: Dmitri.Schebarchov@gmail.com; dw34@cam.ac.uk
bDepartment of Chemistry, Stanford University, Stanford, CA 94305, USA. E-mail: bhusic@stanford.edu
First published on 10th October 2016
Abstract
We use the harmonic superposition approach to examine how a single atom substitution affects low-temperature anomalies in the vibrational heat capacity (CV) of model nanoclusters. Each anomaly is linked to competing solidlike “phases”, where crossover of the corresponding free energies defines a solid–solid transition temperature (Ts). For selected Lennard-Jones clusters we show that Ts and the corresponding CV peak can be tuned over a wide range by varying the relative atomic size and binding strength of the impurity, but excessive atom-size mismatch can destroy a transition and may produce another. In some tunable cases we find up to two additional CV peaks emerging below Ts, signalling one- or two-step delocalisation of the impurity within the ground-state geometry. Results for Ni74X and Au54X clusters (X = Au, Ag, Al, Cu, Ni, Pd, Pt, Pb), modelled by the many-body Gupta potential, further corroborate the possibility of tuning, engineering, and suppressing finite-system analogues of a solid–solid transition in nanoalloys.
I. Introduction
Multi-metallic nanoparticles (nanoalloys1) exhibit size- and composition-dependent properties that can be exploited for various applications,2 including catalysis,3–6 plasmonics7 and chemical sensing.8 In catalysis, for example, the chemical activity is often attributed to a specific feature in the atomistic structure,3–5 such as a particular facet3 or mixing/segregation pattern;4 and to guarantee the intended functionality the desired features must be thermodynamically stable or sufficiently long-lived in a given environment. This precondition naturally motivates the study of nanoalloy thermodynamics9 and calls for capabilities to manipulate finite-system analogues of a phase transition, which are usually associated with a relatively sudden loss of structural integrity around a particular temperature. In the present study we focus on solid–solid transitions, where one solidlike phase is supplanted by a distinctly different one prior to complete melting, and we explore how such transitions are affected when the atomic identity of a single substituent is varied. We consider various models and set three main objectives: (i) to qualitatively compare with previous experimental10,11 and computational12–19 studies examining impurity/dopant effects on cluster melting; (ii) to discern generic behaviour that could be exploited for tuning various thermal instabilities in nanoalloys; and (iii) to demonstrate how the harmonic superposition approach (HSA)20,21 can be used to identify and explain impurity effects in atomic clusters at temperatures below melting.By measuring the heat capacity as a function of temperature, Jarrold et al.10,11 have shown that an aluminium impurity in size-selected GaN−1Al+ (N = 17, 19, 20, 30–33, 43, 46, 47) clusters has only a small effect on the melting behaviour,10 whereas a copper substituent in AlN−1Cu− (N = 49–62) generally causes a significant change.11 From previous computational studies we also know that impurity effects on cluster melting depend on the impurity15 as well as the host cluster,18 suggesting that selective substitutional doping may be a feasible strategy for tuning the finite-temperature behaviour. Indeed, a single impurity can cause the melting temperature of a cluster to decrease13 in some cases and increase14,16,17 in others. In particular, molecular dynamics simulations of Mottet et al.16 show the melting temperature of geometrically closed-shell AgN Mackay icosahedra22 increasing by up to 70 K when the central silver atom is substituted by nickel or copper, and this trend was correlated with impurity-dependent strain relaxation, which evidently favours the solidlike icosahedron over the liquidlike state.
The present study provides a broader evidence base for the behaviour described by Mottet et al.,16 demonstrating that it is not specific to melting. We show that a solid–solid transition can also be tuned via dopant-controlled stress/strain redistribution, provided: (i) the dopant-host atom-size mismatch is within a system-specific limit, which in turn can depend on the relative binding strength of the impurity; and (ii) one of the two competing phases is more inhomogeneously strained than the other, e.g. icosahedra competing with crystalline fcc fragments or Marks decahedra.23 A weakly and sometimes moderately mismatched substituent will stabilise the more strained competitor, which will cause the transition temperature to shift in the appropriate direction by an amount that depends on the magnitude of atom-size mismatch and, to a lesser degree, the relative binding strength. In general, however, transmuting a single atom can also cause surprisingly intricate effects on a preexisting transition, often completely destroying it or producing multi-stage permutational isomerisation, which we discern for a variety of Lennard-Jones24 (LJ) clusters and metal clusters modelled by the Gupta25,26 potential.
All our thermodynamic analysis is based on the HSA,20,21 which is a semi-quantitative approximation that has proved very useful in studies of atomic and molecular clusters.21,26–28 The approximation entails coarse-graining the classical partition function into additive contributions from geometrically distinct local minima on the underlying potential energy landscape. The problem of thermodynamic sampling, which is notoriously difficult for solid–solid transitions,29 is thus reduced to a one-off search for local minima. The search need not be constrained by any statistical distributions, because the approximate statistical weight of each minimum is given by a simple analytic form. The inherent separability and analyticity of the HSA make it particularly useful for developing a qualitative understanding of equilibrium structural transitions, and at sufficiently low temperatures, when anharmonic effects play a negligible role, the HSA is expected to be quantitatively accurate in the classical regime.
We revisit some general aspects of the HSA in section II, focusing on the origin and interpretation of heat capacity anomalies, and we consider illustrative examples based on generic two-state and three-state models. In section IIIA we define atomistic potentials to inform more complicated models for nanoalloys, while the procedure for obtaining a representative database of low-lying minima is outlined in section IIIB. Section IV contains all the results and discussion for selected Lennard-Jones (IVA) and Gupta (IVB) clusters, with the main conclusions summarised in section V. For completeness, in Appendix A we derive and carefully identify the inherent approximations of the HSA in the canonical ensemble.
II. General considerations
For a system of N classical atoms in volume V and at temperature T, the HSA amounts to approximating the canonical partition function as20,21 | (1) |
 | (2) |
![[small nu, Greek, macron]](https://www.rsc.org/images/entities/i_char_e0ce.gif) m are, respectively, the number of symmetry elements in the point group and the geometric mean normal mode vibrational frequency of m. Note that {Um,
m are, respectively, the number of symmetry elements in the point group and the geometric mean normal mode vibrational frequency of m. Note that {Um, ![[small nu, Greek, macron]](https://www.rsc.org/images/entities/i_char_e0ce.gif) m, om}Mm=1 are parameters whose values can be obtained from classical atomistic models (see section IIIA) or higher levels of theory.
m, om}Mm=1 are parameters whose values can be obtained from classical atomistic models (see section IIIA) or higher levels of theory.
Finite-system analogues of a phase transition can be identified from peaks (or other anomalies) in the heat capacity,
 | (3) |
 | (4) |
 | (5) |
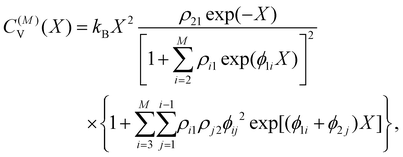
Within the limits of the harmonic approximation employed throughout this study, eqn (3) yields the vibrational component of the heat capacity. Note that CV(T) = 0 when M = 1, but for M > 1 it is instructive to consider the heat capacity in a more explicit form:
![[triple bond, length as m-dash]](https://www.rsc.org/images/entities/char_e002.gif) gi/gj = (
gi/gj = (![[small nu, Greek, macron]](https://www.rsc.org/images/entities/i_char_e0ce.gif) kjoj)/(
kjoj)/(![[small nu, Greek, macron]](https://www.rsc.org/images/entities/i_char_e0ce.gif) kioi) > 0. (Recall that the ground state has index 1.) It is now clear that the heat capacity depends on degeneracy ratios ρij = ρji−1 = ρikρkj and scaled energy differences
kioi) > 0. (Recall that the ground state has index 1.) It is now clear that the heat capacity depends on degeneracy ratios ρij = ρji−1 = ρikρkj and scaled energy differences , assuming j < i in the last equality. C(M)V tends to zero in the limits of T → 0 and T → ∞, so we expect at least one peak (sometimes referred to as a Schottky anomaly30–32) in the range 0 < T < ∞ for finite M > 1.
For M = 2 the position Xmax > 2 of the peak maximum is determined by the positive solution of
 | (6) |
This equation is solved graphically in Fig. 1, illustrating how Xmax > 0 depends on the degeneracy ratio ρ(= ρ12), and also showing a second negative solution which is unphysical. Note that varying ρ or Δ21 does not change the characteristic shape of the CV peak.
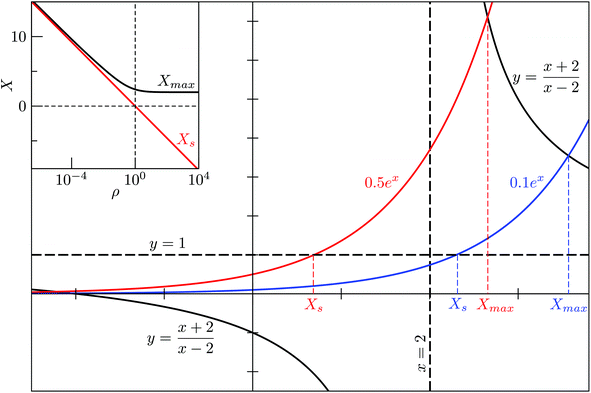 | ||
| Fig. 1 Graphical solution to eqn (6) and (9), demonstrating the effect of the degeneracy ratio ρ = g1/g2 in a two-state model. | ||
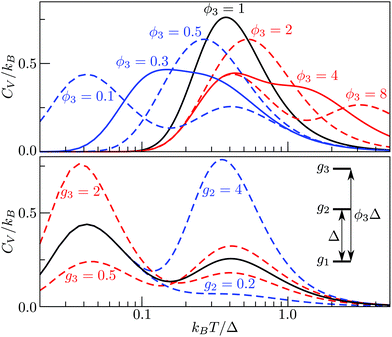
The situation becomes more interesting for M = 3, because varying, ρ2(= ρ21), ρ3(= ρ31 = ρ32ρ21) and ϕ3(= ϕ31 = 1 + ϕ32) affects the overall shape of the CV curve and can yield two separate peaks, as illustrated in Fig. 2. The height and relative position of the peak(s) can be systematically adjusted, with the degeneracy ratios largely affecting the height, and the energy-level ordering/spacing primarily dictating the relative positions of the two maxima. Interestingly, bimodality seems to occur only when the higher energy gap is considerably wider than the low energy gap, and it is conceivable that an M-level spectrum with ever-increasing gaps between consecutive energy levels may have M − 1 peaks in the CV curve. Although this limit is unlikely to be reached for atomistic systems, where high-energy minima are usually more densely spaced than low-energy minima, in section IVA we show that dopant-induced degeneracy splitting of the global minimum can result in more than one additional CV peak at low temperatures.
In section IV we consider databases containing M ≤ 104 geometrically-distinct low-lying minima, with {gm, Um}Mm=1 calculated from classical atomistic models. The overall shape of the resulting CV plots is often qualitatively similar to that of a three-level system, but in some particular cases we encounter up to four identifiable peaks. Crucially, the HSA allows us to quantify the contribution of subsets of local minima to an overall CV plot, which facilitates heuristic interpretation of various anomalies. A pronounced peak can often be associated with a transition from preferential occupation of a subset (α) of low-lying minima to a different subset (γ) of higher-lying minima.26 We interpret the subsets α and γ as two different phases, with the number of distinct minima (i.e. |α| and |γ|) providing a measure of the landscape contribution to the configurational entropy33 for each phase. Within this picture, the corresponding transition temperature Ts > 0 can be defined as the solution of Zα(T) = Zγ(T),27 where  represents a relative occupation probability. Equating these probabilities is equivalent to equating Helmholtz free energies, i.e. Fα(T)
 ![[triple bond, length as m-dash]](https://www.rsc.org/images/entities/char_e002.gif) −kBT
−kBT![[thin space (1/6-em)]](https://www.rsc.org/images/entities/char_2009.gif) ln
ln![[thin space (1/6-em)]](https://www.rsc.org/images/entities/char_2009.gif) Zα, and determining Ts amounts to finding the solution(s) of
Zα, and determining Ts amounts to finding the solution(s) of
 | (7) |
 in subsets α and γ has been factored out and
 | (8) |
To show that a CV peak does not always constitute a finite-system analogue of a phase transition, we again consider a two-state system with |α| = |γ| = ζα = ζγ = 1. Eqn (7) then yields a unique analytic solution:
ρ![[thin space (1/6-em)]](https://www.rsc.org/images/entities/char_2009.gif) exp(Xs) = 1, exp(Xs) = 1, | (9) |
 and
and  . The solution of (9) is compared to that of (6) in the inset of Fig. 1, illustrating that Xs < Xmax and, hence, Ts > Tmax for all ρ, with Tmax denoting the temperature at the CV maximum. While a CV peak with Tmax > 0 exists for all ρ, it constitutes a finite-system analogue of a phase transition with a physically meaningful Ts > 0 only when the high-energy phase has a higher entropy than the low-energy phase, i.e. ρ < 1. Also, Tmax ≈ Ts > 0 for ρ ≪ 1, and in most of the atomistic models considered in section IVA we find the discrepancy between Ts and the CV maximum is negligible.
The relatively simple expression in (9) is accurate only when the landscape component of the configurational entropy plays a negligible role. However, since we consider the contributions of both the landscape and the well vibrational entropies, we solve (7) numerically throughout this study (using the Powell hybrid method implemented in MINPACK34). Furthermore, we cannot eliminate the possibility of (7) having multiple solutions, which would describe a reentrant phase with lowest free energy in multiple, disjoint regions of the temperature domain. However, none of the cases considered below exhibit any signs of reentrant behaviour.
III. Models and methods
A. Atomistic potentials
In this study we consider a model binary cluster containing atomic species A (the host) and B (the dopant), with each atom i identified by a label li ∈ {A, B}. The (binary) Lennard-Jones potential is then given by | (10) |
For a more appropriate description of transition metal nanoalloys we employ the Gupta potential25,26
 | (11) |
 are system-specific parameters, and rij as in (10). We take the values fitted by Cleri and Rosato26 for homonuclear (li = lj) interactions, while the heteronuclear (li ≠ lj) values are calculated using the Lorentz–Berthelot rules: by applying geometric averaging for Alilj and ξlilj, i.e.
 , and arithmetic averaging for the remaining parameters, i.e. plilj = (plili + pljlj)/2. These “average” parameters are not expected to be the most accurate values for specific nanoalloys, but they are appropriate for our present purpose, which is to explore qualitative trends with respect to the relative size and binding strength of the dopant atom, by analogy with the LJ model.
The LJ and Gupta potentials permit calculation of atomic level stresses35 and, hence, the local (static) pressure Pi for each atom i,
 | (12) |
B. Databases of minima
Databases of local minima were harvested using generalised37 basin-hopping38,39 (GBH), with the details provided in ESI.† The database size is denoted by M, and the constituent local minima are indexed in the order of increasing potential energy. To rapidly survey in the neighbourhood of (εr, σr) = (1, 1) for doped LJN clusters, we took a simpler “enumerative” approach40 analogous to that of Cao et al.11 Starting from a database for a given homoatomic LJN system, split into sets αN and γN, we systematically generated α′N(εr, σr) and γ′N(εr, σr) by enumerating all the N permutations for each structure (referred to as the “parent”) in αN and γN, respectively, with one atom labelled as the dopant. The resulting configurations in α′N(εr, σr) and γ′N(εr, σr) were then requenched, all duplicates were removed, and the two sets of minima were fed into eqn (7) to calculate
  . While this approach avoids the cost of running GBH for each (εr, σr) independently, it may fail to locate new low-energy minima that can emerge when the mismatch in atom size or binding strength exceeds a certain (unknown) threshold. Hence, we restricted ourselves to a relatively small window in the two-parameter space, i.e. 0.97 ≤ σr ≤ 1.03 and 0.65 ≤ εr ≤ 1.5, and we checked the validity of α′N(εr, σr) and γ′N(εr, σr) at the four corners of this window by comparing with an independent GBH run.
IV. Results and discussion
A. Lennard-Jones clusters
We start by reviewing known26,27,41,42 solid–solid transitions in LJN clusters with N = 31, 38, 75 and 98. Fig. 3 shows how these transitions are manifested in a heat capacity plot: either as an isolated peak (LJ31, LJ75 and LJ98) or as a shoulder of a higher temperature peak (LJ38). Plotting the occupation probabilities reveals that the low-temperature CV anomaly in each case correlates with destabilisation of the global minimum (GM), whose occupancy drops below 0.5 at a system-specific reduced temperature and continues to decrease. To determine
  for each N, we solve (7) with the subset α containing just the corresponding GM, and the subset γ containing a particular number of consecutive higher-lying minima. The subset size |γ| is determined by first including just the second-lowest minimum in γ, then adding higher-lying minima in the database (of size M) one by one, in the order of increasing potential energy, until the numerical solution to eqn (7) no longer changes. The smallest |γ| required for acceptable convergence and the corresponding
  values are listed in Table 1 for all N considered, and we checked that these temperature values change by less than 1% if eqn (23) is used instead of (2).
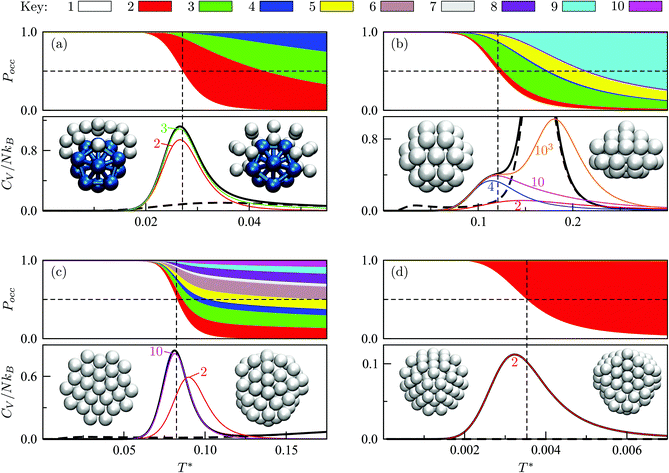 | ||
Fig. 3 Occupation probabilities (Pocc) of the ten lowest-energy minima and heat capacities (CV) plotted versus reduced temperature for (a) LJ31, (b) LJ38, (c) LJ75 and (d) LJ98. The occupation probabilities are stacked on top of each other in the order of increasing potential energy and colour-coded (see the key). The two lowest-energy minima in each case are shown for illustration. Converged CV plots are represented by a solid black curve, while the effect of excluding the global minimum is shown by a dashed curve. Convergence of the solid–solid peak is demonstrated by (thinner) intermediate C(M)V(T*) curves, with the corresponding size (M) of the minima database indicated by an integer. Vertical dashed lines mark the transition temperature  obtained by solving eqn (7) numerically, and the horizontal dashed lines correspond to Pocc = 0.5. obtained by solving eqn (7) numerically, and the horizontal dashed lines correspond to Pocc = 0.5. | ||
 for selected LJN clusters (calculated using 1 + |γ| lowest-lying minima) and the range of local pressure values (multiplied by a volume) for the lowest-lying minimum in subsets α (with |α| = 1) and γ
The GM of LJ31 is an incomplete Mackay icosahedron,22 and the structural transition in Fig. 3a can be described as surface polymorphism: the incomplete outer shell gains access to multiple configurations, one of which is anti-Mackay (the second-lowest minimum). For LJ38, the dominant CV peak in Fig. 3b has also been interpreted as a Mackay-to-anti-Mackay transition,41 while the low-temperature shoulder corresponds to the octahedral GM being supplanted by several incomplete icosahedra. Note that it is predominantly the third- and fifth-lowest minima that supplant the LJ38 GM, with the second- and fourth-lowest minima playing a negligible role (due to relatively low vibrational entropy). This observation shows that the ordering by potential energy may not necessarily reflect the precedence/occupancy at finite temperatures, which is perhaps not surprising since it is the free energy that becomes the determining factor. More importantly, it shows that one should not assume that local minima lying immediately above the GM will be statistically important.
For LJ75, the CV peak in Fig. 3c corresponds to the Marks decahedral23 GM giving way to numerous incomplete Mackay icosahedra.22 Although this particular transition has been discussed in some detail,27,43 we point out an apparent similarity with structural transitions occurring in certain metal clusters during solid–liquid phase coexistence.44 In the latter systems the formation of a significant liquidlike fraction at constant energy coincides with a sudden structural transition in the solidlike core. The present analysis of LJ75 suggests that the onset of surface polymorphism at constant temperature can also coincide with abrupt structural transformation of an entire cluster.
The solid–solid transformations in LJ31, LJ38 and LJ75 can be classified as “one-to-many”,28 because the GM is supplanted by multiple isomers with greater vibrational entropy. In contrast, Fig. 3d reveals a “one-to-one” transformation for LJ98: the two lowest-lying minima are sufficient to converge the low-temperature CV peak, while the occupation probabilities of higher-lying minima remains negligible until significantly higher temperatures. The same two-state model has been shown to reproduce the low-temperature heat capacity of LJ98 calculated using replica-exchange Monte Carlo quite well.42 Note that the transition temperature obtained using (7) is noticeably above the peak maximum, and the origin of this discrepancy was discussed in section II (Fig. 1 inset).
We now survey  as a function of εr and σr using the “enumerative” procedure described in section IIIB. The results (interpolated using a cubic spline) are plotted in Fig. 4, illustrating how
  is affected by small changes in the dopant characteristics. Although the accuracy of these “heat-maps” is expected to deteriorate when moving away from (εr, σr) = (1, 1) in the two-parameter space, the proximity of dark blue regions (where
  ) to the point (εr, σr) = (1, 1) indicates how sensitive (or robust) a given transition is to the dopant-host mismatch. We see that
  is generally more sensitive to size mismatch (σr) than relative binding strength (εr), which seems intuitive and consistent with the only available experimental data on the melting of doped metal clusters.10,11 What is less intuitive is that the transitions in LJ38 and LJ75 are significantly more sensitive to a smaller dopant (σr < 1), whereas LJ31 is more sensitive to a larger dopant (σr > 1). We address this particular issue below. Another predictable observation is that
  generally increases with εr > 1, and perhaps it eventually catches up with the system-specific melting temperature, but we shall not focus on this scenario. It is also worth mentioning that the “heat-map” for LJ98 (not shown) resembles those of LJ38 and LJ75, exhibiting a similar pattern but within a significantly narrower region around (εr, σr) = (1, 1).
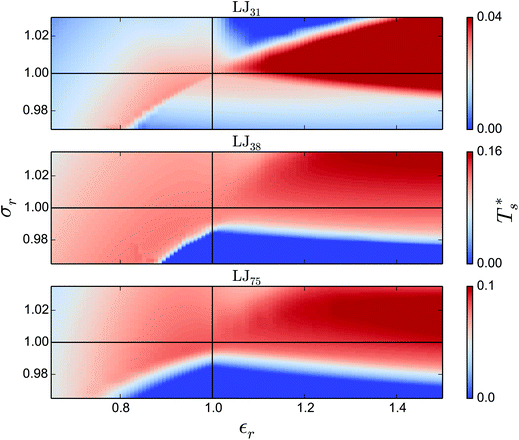 | ||
Fig. 4 Variation of the solid-solid transition temperature  with the relative size (σr) and binding strength (εr) of the dopant atom for 31 (top), 38 (middle) and 75-atom (bottom) clusters. with the relative size (σr) and binding strength (εr) of the dopant atom for 31 (top), 38 (middle) and 75-atom (bottom) clusters. | ||
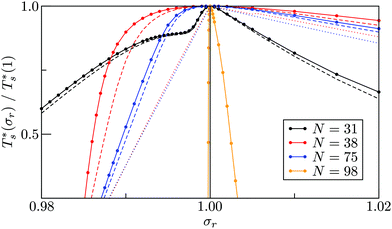
It is instructive to consider the effect of varying σr while keeping the binding strength fixed at εr = 1,40 in which case increasing or decreasing the dopant size lowers  (see Fig. 5). We link this behaviour to the homoatomic GM exhibiting a more homogeneous distribution of local pressure than the higher lying icosahedral minima (see Table 1). The centre of an icosahedral motif is under a particularly high compressive stress, which can be relieved by substituting the central atom with a smaller one.16,40 Hence,
  of doped LJ38 and LJ75 rapidly drops to zero in Fig. 4 when σr is below a critical value σ†r(εr) < 1, which in turn can be regulated by varying εr.
Fig. 5 clearly shows that in doped LJ38, LJ75, and LJ98 the transition temperature is more sensitive to σr < 1 than it is to σr > 1,40 and in the latter case the dopant energetically favours a surface site. This asymmetric sensitivity can also be explained by considering the local pressure: the difference in maximal expansive (negative) pressure between the competing morphologies is significantly smaller in magnitude than the difference in maximal compressive (positive) pressure, so a larger dopant has a smaller effect on  . The situation is in some sense reversed for LJ31, where
  is more sensitive to a larger dopant. In this case the competing morphologies share the same icosahedral core and are therefore similarly affected by a smaller dopant. However, a larger dopant atom occupying a surface site evidently has a greater destabilising effect on the Mackay capping layer, which seems intuitive since the anti-Mackay capping is less densely packed (see snapshots in Fig. 3a) and thus better able to accommodate expansive strain.
Rationalising the trends in Fig. 5 (and 4) solely in terms of local pressure is justified only if the entropic component of the impurity effect can be neglected. To check the role of vibrational entropy, we considered the case where minima in α′(σr) and γ′(σr) have ![[small nu, Greek, macron]](https://www.rsc.org/images/entities/i_char_e0ce.gif) set to the value for their “parent” (recall section IIIB) in α and γ, respectively. This artificial shift undoes the changes in vibrational entropy induced by adjustments in σr, and we find that it does not affect the qualitative nature of the trends in Fig. 5. Effects of the landscape contribution to configurational entropy can also be (largely) eliminated by restricting α′(σr) and γ′(σr) to include only biminima37,45—configurations whose energy cannot be improved by interchanging any two atoms (and then requenching)—with the corresponding point group order manually changed to that of the “parents” so as to preserve continuity at σr = 1. This manipulation has a more drastic effect on the
set to the value for their “parent” (recall section IIIB) in α and γ, respectively. This artificial shift undoes the changes in vibrational entropy induced by adjustments in σr, and we find that it does not affect the qualitative nature of the trends in Fig. 5. Effects of the landscape contribution to configurational entropy can also be (largely) eliminated by restricting α′(σr) and γ′(σr) to include only biminima37,45—configurations whose energy cannot be improved by interchanging any two atoms (and then requenching)—with the corresponding point group order manually changed to that of the “parents” so as to preserve continuity at σr = 1. This manipulation has a more drastic effect on the  curve, as shown for LJ38 and LJ75 in Fig. 5, but the overall qualitative picture remains unchanged:
  is still highest at σr = 1, and the mismatch-induced lowering of
  is still more gradual for σr > 1. Hence, the effect of σr on
  is determined primarily by changes in the potential energy, at least for the LJ clusters considered here, with entropy playing only a secondary (though quantitatively important) role. This conclusion suggests that impurity atoms energetically favouring interior sites within a cluster will generally have a stronger effect on structural transitions, because a higher coordinated impurity will have a greater share of the binding energy. However, solid–solid transitions that do not involve core restructuring may not follow this rule, as evidenced by LJ31.
Fig. 4 and 5 illustrate systematic shifts in  for a geometric solid–solid transition, and Fig. 6a shows the shift for LJ75 happening in unison with the
  computed using (7). (Similar consistency has also been demonstrated40 for LJ31 and LJ38.) Furthermore, Fig. 6a exhibits additional low-temperature peaks that also change with σr. Analogous CV features have been reported previously19 and attributed to dopant delocalisation prior to melting. Here we also interpret these features as indicators of non-degenerate permutational isomerisation (see below), and the fact that they change systematically with σr indicates potentially tunable behaviour. Interestingly, Fig. 6b shows that eliminating σr-induced variation in the configurational entropy accentuates the main CV peak and preserves the direction in which it shifts in response to σr, while the features associated with dopant delocalisation vanish completely. It would be interesting to investigate if the result will be the same for multiple impurity atoms, or whether some CV anomalies due to permutational isomerisation will be retained, but we will not pursue this issue further here.
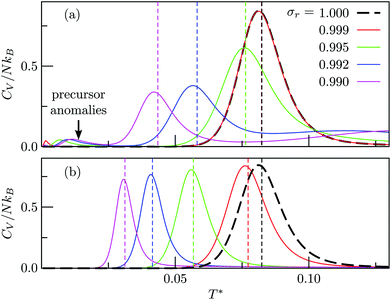 | ||
Fig. 6 Heat capacity of doped LJ75 clusters for different values of σr, calculated using either (a) all local minima or (b) just biminima. Dashed vertical lines mark the value of  calculated using (7). calculated using (7). | ||
Fig. 7 focuses on the precursor anomalies indicated in Fig. 6, revealing two separate peaks for doped LJ75 with σr = 0.992. This bimodality is apparently due to the dopant delocalising in two separate stages. The first stage corresponds to partial delocalisation of the dopant from the central site to the two adjacent ones along the five-fold symmetry axis. This interpretation is based on the fact that the lowest-temperature CV peak in Fig. 7 is reproduced by the two lowest-lying homotops with D5h and C5v point group symmetry. Note that eqn (7) yields  for this two-state subsystem, while the CV peak maximum is more in line with the first inflection point (near T* = 0.001) in the GM occupation probability. The disparity between the CV maximum and
  is consistent with the degeneracy ratio (recall Fig. 1 inset and section II) being close to unity, i.e. ρ = (
![[small nu, Greek, macron]](https://www.rsc.org/images/entities/i_char_e0ce.gif) k2o2)/(
k2o2)/(![[small nu, Greek, macron]](https://www.rsc.org/images/entities/i_char_e0ce.gif) k1o2) ≈ 0.5 in this case. The second precursor peak in Fig. 7 converges when all ten distinct permutations are considered, and the peak maximum at around T* = 0.01 is in better agreement with the solution of eqn (7), i.e.
k1o2) ≈ 0.5 in this case. The second precursor peak in Fig. 7 converges when all ten distinct permutations are considered, and the peak maximum at around T* = 0.01 is in better agreement with the solution of eqn (7), i.e. if the transition is between sets of two and eight minima. Hence, the second delocalisation stage here corresponds to the dopant gaining access to all the remaining sites within the underlying framework.
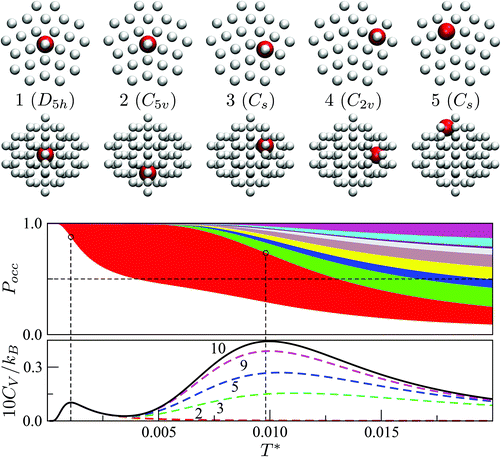 | ||
| Fig. 7 Occupation probabilities, stacked and colour-coded as in Fig. 3, and (partial) heat capacity plots focusing on the low-temperature precursor anomalies in Fig. 6 for σr = 0.992. The five lowest-energy minima are shown for illustration, viewed down the principal axis (top row) and along the orthogonal plane (bottom), with the larger red sphere representing the dopant. | ||
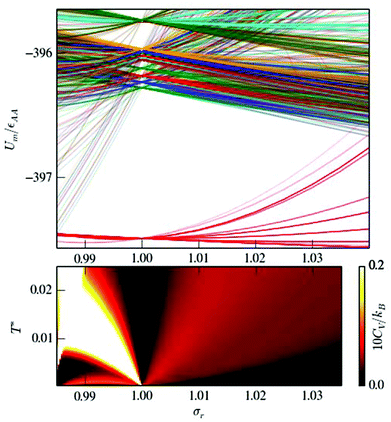
The origin of two-step permutational isomerisation in doped LJ75 is analogous to the generic three-state model discussed in section II. Fig. 8 shows that atom-size mismatch (σr ≠ 1) splits the degeneracy of the homoatomic (σr = 1) energy levels, and for σr < 1 the degeneracy of the homoatomic GM is split into two well-defined bunches. A narrow energy gap between the two energy levels in the low-lying bunch (i.e. the first two isomers illustrated in Fig. 7) and the significantly wider gap between the two bunches give rise to two CV peaks at low temperature. In contrast, the homoatomic GM degeneracy splitting for σr > 1 yields a more uniformly dispersed subspectrum, without anomalously large gaps or bunching, producing a very broad (and hardly noticeable) CV peak.
The main solid–solid peak for each σr in Fig. 6 is due to the wide gap at the low end of the energy spectrum for σr = 1, and Fig. 8 shows that introducing dopant-host mismatch (i.e. increasing |1 − σr|) effectively narrows this gap and eventually closes it completely. This gap closing has the effect of smearing and eventually eliminating the CV peak associated with the transformation from decahedral to icosahedral geometry. This observation reinforces the point made by Bixon and Jortner,46 that pronounced gaps in the energy spectrum play a central role in determining finite-system analogues of a phase transition, while a gapless spectrum with uniformly distributed energy levels will not produce sharp peaks in the heat capacity. We expect that multiple impurities will result in more intricate degeneracy splittings than in Fig. 8 and, hence, will likely produce a more uniform energy spectrum and a more smeared CV curve. This expected smearing would be analogous to the broadening of the specific heat divergence at a critical temperature,47 and it should be distinguished from the broadening arising from finite-size effects.48,49
To conclude our discussion of LJN clusters, we reiterate that geometric solid–solid transformations for N = 38, 75 and 98 are all affected very similarly when a substituent atom is transmuted. This similarity stems from the fact that these transformations correspond to a highly symmetric non-icosahedral GM being supplanted by numerous incomplete icosahedra. In the following section we consider model nanoalloys where the icosahedral order is less prevalent (for known reasons50–53), and the diversity of solid–solid transitions is considerably richer. These examples correspond to the discrete values provided for us by the periodic table.
B. Gupta clusters
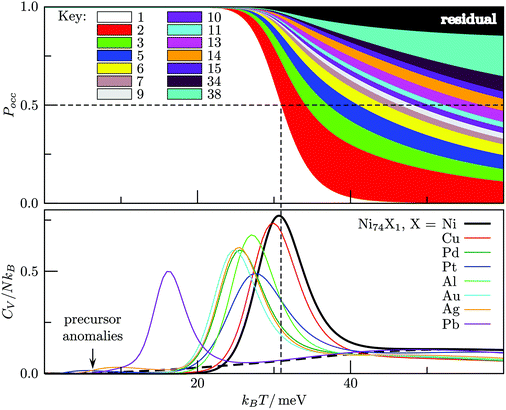
We used the HSA to explore solid–solid transitions in AgN, AlN, AuN, CuN, NiN, PdN, and PtN clusters with N = 38 and 75, and in all these cases the GM has the same atomic structure as the LJN counterpart, but the structure and energetic ordering of higher lying minima varies among metals. We found cases with multimodal CV plots, with the structural interpretation of each peak also varying among metals, but we leave the details for a separate study.A solid–solid transition most closely resembling its LJ counterpart was found in Ni75, where the Marks decahedral23 GM is supplanted by numerous incomplete Mackay icosahedra22 at kBT ≈ 31 meV (see Fig. 9). The insight gained from LJN clusters leads us to expect that substitutional doping will lower the transition temperature of Ni75, provided the dopant binding is weaker than Ni–Ni binding. A database of around 104 low-lying minima (harvested using the GBH procedure described in ESI†) for Ni74X clusters (with X = Au, Ag, Al, Cu, Ni, Pd, Pt, Pb) largely confirms this expectation. Fig. 9 shows that the most closely size-matched dopant (Cu) yields the smallest downward shift, while the most size-mismatched dopant (Pb) yields the largest shift. Note that here we define the overall dopant-host mismatch based on the relative position of different atomic species in Fig. 10, which illustrates where various metals lie in an empirical two-parameter space and can provide some guidance when selecting a dopant for a given host. Also note that the shift in Fig. 9 is less clear-cut for substituents with intermediate atom-size mismatch, indicating that additional factors may also be involved here.
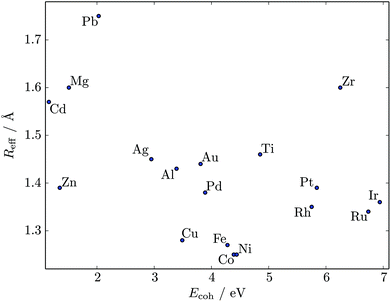 | ||
| Fig. 10 Scatter plot of cohesive energy Ecoh (per atom) and effective atomic radius Reff for various 12-coordinated (i.e. fcc or hcp) metals.26,54 | ||
The Pb-induced downward shift of the CV peak by kBΔT ≈ 15 meV (ΔT ≈ 170 K) is reinforced by the considerably smaller cohesive energy of Pb in comparison to Ni. However, the Pt-induced downward shift indicates that atom-size mismatch is the more important factor, because the considerably higher cohesive energy of Pt (relative to Ni) would push the CV peak up were it not for the larger effective size of Pt. The shift also correlates with local atomic-level pressure, by analogy with LJ75: a larger-sized dopant stabilises the incomplete icosahedral framework, because it contains sites with higher maximal expansive stress. The lowest value of the quantity defined in (12) is −0.55 eV for the Marks decahedral GM and −1.10 eV for the lowest-lying icosahedron-based isomer of Ni75, and in both structures sites with the maximal expansive pressure are localised at (or near) pentagonal vertices.
The CV plots in Fig. 9 also show broad peaks due to permutational isomerisation in Ni74Ag and Ni74Pt. These precursor peaks arise just from the two lowest-lying minima in each case, which are illustrated in Fig. 11. Although the situation is analogous to that in doped LJ75 with σr > 1 (recall Fig. 8), it is interesting that the two competing permutational isomers are different for each dopant, which can be explained by the disparity in the cohesive energies of Ag and Pt. This observation shows that subtly different permutational-isomerisation transitions can occur in clusters with the same geometric framework.
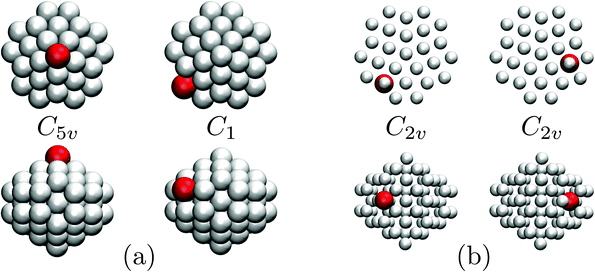 | ||
| Fig. 11 The two lowest-energy minima for (a) Ni74Ag and (b) Ni74Pt Marks decahedra,23 viewed down the principal axis (top) and along the orthogonal plane (bottom). The larger red sphere represents the dopant, and the host atom size is varied for clarity. | ||
Metal clusters modelled by a many-body potential generally exhibit a diminished propensity for icosahedral order50–53 compared to Lennard-Jones clusters, with Au55 providing the most striking example.51–53 Although this size corresponds to a “magic” number (i.e. geometrically closed-shell) Mackay icosahedon,22 the GM is actually a defective fcc/hcp structure with C1 point group symmetry. Fig. 12 shows its occupation probability diminishing relative to several amorphous structures with higher vibrational entropy, with the transition marked by a pronounced CV peak at kBT ≈ 8 meV. Although the six lowest-energy minima are all predominantly fcc-like and therefore may be regarded as constituents of one phase, the combined occupation probability of isomers 2 to 6 never exceeds 0.07. Isomers 7, 8, 9 and 14 collectively become the most populated at kBTs ≳ 8 meV, constituting a phase that can be characterised (using common-neighbour analysis28,49,55) as amorphous with partial icosahedral order.
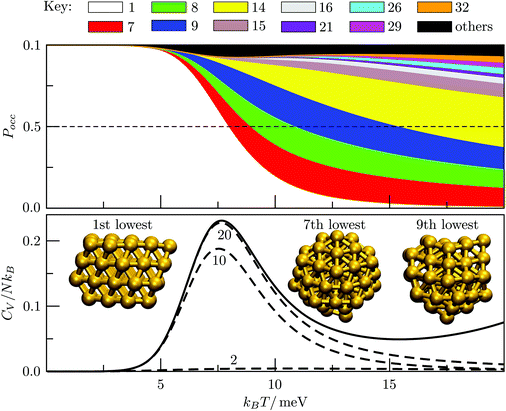 | ||
| Fig. 12 Occupation probabilities (stacked on top of each other) and heat capacity plots for Au55, with three of the most populated structures illustrated. | ||
We note that Garzón et al.52,53 have used the Rosato, Guillope and Legrand (RGL)56 parametrization of the Gupta potential and suggested an amorphous GM structure for Au55. However, we find that reoptimising the fcc GM illustrated in Fig. 12 with the reduced RGL parameters (i.e. with ξ set to unity as in ref. 53) yields −52.65827, which is slightly lower than that of the energy of the lowest-lying amorphous isomer (−52.65684). It is also worth noting that in both cases the homoatomic Mackay icosahedron22 is not even in the 104 lowest-lying minima for Au55.
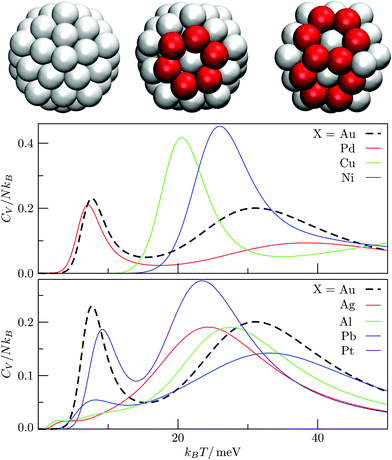
The competing structures contributing to the CV peak in Fig. 12 exhibit a similar homogeneous distribution of local pressure, so the stress-redistribution argument employed in section IVA and for Ni75 does not apply in this case, and we cannot say anything about the potential tunability. In fact, we find that the low-temperature peak essentially vanishes when one Au atom is substituted by a closely-matched one (e.g. Ag or Al shown in Fig. 13b), because it energetically destabilises fcc order by promoting one of the amorphous isomers to the GM. Similar reordering occurs for Pb and Pt dopants, and the pronounced low-temperature peak in each case indicates a transition of a distinctly different kind: one where an amorphous GM gives way to other amorphous structures with higher vibrational entropy, whilst the low-lying fcc/hcp isomers are statistically insignificant.
The interpretation of the low-temperature peak again changes when one Au atom is substituted with Pd, Cu or Ni, which all have a smaller effective atom size than Au. Each one of these impurities promotes the Mackay icosahedron22 to the GM, and the low-temperature CV peak corresponds to partial amorphization of the icosahedron surface via the rosette-like mechanism,57 with a fivefold vertex (or two adjacent ones) transforming into a hexagonal ring, while the impurity remains at the central site. This type of solid-solid transition occurs because surface amorphised icosahedra have more vibrational entropy. It is interesting that decreasing the dopant atom size (i.e. Pd → Cu → Ni) energetically stabilizes the ideal icosahedron and just the two partially amorphised variants illustrated in Fig. 13a, with the perfect icosahedron stabilised relatively more than the amorphised variant(s), hence the peak in Fig. 13a shifts to the right by as much as kBΔT ≈ 20 meV (ΔT ≈ 230 K). This trend demonstrates that selective substitutional doping can help to suppress surface amorphisation, which could be particularly important for catalysis, and it is conceivable that similar trends may be found for other types of surface reconstruction/roughening in nanoalloys. The behaviour in X-doped Au54X clusters also leads to two somewhat counterintuitive points: (i) a cluster surface transition can be tuned by substituting a central atom; and (ii) a highly mismatched impurity can lead to more predictable behaviour than a closely-matched one.
V. Summary and conclusions
We have demonstrated how the harmonic superposition approach20,21 can be used to explain the effects of substitutional doping on solid–solid transitions in atomic clusters. We first considered a selection of Lennard-Jones (LJN<100) clusters with a preexisting transition and analysed the effects of small changes in the relative atom size and binding strength of the impurity. We then focused on Ni74X and Au54X clusters (with X = Au, Ag, Al, Cu, Ni, Pd, Pt, Pb), modelled by a many-body Gupta potential, to further illustrate that a single impurity atom can produce systematic trends and/or surprisingly intricate (yet predictable) effects on a solid–solid transition in nanoalloys. Our analysis corroborates earlier studies of impurity effects16,17 and sheds new light on the tunability of morphological transitions. We now summarise our main conclusions, which we believe may be useful for rational design of nanoalloy catalysts.A solid–solid transition temperature, when defined by equating the free energies of two competing phases, is generally more sensitive to the relative size than to the binding strength of the impurity atom. This result is consistent with previous experiments10,11 and calculations.12–16,18,19 More importantly, we have shown that a given solid–solid transition supports only a limited range of atom-size mismatch, and exceeding the system-specific limits will destroy the transition. Hence, a transition temperature can be tuned only by impurities with mismatch magnitude below a certain tolerance, which is generally larger for surface (as opposed to interior) impurities. The tolerance does not exhibit a simple dependence on system size, but rather is determined by details of the underlying potential energy landscape.
From the energy landscape perspective, small changes in the dopant characteristics cause an appreciable and systematic redistribution of local minima along the energy axis, while the effect on the corresponding local curvatures is relatively insignificant. Hence, impurity effects on solid–solid transitions are largely manifested in the discrete energy spectrum of low-lying minima (i.e. metastable states), which describes the main energetic factors as well as the landscape contribution to configurational entropy.33
In certain tunable cases we found that dopant effects can also be linked to specific features in the distribution of atomic-level stresses. This correlation was discussed in the context of melting by Mottet et al.,16 who showed that the solid–liquid transition temperature of Ag clusters can be raised by a smaller impurity. Our analysis extends these results by showing that both larger and smaller impurities can lower a solid–solid transition temperature. These seemingly opposing trends are consistent with one general principle: a size mismatched impurity will generally favour a more inhomogeneously stressed phase. This principle can help predict the direction in which a transition temperature will shift after doping, provided the atomic-level stress in structures representing the two competing phases are known.
Interestingly, we found that a single impurity atom can give rise to more than one additional anomaly in the low-temperature heat capacity, indicating that dopant delocalisation within a particular geometric framework can proceed via two separate stages (and possibly more in larger systems). This result constitutes a simple analogue of the behaviour reported by Rubinovich et al.32 for model Pd–Cu nanoalloys, where the solid-solution-like transition occurred in multiple stages of partial mixing/segregation staggered over a finite temperature range.
From a modelling perspective, the difficulty of examining multiple-impurity effects will grow rapidly with the number of impurities, because the set of distinct local minima required for the harmonic superposition approach will be significantly greater than those used here. However, we believe this difficulty can be (at least partially) overcome by systematically reducing the database of minima to a smaller representative set containing only biminima.45 In the present study we have shown that biminima alone can retain the necessary features that give rise to geometric structural transitions, and it would be interesting to examine to what extent permutational transitions are preserved by biminima when there is more than one impurity atom.
Appendix A: HSA derivation
Consider a system of N potentially distinguishable particles, each described by Cartesian coordinates r ∈![[Doublestruck R]](https://www.rsc.org/images/entities/char_e175.gif) 3 (restricted to some finite volume V) and velocities ṙ ∈
3 (restricted to some finite volume V) and velocities ṙ ∈ ![[Doublestruck R]](https://www.rsc.org/images/entities/char_e175.gif) 3. The canonical partition function Z(N, V, T) can be written as
3. The canonical partition function Z(N, V, T) can be written as | (13) |
 | (14) |
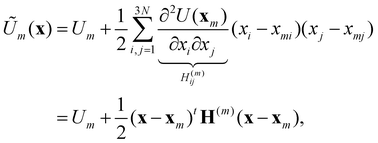
Now consider a local approximation to U(x) based on the Taylor expansion about a local minimum xm:
 | (15) |
 | (16) |
 , and δij the Kronecker delta. The eigenvector associated with λi is given by the i'th column of A. Also, note that it is not necessary to transform the velocities ẋ in unison with the coordinates x, but doing so is useful for separating out the kinetic energy contributions associated with particular normal modes. Now, substituting Ũm(x) for U(x) in (14) and transforming the coordinates according to (15) yields
 | (17) |
 in (13) and transforming the differentials, i.e.
 , yields
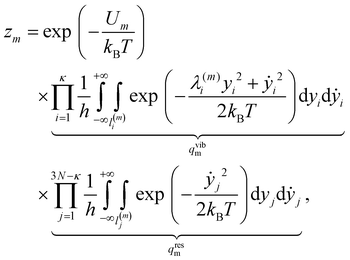 | (18) |
Now, each configuration integral (with respect to a component of y) ought to be evaluated over a finite range l(m)i/j for the catchment basin of m, which cannot be easily determined. For vibrational modes, it is conventional to extend the range of integration over all space, i.e. l(m)i → (−∞, +∞); and, using the standard result  for a > 0, it becomes possible to evaluate the κ double integrals analytically to obtain
 | (19) |
 | (20) |
| qtransm = Vh−3M3/2(2πkBT)3/2, | (21) |
| qrotm = 8π2h−3|Im|1/2(2πkBT)3/2, | (22) |
A global approximation to the partition function (13) is constructed by superposing the local approximations for geometrically-distinct local minima, yielding eqn (1) with the degeneracy factor
| gm = nmqtransmqrotmqvibm, | (23) |
 | (24) |
Note that the temperature dependence in qvibm, qrotm and qtransm has no effect on thermodynamic quantities due to cancellations when computing ensemble averages using eqn (4). Further, recent studies28,59 show that the moment-of-inertia terms (i.e. |Im|) in qrotm also largely cancel out, which is why we use the simpler expression for the effective degeneracy stated in (2).
Finally, we restate the three main sources of error intrinsic to the HSA, which have usually been discussed in the microcanonical (as opposed to canonical) context.60 Firstly, errors will arise when the database of local minima is not fully representative, but these errors can in principle be eliminated by systematically extending the database. The second source of error is due to the neglect of anharmonic terms in the local approximations of the potential, which can also be systematically corrected by incorporating higher-order terms in the Taylor series expansion. Finally, errors can arise from the overlap between different local approximations in the configuration domain. This particular error is introduced when the finite limits of integration in (18) are extended over an infinite range, which is, in fact, necessary for analytic evaluation. In principle, each configuration integral should be evaluated over the basin of attraction for the local minimum, but this cannot be done analytically. Hence, correcting for the overlap error would inevitably require sacrificing much of the analytic utility of the HSA.
Acknowledgements
This work was funded by the ERC and EPSRC grant EP/J010847/1. BEH also acknowledges the Gates Cambridge Trust for financial support. The authors are very grateful to Dr Aleks Reinhardt for a critical reading of the manuscript, and DS would like to thank Marco Eckhoff with Dr Andy Ballard for fruitful discussions of the harmonic superposition approach.References
- R. Ferrando, J. Jellinek and R. L. Johnston, Chem. Rev., 2008, 108, 845 CrossRef CAS PubMed.
- Nanoalloys: from fundamentals to emergent applications, ed. F. Calvo, Elsevier, 2013 Search PubMed.
- K. Zhou and Y. Li, Angew. Chem., Int. Ed., 2012, 51, 602 CrossRef CAS PubMed.
- D. Wang, H. L. Xin, R. Hovden, H. Wang, Y. Yu, D. A. Muller, F. J. DiSalvo and H. D. Abruña, Nat. Mater., 2013, 12, 81 CrossRef CAS PubMed.
- S. Shan, V. Petkov, B. Prasai, J. Wu, P. Joseph, Z. Skeete, E. Kim, D. Mott, O. Malis, J. Luo and C.-J. Zhong, Nanoscale, 2015, 7, 18936 RSC.
- W. Luo, M. Sankar, A. M. Beale, Q. He, C. J. Kiely, P. C. Bruijnincx and B. M. Weckhuysen, Nat. Commun., 2015, 6, 6540 CrossRef PubMed.
- V. Amendola, S. Scaramuzza, S. Agnoli, S. Polizzi and M. Meneghetti, Nanoscale, 2014, 6, 1423 RSC.
- S. Tong, Y. Xu, Z. Zhang and W. Song, J. Phys. Chem. C, 2010, 114, 20925 Search PubMed; X. Li, J. Yao, F. Liu, H. He, M. Zhou, N. Mao, P. Xiao and Y. Zhang, Sens. Actuators, B, 2013, 181, 501 CrossRef CAS; C. Wadell, F. A. A. Nugroho, E. Lidstrm, B. Iandolo, J. B. Wagner and C. Langhammer, Nano Lett., 2015, 15, 3563 CrossRef PubMed.
- F. Calvo, Phys. Chem. Chem. Phys., 2015, 17, 27922 RSC.
- C. M. Neal, A. K. Starace and M. F. Jarrold, J. Phys. Chem. A, 2007, 111, 8056 CrossRef CAS PubMed.
- B. Cao, A. K. Starace, C. M. Neal, M. F. Jarrold, S. Núñez, J. M. López and A. Aguado, J. Chem. Phys., 2008, 129, 124709 CrossRef PubMed.
- J. C. Shelley, R. J. L. Roy and F. G. Amar, Chem. Phys. Lett., 1988, 152, 14 CrossRef CAS; I. Garźon, X. Long, R. Kawai and J. Weare, Chem. Phys. Lett., 1989, 158, 525 CrossRef; I. L. Garźon, X. P. Long, R. Kawai and J. H. Weare, Z. Phys. D: At., Mol. Clusters, 1989, 12, 81 CrossRef.
- C. Hock, S. Straßburg, H. Haberland, B. von Issendorff, A. Aguado and M. Schmidt, Phys. Rev. Lett., 2008, 101, 023401 CrossRef CAS PubMed; A. Lyalin, A. Hussien, A. V. Solov'yov and W. Greiner, Phys. Rev. B: Condens. Matter, 2009, 79, 165403 CrossRef.
- U. Ojha, K. G. Steenbergen and N. Gaston, J. Chem. Phys., 2013, 139, 094309 CrossRef PubMed.
- A. Aguado, L. E. González and J. M. López, J. Phys. Chem. B, 2004, 108, 11722 CrossRef CAS.
- C. Mottet, G. Rossi, F. Baletto and R. Ferrando, Phys. Rev. Lett., 2005, 95, 035501 CrossRef CAS PubMed.
- D. Cheng, S. Huang and W. Wang, Phys. Rev. B: Condens. Matter, 2006, 74, 064117 CrossRef.
- P. Chandrachud, K. Joshi and D. G. Kanhere, Phys. Rev. B: Condens. Matter, 2007, 76, 235423 CrossRef.
- N. Quesada and G. E. Moyano, Phys. Rev. B: Condens. Matter, 2010, 82, 054104 CrossRef.
- F. H. Stillinger and T. A. Weber, Phys. Rev. A, 1982, 25, 978 CrossRef CAS; D. J. Wales, Mol. Phys., 1993, 78, 151 CrossRef; G. Franke, E. R. Hilf and P. Borrmann, J. Chem. Phys., 1993, 98, 3496 CrossRef; F. Calvo, J. P. K. Doye and D. J. Wales, J. Chem. Phys., 2001, 115, 9627 CrossRef.
- D. J. Wales, Energy landscapes, Cambridge University Press, 2003 Search PubMed.
- A. L. Mackay, Acta Crystallogr., 1962, 15, 916 CrossRef CAS.
- L. D. Marks, Philos. Mag. A, 1984, 49, 81 CrossRef CAS.
- J. E. Jones, Proc. R. Soc. London, Ser. A, 1924, 106, 463 CrossRef CAS.
- R. P. Gupta, Phys. Rev. B: Condens. Matter, 1981, 23, 6265 CrossRef CAS.
- F. Cleri and V. Rosato, Phys. Rev. B: Condens. Matter, 1993, 48, 22 CrossRef CAS; J. P. K. Doye, D. J. Wales and M. A. Miller, J. Chem. Phys., 1998, 109, 8143 CrossRef; J. P. K. Doye and D. J. Wales, Phys. Rev. Lett., 1998, 80, 1357 CrossRef.
- J. P. K. Doye and F. Calvo, Phys. Rev. Lett., 2001, 86, 3570 CrossRef CAS PubMed; J. P. K. Doye and F. Calvo, J. Chem. Phys., 2002, 116, 8307 CrossRef.
- E. Panizon and R. Ferrando, Phys. Rev. B: Condens. Matter, 2015, 92, 205417 CrossRef.
- V. A. Sharapov, D. Meluzzi and V. A. Mandelshtam, Phys. Rev. Lett., 2007, 98, 105701 CrossRef PubMed.
- W. Schottky, Phys. Z., 1922, 23, 448 Search PubMed; E. F. Westrum, J. Chem. Thermodyn., 1983, 15, 305 CrossRef CAS.
- P. H. E. Meijer, J. H. Colwell and B. P. Shah, Am. J. Physiol., 1973, 41, 332 CrossRef CAS.
- L. Rubinovich, M. I. Haftel, N. Bernstein and M. Polak, Phys. Rev. B: Condens. Matter, 2006, 74, 035405 CrossRef.
- F. Sciortino, W. Kob and P. Tartaglia, J. Phys.: Condens. Matter, 2000, 12, 6525 CrossRef CAS; T. V. Bogdan, D. J. Wales and F. Calvo, J. Chem. Phys., 2006, 124, 044102 CrossRef PubMed; D. J. Wales, Chem. Phys. Lett., 2013, 584, 1 CrossRef.
- J. J. Moré, B. S. Garbow and K. E. Hillstrom, User guide for MINPACK-1, Technical Report ANL-80-74, Argonne Nat. Lab., Argonne, IL, 1980; E. Jones, T. Oliphant and P. Peterson, et al., SciPy: Open source scientific tools for Python, 2001 Search PubMed.
- V. Vitek and T. Egami, Phys. Status Solidi B, 1987, 144, 145 CrossRef CAS.
- B. Zhu and M. Hou, Eur. Phys. J. D, 2012, 66, 1 CrossRef CAS; K. Laasonen, E. Panizon, D. Bochicchio and R. Ferrando, J. Phys. Chem. C, 2013, 117, 26405 Search PubMed.
- D. Schebarchov and D. J. Wales, Phys. Chem. Chem. Phys., 2015, 17, 28331 RSC.
- Z. Li and H. A. Scheraga, Proc. Natl. Acad. Sci. U. S. A., 1987, 84, 6611 CrossRef CAS.
- D. J. Wales and J. P. K. Doye, J. Phys. Chem. A, 1997, 101, 5111 CrossRef CAS.
- B. E. Husic, Dopant effects on solid-solid transitions in atomic clusters, M. Phil., University of Cambridge, 2015 Search PubMed.
- V. A. Mandelshtam and P. A. Frantsuzov, J. Chem. Phys., 2006, 124, 204511 CrossRef PubMed.
- V. A. Sharapov and V. A. Mandelshtam, J. Phys. Chem. A, 2007, 111, 10284 CrossRef CAS PubMed.
- V. A. Mandelshtam, P. A. Frantsuzov and F. Calvo, J. Phys. Chem. A, 2006, 110, 5326 CrossRef CAS PubMed.
- D. Schebarchov and S. C. Hendy, Phys. Rev. Lett., 2005, 95, 116101 CrossRef CAS PubMed; D. Schebarchov and S. C. Hendy, Phys. Rev. B: Condens. Matter, 2006, 73, 121402 CrossRef; D. Schebarchov and S. C. Hendy, Eur. Phys. J. D, 2007, 43, 11 CrossRef.
- D. Schebarchov and D. J. Wales, Phys. Rev. Lett., 2014, 113, 156102 CrossRef CAS PubMed.
- M. Bixon and J. Jortner, J. Chem. Phys., 1989, 91, 1631 CrossRef CAS.
- A. B. Harris, J. Phys. Chem., 1974, 7, 1671 Search PubMed; Y. Imry and M. Wortis, Phys. Rev. B: Condens. Matter, 1979, 19, 3580 CrossRef CAS.
- M. E. Fisher and A. E. Ferdinand, Phys. Rev. Lett., 1967, 19, 169 CrossRef CAS; Y. Imry, Phys. Rev. B: Condens. Matter, 1980, 21, 2042 CrossRef.
- J. D. Honeycutt and H. C. Andersen, J. Phys. Chem., 1987, 91, 4950 CrossRef CAS.
- A. Sachdev, R. I. Masel and J. B. Adams, Z. Phys. D: At., Mol. Clusters, 1993, 26, 310 CrossRef CAS; J. P. K. Doye, Phys. Rev. B: Condens. Matter, 2003, 68, 195418 CrossRef.
- I. L. Garzón and A. Posada-Amarillas, Phys. Rev. B: Condens. Matter, 1996, 54, 11796 CrossRef.
- I. L. Garzón, K. Michaelian, M. R. Beltrán, A. Posada-Amarillas, P. Ordejón, E. Artacho, D. Sánchez-Portal and J. M. Soler, Phys. Rev. Lett., 1998, 81, 1600 CrossRef.
- K. Michaelian, N. Rendón and I. L. Garzón, Phys. Rev. B: Condens. Matter, 1999, 60, 2000 CrossRef CAS.
- C. Kittel, Introduction to solid state physics, Wiley, 2005 Search PubMed.
- D. Faken and H. Jónsson, Comput. Mater. Sci., 1994, 2, 279 CrossRef CAS.
- V. Rosato, M. Guillope and B. Legrand, Philos. Mag. A, 1989, 59, 321 CrossRef.
- E. Aprà, F. Baletto, R. Ferrando and A. Fortunelli, Phys. Rev. Lett., 2004, 93, 065502 CrossRef PubMed.
- F. Calvo, J. P. K. Doye and D. J. Wales, Nanoscale, 2012, 4, 1085 RSC.
- K. Sutherland-Cash, D. J. Wales and D. Chakrabarti, Chem. Phys. Lett., 2015, 625, 1 CrossRef CAS; F. Calvo, D. Schebarchov and D. J. Wales, J. Chem. Theory Comput., 2016, 12, 902 CrossRef PubMed.
- J. P. K. Doye and D. J. Wales, J. Chem. Phys., 1995, 102, 9659 CrossRef CAS.
Footnote |
| † Electronic supplementary information (ESI) available. See DOI: 10.1039/C6NR06299G |
| This journal is © The Royal Society of Chemistry 2016 |

