Analyte-directed formation of emissive excimers for the selective detection of polyamines†
Tae-Il
Kim
and
Youngmi
Kim
*
Department of Chemistry, Kyung Hee University, 26 Kyungheedae-ro, Dongdaemun-gu, Seoul 02447, Korea. E-mail: youngmi.kim@khu.ac.kr
First published on 4th August 2016
Abstract
A convenient and selective method for the sensing of polyamines, which are important biomarkers for cancers, has been developed. The fluorescence light-up mechanism utilizes the analyte-induced formation of emissive excimers of a sulfonated probe. Detection is achieved in aqueous media and artificial urine samples, as indicated by an excellent fluorescence turn-on signal with a large spectral shift.
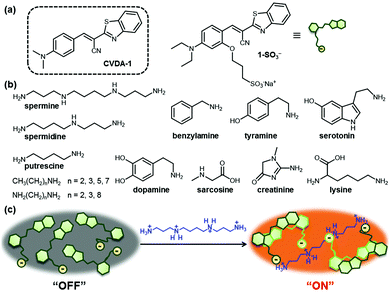
Polyamines (i.e., spermine, spermidine, and their precursor putrescine, Scheme 1b) are naturally occurring organic molecules that are formed by decarboxylation of amino acids.1 They are found in nearly all living cells and perform essential functions in the regulation of cell growth and differentiation.2 Since the association of increased levels of polyamine synthesis and accumulation with cell growth and cancer was first reported in the late 1960s, many research groups have observed similar changes in the levels of polyamines in tumor cells.3 Russell and others showed that the amounts of polyamines were abnormally elevated in the urine of patients with various types of tumors.4 In routine clinical analysis, therefore, the measurement of polyamine excretion levels in physiological fluids provide a valuable test in the diagnosis of cancer and in monitoring the response to therapy.5 The detection of polyamines present in biological samples has primarily relied on capillary electrophoresis6 and chromatographic methods,7 including high-performance liquid chromatography, thin-layer chromatography and gas chromatography. These methods often require laborious sample pre-treatment and relatively long analysis times, and can suffer from a lack of specificity or sensitivity.
Fluorescence-based chemosensors have recently attracted significant attention owing to their high sensitivity as well as their simplicity and suitability for high throughput screening.8 Our group and others have developed several different types of fluorimetric sensing systems for the identification and quantification of polyamines by using small organic molecules,9 conjugated polymers,10 dye-assembled nanotubes,11 hydrogel hybrids,12 dye-embedded micelles,13 or nanoparticles.14 In most of them, the sensing platform involves a displacement approach such as an ion-exchange reaction of fluorescent dyes with the polycations of these amines at physiological pH.12–14 Other approaches employ an aggregation of carboxylic acid-appended small organic dyes9c or conjugated polymers that is induced by the analyte.10a,b In the aggregates, intramolecular rotation is restricted or exciton migration is enhanced to induce a change in the fluorescence properties (i.e., emission intensity and/or wavelength).
Despite these encouraging results, some limitations remain. “Turn-off” signal responses reduce the attractiveness of some sensing schemes;10c,d,11,13a while others require a long reaction time at high temperature,9a,b or must be performed in organic solvents.9c,10a,b Therefore, a rational design for a fluorescent probe with high sensitivity and a rapid response, leading to a “turn-on” fluorescence signal, is still in high demand for the detection of polyamines under aqueous assay conditions for biological applications.
We recently discovered that a class of cyanovinylene dyes comprised of an electron donor (aniline), a π-conjugated bridge (cyanovinyl), and an electron acceptor (benzothiazole) (CVDA) displays a notable red-shifted emission upon aggregation.15 The CVDA-1 dye (Scheme 1a) shows a weak greenish emission (λmax,em = 534 nm) in dilute solutions that converts to an intense red emission upon aggregation (λmax,em = 618 nm) or crystallization (λmax,em = 624 nm). Experimental data and theoretical calculations have shown that the unusual solid-state emission of this family of dyes is caused by formation of an emissive excimer.
In this study, we successfully exploited the formation of emissive excimers among CVDA dyes in the design of a new “turn-on” fluorescent probe for the detection of multicationic analytes such as spermine and spermidine, at concentration levels suitable for biomedical applications in buffered aqueous media. A water-soluble derivative of CVDA-1, the sodium salt of the sulfonated anionic probe 1-SO3−, is non-aggregating and displays a weak background fluorescence emission. Encounter with a multicationic analyte triggers aggregate formation via electrostatic pairing, resulting in the formation of the red-shifted emissive excimer (Scheme 1c).
Probe 1-SO3− was prepared in moderate yield according to Scheme S1 (see the ESI†). Its photophysical properties were investigated in an aqueous buffer solution (10 mM HEPES, pH 7.4). The absorption and emission spectra show an absorption maximum at 458 nm (ε = 4.4 × 10⁴ M−1 cm−1) and a weak emission maximum at 541 nm (ΦF = 0.0001). The low quantum yield of probe 1-SO3− is ascribed to rapid nonradiative deactivation facilitated via internal bond rotations about the vinylene group in a diluted solution, as observed for previously reported CVDA dyes.15
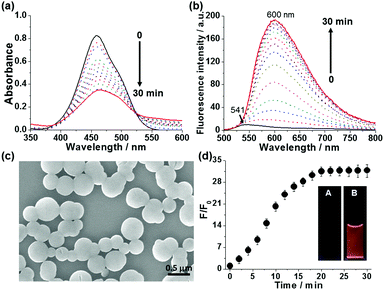
To investigate the sensing of spermine by anionic probe 1-SO3−, time-dependent absorption and fluorescence spectra of 1-SO3− (20 μM) were monitored upon the addition of 1 equiv. spermine in HEPES buffer (10 mM, pH 7.4) at 25 °C (Fig. 1). Addition of spermine gradually shifted absorption maximum from 458 to 462 nm. This was accompanied with a considerable reduction of the absorption coefficient, a broadening the absorption band (fwhm: from 74 to 95 nm), and a tailing absorption profile that is attributed to the Mie scattering of nanosized particles (Fig. 1a).16 This change is indicative of aggregate formation after addition of spermine. Aggregate formation was further confirmed by scanning electron microscopy (SEM), which showed the formation of spherical aggregates with an average diameter of 350 ± 50 nm (Fig. 1c and Fig. S21, S22, ESI†) and dynamic light scattering (DLS, Fig. S23, ESI†). More noticeably, the fluorescence spectra of the 1-SO3− displayed a significantly intensified red-shifted emission (λmax,em: 600 nm) over a 30 min incubation period (Fig. 1b). The growth of the excimer signal at 600 nm coincided with the growth of aggregates, suggesting that larger aggregates are more favorable to result in enhanced excimer emission. The fluorescence response of 1-SO3− after the addition of spermine was evident to the naked eye, as shown in Fig. 1d inset. The fluorescence intensity at 600 nm increased 34-fold relative to the original value of the free probe 1-SO3− after the addition of 20 μM spermine (Fig. 1d).
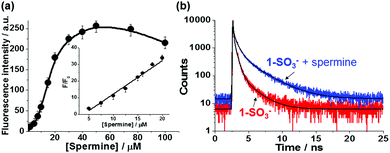
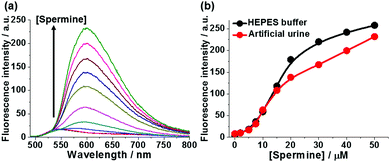
The fluorescence response of probe 1-SO3− (20 μM) to different concentrations of spermine in the 0–100 μM range after an incubation time of 20 min is shown in Fig. 2a. In the absence of spermine, 1-SO3− showed a very weak fluorescence (λmax,em = 541 nm). With an increasing amount of added spermine, the fluorescence intensity of the excimer band near 600 nm increased gradually until saturation was reached at ca. 50 μM, at which concentration the intensity of the fluorescence signal was enhanced by a factor of about 47. However, further increases in [spermine] above 50 μM decreased the fluorescence intensity (Fig. S6 and S7, ESI†). The normalized fluorescence intensities at 600 nm (F/F0) were found to be linearly proportional to the concentration of spermine in the 5–20 μM range (R2 = 0.985) (Fig. 2a inset). The critical concentration range demanded for cancer diagnosis is on the micromolar level, which falls within the linear range of the assay demonstrated in this study. The detection limit of 1-SO3− toward spermine was calculated to be ca. 0.6 μM (Fig. S14, ESI†), indicating its aptitude for the detection of trace biogenic polyamines.
The electrostatic interaction between the ammonium and sulfonate groups is deemed responsible for the interchromophore aggregation of 1-SO3−, which leads to the dramatic green to red fluorescence color change. However, the extent of the red-shift in aggregates of 1-SO3− and spermine is not as significant as for the emissive excimers of the previously reported CVDA-1 dye (λem = 618 nm).15 We ascribe this disparity to a more irregular arrangement of the dyes within the aggregates of 1-SO3− and spermine that is less optimal for excimer formation.
To obtain further insight into the structure and photophysics of the aggregates, time-resolved photoluminescence decay analyses of 1-SO3− without and with spermine in HEPES buffer (10 mM, pH 7.4) were performed using fluorescence-lifetime imaging microscopy (FLIM) upon femtosecond laser excitation at 470 nm (Fig. 2b and see also Table S1, ESI†). The excited-state decay curves could be best fitted to tri-exponential functions. Without spermine, the area weighted mean fluorescence lifetime (τavg) of 1-SO3− at 542 nm was ca. 0.14 ns with most of the signal originating from 0.07 ns (81.6%) fraction. The fast excited-state dynamics for 1-SO3− in solution is indicative of rapid non-radiative deactivation, which is corroborated by their weak fluorescence emission, and consistent with torsion-induced quenching, as discussed earlier. The addition of spermine to 1-SO3− resulted in slower fluorescence decay at 600 nm (τavg = 0.38 ns) with increase in extended lifetime species. The shorter fluorescence lifetime of 1-SO3− in the presence of spermine compared to that of the previously reported CVDA-1 dye excimer (τavg = 0.92 ns),15 just like the smaller extent of the red-shift, is also consistent with an aggregate structure that is not as favorable to promote excimer formation.
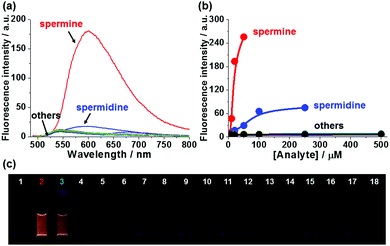
Next, we evaluated whether the fluorescence response of 1-SO3− could be used to detect polyamines selectively over other amines. The sensory responses of 1-SO3− (20 μM) in the presence of various other ammonium salts (from spermine, spermidine, 1,2-ethylenediamine, 1,3-propanediamine, 1,4-butanediamine (putrescine), 1,8-octanediamine, 1-propanamine, 1-butanamine, 1-hexanamine, 1-octanamine, lysine, benzylamine, tyramine, serotonin, dopamine, creatinine, sarcosine) were evaluated. Spectroscopic analyses carried out 20 min after the addition of 1 equiv. of each analyte exhibited dramatic enhancement in fluorescence intensity at 600 nm in the presence of polyamines, such as spermine and spermidine, but excimer emission was not observed for diamines and monoamines, even at higher concentrations (up to 500 μM; Fig. 3 and Fig. S17, S18, ESI†). The fluorescence turn-on response of 1-SO3− also showed a selectivity greater than 10![[thin space (1/6-em)]](https://www.rsc.org/images/entities/char_2009.gif) :
:![[thin space (1/6-em)]](https://www.rsc.org/images/entities/char_2009.gif) 1 in favor of the tetracationic spermine (pKa = 11.50, 10.95, 9.79, 8.90) over tricationic spermidine (pKa = 11.56, 10.80, 9.52). These observations are consistent with the differential binding affinity of monomeric 1-SO3− being a function of the cationic charge density of the analyte. Binding studies also suggest that tricationic spermidine associates with fewer equivalents of 1-SO3− than tetracationic spermine (Fig. S24, ESI†). Spermine detection with 1-SO3− was not interfered with these diamines and monoamines, indicating that probe 1-SO3− could be highly selective for diagnosis applications (Fig. S19, ESI†), and further supporting charge density as the main factor in the formation of tight excimer-forming aggregates.
1 in favor of the tetracationic spermine (pKa = 11.50, 10.95, 9.79, 8.90) over tricationic spermidine (pKa = 11.56, 10.80, 9.52). These observations are consistent with the differential binding affinity of monomeric 1-SO3− being a function of the cationic charge density of the analyte. Binding studies also suggest that tricationic spermidine associates with fewer equivalents of 1-SO3− than tetracationic spermine (Fig. S24, ESI†). Spermine detection with 1-SO3− was not interfered with these diamines and monoamines, indicating that probe 1-SO3− could be highly selective for diagnosis applications (Fig. S19, ESI†), and further supporting charge density as the main factor in the formation of tight excimer-forming aggregates.
The effect of pH on the fluorescence response of 1-SO3− toward spermine was further investigated (Fig. S9, ESI†). There was little difference in the sensing of spermine between pH 5 and 7.4. However the fluorescence response to spermine was dimmed above pH 8, most probably due to partial deprotonation of the ammonium groups, emphasizing that electrostatic interaction is the primary force for the association. Nevertheless, the assay is not sensitive to high salt concentrations up to 150 mM for NaCl (Fig. S10, ESI†). Importantly, the fluorescence intensity of 1-SO3− did not change in the absence of spermine when it was monitored in aqueous media for 12 hours (Fig. S4, ESI†), suggesting a great stability of probe 1-SO3− under the assay conditions.
In order to demonstrate the practical utility of 1-SO3− in a physiological environment, fluorimetric assays of spermine were performed in artificial urine solutions. As shown in Fig. 4, the response of probe 1-SO3− toward spermine in urine paralleled that observed in aqueous buffer (Fig. S27, ESI†). The large jump in fluorescence intensity above 5 μM coincides with the elevated urinary spermine levels that are considered as clinical cancer markers, highlighting the probe's potential for biomedical analysis.
In summary, probe 1-SO3− can selectively associate via multiple electrostatic interactions with protonated polyamines, such as spermine and spermidine, forming aggregates that trigger excimer emission. The developed fluorescence “turn-on” assay for biogenic spermine and spermidine over other amines is highly sensitive and operationally simple, and it may be performed in artificial urine samples without the need for organic solvents. We suggest that this assay may find use in rapid routine clinical pre-screenings.
This research was supported by National Research Foundation of Korea (NRF) grants funded by the Korean government (MSIP) (NRF-2015R1A2A2A01004632 and NRF-2015R1A5A1008958). The authors thank Dr Weon-Sik Chae of the KBSI Daegu Center for fluorescence lifetime measurements.
Notes and references
- (a) T. Thomas and T. J. Thomas, J. Cell. Mol. Med., 2003, 7, 113 CrossRef CAS PubMed; (b) H. M. Wallace, A. V. Fraser and A. Hughes, Biochem. J., 2003, 376, 1 CrossRef CAS PubMed; (c) N. F. Evageliou and M. D. Hogarty, Clin. Cancer Res., 2009, 15, 5956 CrossRef CAS PubMed.
- (a) N. Seiler, J. G. Delcros and J. P. Moulinoux, Int. J. Biochem. Cell Biol., 1996, 28, 843 CrossRef CAS PubMed; (b) C. Stefanelli, F. Bonavita, I. Stanic', M. Mignani, A. Facchini, C. Pignatti, F. Flamigni and C. M. Caldarera, FEBS Lett., 1998, 437, 233 CrossRef CAS PubMed; (c) N. de Vera, E. Martinez and C. Sanfeliu, J. Neurosci. Res., 2008, 86, 861 CrossRef CAS PubMed.
- (a) K. Fujita, T. Nagatsu, K. Maruta, M. Ito, H. Senba and K. Miki, Cancer Res., 1976, 36, 1320 CAS; (b) E. W. Gerner and F. L. Meyskens Jr, Nat. Rev. Cancer, 2004, 4, 781 CrossRef CAS PubMed; (c) U. Bachrach, Amino Acids, 2004, 26, 307 CrossRef CAS PubMed.
- (a) D. H. Russell, Nat. New Biol., 1971, 233, 144 CrossRef CAS PubMed; (b) D. H. Russell, C. C. Levy, S. C. Schimpff and I. A. Hawk, Cancer Res., 1971, 31, 1555 CAS.
- (a) D. H. Russel, Nature, 1971, 233, 144 Search PubMed; (b) D. H. Russel, Clin. Chem., 1977, 23, 22 Search PubMed; (c) C. Moinard, L. Cynober and J. P. Bant, Clin. Nutr., 2005, 24, 184 CrossRef CAS PubMed.
- (a) K. Fujita, T. Nagatsu, K. Shinpo, K. Maruta, R. Teradaira and M. Nakamura, Clin. Chem., 1980, 26, 1577 CAS; (b) M. S. Steiner, R. J. Meier, C. Spangler, A. Duerkop and O. S. Wolfbeis, Microchim. Acta, 2009, 167, 259 CrossRef CAS.
- (a) H. lnoue and A. Mizutani, Anal. Biochem., 1973, 56, 408 CrossRef; (b) C. Ruiz-Capillas and A. Moral, J. Food Sci., 2001, 66, 1030 CrossRef CAS; (c) S. Rossi, C. Lee, P. C. Ellis and L. F. Pivarnik, J. Food Sci., 2002, 67, 2056 CrossRef CAS; (d) N. M. Tamim, L. W. Benett, T. A. Shellem and J. A. Doer, J. Agric. Food Chem., 2002, 50, 5012 CrossRef CAS PubMed; (e) E. K. Paleologos and M. G. Kontominas, Anal. Chem., 2004, 76, 1289 CrossRef CAS PubMed; (f) H. S. Marks (Rupp) and C. R. Anderson, J. Chromatogr. A, 2005, 1094, 60 CrossRef PubMed; (g) Ö. Özdestan and A. Üren, Talanta, 2009, 78, 1321 CrossRef PubMed.
- X. Chen, X. Tian, I. Shin and J. Yoon, Chem. Soc. Rev., 2011, 40, 4783 RSC.
- (a) H. Nohta, H. Satozono, K. Koiso, H. Yoshida, J. Ishida and M. Yamaguchi, Anal. Chem., 2000, 72, 4199 CrossRef CAS PubMed; (b) B. Lee, R. Scopelliti and K. Serverin, Chem. Commun., 2011, 47, 9639 RSC; (c) M. Nakamura, T. Sanji and M. Tanaka, Chem. – Eur. J., 2011, 17, 5344 CrossRef CAS PubMed; (d) G. Singh, S. S. Mangat, H. Sharma, J. Singh, A. Arora, A. P. S. Pannu and N. Singh, RSC Adv., 2014, 4, 36834 RSC; (e) J. T. Fletcher and B. S. Bruck, Sens. Actuators, B, 2015, 207, 843 CrossRef CAS PubMed.
- (a) A. Satrijo and T. M. Swager, J. Am. Chem. Soc., 2007, 129, 16020 CrossRef CAS PubMed; (b) B. Bao, L. Yuwen, X. Zheng, L. Weng, X. Zhu, X. Zhan and L. Wang, J. Mater. Chem., 2010, 20, 9628 RSC; (c) J. Wang, Q. Zhang, Z. D. Liu and C. Z. Huang, Analyst, 2012, 137, 5565 RSC; (d) A. H. Malik, S. Hussain and P. K. Iyer, Anal. Chem., 2016, 88, 7358 CrossRef CAS PubMed.
- Y. Hu, X. Ma, Y. Zhang, Y. Che and J. Zhao, ACS Sens., 2016, 1, 22 CrossRef CAS.
- M. Ikeda, T. Yoshii, T. Matsui, T. Tanida, H. Komatsu and I. Hamachi, J. Am. Chem. Soc., 2011, 133, 1670 CrossRef CAS PubMed.
- (a) Z. Köstereli and K. Severin, Chem. Commun., 2012, 48, 5841 RSC; (b) J. Tu, S. Sun and Y. Xu, Chem. Commun., 2016, 52, 1040 RSC.
- (a) T.-I. Kim, J. Park and Y. Kim, Chem. – Eur. J., 2011, 17, 11978 CrossRef CAS PubMed; (b) S. Chopra, J. Singh, H. Kaur, H. Singh, N. Singh and N. Kaur, New J. Chem., 2015, 39, 3507 RSC.
- G. Han, D. Kim, Y. Park, J. Bouffard and Y. Kim, Angew. Chem., Int. Ed., 2015, 54, 3912 CrossRef CAS PubMed.
- (a) G. Mie, Ann. Phys., 1908, 330, 377 CrossRef; (b) H. Auweter, H. Haberkorn, W. Heckmann, D. Horn, E. Lüddecke, J. Rieger and H. Weiss, Angew. Chem., Int. Ed., 1999, 38, 2188 CrossRef CAS.
Footnote |
| † Electronic supplementary information (ESI) available: Experimental details and additional spectroscopic data. See DOI: 10.1039/c6cc05761f |
| This journal is © The Royal Society of Chemistry 2016 |

