 Open Access Article
An efficiently tuned d-orbital occupation of IrO2 by doping with Cu for enhancing the oxygen evolution reaction activity†
Wei
Sun
a,
Ya
Song
b,
Xue-Qing
Gong
*b,
Li-mei
Cao
a and
Ji
Yang
*a
aState Environmental Protection Key Laboratory of Environmental Risk Assessment and Control on Chemical Processes, School of Resources and Environmental Engineering East China University of Science and Technology, 130 Meilong Road, Shanghai 200237, P. R. China. E-mail: yangji@ecust.edu.cn
bKey Laboratory for Advanced Materials, Center for Computational Chemistry and Research Institute of Industrial Catalysis, East China University of Science and Technology, 130 Meilong Road, Shanghai 200237, P. R. China. E-mail: xgong@ecust.edu.cn
First published on 12th June 2015
Abstract
The oxygen evolution reaction (OER) has been regarded as a key half reaction for energy conversion technologies and requires high energy to create O![[double bond, length as m-dash]](https://www.rsc.org/images/entities/char_e001.gif) O bonds. Transition metal oxides (TMOs) seem to be a promising and appealing solution to the challenge because of the diversity of their d-orbital states. We chose IrO2 as a model because it is universally accepted as a current state-of-the-art OER catalyst. In this study, copper-doped IrO2, particularly Cu0.3Ir0.7Oδ, is shown to significantly improve the OER activity in acidic, neutral and basic solutions compared to un-doped IrO2. The substituted amount of Cu in IrO2 has a limit described by the Cu0.3Ir0.7Oδ composition. We determined that the performance of Cu0.3Ir0.7Oδ is due primarily to an increase in the Jahn–Teller effect in the CuO6 octahedra, and partially to oxygen defects in the lattice induced by the IrO6 octahedral geometric structure distortions, which enhance the lift degeneracy of the t2g and eg orbitals, making the dz2 orbital partially occupied. This phenomenon efficiently reduces the difference between ΔG2 and ΔG3 in the free energy from the density functional theoretical (DFT) calculations and can yield a lower theoretical overpotential comparable to that of IrO2. The proposed method of doping with foreign elements to tune the electron occupation between the t2g and eg orbital states of Ir creates an opportunity for designing effective OER catalysts using the TMO groups.
O bonds. Transition metal oxides (TMOs) seem to be a promising and appealing solution to the challenge because of the diversity of their d-orbital states. We chose IrO2 as a model because it is universally accepted as a current state-of-the-art OER catalyst. In this study, copper-doped IrO2, particularly Cu0.3Ir0.7Oδ, is shown to significantly improve the OER activity in acidic, neutral and basic solutions compared to un-doped IrO2. The substituted amount of Cu in IrO2 has a limit described by the Cu0.3Ir0.7Oδ composition. We determined that the performance of Cu0.3Ir0.7Oδ is due primarily to an increase in the Jahn–Teller effect in the CuO6 octahedra, and partially to oxygen defects in the lattice induced by the IrO6 octahedral geometric structure distortions, which enhance the lift degeneracy of the t2g and eg orbitals, making the dz2 orbital partially occupied. This phenomenon efficiently reduces the difference between ΔG2 and ΔG3 in the free energy from the density functional theoretical (DFT) calculations and can yield a lower theoretical overpotential comparable to that of IrO2. The proposed method of doping with foreign elements to tune the electron occupation between the t2g and eg orbital states of Ir creates an opportunity for designing effective OER catalysts using the TMO groups.
Introduction
The oxygen evolution reaction (OER) at the anode is the key half reaction for splitting water into H2 fuel and reducing the CO2 concentration in fuels (e.g., CO, CH4) and metal–air batteries.1–4 However, the OER is a complex process associated with 4e/4H+ loss and O![[double bond, length as m-dash]](https://www.rsc.org/images/entities/char_e001.gif) O bond formation, which requires a high overpotential relative to the standard reaction potential (E = 1.229 V, pH = 0) to achieve the desired current density.1,5,6 The critical step to address the challenge is to find efficient catalysts. One of the most promising catalysts is a transition metal oxide (TMO); this group has nearly infinitely variable properties of its d-orbital states (d0 ∼ d10),7,8 particularly t2g and eg, which can be systematically modified to optimize the catalytic activity at the surface.9–11 The OER catalytic activity of TMOs is governed completely by its d-orbital electron structure12 because the bond making or breaking in the OER processes are based on the O-2p of intermediates bonding with the M-nd of surface sites. Many approaches are being engineered to enhance the OER catalytic activity by doping foreign elements into the host structure or modifying the substitute to increase the number of catalytically active sites.13–18 Numerous studies show that introducing F,19 Ru,20,21 Ta22 and Zn23 into IrO2 can obtain an improvement in the OER activity. However, there are still important aspects regarding how the doped foreign metals tune the d orbital electronic structure of the host element and further affect its OER activity.
O bond formation, which requires a high overpotential relative to the standard reaction potential (E = 1.229 V, pH = 0) to achieve the desired current density.1,5,6 The critical step to address the challenge is to find efficient catalysts. One of the most promising catalysts is a transition metal oxide (TMO); this group has nearly infinitely variable properties of its d-orbital states (d0 ∼ d10),7,8 particularly t2g and eg, which can be systematically modified to optimize the catalytic activity at the surface.9–11 The OER catalytic activity of TMOs is governed completely by its d-orbital electron structure12 because the bond making or breaking in the OER processes are based on the O-2p of intermediates bonding with the M-nd of surface sites. Many approaches are being engineered to enhance the OER catalytic activity by doping foreign elements into the host structure or modifying the substitute to increase the number of catalytically active sites.13–18 Numerous studies show that introducing F,19 Ru,20,21 Ta22 and Zn23 into IrO2 can obtain an improvement in the OER activity. However, there are still important aspects regarding how the doped foreign metals tune the d orbital electronic structure of the host element and further affect its OER activity.
Here, we show that copper (Cu)-doped IrO2, particularly in the Cu0.3Ir0.7Oδ composition, exhibits a high OER activity in acidic, neutral and basic solutions (pH ∼ 1, 7 and 13, respectively). We chose IrO2 as a model because it has been universally accepted as a current state-of-the-art OER catalyst and maintains a stable structure in water oxidation over a broad pH range.24–27 The copper is taken as the dopant due to its special electronic structure (3d104s1), and Cu2+ is widely applied in superconductors.28–30 In this study, the Cu that is introduced into the IrO2 lattice changes the IrO2 lattice parameters and further affects the d-orbital distributions of the Ir-5d electrons; these mechanisms are discussed in detail. We also attribute the high performance observed to the fact that the doped Cu changes the Ir site electron structure and lifts its eg orbital resulting in partial occupation of its dz2 orbital.
Results and discussion
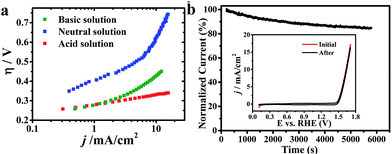
CuxIr1−xOδ, with varying compositions, was synthesized hydrothermally via doping different amounts of Cu into the IrO2 lattice, and allowing crystallization at 600 °C (detailed synthesis information is shown in the ESI†).Fig. 1a shows the electrochemical characterization of the Cu0.3Ir0.7Oδ composition,31 which exhibited an excellent OER activity in three solutions with different pH values. The η requirements at j = 10 mA cm−2, which is a meaningful reference due to its relevance to solar synthesis,32 were remarkably small at 351 mV in the acidic solution, 623 mV in the neutral solution and 415 mV in the basic solution, which indicated the excellent performance of Cu0.3Ir0.7Oδ in the acidic and neutral solutions; the values were much smaller compared to some reported for effective Co-based catalysts.33–35 The excellent performance of Cu0.3Ir0.7Oδ was confirmed by measuring the Tafel slope to be ∼63 mV per dec in the acidic solution, ∼203 mV per dec in the neutral solution and ∼105 mV per dec in the basic solution. The stability of the prepared Cu0.3Ir0.7Oδ was evaluated by conducting chronoamperometry at 1.68 V (vs. RHE) for 6000 s, the results of which are shown in Fig. 1b. In each run, the normalized current slightly decreased due to oxygen bubbles accumulating on the surface, while the CV curves (Fig. 1b insert) before and after 6000 s are almost identical showing that the catalyst remains stable during the OER experiments.
As revealed by nitrogen adsorption isotherms (BET m2 g−1), the prepared catalysts have similar surface areas of 22–30 m2 g−1 (Table S1†). The compositions were characterized by EDS and the spectra are shown in Fig. S1;† additional results were listed in Table S2.† Transmission electron microscopy (TEM) showed that Cu-doped IrO2 had a short rod-like morphology structure that was different from the IrO2 grain morphology (Fig. S2†); this was confirmed by scanning electron microscopy (SEM), as shown in Fig. S3.† It should be noted that the doping with Cu could change the IrO2 lattice; thus, we have investigated how Cu doping can affect the IrO2 rutile structure. The composition was shown to be maintained; its rutile structure at x = 0–0.3 and, when doped, at x > 0.3, it was found to be a mixture made up of CuO and partially doped IrO2. X-ray diffraction (XRD, Fig. 2a) shows the diffraction planes (002) and (111) corresponding to CuO, which peak near x = 0.3, begin very weakly and increase gradually as more Cu is added, indicating that x = 0.3 is the maximum concentration for solid solution formation. It was also found that Ir could not insert into the CuO lattice even at a 10% molar ratio due to the different crystal systems present. It was also confirmed by performing EDX mapping (Fig. S4†) that Cu was homogeneously doped into the IrO2 lattice with a low Cu composition (for x = 0.1 and x = 0.3).
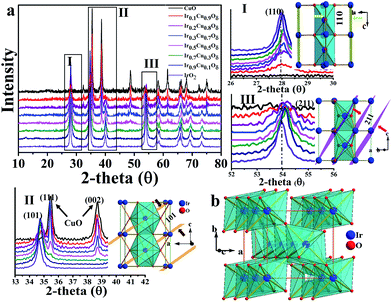 | ||
| Fig. 2 (a) XRD patterns of the CuxIr1−xOδ compositions with different amounts of Cu doping. (I)–(III) correspond to the (a) selected areas. (b) Polyhedron picture of one IrO2 cell. | ||
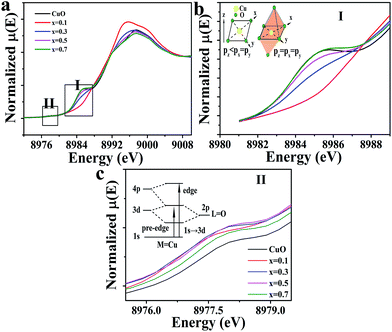
These results were confirmed by the Cu–K edge X-ray absorption near-edge structure (XANES), as shown in Fig. 3a. The Cu–K edge of the CuO separated into two regions in planar symmetry, which were a 1s → 4pz transition, corresponding to the low energy peak (i.e., the shakedown peak), and 1s → 4px,y transitions, corresponding to the primary edge.36 The local symmetry of Cu, however, had changed to an octahedral symmetry as Cu substituted into Ir sites, and the shakedown peak disappeared due to the isotropic 4p orbital.36,37 Therefore, no shakedown peak was observed at x = 0.1 and 0.3 in the XANES, which was confirmed by the extended X-ray adsorption fine structure (EXAFS) of the Cu–K edge shown in Fig. S5.† However, the intensity of x = 0.3 is shown to be above that of x = 0.1, which indicated that the octahedron might be distorted. All of the samples studied showed a weak pre-edge peak, which was assigned to 1s → 3d due to the quadruple-allowed transition (see Fig. 3a II); this intensity could be achieved by the metal 4pz orbital mixing into the 3d orbitals; however, this is not possible due to centrosymmetric complexities.36–39 A significant feature was also noted: the peak intensity of the doped samples was above that of CuO, indicating the excited distortion of the CuO6 octahedra at x = 0.3 and 0.5.
As shown, the Cu doping produces an elongated IrO6 octahedron due to the CuO6 octahedron's strong Jahn–Teller effect,40,41 in which the four equatorial oxygen atoms form a plane that compresses, while the apical oxygen out of the plane forms an extended octahedron. The IrO2 rutile structure exhibits edge sharing along the c axis to form chains, and each chain is linked with four neighboring chains by their shared corners (see Fig. 2b). The Ir–O bonds of the IrO6 octahedra are not equal42 (4L + 2S) and include four longer Ir–O bonds in plane along with two short ones that correspond to the apical O. As mentioned above, as a result of the Jahn–Teller effect of CuO6, the apical O in the CuO6 octahedron is out of plane, compressing the equatorial O of the neighboring Ir site, and compressed Cu–O bonds of the plane likely make the neighboring apical Ir–O bonds longer. The XRD data of the compounds shows that the shift values of the (110) plane, which describes the a axial length, were smaller compared to (101) and (211), which are both represented by a and c axial lengths. This results in the axial ratio c/a, a critical parameter for the rutile structure, being decreased compared to that of IrO2. The calculated lattice parameters of all samples are listed in Table S3† based on the XRD data. The results of the performed selected area electron diffraction (SAED) are shown in Fig. S2† and show that the d-space of the specified planes decreased after Cu doping. The HRTEM of the samples shown in Fig. S6† also revealed that the d-space of the (200) plane was similar between the Cu-doped samples and IrO2. The data extracted from the EXAFS spectra (see Fig. S7†) of the Ir-LIII edge also showed that the Ir–O bond lengths are marginally longer than those of IrO2 in the samples doped with Cu, while the Ir–Ir peak corresponding to the c axis decreased significantly compared to IrO2, indicating a reduced c/a ratio, which is consistent with the XRD and SAED data discussed above. All of these data indicate that the IrO2 doped with Cu had a significant lattice distortion with elongated Ir–O bonds for apical O and compressed Ir–O bonds for equatorial O.
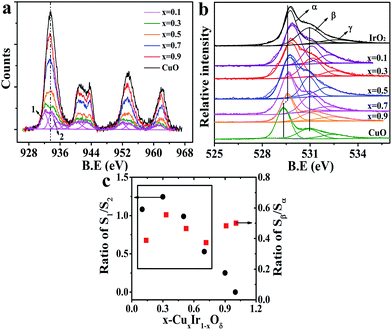
It has been shown that oxygen vacancies (Vo)43,44 will be generated due to the substituted Cu occupying the lattice sites of Ir because the dopant (Cu) charge (+2) is different to the host (Ir) charge (+4); the crystal must maintain its electrical neutrality to retain no net charge in the crystal structure; this produces a vacancy. These vacancies are identified and labeled as β in the O-1s core level spectrum shown in Fig. 4b. Fig. 4a shows the Cu-2p core level spectrum of the doped materials and that of CuO for reference (detail in Fig. S8†). It is clearly noted that two de-convoluted peaks were identified and labeled as 1 and 2 at 2p3/2 in the doped material at x = 0.1 and 0.3; this finding indicated that two different states of the doped Cu corresponded to high and low valence states, respectively. The binding energy of peak 2 was marginally above that of the CuO sample, perhaps corresponding to the O–Cu–O–Ir–O situation. The electronegativity of Cu (i.e., the Pauling electronegativity is 1.9) is below that of Ir (i.e., the Pauling electronegativity is 2.2), meaning that oxygen is more inclined to gain an electron from copper. This was also confirmed by the O-1s XPS spectra; the primary peak labeled α originated from the metal (Cu, Ir)–O bond in the lattice, and the binding energy progressively decreased with the increasing Cu concentration. The ratio of S1/S2 and Sβ/Sα (i.e., S-peak area) versus the doped amount x is shown in Fig. 4c. It was noted that the variation of S1/S2 and Sβ/Sα in CuxIr1−xOδ showed a similar tendency as the doping amount increased but remained below x ≤ 0.7; this indicated that there was a strong relationship between the low valence state of the doped Cu and that of the Vo. Thus, we inferred that the oxygen defects were generally closer to the Cu sites. As discussed above, the c-axis of a unit cell with doped Cu was reduced and was directly related to the planar oxygen in the octahedron. Thus, we inferred that the lattice oxygen defects might occur in the plane of the CuO6 octahedron rather than at the apical location and that the defect position corresponded to the apical O of the IrO6 octahedron.
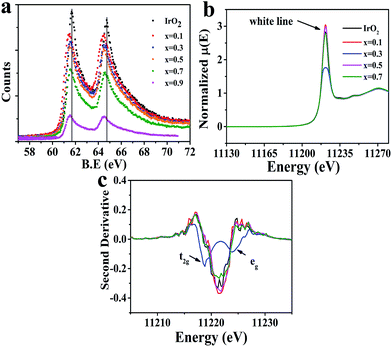
This study then investigated how the modified IrO2 doped by Cu affects the electronic structure of the Ir site. As shown in Fig. 5a (Ir-4f XPS), a shift to a lower binding energy was clearly observed in the doped samples compared to IrO2, suggesting a higher electron density at the Ir site. We thus did not assign a low valence to Ir in all samples (see discussion in Fig. S9†). The performed Ir-LIII edge XANES (Fig. 5b) revealed that an increasing number of Ir-5d states were occupied with IrO2 doped at x = 0.3 with Cu due to a significant decrease in intensity in the so-called “white line region”. The edge positions of the Ir-LIII edge for all of the prepared materials were found to be similar, indicating no valence change on Ir. In the ionic model, the five 5d electrons of the Ir4+ ion in IrO2 were shown to occupy the t2g triplet (i.e., dxz, dyz and dx2−y2) and leave the higher eg doublet (i.e., dxy and dz2) empty under the octahedral crystal field described by the t2g5eg0 configuration.45,46 However, as shown in the second derivative spectra (Fig. 5c), only a single feature was observed for IrO2 due to the IrO6 octahedron being cross-linked to form a 3D structure; this can be explained by a bond model.47,48 In contrast, the doublet feature was found in some iridate perovskite compositions with the IrO6 octahedron being regarded as a single cluster. Therefore, Fig. 5c confirms that x = 0.3 produces a doublet in the white line structure, and other doped compositions yielded results similar to that of IrO2. One of surprising features at x = 0.3 was that the peak intensity and area of the 2p → t2g (5d) transition were increased above those of the 2p → eg (5d) transition, which are in contrast to the findings in iridate perovskites;47,48 thus, we inferred that the eg state had been partially occupied.
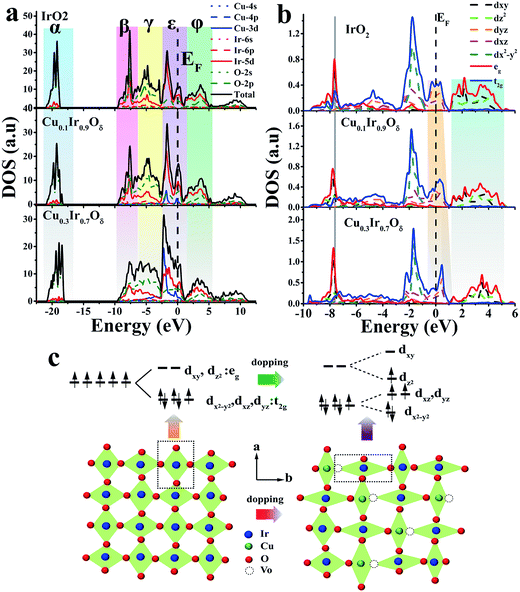
The Cu doping led to an IrO2 lattice distortion due to the CuO6 octahedron's Jahn–Teller effect and also generated oxygen defects, which significantly affected the energy distribution of the d-orbitals of Ir sites. The density of states (DOS) is a good descriptor for the bonding character and occupancy of the orbital states.49–52Fig. 6a and b showed the DOS of IrO2 and the doped material at x = 0.1 and 0.3 using the general gradient approximation (GGA) calculation; details of this analysis are shown in the calculation section of the ESI.† The colored region of Fig. 6a labels α, β, γ, ε and φ for Ir–O a1g bonding, σ bonding, π bonding, π antibonding (including the non-bonding part) and σ antibonding, respectively.46,53,54 One of the features of DOS is that the σ and π bonding region changed from narrow to relatively broad, and its antibonding states were pulled to a lower energy level as the Cu doping increased, weakening the bonding; this was primarily due to the occupancy of σ states. The partial DOS (PDOS) of Ir is shown in Fig. 6b. The dxy orbital occupied states were located at lower energies (gray solid line), while the antibonding states moved to higher energies (light blue region) as the Cu doping amount increased, indicating that the dxy orbital was uplifted. In contrast, the dz2 antibonding states were shifted to a lower energy level. The dxz and dyz bands were crossed by the Fermi level (EF), which changed to a narrow shape and was pushed above EF, indicating that the bands were empty in the π antibonding orbital; this indicated that the electrons may be half-filled in the dxz and dyz orbital. The dx2−y2 band showed nearly no variation when fully occupied, even when doped with Cu. As discussed above, the Ir-5d electrons showed lifted degeneracy in the octahedron within Cu; this made the dz2 orbital energy decrease, while the dxy orbital energy increased. As a result, an electron might hop to the dz2 orbital (see Fig. 6c), making the eg orbital partially filled.
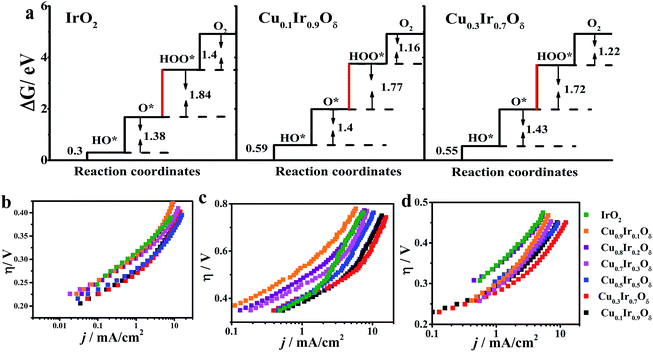
Based on the density functional theory (DFT) and the molecular orbital principles, a strong or weak bond formation from a surface site interacting with the reaction intermediates is strongly correlated with the OER activity. A σ bond to a eg orbital facilitates bonding with oxygen intermediates compared to a π bond t2g orbital due to the eg orbital's stronger overlap with O-2p.8,52,55 Suntivich et al.55 proposed that eg occupation close to unity optimizes the rate-determining step (RDS) and thereby leads to a higher OER activity and is successful in perovskite studies. Vojvodic and Nørskov52 showed that the surface-oxygen bond energy correlates with eg and t2g occupation and has a similar relationship to the interaction between the surface site and O-adsorbate, which becomes weaker with an increasing number of occupied states (e.g., eg and t2g). The possible OER mechanism on the metal oxides is shown in Fig. S10.† The binding free energies of all the reaction intermediates (HO*, O*, HOO*) involved in Fig. S9† are described in Fig. 7a. For a wide class of metal oxides, a linear relationship was found in the binding free energy between OH* and O* equated with ΔG2 + ΔG3 = 3.2 ± 0.2 eV.50,56 As a result, the catalysts have been optimized, evidenced by the reduction in the difference between ΔG2 and ΔG3. It was found that the sum of ΔG2 and ΔG3 met this relationship for IrO2 (3.22 eV), Ir0.9Cu0.1Oδ (3.17 eV) and Ir0.7Cu0.3Oδ (3.15 eV). In the case of IrO2 (t2g5eg0), partial eg filling on the Ir sites may result in the electrons of the O-2p adsorbate being able to easily hop to the unoccupied σ* orbital to form Ir–OH and Ir–O bonds, which decrease the free energies of the first and second step (OH* and O*). However, the formation of OOH* will occur at the RDS (ΔG3 = 1.84 eV) due to the rupture of the surface-oxygen bonds in most of the metal-oxide catalysts. For IrO2 doped with Cu (x = 0.1 and 0.3) with eg partially filled on the Ir site, it should take a higher energy to form Ir–OH and Ir–O bonds (ΔG1 + ΔG2 = 1.99 and 1.98 eV higher 1.68 eV of IrO2); however, the difference between ΔG2 and ΔG3 was found to be decreased (ΔG3 − ΔG2 = 0.37 eV and 0.29 eV comparable to 0.46 eV of IrO2) and reached a lower theoretical overpotential (ηthe(x = 0.3) = 0.39 eV with ηthe(x = 0) = 0.51 eV). The experimental data of OER for the studied samples are shown in Fig. 7b–d, which show that, except for Cu0.3Ir0.7Oδ, all doped materials exhibited some OER activity; the Cu0.2Ir0.8Oδ and Cu0.1Ir0.9Oδ compositions had a higher j compared to IrO2 in the basic solutions. In addition, the mechanical mixtures of IrO2 and CuO were prepared; however, no improvement in OER activity (see Fig. S11†) through mechanical mixing was observed. The η at j = 10 mA cm−2, the Tafel slopes and the mass activities at specific overpotentials in all of the prepared materials are shown in Table S4.† From this table, we can conclude that the Cu doping did enhance the OER activity, and x = 0.3 showed an excellent performance, which was consistent with the results from the relevant physical characterisations and DFT calculations.
Conclusions
The relevant experimental and theoretical results clearly showed that the d orbital occupation states of Ir-5d (t2g5eg0) in IrO2 can be tuned by substituting Ir for Cu to create a dz2-antibonding orbital (i.e., one of eg-antibonding orbitals) that is partially occupied in the Cu0.3Ir0.7Oδ composition. The Cu0.3Ir0.7Oδ composition exhibited an unexpected OER activity from its Tafel slope to its mass activity in three different pH solutions compared to IrO2. The substitution with Cu into the rutile structure of IrO2 inherently had a strong Jahn–Teller effect due to the CuO6 octahedron and induced partial oxygen defects in the lattice that changed the IrO6 octahedral geometric structure and also lifted degeneracy of the t2g and eg orbitals. Therefore, the proposed method of doping with foreign elements to tune the electron occupation between the t2g and eg orbital states of Ir sites can yield an opportunity to design effective OER catalysts using TMO group materials.Acknowledgements
This research is based on work supported by the National Natural Science Foundation of China (21177037, 21277045, 21322307), the Public welfare project of the Ministry of Environmental Protection (201309021), the "Shu Guang" project of the Shanghai Municipal Education Commission and the Shanghai Education Development Foundation, and the Fundamental Research Funds for the Central Universities. We would like to thank beamline BL14W1 (Shanghai Synchrotron Radiation Facility) for providing the beam time.Notes and references
- N. S. Lewis and D. G. Nocera, Proc. Natl. Acad. Sci. U. S. A., 2006, 103, 15729–15735 CrossRef CAS PubMed.
- H. B. Gray, Nat. Chem., 2009, 1, 7 CrossRef CAS PubMed.
- M. G. Walter, E. L. Warren, J. R. McKone, S. W. Boettcher, Q. Mi, E. A. Santori and N. S. Lewis, Chem. Rev., 2010, 110, 6446–6473 CrossRef CAS PubMed.
- J. Chakhalian, A. J. Millis and J. Rondinelli, Nat. Mater., 2012, 11, 92–94 CrossRef CAS PubMed.
- R. I. Cukier and D. G. Nocera, Annu. Rev. Phys. Chem., 1998, 49, 337–369 CrossRef CAS PubMed.
- S. Hammes-Schiffer, Acc. Chem. Res., 2009, 42, 1881–1889 CrossRef CAS PubMed.
- S.-W. Cheong, Nat. Mater., 2007, 6, 927–928 CrossRef CAS PubMed.
- J. Suntivich, H. A. Gasteiger, N. Yabuuchi, H. Nakanishi, J. B. Goodenough and Y. Shao-Horn, Nat. Chem., 2011, 3, 546–550 CrossRef CAS PubMed.
- D. W. Jeong, W. S. Choi, S. Okamoto, J.-Y. Kim, K. W. Kim, S. J. Moon, D.-Y. Cho, H. N. Lee and T. W. Noh, Sci. Rep., 2014, 4, 6124–6128 CrossRef CAS PubMed.
- J. Chakhalian, J. W. Freeland, H.-U. Habermeier, G. Cristiani, G. Khaliullin, M. van Veenendaal and B. Keimer, Science, 2007, 318, 1114–1117 CrossRef CAS PubMed.
- Y. Tokura and N. Nagaosa, Science, 2000, 288, 462–468 CrossRef CAS.
- J. K. Norskov, T. Bligaard, J. Rossmeisl and C. H. Christensen, Nat. Chem., 2009, 1, 37–46 CrossRef CAS PubMed.
- C. A. Kent, J. J. Concepcion, C. J. Dares, D. A. Torelli, A. J. Rieth, A. S. Miller, P. G. Hoertz and T. J. Meyer, J. Am. Chem. Soc., 2013, 135, 8432–8435 CrossRef CAS PubMed.
- P. Liao, J. A. Keith and E. A. Carter, J. Am. Chem. Soc., 2012, 134, 13296–13309 CrossRef CAS PubMed.
- J. Park, H. Kim, K. Jin, B. J. Lee, Y.-S. Park, H. Kim, I. Park, K. D. Yang, H.-Y. Jeong, J. Kim, K. T. Hong, H. W. Jang, K. Kang and K. T. Nam, J. Am. Chem. Soc., 2014, 136, 4201–4211 CrossRef CAS PubMed.
- B. S. Yeo and A. T. Bell, J. Am. Chem. Soc., 2011, 133, 5587–5593 CrossRef CAS PubMed.
- Q. Zhang, Z. D. Wei, C. Liu, X. Liu, X. Q. Qi, S. G. Chen, W. Ding, Y. Ma, F. Shi and Y. M. Zhou, Int. J. Hydrogen Energy, 2012, 37, 822–830 CrossRef CAS PubMed.
- D. M. Jang, I. H. Kwak, E. L. Kwon, C. S. Jung, H. S. Im, K. Park and J. Park, J. Phys. Chem. C, 2015, 119, 1921–1927 CAS.
- K. S. Kadakia, P. H. Jampani, O. I. Velikokhatnyi, M. K. Datta, S. K. Park, D. H. Hong, S. J. Chung and P. N. Kumta, J. Power Sources, 2014, 269, 855–865 CrossRef CAS PubMed.
- S. Siracusano, N. Van Dijk, E. Payne-Johnson, V. Baglio and A. S. Aricò, Appl. Catal., B, 2015, 164, 488–495 CrossRef CAS PubMed.
- J. Cheng, H. Zhang, G. Chen and Y. Zhang, Electrochim. Acta, 2009, 54, 6250–6256 CrossRef CAS PubMed.
- C. Felix, T. Maiyalagan, S. Pasupathi, B. J. Bladergroen and V. Linkov, Int. J. Electrochem. Sci., 2012, 7, 12064–12077 CAS.
- E. Kuznetsova, V. Petrykin, S. Sunde and P. Krtil, Electrocatalysis, 2015, 6, 198–210 CrossRef CAS.
- C. De Pauli and S. Trasatti, J. Electroanal. Chem., 2002, 538, 145–151 CrossRef.
- M. Yagi, E. Tomita, S. Sakita, T. Kuwabara and K. Nagai, J. Phys. Chem. B, 2005, 109, 21489–21491 CrossRef CAS PubMed.
- Y. Lee, J. Suntivich, K. J. May, E. E. Perry and Y. Shao-Horn, J. Phys. Chem. Lett., 2012, 3, 399–404 CrossRef CAS.
- Y. Zhao, E. A. Hernandez-Pagan, N. M. Vargas-Barbosa, J. L. Dysart and T. E. Mallouk, J. Phys. Chem. Lett., 2011, 2, 402–406 CrossRef CAS.
- J. Ghijsen, L. H. Tjeng, J. van Elp, H. Eskes, J. Westerink, G. A. Sawatzky and M. T. Czyzyk, Phys. Rev. B, 1988, 38, 11322–11330 CrossRef CAS.
- R. Fehrenbacher and T. M. Rice, Phys. Rev. Lett., 1993, 70, 3471–3474 CrossRef CAS.
- C. Varma, P. B. Littlewood, S. Schmitt-Rink, E. Abrahams and A. Ruckenstein, Phys. Rev. Lett., 1989, 63, 1996 CrossRef.
- A. Minguzzi, F.-R. F. Fan, A. Vertova, S. Rondinini and A. J. Bard, Chem. Sci., 2012, 3, 217–229 RSC.
- Y. Gorlin and T. F. Jaramillo, J. Am. Chem. Soc., 2010, 132, 13612–13614 CrossRef CAS PubMed.
- M.-R. Gao, X. Cao, Q. Gao, Y.-F. Xu, Y.-R. Zheng, J. Jiang and S.-H. Yu, ACS Nano, 2014, 8, 3970–3978 CrossRef CAS PubMed.
- M.-R. Gao, Y.-F. Xu, J. Jiang, Y.-R. Zheng and S.-H. Yu, J. Am. Chem. Soc., 2012, 134, 2930–2933 CrossRef CAS PubMed.
- Y. Liang, Y. Li, H. Wang, J. Zhou, J. Wang, T. Regier and H. Dai, Nat. Mater., 2011, 10, 780–786 CrossRef CAS PubMed.
- J.-H. Choy, D.-K. Kim, S.-H. Hwang and G. Demazeau, Phys. Rev. B, 1994, 50, 16631–16639 CrossRef CAS.
- L. S. Kau, D. J. Spira-Solomon, J. E. Penner-Hahn, K. O. Hodgson and E. I. Solomon, J. Am. Chem. Soc., 1987, 109, 6433–6442 CrossRef CAS.
- J. L. DuBois, P. Mukherjee, A. M. Collier, J. M. Mayer, E. I. Solomon, B. Hedman, T. D. P. Stack and K. O. Hodgson, J. Am. Chem. Soc., 1997, 119, 8578–8579 CrossRef CAS.
- J. L. DuBois, P. Mukherjee, T. D. P. Stack, B. Hedman, E. I. Solomon and K. O. Hodgson, J. Am. Chem. Soc., 2000, 122, 5775–5787 CrossRef CAS.
- G.-M. Zhao, M. B. Hunt, H. Keller and K. A. Muller, Nature, 1997, 385, 236–239 CrossRef CAS PubMed.
- G. Peralta, D. Puggioni, A. Filippetti and V. Fiorentini, Phys. Rev. B, 2009, 80, 140408 CrossRef.
- A. A. Bolzan, C. Fong, B. J. Kennedy and C. J. Howard, Acta Crystallogr., Sect. B, 1997, 53, 373–380 CrossRef.
- J. Wang, Z. Wang, B. Huang, Y. Ma, Y. Liu, X. Qin, X. Zhang and Y. Dai, ACS Appl. Mater. Interfaces, 2012, 4, 4024–4030 CAS.
- J. Gan, X. Lu, J. Wu, S. Xie, T. Zhai, M. Yu, Z. Zhang, Y. Mao, S. C. I. Wang, Y. Shen and Y. Tong, Sci. Rep., 2013, 3, 1021–1027 Search PubMed.
- Y. Hirata, K. Ohgushi, J.-I. Yamaura, H. Ohsumi, S. Takeshita, M. Takata and T.-H. Arima, Phys. Rev. B, 2013, 87, 161111 CrossRef.
- J. Kahk, C. Poll, F. Oropeza, J. Ablett, D. Céolin, J. Rueff, S. Agrestini, Y. Utsumi, K. Tsuei and Y. Liao, Phys. Rev. Lett., 2014, 112, 117601 CrossRef CAS.
- J.-H. Choy, D.-K. Kim, G. Demazeau and D.-Y. Jung, J. Phys. Chem., 1994, 98, 6258–6262 CrossRef CAS.
- J.-H. Choy, D.-K. Kim, S.-H. Hwang, G. Demazeau and D.-Y. Jung, J. Am. Chem. Soc., 1995, 117, 8557–8566 CrossRef CAS.
- B. Hammer and J. K. Nørskov, in Advances in Catalysis, ed. C. Bruce and H. K. Gates, Academic Press, 2000, vol. 45, pp. 71–129 Search PubMed.
- I. C. Man, H. Y. Su, F. Calle-Vallejo, H. A. Hansen, J. I. Martínez, N. G. Inoglu, J. Kitchin, T. F. Jaramillo, J. K. Nørskov and J. Rossmeisl, ChemCatChem, 2011, 3, 1159–1165 CrossRef CAS PubMed.
- J. Rossmeisl, Z.-W. Qu, H. Zhu, G.-J. Kroes and J. K. Nørskov, J. Electroanal. Chem., 2007, 607, 83–89 CrossRef CAS PubMed.
- A. Vojvodic and J. K. Nørskov, Science, 2011, 334, 1355–1356 CrossRef CAS PubMed.
- J. S. de Almeida and R. Ahuja, Phys. Rev. B, 2006, 73, 165102 CrossRef.
- L. F. Mattheiss, Phys. Rev. B, 1976, 13, 2433–2450 CrossRef CAS.
- J. Suntivich, K. J. May, H. A. Gasteiger, J. B. Goodenough and Y. Shao-Horn, Science, 2011, 334, 1383–1385 CrossRef CAS PubMed.
- S. Piccinin, A. Sartorel, G. Aquilanti, A. Goldoni, M. Bonchio and S. Fabris, Proc. Natl. Acad. Sci. U. S. A., 2013, 110, 4917–4922 CrossRef CAS PubMed.
Footnote |
| † Electronic supplementary information (ESI) available: Materials, experimental procedures and theoretical calculations; figures including SEM, TEM images, EDS data, EXAFS and XPS spectra, CVs for RHE calibration and polarization curves for mixture of CuO and IrO2; and tables for EDS and comparison of OER activity. See DOI: 10.1039/c5sc01251a |
| This journal is © The Royal Society of Chemistry 2015 |

