 Open Access Article
Creative Commons Attribution 3.0 Unported Licence
How focussing on hydrogen bonding interactions in amino acids can miss the bigger picture: a high-pressure neutron powder diffraction study of ε-glycine†
Stephen A.
Moggach
a,
William G.
Marshall
b,
David M.
Rogers
a and
Simon
Parsons
*a
aEaStCHEM School of Chemistry and Centre for Science at Extreme Conditions, The University of Edinburgh, King's Buildings, West Mains Road, Edinburgh, Scotland EH9 3FJ, UK. E-mail: S.Parsons@ed.ac.uk
bISIS Pulsed Neutron and Muon Facility, STFC Rutherford Appleton Laboratory, Harwell Science and Innovation Campus, Chilton, Didcot, OX11 0QX, UK
First published on 26th May 2015
Abstract
The crystal structures of amino acids, which are composed of molecules in their zwitterionic tautomers, are usually interpreted in terms of strong NH⋯O hydrogen bond formation between the ammonium and carboxylate groups supported by weaker dispersion or CH⋯O interactions. This view of the factors which promote thermodynamic stability in the crystalline amino acids has been re-examined in two phases of glycine, the trigonal γ-form, which is the thermodynamically most stable form under ambient conditions, and the ε-form, which is generated from γ-glycine at high pressure. A combination of Hirshfeld surface analysis, periodic DFT, PIXEL and symmetry-adapted perturbation theory calculations indicates that the conventional interpretation of intermolecular interactions in crystalline amino acids phases fails to recognise the over-whelming significance of Coulombic attraction and repulsion. There are no intermolecular interactions in either phase that can plausibly be described as dispersion-based. The interaction energies of molecules connected by so-called CH⋯O H-bonds are far in excess of accepted values for such interactions. Of the 14 closest intermolecular contacts in both phases, six have destabilizing interaction energies: in γ-glycine a hydrogen bond with ‘text-book’ NH⋯O contact geometry is part of a destabilising molecule–molecule interaction. The relative stabilities of the phases are best understood not in terms of a series of stabilising atom–atom contacts, but rather as a balance between efficient filling of space in the high-pressure ε-phase, and more weakly repulsive electrostatic whole–molecule interactions in the γ-phase.
Introduction
The thermodynamic stability of a crystal structure is conventionally rationalised by analysis of short, ‘structure-directing’, intermolecular atom–atom contacts such as hydrogen bonds, halogen bonds, π-stacking and so on.1 Although the simplicity of this approach is very appealing, stability is a thermodynamic concept which depends on relative energies, and so it is necessary to assume that short inter-atomic contacts are evidence of stabilising intermolecular interactions. Under some circumstances this assumption may either not be correct, or may obscure a more complex picture.2 Calculation of accurate intermolecular interaction energies from crystal structure data is now routinely possible using empirical atom–atom potentials, semi-empirical approaches such as the PIXEL method, or using quantum mechanical methods including DFT or symmetry-adapted perturbation theory.3,4 In this paper we compare conventional distance-based analysis with the results of intermolecular energy calculations in the case of two phases of one of the most extensively studied compounds, the simplest amino acid glycine.Glycine crystallises in the zwitterionic form +H3N–CH2–COO−. Three polymorphs are known under ambient conditions. The α5,6 and β7,8 forms are both monoclinic with crystal structures exhibiting hydrogen-bonded layers. In contrast, the crystal structure of the γ-form9,10 is trigonal and displays a three-dimensional H-bonded network featuring chains of molecules disposed about 3-fold screw axes. Of the three polymorphs, γ-glycine is considered to be the most thermodynamically stable form,11 though the α polymorph is the form usually obtained from aqueous solution.
The effect of pressure on different polymorphs of glycine has been extensively investigated by single-crystal and powder X-ray diffraction, Raman spectroscopy and inelastic neutron scattering.12–22 Single-crystal X-ray diffraction data are available for α-glycine (P21/n) at 6.2 GPa.12 The principal effect of compression is to close-up the voids which exist within the R-type hydrogen bonding motifs. No phase transformations have been observed by compression of α-glycine, even up to 23 GPa.20
β-Glycine (P21) is metastable at all temperatures at ambient pressure.11 Although it has a layered structure in some ways similar to that of α-glycine, it undergoes a phase transition at just 0.8 GPa to a high pressure monoclinic (P21/a) phase, δ-glycine.12,18,19 This single-crystal to single-crystal transition is displacive and fully reversible. The non-destructive nature of the β-to-δ transition may be ascribed to the topological similarity of the two phases, as the transformation involves only an inversion in molecular conformation of half the molecules.
Application of pressure to γ-glycine (space group P31/P32) leads to ε-glycine.12,14 The transition is sluggish at room-temperature and reconstructive in nature, so that an initial single-crystal sample becomes polycrystalline upon completion of the transition. The transition has been observed to begin at 2 GPa and to be 95% complete by 4.3 GPa, with mixtures of γ and ε phases being obtained at intermediate pressures.12 Boldyreva et al. give the onset transition pressure as 2.6–2.7 GPa, and they did not obtain a pure sample of ε-glycine even at 7.85 GPa.14 The work just described was carried-out using a mixture of methanol and ethanol as a hydrostatic medium, yet the same transformation has been observed at 0.8 GPa when Fluorinert was used as a hydrostatic medium and the sample was allowed to sit for 1 hour in a neutron beam.16 The transition is thus sluggish, and to some extent sample-dependent. On decompression to ambient pressure ε-glycine slowly transforms back to the γ-phase, proceeding via a ζ-phase.17 The structure of this phase has not been determined, though it is thought on the basis of vibrational data to consist of layers like the α, β, γ and ε phases.16
The unit cell dimensions of ε-glycine were first determined by Boldyreva,15 but the coordinates initially published (and still available as CSD refcode GLYCIN35) correspond to a structure containing contacts which are plainly far too short. More convincing structural models were presented later by Boldyreva14 and us.12 Based on the admittedly imprecise X-ray powder structures available it seemed that one of the H-atoms attached to the NH3+ group is not involved in a close, well-directed, H-bonding contact. This is rather surprising in an amino acid structure, where H-bonding is expected to be very efficient. The aims of this present study are (i) to confirm the structure of the ε-polymorph of glycine using neutron powder diffraction, which is sensitive to all the atoms in the structure, (ii) to develop a more detailed picture of the nature and strengths of the intermolecular interactions present in γ and ε glycine, and (iii) to obtain physical insight into the thermodynamic driving forces of transitions between the phases.
Phase nomenclature used for high-pressure polymorphs of glycine
Much of the crystallographic work on pressure-induced polymorphism in glycine has been carried out in parallel by two groups: our own and that led by Boldyreva. There has developed a confusing difference in phase-nomenclature. In our publication on glycine,12 reporting the crystal structures of phases obtained by compression of β and γ-glycine, we referred to the phase obtained on compression of β-glycine as δ-glycine, and that obtained from γ-glycine as ε-glycine. In ref. 14 the phase obtained by compression of γ-glycine is labelled δ-glycine (we called it ε-glycine). In a Raman study, the phase obtained by compression of β-glycine is referred to as β'-glycine.18 Yet another phase, ζ-glycine, has been proposed on the basis of X-ray powder diffraction and Raman studies of the phase obtained on decompression of compressed γ-glycine.17 Boldyreva's scheme does not designate any phase ε.All of this is certainly confusing to anyone trying to understand the differing behaviour of the high-pressure polymorphs of glycine, but it has arisen because the first papers in which the names were proposed, ref. 12, 14, and 18, were all submitted at about the same time, August, September and October 2004. But to summarise: the usage in Boldyreva's papers is: β → β' and γ → δ → ζ (on decompression); that in our own is: β → δ and γ → ε (→ζ on decompression). The second labelling scheme is arguably simpler, makes use of a contiguous series of Greek letters and avoids the somewhat arbitrary use of primes. For these reasons we continue to apply it in the present paper.
Experimental
Glycine-d5 was purchased from CDN Isotopes (catalogue number D-277, 98.2 atom% D). γ-Glycine-d5 was prepared by first dissolving glycine-d5 (1.56 g) in D2O (5 ml). A solution of NaOD in D2O was then added drop-wise to raise the pH to 10 and the resulting solution was left to evaporate over the course of one week. Crystals of γ-glycine were identified optically, and checked by single-crystal diffraction.Neutron powder diffraction at high pressure
Ambient temperature, high-pressure neutron powder diffraction data were collected by the time-of-flight technique on the PEARL beamline at ISIS.23,24 Approximately 30 mm3 of γ-glycine-d5 was gently ground into a fine powder and loaded into a null-scattering Ti–Zr alloy capsule gasket.25 A ~5 mm3 pellet of lead was included as a pressure marker and a 4![[thin space (1/6-em)]](https://www.rsc.org/images/entities/char_2009.gif) :
:![[thin space (1/6-em)]](https://www.rsc.org/images/entities/char_2009.gif) 1 mixture of MeOD
1 mixture of MeOD![[thin space (1/6-em)]](https://www.rsc.org/images/entities/char_2009.gif) :
:![[thin space (1/6-em)]](https://www.rsc.org/images/entities/char_2009.gif) EtOD was used as a hydrostatic medium. The gasket assembly was loaded into a type V3b Paris-Edinburgh (P-E) press in which the ram pressure was monitored and adjusted by means of a computer-controlled hydraulic system.26–28
EtOD was used as a hydrostatic medium. The gasket assembly was loaded into a type V3b Paris-Edinburgh (P-E) press in which the ram pressure was monitored and adjusted by means of a computer-controlled hydraulic system.26–28
Time-of-flight (TOF) neutron powder diffraction data suitable for structure refinement were obtained by electronically focusing the 1080 individual detector element spectra of the main PEARL detector bank centred at 2θ = 90°. The intensity scale of the summed pattern was then normalised with respect to the incident beam monitor and the scattering from a standard vanadium calibration sample. Lastly, the intensities were corrected for the wavelength and scattering-angle dependence of the neutron attenuation by the P-E cell anvil (WC/Ni-binder) and gasket (TiZr) materials.
Structure solution and refinement
Diffraction data were collected in steps of approximately 0.5 GPa, a phase-pure sample of ε-glycine being obtained at 4.3 GPa. Data were collected at this pressure and at 5.3 GPa before decompressing the sample. Data were collected at 0.55 GPa before finally releasing the load altogether. Rietveld refinements of the structure of ε-glycine were carried-out using TOPAS-Academic (Coelho, 2005) starting from the coordinates in ref. 12. Lead, tungsten carbide and nickel were also included in the refinement models. The weak tungsten carbide and nickel peaks originate from the P-E cell anvil cores which consisted of cemented WC with a Ni binder. The refined cell dimensions of lead were used to calculate the applied pressure using a Birch–Murnaghan equation of state29,30 with Vo = 30.3128 Å3, Bo = 41.92 GPa, B' = 5.72. These parameters were derived by Fortes31,32 by refitting data reported in three earlier studies.33–35All intramolecular bond distances and angles were constrained to their ambient pressure values, with all N–D and C–D distances fixed at 1.05 Å and 1.09 Å, respectively. Torsion angles were refined. This strategy was validated by optimizing the atomic coordinates using periodic DFT (see below). Between 0.55 and 4.3 GPa the largest change in calculated bond distance and angle were 0.013 Å (for C1–C2) and 0.88° (for <C2–N1–H5), respectively. Such calculations have been shown to reproduce experimentally determined atomic positions with crystal packing similarity values36 of <0.1 Å.37
All non-hydrogen atoms were refined with a common isotropic thermal parameter and the displacement parameters of the D-atoms were set equal to 1.5 times this value. The final Rietveld38 fits for ε-glycine at 4.3 and 0.55 GPa are shown in Fig. 1. Unit cell dimensions and refinement parameters are presented in Table 1. Crystallographic information files can be obtained from the Cambridge Crystallographic Data Centre, quoting deposition numbers 1048931 and 1048932.
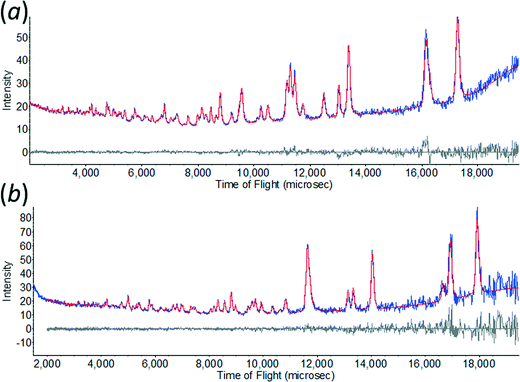 | ||
| Fig. 1 The observed time-of-flight neutron powder diffraction pattern of ε-glycine at (a) 4.3 GPa, and (b) 0.55 GPa showing Rietveld profile refinement fits. | ||
| Phase | ε | ε |
|---|---|---|
| Load (tonnes) | 50 | 2 |
| Pressure (GPa) | 4.275(15) | 0.547(16) |
| Temperature (K) | 298 | |
| Formula | C2D5NO2 | |
| M r | 80.0974 | |
| Crystal system | Monoclinic | |
| Space group | Pn | |
| a, b, c (Å), β (°) | 4.8695(4) | 5.0092(6) |
| 5.7118(3) | 5.9924(6) | |
| 5.4416(4) | 5.4976(5) | |
| 117.468(6) | 115.298(10) | |
| V (Å3) | 134.289(18) | 149.20(3) |
| Z | 2 | |
| D x (Mg m−3) | 1.981 | 1.783 |
| Radiation | Neutron | |
| Sample volume (mm3) | 30 | |
| d-spacing range (Å) | 0.4–4.0 | 0.4–4.0 |
| R factors (%) and goodness of fit | R p = 2.52 | R p = 4.85 |
| R wp = 2.17 | R wp = 3.83 | |
| R exp = 1.54 | R exp = 3.46 | |
| S = 1.41 | S = 1.11 | |
| No. parameters | 47 | 47 |
| Weighting scheme | Based on measured s.u.s | |
| Max (Δ/σ) | <0.0001 | |
Crystal structures were visualized using the programs MERCURY,36 SHELX-TL XP,39 CAMERON40 and DIAMOND.41 Analyses were carried out using PLATON,42 as incorporated in the WIN-GX suite.43 Searches of the Cambridge Crystallographic Database were carried out using CONQUEST 1.17 with CSD updates to November 2014.44,45
PIXEL, symmetry-adapted perturbation theory calculations and Hirshfeld analysis
Molecular electron densities were obtained using the program GAUSSIAN09 revision A.0246 at the MP2 level with the 6-31G** basis set. The electron density was then analysed using the PIXELc module47–50 of CLP program package51 which allows the calculation of dimer and lattice energies.Symmetry-adapted perturbation theory calculations4,52 were carried-out with the PSI4 code (version Beta5)53 using the SAPT2+3 method54,55 with the aug-cc-pVDZ basis set. δEHF(3) corrections were applied to induction energies in all cases.56
Hirshfeld surface calculations57 were performed with CrystalExplorer version 3.1.58 TONTO was used for calculation of electrostatic potentials59 with the cc-pVDZ basis set at the HF level.
Periodic DFT calculations
Geometry optimisations were carried-out using the plane-wave pseudopotential method in the CASTEP code60 as incorporated into Materials Studio version 7.61 The PBE exchange-correlation functional was used62 with norm-conserving pseudopotentials and a basis set cut-off energy of 830 eV. Brillouin zone integrations were performed with a Monkhorst–Pack63k-point grid spacing of 0.08 Å−1. The starting structures were taken from the experimental structure of ε-glycine at 0.55 GPa and, for γ-glycine, CSD refcode GLYCIN16.10 The coordinates and unit cell dimensions were optimised using the Tkatchenko–Scheffler correction for dispersion (DFT-D).64,65 Zero pressure was applied in all calculations with the aim of obtaining coordinates for both phases under identical conditions. The total energy convergence tolerance was 5 × 10⁻⁶ eV per atom, with a maximum force tolerance of 0.01 eV Å−1, maximum stress component 0.02 GPa and a maximum displacement of 5 × 10⁻⁴ Å. The SCF convergence criterion was 5 × 10⁻⁷ eV per atom, and the space group symmetry was retained during geometry optimisation.The optimised cell parameters and volume for γ-glycine were: a = 7.0806 [expt at 83 K: 6.975(2)] Å, c = 5.4889 [5.473(2)] Å and V = 238.31 [230.6(2)] Å3. The corresponding figures for ε-glycine were a = 5.1039, b = 6.0437, c = 5.4760 Å, β = 112.7°, V = 155.8 Å3. Optimised coordinates are given in Tables S1 and S2 of the ESI.†
For lattice dynamics calculations the coordinates were reoptimised with tighter convergence criteria: energy convergence tolerance was 1 × 10⁻⁷ eV per atom, with a maximum force tolerance of 0.005 eV Å−1 and a maximum displacement of 1 × 10⁻⁵ Å; the SCF convergence criterion was 1 × 10⁻¹⁰ eV per atom. The maximum force on any atom at convergence was 0.00013 eV Å−1. Phonon density-of-states and dispersion curves were calculated with Fourier interpolation.66,67 Frequencies were calculated for the h5 isotopologues to facilitate comparisons with previously published data.
Calculated and observed68 INS spectra for γ-glycine are shown in Fig. 2a, and the calculated density of states for both forms are compared in Fig. 2b. Data for these figures were processed using A-Climax,69 and the observed data were downloaded from the TOSCA INS database (http://www.isis.stfc.ac.uk/instruments/tosca/ins-database/ins-database9060.html).
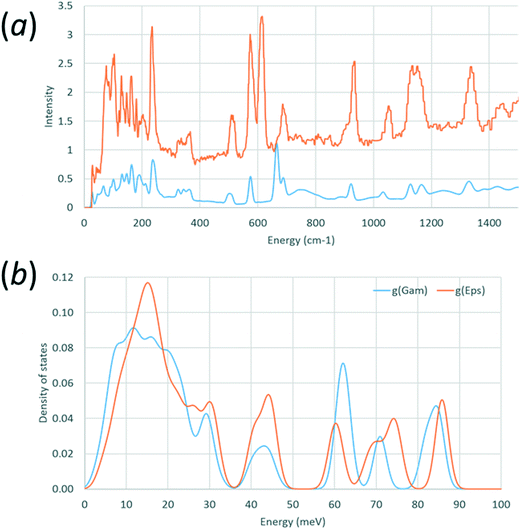 | ||
| Fig. 2 (a) Comparison of observed (red) and calculated (blue) phonon densities of states for γ-glycine-h5. (b) Calculated density of states for γ-glycine-h5 (blue) and ε-glycine-h5 (red). | ||
Results
The effect of increasing pressure
At ambient pressure a powder pattern of pure γ-glycine was obtained, confirming the starting phase. On increasing pressure to 3.5 GPa the sample was seen to have begun the phase transition to ε-glycine. On increasing the pressure to 4.3 GPa a single-phase powder pattern of ε-glycine was obtained.Intermolecular interactions in ε-glycine
The structure of ε-glycine-d5 at 4.3 GPa is largely consistent with our previously published structure at the same pressure.12 The molecular coordination number is 14 with a topology reminiscent of body-centred cubic packing, an arrangement inherited from the parent γ-phase. Intermolecular contacts are listed in Table 2.| # | Contact | Operation | H⋯O/Å | N/C⋯O/Å | <N/C–H⋯O/° |
|---|---|---|---|---|---|
| Contacts formed within layers | |||||
| A | N1H3⋯O2 | x, y, −1 + z | 1.828(2) | 2.7797(8) | 148.8(3) |
| N1H3⋯O1 | x, y, −1 + z | 2.213(8) | 3.080(6) | 138.5(2) | |
| PIXEL energies | E elec = −123.1; Epol = −40.6; Edisp = −17.1; Erep= 72.3; Etot = −108.5 | ||||
| B | N1H5⋯O1 | 1 + x, y, z | 1.683(12) | 2.733(12) | 177.5(10) |
| PIXEL energies | E elec = −43.0; Epol = −49.2; Edisp = −17.4; Erep= 82.2; Etot = −27.4 | ||||
| C | C2H1⋯O2 | −1 + x, y, −1 + z | 2.359(4) | 3.436(6) | 169.2(4) |
| PIXEL energies | E elec = 15.3; Epol = −6.9; Edisp = −5.2; Erep = 7.8; Etot = +11.1 | ||||
| Contacts formed between layers mediated by N1–H4 | |||||
| D | N1H4⋯O1 | 1/2 + x, 1 − y, −1/2 + z | 2.08(3) | 2.970(19) | 140.9(2) |
| PIXEL energies | E elec = −50.7; Epol = −19.2; Edisp = −11.3; Erep = 21.4; Etot = −59.8 | ||||
| E | N1H4⋯O2 | −1/2 + x, 1 − y, −1/2 + z | 2.279(9) | 3.008(9) | 125.1(6) |
| C2H1⋯O2 | −1/2 + x, 1 − y, −1/2 + z | 2.484(18) | 2.908(15) | 101.7(2) | |
| PIXEL energies | E elec = 54.0; Epol = −32.0; Edisp = −21.5; Erep = 30.6; Etot = +31.0 | ||||
| Contacts formed between layers mediated by C2–H2 | |||||
| F | C2H2⋯O1 | 1/2 + x, 2 − y, −1/2 + z | 2.205(16) | 3.024(17) | 130.1(3) |
| PIXEL energies | E elec = −37.1; Epol =−15.6; Edisp = −11.1; Erep = 23.4; Etot = −40.4 | ||||
| G | C2H2⋯O2 | −1/2 + x, 2 − y, −1/2 + z | 2.184(11) | 3.107(14) | 141.0(7) |
| PIXEL energies | E elec = 52.0; Epol = −20.2; Edisp = −19.9; Erep= 38.8; Etot = +51.2 | ||||
Chains of molecules generated by lattice repeats along c are connected by head-to-tail N1H3⋯O2 hydrogen bonds, which exhibit asymmetric bifurcation to O1. The graph set motif for these chains (ignoring the bifurcation) is C(5). The N1H3⋯O2 H-bond distance (interaction A in Table 2) in the chains is 2.7797(8) Å, and this is comparable to the H-bond length from our previously-reported X-ray structure (2.81(4) Å).
The chains are connected by N1H5⋯O1 H-bonds to equivalent chains, related by lattice translations along a. This builds layers which are parallel to the ac planes containing secondary-level R44(16) motifs (Fig. 3a). The layers stack along the b-axis. With an N⋯O separation of 2.59(4) Å, the N1H5⋯O1 H-bond (interaction B in Table 2) formed along a appeared to be very short in our previous study; a more ‘normal’ value of 2.733(12) Å was obtained in this determination. There is nothing out of the ordinary in these interactions, and distances similar to these are seen in amino acid crystal structures even at ambient conditions.
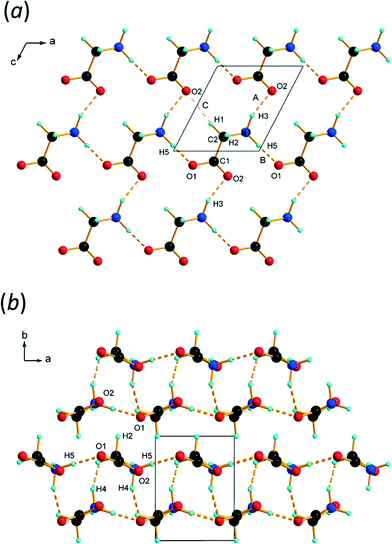 | ||
| Fig. 3 (a) Layers formed parallel to the ac planes in ε-glycine at 4.3 GPa. (b) Stacking of layers along b. | ||
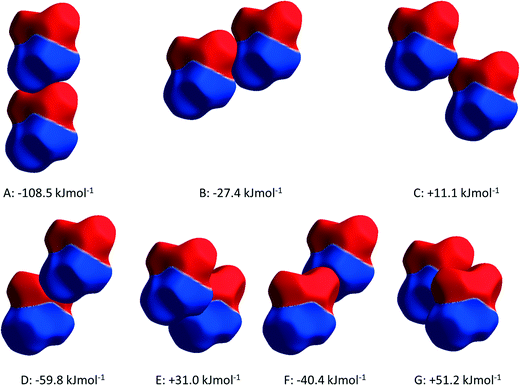
PIXEL3,50 calculations enable intermolecular interaction energies to be estimated (Table 2). The energies obtained refer to total interactions between pairs of molecules, partitioned into electrostatic, polarisation, dispersion and repulsion contributions. Although the N⋯O distances in N1H3⋯O2/1 and N1H5⋯O1 interactions are quite similar, PIXEL calculations show that the interaction energies are very different: −108.5 and −27.4 kJ mol−1. While the polarisation, dispersion and repulsion terms are comparable, the electrostatic component in interaction A (incorporating N1H3⋯O2/1) is almost three times that in B (N1H5⋯O1). The electrostatic enhancement of the energy of interaction A can be traced to the complementarity of the electrostatic potentials70 (shown mapped onto Hirshfeld surfaces in Fig. 4) where the positively-charged domain of one molecule is in contact only with the negative region of the other; in interaction B like-charged regions are more closely located.
Intermolecular interactions between the layers
The interlayer spacing along b alternates between 2.80 and 2.91 Å depending on whether the layers are separated by ammonium (H4) or alkyl (H2) hydrogen atoms (Fig. 3b). Conventional H-bonding analysis suggests that the layers separated by H4 are connected by N1H4⋯O1/2 H-bonds (D and E in Table 2 and Fig. 5a), while those separated by H2 are connected by weaker C2H2⋯O1 contacts (F and G in Table 2 and Fig. 5b). This ‘bilayer’ structure is reminiscent of the structure of α-glycine, where alternate layers are connected either by NH⋯O H-bonds or by what have been described as weak CH⋯O H-bonds12,71 or van der Waals interactions.16 We commented in ref. 12 that the H-bonding contacts in ε-glycine involving H4 seemed rather long by comparison with the other hydrogen bonds in the structure. There was even a suggestion, albeit tentatively made on the basis of quite imprecise contact distances, that CH⋯O interactions had replaced NH⋯O hydrogen bonds in the transition from γ to ε-glycine.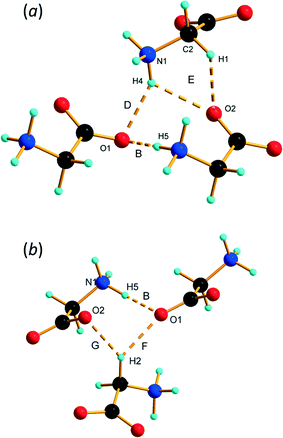 | ||
| Fig. 5 Inter-layer interactions. (a) Contacts between layers connected by interactions involving H4. (b) Contacts between layers connected by H2. | ||
The more precise data derived from the present study, in combination with PIXEL calculations, enable a more detailed and different picture to emerge. The N1H4⋯O1 contact (D in Table 2, Fig. 5a) is somewhat longer than those involving H3 and H5, though at 2.970(19) Å the N⋯O distance is not unusual for a H-bond. There is some bifurcation to O2 in a neighbouring molecule (contact E), but the angles subtended at H4 [140.9(2) and 125.1(6)°] are small for a conventional H-bond.72 PIXEL and Hirshfeld surface calculations indicate that the intermolecular interaction energy in contact D is −59.8 kJ mol−1, showing that even though the geometry of the interaction is less than ideal for a H-bond, it is still a strong interaction because of the complementarity of the electrostatic potentials of the interacting molecules (Fig. 4).
The intermolecular interaction labelled E in Table 2 comprises NH⋯O and CH⋯O interactions (Fig. 5a), but the PIXEL calculations indicate that the overall interaction between the molecules forming the contact is actually repulsive (+31.0 kJ mol−1). Repulsive contacts in glycine structures have been noted previously,73–75 and this feature can be traced to electrostatic repulsions which occur as the result of contact between like-charged regions of the electrostatic potentials shown in Fig. 4.
The layers mediated by the alkyl hydrogen atoms (H2) appear to be held together by CH⋯O H-bonds (contacts F and G in Table 2, Fig. 5b). PIXEL calculations show that the total intermolecular energy in contact F is −40.4 kJ mol−1, and is much more energetic than would be expected on the basis of CH⋯O contacts, which typically have energies of 10 kJ mol−1 or less. As with the other interactions described here, there is a substantial electrostatic attraction between ammonium and carboxylate groups, and this is more accurately described as another Coulombic interaction rather than a CH⋯O interaction. The intermolecular energy of contact G is strongly repulsive.
Beyond the first coordination sphere there are numerous electrostatic interactions in the range −19.9 to +32.9 kJ mol−1 mostly formed between the layers.
The effect of decreasing pressure
The sample was decompressed in stages from 5.3 GPa and it was found that the transition shows substantial hysteresis, with single-phase ε-glycine persisting down to 0.55 GPa. A table of intermolecular contacts at 0.55 GPa is available in the ESI† (Table S3); H⋯O distances are longer by between 0.02 and 0.30 Å than those at 4.3 GPa. The smallest change, from 1.828 to 1.845 Å occurs in the strongest head-to-tail H-bonding interaction (A), while the largest changes occur in repulsive interactions C (0.30 Å), G (0.24 Å) and E (0.17 and 0.14 Å). Interaction energies mostly change by less than 5 kJ mol−1, the exception being repulsive interaction G, which becomes around 8 kJ mol−1 less positive.Upon releasing pressure from the sample completely, the peaks corresponding to ζ-glycine17 were observed at d-spacings of 4.14, 3.91, 3.31, 3.08, 2.77, 2.55, 2.37 and 1.95 Å. Statistics were quite poor because the phase is short-lived, and after 30 minutes peaks from the ζ-polymorph diminished. And the sample transformed fully to γ-glycine over the course of the following hour.
Phonon calculations
Calculation of phonon dispersion and density of states was carried-out for ε glycine using a structure where both cell dimensions and atomic coordinates had been allowed to optimise with the aim of detecting any mechanical instabilities. Parallel calculations were carried out on the γ-form with the aim of validating the methodology by comparison of calculated and observed inelastic neutron scattering (INS) spectra.Observed68 and calculated INS spectra for γ-glycine are shown in Fig. 2a. Peak positions generally agree well, with the exception of the band calculated at 665 cm−1 and observed at 610 cm−1. Animation of this mode indicates that it corresponds to the NH3 torsional oscillations. The very low frequency envelope, corresponding to ‘external’ or ‘lattice’ modes, and which is satisfactorily reproduced, determines mechanical stability and is the region which contributes most to entropy.
Fig. 2b shows an overlay of the density of phonon states for ε and γ glycine. Experimental INS spectra for both phases are available in ref. 16 and Fig. 2b is shown as a function of energy loss in meV‡ to enable comparison with data in that paper. Peak positions in Fig. 8a of ref. 16 agree with those on Fig. 2b. No phonons were calculated to have imaginary frequencies in either phase, showing that both are predicted to be mechanically stable at 0 K and 0 GPa. This observation is consistent with the persistence of the ε-form on decompression to near ambient pressure.
The frequency calculations enable the zero point energy + thermal contribution to enthalpy and entropy of the γ-phase to be estimated as 228.0 kJ mol−1 and 101.8 J mol−1 K−1 at 298 K; the experimental value of the entropy of γ-glycine at 298.15 K is 103.35 J mol−1 K−1.76 The corresponding calculated figures for ε-glycine are 228.0 kJ mol−1 and 100.6 J mol−1 K−1. The higher entropy of the γ-form is the result of the lower phonon frequencies evident in Fig. 2b.
Discussion
The ε-γ phase transition
The space groups of γ- and ε-glycine (P32 and Pn, respectively) are not directly related by a group–subgroup relationship. The transition pressures between the γ- and the ε-forms are subject to a large hysteresis. The γ → ε transformation pressure is sample-dependent, but in this study occurred between 3.5 and 4.3 GPa; by contrast the reverse transformation was only observed on complete decompression. According to DFT phonon calculations all phonons have real frequencies, indicating that the ε-phase is mechanically stable. The transformations between γ and ε glycine are therefore reconstructive rather than displacive.The thermodynamic stability of ε-glycine at high pressure
Fig. 6 shows the first coordination sphere of a central reference molecule in each phase; the molecules shown all form an interatomic contact with the central reference molecule measuring 3 Å or less. In each phase there are 14 molecules falling into seven pairs of symmetry-equivalent interactions. The labelling in Fig. 6 is intended to enable similar positions in the two phases to be correlated, so that molecules A, B, C⋯N in ε-glycine (Fig. 6a) are respectively in similar positions to molecules 1, 2, 3⋯14 in γ-glycine (Fig. 6b). In ε-glycine interaction A is equivalent to H, B to I and so on.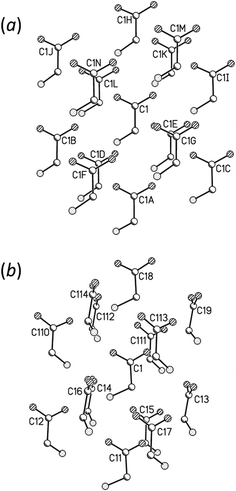 | ||
| Fig. 6 Comparison of the first coordination spheres in (a) ε- and (b) γ-glycine. The view in (a) is along [010] and in (b) along [110]. The coordinates plotted in this and subsequent figures are taken from periodic DFT geometry optimisations. H-atoms are omitted in the interests of clarity. In (a) the layer of Fig. 3a contains the central molecule together with molecules A, B, C, H, I and J. | ||
Although the transition between ε and γ-glycine is reconstructive, the phases share a number of common features. Both phases consist of head-to-tail chains of H-bonded glycine molecules; both structures are polar with all chains running in the same sense parallel to the crystallographic c-axes. The repeat distance in the H-bonded chains correspond to the c-axis lengths in both cases, and the similarity of these parameters [5.473(2) Å for γ10 and 5.4976(5) Å for ε] demonstrates that this motif is essentially the same in both phases, and indeed in many amino acid structures.
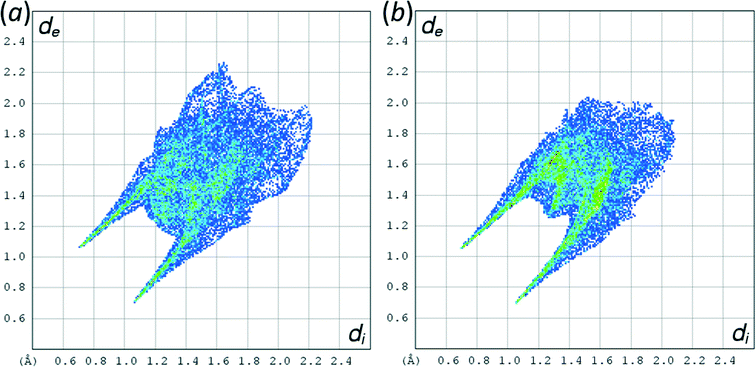
The phases differ in both the relative orientations of the chains and in the relative positions of molecules in neighbouring chains, a relationship which is made clearer in an animation available in the ESI† (Movie1.gif). In γ-glycine neighbouring chains are generated by 32 screw axes and their orientations are therefore related by 120° rotations about the chain axis (Fig. 6b). In ε-glycine the difference in orientation is of the order of 30° (Fig. 6a). Comparison of Fig. 7a and b, which show c-axis projections of the first coordination spheres of both phases in which molecular envelopes are represented by inertial tensor ellipsoids,40 demonstrates that packing seems more efficient in the ε-phase. The greater packing efficiency arises because the orientations of the molecules in γ-glycine give Fig. 7b a greater vertical height than Fig. 7a, while there are smaller and more evenly distributed interstitial voids in ε-glycine. The packing efficiency is somewhat more obvious in Hirshfeld fingerprint plots (Fig. 8),77 the high de/di region which corresponds to contacts formed across interstitial voids being more diffuse for the γ-form (Fig. 8a) than for the ε-form (Fig. 8b). The same plots show a narrower distribution of H⋯H contacts, seen in the area between the H-bond spikes and on the main ‘body’ of the plots.
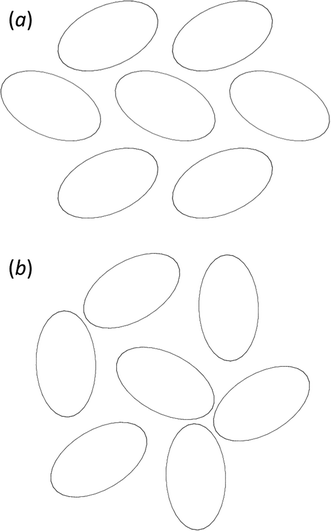 | ||
| Fig. 7 (a) ε-glycine projected along [001] with molecules shown as inertial tensors. (b) The corresponding view for γ-glycine, also viewed along [001]. Both figures are on the same scale. | ||
Experimentally γ-glycine at room temperature and ambient pressure (CSD refcode GLYCIN15)10 has a volume of 76.9 Å3 per molecule; the corresponding figure for ε-glycine at room temperature and 0.55 GPa is 74.6 Å3 per molecule, though this difference is misleading because of the difference in pressure. In the absence of an equation-of-state for each phase the unit cell dimensions and atomic coordinates of both structures were optimised at zero applied pressure by DFT. The optimised molecular volumes were 79.4 (γ) and 77.9 (ε) Å3 per molecule. The lower molecular volume of ε-glycine gives it a thermodynamic advantage over the γ-form at high pressure through the pressure × volume contribution to the free energy.
The thermodynamic stability of γ-glycine at ambient pressure
Full interaction maps78 calculated for ε and γ-glycine are shown in Fig. 9a and b, respectively. The map for γ-glycine (Fig. 9b) shows good overlap between optimal acceptor density and the positions of carboxylate oxygen atoms. By contrast one of the three carboxylate acceptors in ε-glycine (Fig. 9a) is displaced away from its full interaction map maximum. Features such as this are associated with polymorphic instability,78 and suggest that at ambient pressure γ-glycine intermolecular interactions are more optimal than in the ε-form. A plot of intermolecular energy against centroid–centroid distance (Fig. 10) shows a rather similar pattern for both phases; differences are quite subtle, but a number of contacts in the ε-form are more destabilising than in the γ-form. The γ-to-ε transition has been observed at pressures as low as 0.8 GPa. A volume change of −1.5 Å3 at 0.8 GPa would contribute less than 1 kJ mol−1 to the free energy of the γ → ε phase transition, and, in view of the similar entropies of the two phases, the lattice energies of the two forms must be quite finely balanced.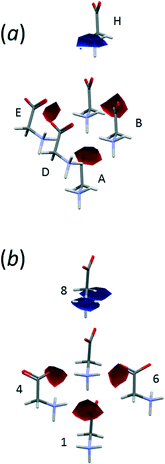 | ||
| Fig. 9 Full interaction maps for (a) ε- and (b) γ-glycine. The procedure for plotting the maps follows that described in ref. 78, and only the highest maxima are shown. Blue and red correspond to optimal sites for hydrogen bond donors and acceptors. | ||
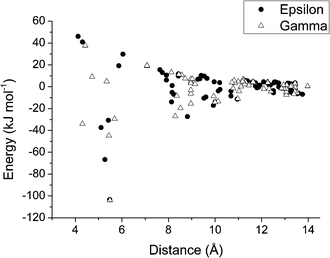 | ||
| Fig. 10 Plot of contact energies (kJ mol−1) against centroid⋯centroid distance (Å) in ε (filled circles) and γ-glycine (open triangles). Energies were calculated using the PIXEL method. | ||
Quantification of intermolecular interaction energies (again using the optimised structures) was investigated using both PIXEL and symmetry-adapted perturbation theory (Tables S4 and S5†). The SAPT calculations were carried out at the SAPT2+3 level with the aug-cc-pVDZ basis set, conditions which have been found to reproduce CCSD(T) complete basis set limit energies for the S22 test database79 of intermolecular interaction energies with a mean unsigned error in the region of 1 kJ mol−1.56 The total energies can be fitted to the straight line ETOTAL,PIXEL = 0.94 ETOTAL,SAPT with a correlation coefficient of 0.998 (Fig. S1†). The value of the gradient shows that PIXEL energies are systematically lower than the SAPT energies; a fit of PIXEL and experimental sublimation energies was found to have a similar gradient (0.96).3
The pattern of attractive and repulsive energies in ε glycine mirrors that described above for the structure at 4.3 GPa, with 6/14 interactions having positive energies. In γ-glycine there are also 6 repulsive interactions, though two (7 and 14) have energies of less than 5 kJ mol−1. A balance-sheet of related interaction energies is shown in Table 3. Four out of the seven unique contacts in the first coordination sphere are destabilised during the transition, but the magnitude of the combined energy penalty is less than for the three contacts which are stabilised, so that together the seven unique interactions have a combined energy which is of the order of 30 kJ mol−1 more negative in γ-glycine (−28.9 when calculated with PIXEL and −26.2 by SAPT).
| ε-glycine | γ-glycine | Δ(ε → γ) | |||||
|---|---|---|---|---|---|---|---|
| Contact | PIXEL | SAPT | Contact | PIXEL | SAPT | PIXEL | SAPT |
| A | −103.3 | −112.6 | 1 | −103.9 | −110.6 | −0.6 | 2.0 |
| B | −37.3 | −37.4 | 2 | −29.4 | −30.4 | 7.9 | 7.0 |
| C | 19.2 | 17.4 | 3 | 37.6 | 38.8 | 18.4 | 21.4 |
| D | −66.7 | −63.9 | 4 | 9.0 | 18.5 | 75.7 | 82.4 |
| E | 46.1 | 48.7 | 5 | −44.8 | −49.3 | −90.9 | −98.0 |
| F | −30.7 | −33.1 | 6 | −34.0 | −35.3 | −3.3 | −2.2 |
| G | 41.0 | 43.0 | 7 | 4.9 | 4.2 | −36.1 | −38.8 |
| Totals | −131.7 | −137.9 | −160.6 | −164.1 | −28.9 | −26.2 | |
The largest changes occur for the transformations of molecules C, D, E and G in ε-glycine into 3, 4, 5 and 7 in γ-glycine. Molecule E, though it is hydrogen-bonded to the central reference molecule, forms a destabilising contact in ε-glycine as the result of the close proximity of like charges (Fig. 11). In the transformation to γ-glycine molecule E rotates, moving its ammonium group further away from that of the central molecule, and translates to form the stabilising carboxylate–ammonium interaction 5 (Fig. 11). In interaction 5 the closest NH⋯O distance is 2.77 Å, the NH⋯O angle 99.3° and the CO⋯H angle 170.2° which deviate substantially from optimal hydrogen bonding values. Paradoxically, it seems that the largest stabilising term in the ε to γ transformation is conversion of a repulsive interaction which incorporates a hydrogen bond (albeit with a small NH⋯O angle) into a contact which is longer-range but stabilising on account of its more favourable electrostatic interactions.
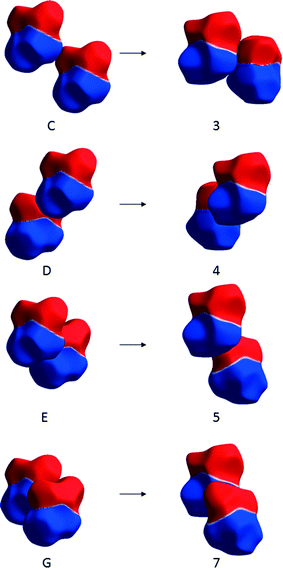 | ||
| Fig. 11 Changes in contacts C, D, E and G of ε-glycine (shown on the left) on transformation to contacts 3, 4, 5 and 7 in γ-glycine (right) depicted using electrostatic potentials mapped onto Hirshfeld surfaces. Colour scheme as Fig. 4. | ||
Destabilising terms in Table 3 arise from the transformation of other contacts. Notably contact D in ε-glycine, which is strongly stabilising but features a sub-optimal hydrogen bonding geometry, is converted into contact 4 in γ-glycine which has apparently ideal hydrogen bonding parameters (NH⋯O = 1.95 Å, <NH⋯O = 178.6°, <CO⋯H = 135.4°), but which is destabilising as the result of the close proximity of the ammonium groups (Fig. 11). Presumably the NH⋯O interaction taken on its own is stabilising in terms of isolated atom–atom energies, acting to attenuate the effect of the repulsion between the ammonium groups of the two molecules. But characterising the whole of interaction 4 only on the basis of the hydrogen bond fails to recognise that overall the molecule–molecule interaction is repulsive.
Beyond the first shell, long-range electrostatic interactions have energies of tens of kJ mol−1, and the procedure outlined above neglects these important interactions. It also fails to capture the many-body nature of the polarisation energy, which is likely to be important in such a polar structure. While estimation of the ε → γ transition enthalpy based only on the first coordination sphere is thus too severe an approximation, it does seem that the model gives some physical insight into the largest changes in intermolecular energy terms of the ε → γ transition. The large sign reversals occur as a result of molecular reorientations which move two like-charged centres away from each other, to be replaced by an interaction involving two oppositely charged centres. These features suggest that the optimal intermolecular interactions in γ-glycine occur at the expense of efficient packing of space, and this is why the ε-form is preferred at high pressure, while the γ-form is preferred at ambient pressure.
The discussion above has quoted figures obtained using the structures optimised by periodic DFT, but use of experimental structural data for ε-glycine at RT and 0.55 GPa and γ-glycine at RT and ambient pressure (GLYCIN15) leads to the same conclusions. Data equivalent to those presented in Table 3 but using the experimental structural data are presented in Table S6.†
Conclusions
The crystal structure of ε-glycine-d5 has been determined by high-pressure neutron powder diffraction at room temperature. The structural data are consistent with those previously determined using X-ray powder diffraction, but the precision is superior. Structural simulations using periodic DFT suggest that the structural data obtained here are also more accurate. Application of intermolecular energy calculations has enabled the features responsible for the stability of the γ- and ε-phases under different conditions to be identified, and have also led to substantial modification of our original interpretation of the structures.The on-set of the transformation from γ to ε glycine was 3.5 GPa, but the sample was mixed-phase at this pressure, and only became phase-pure at 4.3 GPa. The transition displays hysteresis, and diffraction data for the pure ε-phase could be collected at 0.55 GPa. On return to ambient pressure the sample transformed back to γ-glycine via the short-lived ζ-phase. The structure of the ζ-phase remains unsolved. This phase is only observed on release of pressure from the ε-phase, and is not observed during compression of the γ-phase. Such behaviour is unusual, though it has also been observed in L-cysteine, where decompression of the high-pressure form-III proceeds to phase-I via an intermediate phase-IV.80
ε-Glycine is formed at high pressure because it has a lower molecular volume than the γ form. Though the molecules in ε-glycine are more efficiently packed, high pressure distorts the geometry of the intermolecular contacts. Well-directed H-bonds are usually formed in amino acid crystal structures between the ammonium and carboxylate groups, but in ε-glycine the hydrogen bonds around one NH group are distinctly non-linear. This distortion can be clearly visualized in full interaction maps, which are likely to become a valuable tool for the analysis of high-pressure crystal structures. The H-bond geometry in γ-glycine is much more optimal, and this too, is clear from the full interaction map analysis.
The analysis of the crystal structures of amino acids presented in the paragraph above and in the literature emphasizes the importance of hydrogen bonding and hydrogen bond geometry. Regions of structures not connected by hydrogen bonds have been described as interacting through dispersion forces or CH⋯O contacts. The results of the packing energy calculations presented here illustrate the hazards of over-simplifying intermolecular interactions on the basis of prominent atom–atom contacts. Such analysis can completely miss the bigger picture, which in the case of glycine is the dominating importance of electrostatics. In the forms of glycine studied here, dispersion plays a negligible role, and there are no motifs that can plausibly be described as dispersion-based. Molecules connected by CH⋯O contacts have energies far in excess of accepted values for such interactions. Hydrogen bonds with ideal NH⋯O contact geometry are part of destabilising interactions. The interpretation of the structure presented here is thus a substantial revision to that presented in our original report of ε-glycine, and we anticipate that the conclusions are likely to be relevant to other amino acids. Hydrogen bonds have distinctive geometrical characteristics, and the ease with which they can be identified can lead the significance of other types of interaction to be missed.81 Glycine would appear to illustrate this perfectly.
In a recent paper exploring intermolecular interactions in croconate (C5O52−) salts, Dunitz, Gavezzotti and Rizzato82 noted that the interpretation of stability in ionic crystals differs radically from the corresponding exercise for crystals of neutral molecules. Equally, it is misleading to treat crystals of zwitterionic species such as amino acids as though they were constructed of non- or moderately polar molecules.
Whereas in crystals of non- or moderately polar neutral molecules short intermolecular contacts are usually attractive, short range intermolecular interactions in ionic crystals can be strongly repulsive. This is well known in simple salts, such as the repulsion of chloride anions in NaCl. Cation–anion interactions can pull like-charged species into close proximity, a feature described as ‘electrostatic compression’ by Braga and co-workers.83,84 Crystal structures of croconate salts feature stacks of di-anions with interplanar distances of 3.1–3.4 Å which, though they would be highly unstable in isolation, nevertheless exhibit metrics characteristic of graphitic stacking.84 Similarly, in glycine the text-book geometry of a NH⋯O hydrogen bond disguises underlying intermolecular repulsion, giving quite a misleading view of the structural motifs which promote thermodynamic stability. It seems paradoxical that full interaction maps predict correct intermolecular environments even for repulsive interactions, and this is a feature which merits further investigation.
Acknowledgements
We would like to thank STFC for provision of neutron beam-time at ISIS, the EPSRC for funding and the EaStCHEM Research Computing Facility for computational resources. We also thank Mr Duncan Francis of the ISIS Facility for his assistance during beam-time, and Dr Stewart Parker, also of ISIS, for helpful advice about INS spectra.References
- T. S. Thakur, R. Dubey and G. R. Desiraju, IUCrJ, 2015, 2, 159–160 CrossRef CAS PubMed.
- J. Dunitz, IUCrJ, 2015, 2, 157–158 CrossRef CAS PubMed.
- A. Gavezzotti, Molecular Aggregation - Structure Analysis and Molecular Simulation of Crystals and Liquids, Oxford University Press, New York, 1st edn., 2007 Search PubMed.
- A. J. Stone, The Theory of Intermolecular Forces, Oxford University Press, Oxford, 2013 Search PubMed.
- R. E. Marsh, Acta Crystallogr., 1958, 11, 654–663 CrossRef CAS.
- T. Aree and H.-B. Bürgi, J. Phys. Chem. A, 2012, 116, 8092–8099 CrossRef CAS PubMed.
- Y. Iitaka, Acta Crystallogr., 1960, 13, 35–45 CrossRef CAS.
- E. V. Boldyreva, T. N. Drebushchak and E. S. Shutova, Z. Kristallogr., 2003, 218, 366–376 CrossRef CAS.
- Y. Iitaka, Acta Crystallogr., 1961, 14, 1–10 CrossRef CAS.
- A. Kvick, W. M. Canning, T. F. Koetzle and G. J. B. Williams, Acta Crystallogr., Sect. B: Struct. Crystallogr. Cryst. Chem., 1980, 36, 115–120 CrossRef CAS.
- G. L. Perlovich, L. K. Hansen and A. Bauer-Brandl, J. Therm. Anal. Calorim., 2001, 66, 699–715 CrossRef CAS.
- A. Dawson, D. R. Allan, S. A. Belmonte, S. J. Clark, W. I. F. David, P. A. McGregor, S. Parsons, C. R. Pulham and L. Sawyer, Cryst. Growth Des., 2005, 5, 1415–1427 CAS.
- E. V. Boldyreva, H. Ahsbahs and H. P. Weber, Z. Kristallogr., 2003, 218, 231–236 CrossRef CAS.
- E. V. Boldyreva, S. N. Ivashevskaya, H. Sowa, H. Ahsbahs and H.-P. Weber, Z. Kristallogr., 2005, 220, 50–57 CrossRef CAS.
- E. V. Boldyreva, S. N. Ivashevskaya, H. Sowa, H. Ahsbahs and H. P. Weber, Dokl. Phys. Chem., 2004, 396, 111–114 CrossRef CAS.
- H. N. Bordallo, E. V. Boldyreva, A. Buchsteiner, M. M. Koza and S. Landsgesell, J. Phys. Chem. B, 2008, 112, 8748–8759 CrossRef CAS PubMed.
- S. V. Goryainov, E. V. Boldyreva and E. N. Kolesnik, Chem. Phys. Lett., 2006, 419, 496–500 CrossRef CAS PubMed.
- S. V. Goryainov, E. N. Kolesnik and E. V. Boldyreva, Phys. B, 2005, 357, 340–347 CrossRef CAS PubMed.
- N. A. Tumanov, E. V. Boldyreva and H. Ahsbahs, Powder Diffr., 2008, 23, 307–316 CrossRef CAS.
- C. Murli, S. M. Sharma, S. Karmakar and S. K. Sikka, Phys. B, 2003, 339, 23–30 CrossRef CAS.
- A. K. Mishra, C. Murli and S. M. Sharma, J. Phys. Chem. B, 2008, 112, 15867–15874 CrossRef CAS PubMed.
- Y. Hirai, Y. Nibu and H. Shimada, Fukuoka Daigaku Rigaku Shuho, 2005, 35, 17–24 CAS.
- ISIS, ISIS 96 - ISIS Facility Annual Report 1995–96, Rutherford Appleton Laboratory, 1996, RAL-TR-96-050, pp. 61–62 Search PubMed.
- ISIS, ISIS 97 - ISIS Facility Annual Report 1996–97, Rutherford Appleton Laboratory, 1997, RAL-TR-97-050, pp. 28–29 Search PubMed.
- W. G. Marshall and D. J. Francis, J. Appl. Crystallogr., 2002, 35, 122–125 CrossRef CAS.
- J. M. Besson and R. J. Nelmes, Phys. B, 1995, 213&214, 31–36 CAS.
- J. M. Besson, R. J. Nelmes, G. Halem, J. S. Loveday, G. Weill and S. Hull, Phys. B, 1992, 180–181, 907–910 CrossRef CAS.
- Y. Le Godec, M. T. Dove, S. A. T. Redfern, M. G. Tucker, W. G. Marshall, G. Syfosse and S. Klotz, High Pressure Res., 2003, 23, 281–287 CrossRef CAS PubMed.
- R. J. Angel, Rev. Mineral. Geochem., 2002, 41, 35–59 CrossRef.
- F. Birch, Phys. Rev., 1947, 71, 809–824 CrossRef CAS.
- A. D. Fortes, I. G. Wood, M. Alfredsson, L. Vocadlo, K. S. Knight, W. G. Marshall, M. G. Tucker and F. Fernandez-Alonso, High Pressure Res., 2007, 27, 201–212 CrossRef CAS PubMed.
- A. D. Fortes, I. G. Wood, M. Alfredsson, L. Vocadlo, K. S. Knight, W. G. Marshall, M. G. Tucker and F. Fernandez-Alonso, High Pressure Res., 2012, 32, 337–337 Search PubMed.
- A. Z. Kuznetsov, V. Dmitriev, L. Dubrovinsky, V. Prakapenka and H. P. Weber, Solid State Commun., 2002, 122, 125–127 CrossRef CAS.
- R. A. Miller and D. E. Schuele, J. Phys. Chem. Solids, 1969, 30, 589–600 CrossRef CAS.
- D. L. Waldorf and G. A. Alers, J. Appl. Phys., 1962, 33, 3266–3269 CrossRef CAS PubMed.
- C. F. Macrae, I. J. Bruno, J. A. Chisholm, P. R. Edgington, P. McCabe, E. Pidcock, L. Rodriguez-Monge, R. Taylor, J. van de Streek and P. A. Wood, J. Appl. Crystallogr., 2008, 41, 466–470 CrossRef CAS.
- J. Binns, M. R. Healy, S. Parsons and C. A. Morrison, Acta Crystallogr., Sect. B: Struct. Sci., Cryst. Eng. Mater., 2014, 70, 259–267 CAS.
- H. M. Rietveld, J. Appl. Crystallogr., 1969, 2, 65–71 CrossRef CAS.
- G. M. Sheldrick, SHELXTL-XP, University of Göttingen, Germany and Bruker-AXS, Göttingen, Germany and Madison, Wisconsin, USA, 2001 Search PubMed.
- L. J. Pearce and D. J. Watkin, Chemical Crystallography Laboratory, University of Oxford, 1993 Search PubMed.
- CrystalImpact, Crystal Impact GbR, Postfach 1251, 53002, Bonn, Germany, Bonn, Germany, 2004 Search PubMed.
- A. L. Spek, J. Appl. Crystallogr., 2003, 36, 7–13 CrossRef CAS.
- L. J. Farrugia, J. Appl. Crystallogr., 1999, 32, 837–838 CrossRef CAS.
- F. Allen, Acta Crystallogr., Sect. B: Struct. Sci., 2002, 58, 380–388 CrossRef PubMed.
- F. H. Allen and W. D. S. Motherwell, Acta Crystallogr., Sect. B: Struct. Sci., 2002, 58, 407–422 CrossRef PubMed.
- G. W. T. M. J. Frisch, H. B. Schlegel, G. E. Scuseria, M. A. Robb, J. R. Cheeseman, G. Scalmani, V. Barone, B. Mennucci, G. A. Petersson, H. Nakatsuji, M. Caricato, X. Li, H. P. Hratchian, A. F. Izmaylov, J. Bloino, G. Zheng, J. L. Sonnenberg, M. Hada, M. Ehara, K. Toyota, R. Fukuda, J. Hasegawa, M. Ishida, T. Nakajima, Y. Honda, O. Kitao, H. Nakai, T. Vreven, J. A. Montgomery Jr., J. E. Peralta, F. Ogliaro, M. Bearpark, J. J. Heyd, E. Brothers, K. N. Kudin, V. N. Staroverov, R. Kobayashi, J. Normand, K. Raghavachari, A. Rendell, J. C. Burant, S. S. Iyengar, J. Tomasi, M. Cossi, N. Rega, J. M. Millam, M. Klene, J. E. Knox, J. B. Cross, V. Bakken, C. Adamo, J. Jaramillo, R. Gomperts, R. E. Stratmann, O. Yazyev, A. J. Austin, R. Cammi, C. Pomelli, J. W. Ochterski, R. L. Martin, K. Morokuma, V. G. Zakrzewski, G. A. Voth, P. Salvador, J. J. Dannenberg, S. Dapprich, A. D. Daniels, Ö. Farkas, J. B. Foresman, J. V. Ortiz, J. Cioslowski and D. J. Fox, Gaussian Inc., Wallingford, USA, 2009 Search PubMed.
- A. Gavezzotti, CrystEngComm, 2003, 5, 439–446 RSC.
- A. Gavezzotti, CrystEngComm, 2003, 5, 429–438 RSC.
- A. Gavezzotti, J. Phys. Chem. B, 2003, 107, 2344–2353 CrossRef CAS.
- A. Gavezzotti, Z. Kristallogr., 2005, 220, 499–510 CrossRef CAS.
- A. Gavezzotti, New J. Chem., 2011, 35, 1360–1368 RSC.
- B. Jeziorski, R. Moszynski and K. Szalewicz, Chem. Rev., 1994, 94, 1887–1930 CrossRef CAS.
- J. M. Turney, A. C. Simmonett, R. M. Parrish, E. G. Hohenstein, F. A. Evangelista, J. T. Fermann, B. J. Mintz, L. A. Burns, J. J. Wilke, M. L. Abrams, N. J. Russ, M. L. Leininger, C. L. Janssen, E. T. Seidl, W. D. Allen, H. F. Schaefer, R. A. King, E. F. Valeev, C. D. Sherrill and T. D. Crawford, Wiley Interdiscip. Rev.: Comput. Mol. Sci., 2012, 2, 556–565 CrossRef CAS PubMed.
- E. G. Hohenstein and C. D. Sherrill, J. Chem. Phys., 2010, 133, 104107 CrossRef PubMed.
- E. G. Hohenstein and C. D. Sherrill, J. Chem. Phys., 2010, 133, 014101 CrossRef PubMed.
- E. G. Hohenstein and C. D. Sherrill, Wiley Interdiscip. Rev.: Comput. Mol. Sci., 2012, 2, 304–326 CrossRef CAS PubMed.
- J. J. McKinnon, M. A. Spackman and A. S. Mitchell, Acta Crystallogr., Sect. B: Struct. Sci., 2004, 60, 627–668 CrossRef PubMed.
- M. A. Spackman and D. Jayatilaka, CrystEngComm, 2009, 11, 19–32 RSC.
- D. Jayatilaka and D. J. Grimwood, in Computational Science - ICCS, ed. P. M. A. Sloot, D. Abramson, A. V. Bogdanov, Y. E. Gorbachev, J. J. Dongarra and A. Y. Zomaya, Springer-Verlag Berlin and Heidelberg, Germany, 2003, vol. 4, pp. 142–151 Search PubMed.
- S. J. Clark, M. D. Segall, C. J. Pickard, P. J. Hasnip, M. J. Probert, K. Refson and M. C. Payne, Z. Kristallogr., 2005, 220, 567–570 CrossRef CAS.
- Accelrys Software Inc., Materials Studio, Cambridge, UK, 2013 Search PubMed.
- J. P. Perdew, K. Burke and M. Ernzerhof, Phys. Rev. Lett., 1996, 77, 3865–3868 CrossRef CAS.
- H. J. Monkhorst and J. D. Pack, Phys. Rev. B: Condens. Matter Mater. Phys., 1976, 13, 5188–5192 CrossRef.
- A. Tkatchenko and M. Scheffler, Phys. Rev. Lett., 2009, 102, 073005 CrossRef.
- E. R. McNellis, J. Meyer and K. Reuter, Phys. Rev. B: Condens. Matter Mater. Phys., 2009, 80, 205414 CrossRef.
- X. Gonze, J.-C. Charlier and M. P. Teter, Phys. Rev. B: Condens. Matter Mater. Phys., 1994, 50, 13035–13038 CrossRef CAS.
- K. Refson, P. R. Tulip and S. J. Clark, Phys. Rev. B: Condens. Matter Mater. Phys., 2006, 73, 155114 CrossRef.
- S. A. Rivera, D. G. Allis and B. S. Hudson, Cryst. Growth Des., 2008, 8, 3905–3907 CAS.
- A. J. Ramirez-Cuesta, Comput. Phys. Commun., 2004, 157, 226–238 CrossRef CAS.
- M. A. Spackman, J. J. McKinnon and D. Jayatilaka, CrystEngComm, 2008, 10, 377–388 CAS.
- G. A. Jeffrey, An Introduction to Hydrogen Bonding, Oxford University Press, Oxford, 1997 Search PubMed.
- P. A. Wood, F. H. Allen and E. Pidcock, CrystEngComm, 2009, 11, 1563–1571 RSC.
- A. Gavezzotti, J. Phys. Chem. B, 2002, 106, 4145–4154 CrossRef CAS.
- J. D. Dunitz and A. Gavezzotti, J. Phys. Chem. B, 2012, 116, 6740–6750 CrossRef CAS PubMed.
- A. Volkov and P. Coppens, J. Comput. Chem., 2004, 25, 921–934 CrossRef CAS PubMed.
- V. A. Drebushchak, Y. A. Kovalevskaya, I. E. Paukov and E. V. Boldyreva, J. Therm. Anal. Calorim., 2003, 74, 109–120 CrossRef CAS.
- M. A. Spackman and J. J. McKinnon, CrystEngComm, 2002, 4, 378–392 RSC.
- P. A. Wood, T. S. G. Olsson, J. C. Cole, S. J. Cottrell, N. Feeder, P. T. A. Galek, C. R. Groom and E. Pidcock, CrystEngComm, 2013, 15, 65–72 RSC.
- P. Jurecka, J. Sponer, J. Cerny and P. Hobza, Phys. Chem. Chem. Phys., 2006, 8, 1985–1993 RSC.
- S. A. Moggach, D. R. Allan, S. J. Clark, M. J. Gutmann, S. Parsons, C. R. Pulham and L. Sawyer, Acta Crystallogr., Sect. B: Struct. Sci., 2006, 62, 296–309 Search PubMed.
- A. Gavezzotti, CrystEngComm, 2013, 15, 4027–4035 RSC.
- J. D. Dunitz, A. Gavezzotti and S. Rizzato, Cryst. Growth Des., 2013, 14, 357–366 Search PubMed.
- D. Braga, C. Bazzi, F. Grepioni and J. J. Novoa, New J. Chem., 1999, 23, 577–579 RSC.
- D. Braga, L. Maini and F. Grepioni, Chem. – Eur. J., 2002, 8, 1804–1812 CrossRef CAS.
Footnotes |
| † Electronic supplementary information (ESI) available: CCDC 10489311048932. For ESI and crystallographic data in CIF or other electronic format see DOI: 10.1039/c5ce00327j |
| ‡ 1 meV = 8.066 cm−1 |
| This journal is © The Royal Society of Chemistry 2015 |

