DOI:
10.1039/C3RA43486A
(Paper)
RSC Adv., 2013,
3, 24266-24279
Optimization of continuous phase in amino-functionalized metal–organic framework (MIL-53) based co-polyimide mixed matrix membranes for CO2/CH4 separation
Received
9th July 2013
, Accepted 7th October 2013
First published on 7th October 2013
1 Introduction
Today, polymer membrane-based CO2/CH4 gas separation has mainly three important fields of application: (1) gases miscible with oil like CO2 and/or N2 are injected into petroleum reservoirs to increase the recovery rates of oil and/or gas;1 (2) natural gas contains large amounts of sour gas such as CO2 and water vapor, and removal of acid gases can increase the caloric value of natural gas while reducing pipeline corrosion;2 (3) for cleaning of bio-gas, which normally contains 55–60% methane and 38–40% CO2.3 Polymer membranes have been used in industrial applications and play a major role in the field of gas separation since they are cheaper than inorganic membranes, and easier to produce into hollow fibers or flat sheets.4 For polymeric materials, a general trade-off exists between permeability and selectivity.5,6 At high pressures, polymer membranes have a disadvantageous effect designated as plasticization. This is related to the solubilization of CO2, which tends to decrease membrane performance, thus limiting the range of separation conditions and affecting the process economics.7 In order to overcome Robeson's upper bound trade-off, researchers suggested using carbon (CMS), ceramic and zeolite membranes for gas separations.8 Although the separation performances of these materials are well above the upper bound trade-off curve, they were still found difficult to process and expensive to fabricate.9 Mixed matrix membranes (MMMs) combine the potential advantages of inorganic particles and polymer matrix, which are the superior permeability or selectivity of the former and good processability and mechanical properties of the latter.10–12 In principle, adhesion of a continuous polymer matrix to a dispersed zeolite can create a hybrid material with appropriate properties.13,14 The inorganic surface chemistry of zeolites, however, leads to additional membrane formation challenges, when attempting to create a defect-free morphology.15 In our previous work, MMMs comprising zeolites (FAU/EMT) and 6FDA-ODA polyimide have shown good separation properties for CO2/CH4 separation, but zeolites must be grafted by amino-propyltriethoxysilane in polar solvents and the continuous polymer phase should be cross-linked.16,17
Metal organic frameworks (MOFs) are a relatively new class of hybrid materials, which originate through the self-assembly of complex subunits comprising transition metal centers connected by various polyfunctional organic ligands (usually carboxylates, sulfonates or phosphonates), resulting in the formation of one-, two-, and three-dimensional networks with high porosity.18 MOFs are extensively studied in a variety of applications due to their large surface area, tunable pore size, and diversified topology.18–20 The applications of MOF materials as fillers in the MMM field, however, are still in their infancy. The main drawbacks of MOFs are frequently lower thermal and chemical stability as well as higher production cost as compared to traditional fillers such as zeolites and CMSs (carbon molecular sieves).21
Up to now, several kinds of MOFs have been applied for the fabrication of MMMs, including Cu-BPDC-TED (BPDC-TED = biphenyl dicarboxylate-triethylenediamine), {[Cu2(PF6)(NO3)-(4,4′-bpy)4]·2PF6·2H2O}n, Mn(HCOO)2, MOF-5 or IRMOF-1, HKUST-1 or Cu3(BTC)2 (BTC = benzene-1,3,5-tricarboxylate), Fe-BTC, Zn(BDC)(TED)0.5 (bdc = benzene-1,4-dicarboxylic acid), Cu(hfipbb)(H2hfipbb)2 (hfipbb = hexafluoroisopropyl-idene-bis-benzoic acid), Cu-BPY-HFS (Cu-4,4′-bipyridine-hexafluororsilicate), Cu-TPA (TPA = terephthalic acid), MOP-18, MIL-47, MIL-53, MIL-101, ZIF-7, ZIF-8, ZIF-90, UiO-66. Generally, MOF-based MMMs combine the high sorption properties of MOFs with good permeability and mechanical properties of polymer matrices. Although these membrane materials exhibit a high degree of MOF-polymer adhesion, their gas separation performance is still insufficient.21
Amino-functionalized NH2-MIL-53 is based on MIL-53 topology, where 1,4-benzenedicarboxylic acid is replaced by 2-aminoterephthalic acid. MIL-53 framework is built up from infinite inorganic chains, consisting of trans-corner-sharing {MO4(OH,F)2} (M = Al3+ or Cr3+ or Fe3+ or In3+) octahedra cross-linked by bis-bidentate terephthalate linkers, creating 1D rhombic shaped tunnels.22 Using NH2-MIL-53 as filler for MMMs, an excellent contact between the polymer matrix and dispersed phase have been reported, even at high filler loadings (up to 40 wt%). Owing to a significant enhancement in hydrogen bonding between amine group of NH2-MIL-53 fillers and sulfone or imine groups of polymer matrix, an improvement in separation factor and, most importantly, CO2 permeability was reported.23–26 Interestingly, opposite to the gas performance of most inorganic membranes reported in the literature, CO2/CH4 selectivity of these MMMs increased with increasing pressure, which can be explained by the intrinsic flexibility or “breathing effect” of the MIL-53 filler upon adsorption of some penetrant gases (CO2, H2O), but not of other ones (H2, CH4).23,24
In the other hand for polymer matrix, 6FDA-ODA polyimide containing 6FDA, (4,4′-(hexafluoroisopropylidene)-diphthalic anhydride) and ODA (4,4′-oxidianiline), display higher gas permeability due to the –C(CF3)2 group in the dianhydride and better selectivity due to the –O group in the diamine for CO2/CH4 separation.27,28 Moreover, this polyimide was found to exhibit good compatibility with inorganic fillers (for both zeolite FAU/EMT and NH2-MIL-53) for CO2/CH4 separation.17,24
In the present work, changing the nature of the polyimide phase of the previously optimized 6FDA-ODA-MIL-53(Al) mixed matrix membranes as it affects the membrane properties in CO2/CH4 separation was attempted. To this end, ODA was co-polymerized with 1,3,5-trimethyl-2,6-phenylenediamine (DAM). The membrane properties of films of 6FDA-DAM have been recently shown to be impressive in CO2/CH4 separation (CO2 permeability = 350 Barrer; PCO2/PCH4 = 17.6 at 35 °C, 4.5 atm).29 A comparative study on the CO2/CH4 separation performance of 6FDA-ODA-DAM co-polyimide MMMs containing amino-functionalized MIL-53(Al) was performed, comparing to the ones of commercial Matrimid 5218 and Ultem 1000 polymers. The experimental permeation results were further evaluated using two theoretical predictive models for MMMs, namely the Maxwell model and the modified Maxwell model.
2 Theoretical section
For a transport of two components A and B through a membrane, the permeability Pi of penetrant i can be expressed as follows:| |  | (1) |
The ideal selectivity can be written as the ratio of permeabilities:
| |  | (2) |
here,
PA and
PB are the permeabilities of components A and B, respectively.
A is the membrane area (cm
2),
l is the membrane thickness (cm), Δ
p is the upstream pressure (psi),
V is the downstream volume (cm
3),
R is the universal gas constant (6236.56 cm
3 cmHg mol
−1 K
−1),
T is the absolute temperature (K) and d
p/d
t is the permeation rate (psi s
−1).
In order to understand the transport properties of MMMs, theoretical models that can make quantitative predictions for the separation performance play an important role. As detailed summarily in the recent review of Vinh-Thang and Kaliaguine,30 many theoretical models available in the literature have been proposed to predict the separation performance of MMMs with a satisfactory agreement with experimental observations.
The particularly useful Maxwell model developed in 1873, originally derived from the estimation of the dielectric properties of particulate composite materials, has been widely accepted as a simple and effective tool for predicting permeation properties of a two-phase ideal MMM:31
| |  | (3) |
where,
Peff describes the effective steady-state permeability of a gaseous penetrant through a MMM,
Pd and
Pc are the effective permeability of pure filler membrane and polymer matrix, respectively,
ϕd is the volume fraction of dispersed fillers. The Maxwell model is strictly applicable to a dilute suspension of spherical particles at low loadings, when the volume fraction of filler particles is less than about 0.2, because of the assumption that the streamlines around particles are not affected by the presence of nearby particles.
For ideal MMMs, which consist of inorganic fillers and polymer matrix with no defects and no distortion at the filler-polymer interface, various other theoretical models such as Bruggeman, Böttcher and Higuchi, Lewis–Nielsen, Pal, Gonzo–Parentis–Gottifredi (GPG), Funk–Lloyd, Kang–Jones–Nair (KJN) have been developed.30 Similar agreement between model predictions and experimental data can, however, be observed only at low filler loading.
Moreover, it is very difficult to reach ideal membrane morphology because of the imperfect filler-polymer adhesion. Some non-ideal effects, e.g. total or partial pore blockage, polymer chain rigidification and interfacial voids may affect permeation performance of MMMs. To consider these interfacial defects in a non-ideal morphology, the modified Maxwell, modified Lewis–Nielsen, original and modified Felske, modified Pal and Hashemifard–Ismail–Matsuura (HIM) models have been reported.30
For the modified Maxwell model, proposed by Majahan and Koros32 and extended by Li et al.,33 the Maxwell equation is first applied to predict permeability (Pps) of a pseudo-dispersed phase:
| |  | (4) |
where,
PI is the permeability of interphase affected by the polymer chain rigidification (
β) factor,
i.e. PI =
Pc/
β.
The pseudo-dispersed phase is a two-component phase, which is assumed to comprise of a dispersed phase surrounded by an interfacial phase. The latter can be alternatively interfacial voids, pore blockage region and rigidified interphase layer. The pseudo-dispersed phase is then assumed as another dispersed phase. Here, ϕs is the volume fraction of dispersed filler within the pseudo-dispersed phase, which is calculated as functions of the filler radius (rd) and interphase thickness (lI):
| |  | (5) |
ϕ
I is the volume fraction of interfacial phase within the pseudo-dispersed phase. Then using this calculated permeability, the overall MMM's permeability Peff can be predicted using the Maxwell equation for the second time:
| |  | (6) |
Applying the modified Maxwell model, the separation performances of various non-ideal MMMs have been estimated quantitatively considering interfacial defects with good agreement between model predictions and experimental data at higher filler loadings.30 It should be noted that, in this model, the interphase thickness (lI) is generally extracted from SEM images, which affects the deviation of model predictions from experimental data.
3 Experimental section
3.1 Polyimide synthesis
6FDA-ODA-DAM co-polyimides were synthesized by a two-step method as described elsewhere.28 6FDA = 4,4′-(hexafluoro-isopropylidene)diphthalic anhydride, >99% purity, was provided by Chriskey Company. ODA = 4,4′-oxidianiline, 97% purity, is purchased from Sigma-Aldrich and purified by vacuum sublimation. DAM = 1,3,5-trimethyl-2,6-phenylenediamine, 98% purity, was obtained from TCI America and purified by vacuum sublimation. NMP = 1-methyl-2-pyrrolidone was purchased from TCI America. APTMDS = bis(3-aminopropyl)tetramethyl-disiloxane, 99.9% purity, obtained from Gelest Inc was used as a cross-linking agent. In the first step, poly(amic acid)s (PAA) derived from equimolar amounts of solid 6FDA and diamines (ODA![[thin space (1/6-em)]](https://www.rsc.org/images/entities/char_2009.gif) :
:![[thin space (1/6-em)]](https://www.rsc.org/images/entities/char_2009.gif) DAM 50
DAM 50![[thin space (1/6-em)]](https://www.rsc.org/images/entities/char_2009.gif) :
:![[thin space (1/6-em)]](https://www.rsc.org/images/entities/char_2009.gif) 50 and 20
50 and 20![[thin space (1/6-em)]](https://www.rsc.org/images/entities/char_2009.gif) :
:![[thin space (1/6-em)]](https://www.rsc.org/images/entities/char_2009.gif) 80 mol%) were prepared by solution condensation in NMP. Then APTMDS was added to PAA solutions to form cross-linked co-polyimides. Both reaction mixtures were stirred using a power drill (Mastercraft) connected to a power start variable autotransformer (The Superior Electric co. Bristol Conn, USA) stirrer under an argon atmosphere and placed in an ice–water mixture for 15 h.
80 mol%) were prepared by solution condensation in NMP. Then APTMDS was added to PAA solutions to form cross-linked co-polyimides. Both reaction mixtures were stirred using a power drill (Mastercraft) connected to a power start variable autotransformer (The Superior Electric co. Bristol Conn, USA) stirrer under an argon atmosphere and placed in an ice–water mixture for 15 h.
In the second step, poly(amic acid)s were then imidized to form polyimides by chemical imidization under argon atmosphere at room temperature for 24 h by adding acetic anhydride (dehydrating agent) and triethylamine (catalyst). The polyimide solution was then precipitated with methanol, washed several times with methanol and dried at 200 °C in a vacuum oven for 24 h.
3.2 MOF synthesis
The synthesis of MIL-53(Al) as well as NH2-MIL-53(Al) was performed as reported elsewhere.34 First, aluminum nitrate nonahydrate (Al(NO3)3·9H2O, >98% purity, purchased from Sigma-Aldrich) dissolved in DMF (dimethylformamide, 99.8% purity, obtained from Sigma-Aldrich) and 2-amino- or terephthalic acid ((H2N)- or C6H3-1,4-(CO2H)2, 98% purity, purchased from Sigma-Aldrich) dissolved in DMF were mixed under stirring. The mixture molar composition was 1 Al(NO3)3![[thin space (1/6-em)]](https://www.rsc.org/images/entities/char_2009.gif) :
:![[thin space (1/6-em)]](https://www.rsc.org/images/entities/char_2009.gif) 1.48 acid (amino- or terephthalic acid)
1.48 acid (amino- or terephthalic acid)![[thin space (1/6-em)]](https://www.rsc.org/images/entities/char_2009.gif) :
:![[thin space (1/6-em)]](https://www.rsc.org/images/entities/char_2009.gif) 184.5 DMF. The obtained solution was aged for 24 h and then transferred to a Teflon-lined stainless steel autoclave. The autoclave was heated in an oven at 130 °C for 3 days. After the mixtures were cooled, the as-synthesized yellow (NH2-MIL-53(Al)) or white (MIL-53(Al)) powders were collected by centrifugation at 5000 rpm for 15 min. To remove the incorporated 2-amino- or terephthalic acid, the as-synthesized powders were washed twice with anhydrous DMF in an autoclave at 130 °C for 24 h. Afterward, DMF was removed by acetone Soxhlet extraction for 20 h. Finally, the solids were dried at 100 °C under vacuum for 48 h.
184.5 DMF. The obtained solution was aged for 24 h and then transferred to a Teflon-lined stainless steel autoclave. The autoclave was heated in an oven at 130 °C for 3 days. After the mixtures were cooled, the as-synthesized yellow (NH2-MIL-53(Al)) or white (MIL-53(Al)) powders were collected by centrifugation at 5000 rpm for 15 min. To remove the incorporated 2-amino- or terephthalic acid, the as-synthesized powders were washed twice with anhydrous DMF in an autoclave at 130 °C for 24 h. Afterward, DMF was removed by acetone Soxhlet extraction for 20 h. Finally, the solids were dried at 100 °C under vacuum for 48 h.
3.3 Preparation of MMM's membranes
Before starting the preparation, the three polymers, i.e. Matrimid 5218, Ultem 1000 and 6FDA-ODA-DAM co-polyimides, and two MOFs, i.e. MIL-55(Al) and NH2-MIL-53(Al), were dried at 130 °C. MOF loadings are determined using eqn (7):| |  | (7) |
MMM membranes were prepared by the dense film casting method. First, 0.4–0.5 g of polyimide was dissolved in 5 ml of chloroform. The obtained solution was then filtered to remove un-dissolved materials and dust particles. The MOF's powders were added to 5 ml of chloroform, followed by sonicating for 1–2 min. Then, approximately 10% of polymer solution was added to the MOF suspension to “prime” the MOF. The “priming” technique, which consists of the addition of low amounts of polymer to the MOF suspension before incorporation of the particles into the polymer film to make the particles more compatible with the polymer, is believed to improve the transport properties of MMMs.16,17 The slurry was agitated for 1 h to obtain a good homogenization. The remaining amount of the polymer solution was added to the slurry and the final slurry is agitated again for 1 day. A nascent film was cast from the solution onto a clean glass plate using a small metal container with a cover to delay solvent evaporation from the nascent membrane. The membrane was further dried for 15 h at 200 °C under vacuum. The average thickness of MMMs was 40–85 μm, measured with a micrometer.
3.4 Characterization
Nitrogen adsorption measurements were carried out to characterize the textural properties of the MOF samples, including total BET specific surface area and micropore volume (Nova 2000, Quantachrome Corp., USA, and Omnisorb-100 automatic analyzer at −196 °C). SEM images were performed to determine the crystal size and to characterize the morphology of the dispersed phase, using a JEOL JSM-840A operated at 15–20 kV. The weight loss curves (TGA-DTG) were recorded using a TA Instruments TGA model Q5000IR from 100 to 850 °C at a heating rate of 10 °C min−1 under nitrogen.
In order to confirm the presence of functional and amino-functionalized groups in MMMs, FT-IR spectra were recorded using a Nicolet Magna 850 Fourier transform infrared spectrometer (Thermo Scientific, Madison, WI) equipped with a liquid-nitrogen-cooled narrow-band MCT detector using Golden-Gate (diamond IRE) ATR accessories (Specac Ltd., London, U.K.). Each spectrum was obtained from the acquisition of 128 scans at 4 cm−1 resolution from 4000 to 700 cm−1 using Happ-Genzel apodization.
T
g and tensile properties of MMMs were determined using dynamic mechanical thermal analyzer (TA Instruments, RSA-3, New Castle, DE) on samples having dimensions of 25 × 6 × 0.02 mm3. For Tg measurements, the temperature was increased from 30 to 350 °C at a rate of 10 °C min−1 with the strain set at 0.05% and a frequency of 1 Hz.
The pure gas transport properties were measured using the variable pressure (constant volume) method.16,24 In the measurement, the permeate pressure was varied from 10−3 to 30 Torr. For each membrane composition, at least three or four different membranes were prepared in order to detect defective membranes, which would yield inacceptable permeation rates. For all reported data the membrane properties were established for at least two replicas of the same membrane composition. For each replica the permeation, selectivity, and separation factor were averaged over three replicate permeation tests. The reported data correspond to averages of these results. The separation factor (α*AB), represents the ability of a membrane to separate a binary gas mixture, and is defined as eqn (8):
| | | α*AB = (yA/yB)/(xA/xB) | (8) |
here,
yA and
yB are the mole fractions of the components in permeate, while
xA and
xB are their corresponding mole fractions in the feed. The values of molar compositions are average values of at least five measurements after steady composition was reached, in an experiment in which permeates composition was measured by gas sampling and GC analysis at different times. The relative error on these measured values is less than 2%. Indeed, the time to reach stable composition was well over 12 time lags (12
θ). From the data obtained, the total permeability was calculated using
eqn (1), the permeability of each gas in the mixture was then determined by (for negligible downstream pressure):
| |  | (9) |
4 Results and discussion
4.1 MOF's characterization
4.1.1 SEM.
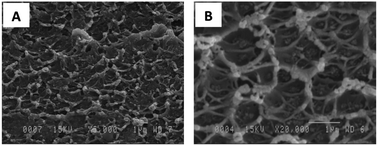
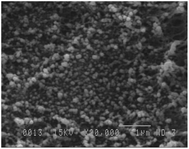
SEM images of dispersed phases, including the synthesized non- (MIL-53(Al)) and amino-functionalized (NH2-MIL-53(Al)), are shown in Fig. 1. The results revealed that both kinds of MOFs are agglomerate crystals with 5–10 μm in size (Fig. 1A and B at lower magnification ×200). From the Fig. 1C and D performed at higher magnification ×20![[thin space (1/6-em)]](https://www.rsc.org/images/entities/char_2009.gif) 000, the average elementary particle size is in the range of 100–150 nm.
000, the average elementary particle size is in the range of 100–150 nm.
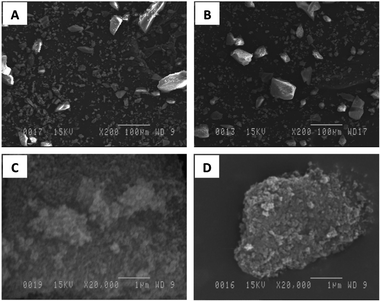 |
| | Fig. 1 SEM photo of MIL-53(Al) (A and C) and NH2-MIL-53(Al) (B and D). | |
4.1.2 BET.
N2 sorption results of MIL-53(Al) and NH2-MIL-53(Al) are listed in Table 1. The specific surface area, mesopore surface area, and micropore and mesopore volume of the amino-functionalized NH2-MIL-53(Al) were lower than those of the non-functionalized MIL-53(Al). The BET surface varied from 1440 to 840 m2 g−1, while the micropore volume (Vmicro) decreased from 0.375 to 0.215 cm3 g−1 (Table 1). Mesopore surface area and mesopore volume show the same trend. The amine-functional group did not change the morphology of MIL-53(Al), but affected the specific surface area and pore volume.
Table 1 Physical properties of non- and amino-functionalized MIL-53(Al)
| MOF |
SBET (m2 g−1) |
S
meso (m2 g−1) |
V
micro (cm3 g−1) |
V
meso (cm3 g−1) |
Bulk density (g cm−3) |
Pore diameter (nm) |
|
Specification from Sigma-Aldrich.
|
| MIL-53(Al) |
1440 |
290 |
0.455 |
0.272 |
0.435 |
0.8a |
| NH2-MIL-53(Al) |
840 |
120 |
0.265 |
0.137 |
— |
— |
4.1.3 TGA-DTG.
Fig. 2 shows the TGA curves of MIL-53(Al) and NH2-MIL-53(Al) powders, indicating two step weight loss. The lower temperature peak corresponds to the release of the guest molecules (water 100 °C and solvent DMF around 200 °C) within the pores, while the higher temperature peak is related to the decomposition of terephthalic acid or amino-terephthalic acid ligands from the organic framework. Additionally, the lower thermal stability of amino-functionalized NH2-MIL-53(Al) sample is due to loss of NH2 group.24,36
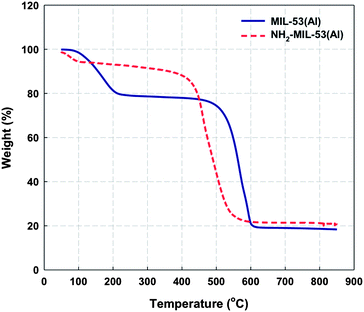 |
| | Fig. 2 TGA curves of non- and amino-functionalized MIL-53(Al). | |
4.2 MMM's characterization
4.2.2 TGA-DTG.
In the case of MMMs, the temperatures to reach 5% (Td5%) and 10% (Td10%) weight loss in TGA tests are usually reported to characterize the membrane's thermal stability. DTG curves also give information on the pyrolysis rates.37 As listed in Table 2, the Td5% values of all MMMs are above 445 °C. These Td5% values of MMMs made with non-functionalized MIL-53(Al) crystals were almost similar to those of all neat polymers. Interestingly, for all MMMs containing amino-functionalized NH2-MIL-53(Al) fillers, Td5% and Td10% values were decreased with increasing NH2-MIL-53(Al) loading. For example, i.e. 6FOD(11) + 2%-NH2-M MMM series, Td5% values were decreased from 475 °C to 445 °C, while Td10% values were decreased from 501 °C to 483 °C, as the NH2-MIL-53(Al) loading was varied from 15 to 35 wt%.
Table 2 TGA-DTG temperature characters of all studied MMMs
| Membranea |
ϕ
d (%) |
T
d5% (°C) |
T
d10% (°C) |
DTG peak 1 (°C) |
DTG peak 2 (°C) |
6FOD(11): pure 6FDA-ODA-DAM(1![[thin space (1/6-em)]](https://www.rsc.org/images/entities/char_2009.gif) : :![[thin space (1/6-em)]](https://www.rsc.org/images/entities/char_2009.gif) 1); 6FOD(14): pure 6FDA-ODA-DAM(1 1); 6FOD(14): pure 6FDA-ODA-DAM(1![[thin space (1/6-em)]](https://www.rsc.org/images/entities/char_2009.gif) : :![[thin space (1/6-em)]](https://www.rsc.org/images/entities/char_2009.gif) 4); 6FOD(11) + 2%: 6FDA-ODA-DAM(1 4); 6FOD(11) + 2%: 6FDA-ODA-DAM(1![[thin space (1/6-em)]](https://www.rsc.org/images/entities/char_2009.gif) : :![[thin space (1/6-em)]](https://www.rsc.org/images/entities/char_2009.gif) 1) containing 2% APTMDS; M: MIL-53(Al); and n%: wt% MOF loading. 1) containing 2% APTMDS; M: MIL-53(Al); and n%: wt% MOF loading.
|
| Matrimid 5218 |
0 |
474 |
508 |
511 |
720 |
| Matrimid-M-15% |
12.4 |
478 |
498 |
500 |
600 |
| Matrimid-NH2-M-15% |
15.5 |
472 |
499 |
491 |
646 |
| Ultem 1000 |
0 |
481 |
528 |
521 |
671 |
| Ultem-M-15% |
15.1 |
482 |
497 |
500 |
620 |
| Ultem-NH2-M-15% |
13.2 |
482 |
508 |
500 |
623 |
| 6FOD(11) |
0 |
488 |
508 |
529 |
583 |
| 6FOD(11)-M-25% |
17.9 |
486 |
507 |
529 |
572 |
| 6FOD(11)-NH2-M-15% |
9.5 |
476 |
503 |
535 |
587 |
| 6FOD(11)-NH2-M-20% |
23.6 |
461 |
492 |
517 |
578 |
| 6FOD(11)-NH2-M-25% |
24.9 |
471 |
499 |
516 |
597 |
| 6FOD(14) |
0 |
489 |
508 |
523 |
590 |
| 6FOD(14)-M-25% |
25.85 |
490 |
508 |
529 |
571 |
| 6FOD(14)-NH2-M-10% |
4.43 |
465 |
497 |
517 |
570 |
| 6FOD(14)-NH2-M-15% |
16.54 |
449 |
485 |
519 |
563 |
| 6FOD(11) + 2% |
0 |
488 |
508 |
— |
580 |
| 6FOD(11) + 2%-M-25% |
27.4 |
489 |
512 |
537 |
584 |
| 6FOD(11) + 2%-NH2-M-15% |
16.5 |
475 |
501 |
523 |
570 |
| 6FOD(11) + 2%-NH2-M-20% |
21.0 |
472 |
499 |
519 |
556 |
| 6FOD(11) + 2%-NH2-M-25% |
24.3 |
469 |
497 |
520 |
555 |
| 6FOD(11) + 2%-NH2-M-30% |
29.7 |
453 |
490 |
521 |
566 |
| 6FOD(11) + 2%-NH2-M-32% |
31.7 |
450 |
487 |
520 |
560 |
| 6FOD(11) + 2%-NH2-M-35% |
36.6 |
445 |
483 |
523 |
571 |
The thermal stability of the polyimide-MOF MMMs containing NH2-MIL-53(Al) is therefore considered sufficient for gas separation applications.38 For example, the highest temperature used in hydrogen separation is in the range 300–500 °C. For natural gas, the gas pressure is rather high (excess of 1000 psi) and the gas temperature is in the order of 30–50 °C. In our results, all the TGA curves showed a plateau at temperatures below 400 °C, indicating no remnant hydroxyl groups (Fig. 7). DTG plots of the neat 6FOD(11) + 2% membrane showed two peaks. The first one is around 520–540 °C, while the second one is around 560–580 °C. Commercial Matrimid 5218 and Ultem 1000 polyimide membranes have higher second decomposition temperature (600–720 °C). At this second temperature, most chemical decomposition reactions of materials already took place. These weight losses are mostly due to conversion of carbonyl groups (C![[double bond, length as m-dash]](https://www.rsc.org/images/entities/char_e001.gif) O) to either CO or CO2.39 There was no residual absorbed solvent or hydroxyl group, which would have yielded low decomposition temperatures (100–250 °C).
O) to either CO or CO2.39 There was no residual absorbed solvent or hydroxyl group, which would have yielded low decomposition temperatures (100–250 °C).
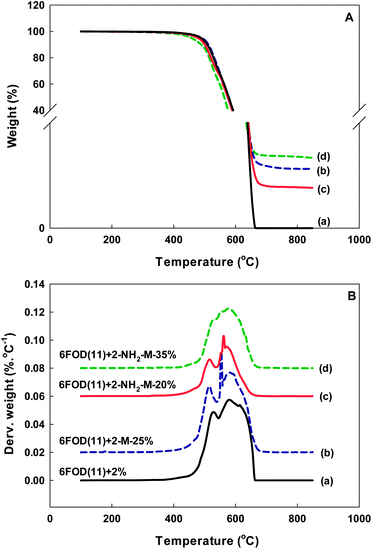 |
| | Fig. 7 TGA-DTG curves: TGA (A) and DTG (B) of 6FOD(11) + 2% and their MMMs (all DTG curves are shifted upward by 1.5, 2.0, 2.5%/°C, respectively, except 6FOD(11) + 2%). | |
4.2.3 ATR-FT-IR.
The chemical groups of NH2-MIL-53(Al) and MIL-53(Al) connected with neat polymer matrix during the fabrication of MMMs were monitored by ATR-FT-IR (Fig. 8 and 9). Fig. 8 shows the ATR-FT-IR spectra over the lower frequency range (800–2200 cm−1). For the neat 6FOD(11) + 2% membrane, four major absorption peaks were found at 1780 cm−1 (asymmetric stretching of the carbonyl group in the five-member ring, imide II band), 1720 cm−1 (symmetric stretching of the carbonyl group, imide I band), 1377 cm−1 (C–N stretching), and 1117 cm−1 (imide III band), that confirm the successful chemical imidization during the preparation of the 6FDA-ODA-DAM membrane. For amino-functionalized NH2-MIL-53(Al) solids, there are two peaks located at 1600 and 1505 cm−1, which are attributed to CO2 asymmetric stretching vibration, and a peak at 1410 cm−1, corresponding to CO2 symmetric stretching vibration (Fig. 8). These three peaks were also observed in the ATR-FT-IR spectrum of 6FDA(11) + 2%-NH2-M-25% membrane slightly shifted to lower or higher adsorption frequency (1570–1595, 1500–1506, and 1410–1420 cm−1). This shift is associated with the interaction between amino-functional and carboxyl groups. The absorption peak at 1690 cm−1 is attributed to free terephthalic acid molecules in powders, which are encapsulated within their pores in the protonated form (–CO2H).40
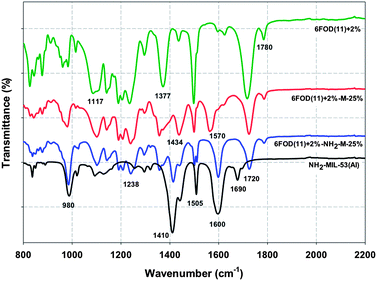 |
| | Fig. 8 ATR-FTIR spectra between 800 and 2200 cm−1 for NH2-MIL-53(Al), 6FOD(11) + 2% and their MMMs (all spectra are shifted upward by 2.5, 5.0, and 7.5%, respectively, except NH2-MIL-53(Al)). | |
Fig. 9 shows the ATR-FT-IR spectra of the series of 6FOD(11) + 2%-MOF MMMs, compared to those of non- and amino-functionalized MIL-53(Al) crystals, over the higher frequency range (3200–3200 cm−1). The peaks at 3500 and 3397/3385 cm−1 are attributed to the NH2 group as well as the free amino-terephthalic acid in the pores.23 As can be seen in Fig. 9, both peaks are observed in the ATR-FT-IR spectra of the 6FOD(11) + 2%-NH2-M-15% and 6FOD(11) + 2%-NH2-M-25% MMMs, with a slightly shift to higher frequency. The corresponding upward shoulder in the 3500 cm−1 peak is due to hydrogen bonding interaction of the amine group with remnant carboxylic acid groups of the neat polyimide. For 6FOD(11) + 2% and 6FOD(11) + 2%-M-25% membranes, only a peak, corresponding to NH2 groups in the cross-linking agent and in the diamine moiety, was observed.
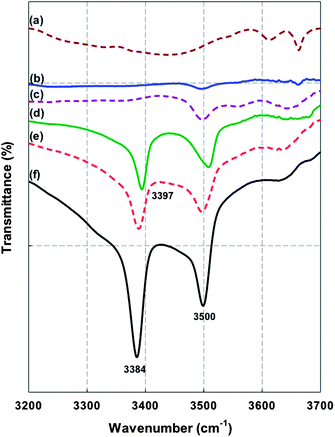 |
| | Fig. 9 ATR-FTIR spectra between 3200 and 3700 cm−1 for (a) MIL-53(Al); (b) 6FOD(11) + 2%-M-25%; (c) 6FOD(11) + 2%; (d) 6FOD(11) + 2%-NH2-M-15%; (e) 6FOD(11) + 2%-NH2-M-25%; and (f) NH2-MIL-53(Al) membranes (all spectra are shifted upward by 25, 50, 75, 100, and 125%, respectively, except NH2-MIL-53(Al)). | |
4.2.4 Dynamic mechanical analysis.
DMA testing is a versatile and sensitive technique enabling the complete exploration of the relaxation mechanisms in viscoelastic materials.41,42 The most common use of DMA is for the determination of the glass-transition temperature (Tg), where the maximum loss of applied energy is observed, usually as a peak, in the traces of the loss factor versus temperature.16,17,24 Young's modulus is obtained from the slope of stress–strain curves at low deformation (linear elastic) and represents the rigidity of materials (Fig. 10).
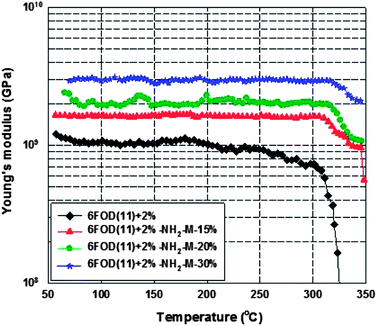 |
| | Fig. 10 Young’s modulus as a function of temperature. | |
Table 3 summarizes the glass transition temperature and Young's modulus of 6FOD(11) + 2% polyimide, 6FOD(11) + 2%-M-25% and 6FOD(11) + 2%-NH2-M-n% MMMs. Neat 6FOD(11) + 2% membrane has both aromatic groups in the main chain and cross-linking agent, which reduces dramatically rotation, and therefore yields a higher Tg value (315 °C). Comparing to the neat 6FOD(11) + 2% membrane (Table 3), the Tg values of MMMs were slightly increased (only 1–3 °C) with increasing MOF loading (from 15 to 30 wt%), indicating a fair interfacial contact between polyimide and MIL-53 crystals. This increase might be explained due to the presence of MOFs, which can restrict the movement of the polymer chains by the interaction with their amino-functional groups. The Tg values of most MMMs were similar, and higher (except for the membrane without amine functional group, i.e. 6FOD(11) + 2%-M-25%) than that of the neat polyimide membrane. Interestingly, the 6FOD(11) + 2%-M-25% membrane showed a lower Tg value than that of the neat polymer. This may be due to bad particle spatial distribution (see Fig. 6). It seems that higher Tg value upon MOF introduction into the membrane reflects an effective polymer–particle interaction associated with the quality of the interface. Moreover, Young's modulus values of MMM membranes were increased with increasing MOF loading (Fig. 10 and Table 3).
Table 3
T
g and Young's modulus values of 6FOD(11) + 2%, 6FOD(11) + 2%-M-25% and 6FOD(11) + 2%-NH2-M-n% membranes
| Membrane |
T
g (°C) |
Young's modulus (GPa) |
| 6FOD(11) + 2% |
315 |
1.22 |
| 6FOD(11) + 2%-M-25% |
313 |
2.37 |
| 6FOD(11) + 2%-NH2-M-15% |
315 |
1.82 |
| 6FOD(11) + 2%-NH2-M-20% |
316 |
2.35 |
| 6FOD(11) + 2%-NH2-M-25% |
317 |
2.52 |
| 6FOD(11) + 2%-NH2-M-30% |
318 |
3.09 |
| 6FOD(11) + 2%-NH2-M-32% |
317 |
3.20 |
| 6FOD(11) + 2%-NH2-M-35% |
316 |
3.42 |
4.3 Gas transport properties
4.3.1 CO2/CH4 separation performance of commercial polymer-MOF MMMs.
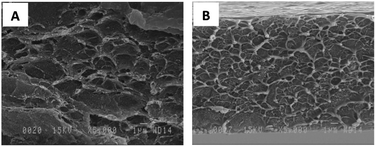
The membrane performance of commercial polymer-MOF MMMs, i.e. permeability, ideal selectivity and separation factor, for pure CO2 and CH4 gases, and their blends (50/50 CO2/CH4) were measured at 35 °C and 150 psi (Table 4). For Matrimid 5218 polymer, the MMMs containing MIL-53(Al) and NH2-MIL-53(Al) showed high permeability for both gases and relatively low selectivity. The reason is different in the two cases. For MMMs containing non-functionalized filler, due to the MIL-53(Al) pore size (7–8 Å) being much larger than the kinetic diameters of CH4 (3.8 Å) and CO2 (3.3 Å), both gases can pass through the pore. On the other hand, the membranes containing NH2-MIL-53(Al) showed significantly lower selectivity compared to not only neat polymer but also the one containing MIL-53(Al), which can be explained by the presence of non-selective voids at interface between polyimide and MOF particle phases (Fig. 3).
Table 4 Gas permeability (Barrer), ideal selectivity, and 50/50 CO2–CH4 mixed gas selectivity of Matrimid 5218, Ultem 1000 membranes and their MMMs with non- and amino-functionalized MIL-53(Al) at 35 °C and 150 psi
| Membrane |
P
CO2 (Barrer) |
P
CH4 (Barrer) |
P
CO2/PCH4 |
(50/50) CO2/CH4 mixed gas selectivity |
| Matrimid 5218 |
6.2 |
0.2 |
31 |
28.5 |
| M-MIL-53-15% |
6.7 |
0.71 |
9.4 |
8.5 |
| M-MIL-53-NH2-15% |
9.2 |
4.4 |
2.1 |
2.1 |
| Ultem 1000 |
1.46 |
0.037 |
39.5 |
31.6 |
| U-MIL-53-15% |
1.77 |
0.041 |
43.1 |
42.8 |
| U-MIL-53-NH2-15% |
3.0 |
0.083 |
36.2 |
36.1 |
Comparing the property of Matrimid 5218 and Ultem 1000 polymers, Ultem 1000 is softer and more flexible than Matrimid 5218. For example, 2.9 and 3.3 GPa in Tensile Modulus; 48.6 and 80% in Tensile Elongation at Break; 2.8 × 10⁻⁵ and 1.7 × 10⁻⁵ in. per in. per °C in coefficient of linear thermal expansion; and 320 and 215 °C in Tg, respectively. Ultem 1000 has better compatibility with MOF crystals and its MMMs have better separation performance. Therefore, the Ultem-MOF MMMs have higher permeability and selectivity compared to the neat membrane. Due to their low permeability, these MMMs are, however, still not fit for industrial application.
4.3.2 CO2/CH4 separation performance of co-polyimide-MOF MMMs.
As mentioned above, 1,3,5-trimethyl-2,6-phenylenediamine (DAM) co-polymerized with ODA can improve CO2 permeability of MMMs.29 In this study, two co-polyimides with different ODA![[thin space (1/6-em)]](https://www.rsc.org/images/entities/char_2009.gif) :
:![[thin space (1/6-em)]](https://www.rsc.org/images/entities/char_2009.gif) DAM molar ratios were synthesized and used as polymer matrices for co-polyimide-MOF MMMs. The CO2/CH4 separation performance of neat and their co-polyimide-MOF membranes is summarized in Table 5. Interestingly, both neat co-polyimide and co-polyimide-MOF membranes showed higher CO2 permeability for both gases compared to neat Matrimid 5218 and Ultem 1000 as well as their polymer-MOF MMMs, while CH4 permeability was lower. The co-polyimide with ODA:DAM = 1
DAM molar ratios were synthesized and used as polymer matrices for co-polyimide-MOF MMMs. The CO2/CH4 separation performance of neat and their co-polyimide-MOF membranes is summarized in Table 5. Interestingly, both neat co-polyimide and co-polyimide-MOF membranes showed higher CO2 permeability for both gases compared to neat Matrimid 5218 and Ultem 1000 as well as their polymer-MOF MMMs, while CH4 permeability was lower. The co-polyimide with ODA:DAM = 1![[thin space (1/6-em)]](https://www.rsc.org/images/entities/char_2009.gif) :
:![[thin space (1/6-em)]](https://www.rsc.org/images/entities/char_2009.gif) 4 possessed both higher values of CO2 and CH4 permeability compared to those of the one with ODA
4 possessed both higher values of CO2 and CH4 permeability compared to those of the one with ODA![[thin space (1/6-em)]](https://www.rsc.org/images/entities/char_2009.gif) :
:![[thin space (1/6-em)]](https://www.rsc.org/images/entities/char_2009.gif) DAM = 1
DAM = 1![[thin space (1/6-em)]](https://www.rsc.org/images/entities/char_2009.gif) :
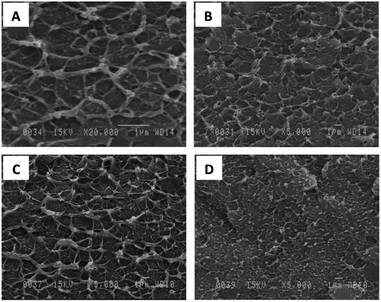
:![[thin space (1/6-em)]](https://www.rsc.org/images/entities/char_2009.gif) 1. The change of PCO2/PCH4 ideal selectivity is, however, not pronounced. Note that, due to the weak compatibility between these co-polyimides and dispersed NH2-MIL-53 particles, the maximum value of MOF loading was up to 22 wt%. The MOF powders have very low density, i.e. 0.4 g cm−3, while co-polyimide density is 1.4 g cm−3. Moreover, MMMs with non-functionalized MIL-53(Al) showed an improvement in CH4 permeability, resulting in a decrease in PCO2/PCH4 ideal selectivity and (50/50%) CO2–CH4 mixed gas selectivity, due to the presence of nano-voids at the interfacial contact between MIL-53(Al) particles and co-polyimides (see Fig. 6).
1. The change of PCO2/PCH4 ideal selectivity is, however, not pronounced. Note that, due to the weak compatibility between these co-polyimides and dispersed NH2-MIL-53 particles, the maximum value of MOF loading was up to 22 wt%. The MOF powders have very low density, i.e. 0.4 g cm−3, while co-polyimide density is 1.4 g cm−3. Moreover, MMMs with non-functionalized MIL-53(Al) showed an improvement in CH4 permeability, resulting in a decrease in PCO2/PCH4 ideal selectivity and (50/50%) CO2–CH4 mixed gas selectivity, due to the presence of nano-voids at the interfacial contact between MIL-53(Al) particles and co-polyimides (see Fig. 6).
Table 5 Gas permeability (Barrer), ideal selectivity, and 50/50 CO2–CH4 mixed gas selectivity of 6FOD(11) and 6FOD(14) co-polyimides and their MMMs with non- and amino-functionalized MIL-53(Al) at 35 °C and 150 psi
| Membrane |
P
CO2 (Barrer) |
P
CH4 (Barrer) |
P
CO2/PCH4 |
(50/50) CO2/CH4 mixed gas selectivity |
| 6FOD(11) |
54.1 |
2.3 |
23.5 |
23.6 |
| 6FODA(11)-M-20% |
61.5 |
4.8 |
12.5 |
13.0 |
| 6FODA(11)-NH2-M-10% |
51.2 |
1.8 |
34.1 |
31.8 |
| 6FODA(11)-NH2-M-20% |
52.6 |
3.4 |
15.1 |
13.1 |
| 6FODA(11)-NH2-M-22% |
50.0 |
4.8 |
12.5 |
12.5 |
| 6FOD(14) |
130 |
6.4 |
23.2 |
23.6 |
| 6FODA(14)-M-25% |
123 |
6.9 |
18.1 |
19.1 |
| 6FODA(14)-NH2-M-10% |
112 |
4.5 |
25.8 |
23.5 |
| 6FODA(14)-NH2-M-15% |
113 |
4.0 |
28.2 |
28.5 |
| 6FODA(14)-NH2-M-20% |
115 |
8.2 |
14.1 |
14.3 |
Avoiding the presence of these nano-voids, APTMDS was used as a cross-linking or a comptabilizing agent to improve interfacial contact between the two phases. As can be seen in Table 6, a significant improvement in CO2 permeability was observed for all cross-linking co-polyimide-MOF MMMs, resulting in higher PCO2/PCH4 ideal selectivity and separation factor. The 6FOD(11) + 2%-NH2-M-30% membrane showed the best permeation results. As shown in Fig. 11, CO2 permeability was increased with increasing amino-functionalized MOF loading, and reached a maximum value at MOF loading of 30 wt% and then decreased, whereas CH4 permeability was almost constant. In this study, a value of 30 wt% was found as an optimal MOF loading for 6FOD(11) + 2%-NH2-MOF MMM series. An optimal NH2-MIL-53(Al) loading of 25 wt% was reported for polysulfone-NH2-MIL-53 MMMs.23
Table 6 Gas permeability (Barrer), ideal selectivity, and 50/50 CO2–CH4 mixed gas selectivity of 6FOD(11) + 2% membrane and their MMMs with non- and amino-functionalized MIL-53(Al) at 35 °C and 150 psi
| Membrane |
P
CO2 (Barrer) |
P
CH4 (Barrer) |
P
CO2/PCH4 |
(50/50) CO2/CH4 mixed gas selectivity |
| 6FOD(11) + 2% |
32.2 |
1.7 |
18.9 |
20.2 |
| 6FOD(11) + 2%-M-15% |
76.4 |
9.1 |
8.9 |
8.8 |
| 6FOD(11) + 2%-NH2-M-15% |
49.9 |
2.4 |
20.8 |
20.0 |
| 6FOD(11) + 2%-NH2-M-20% |
52.3 |
2.1 |
24.9 |
21.2 |
| 6FOD(11) + 2%-NH2-M-25% |
55.1 |
1.8 |
30.6 |
29.7 |
| 6FOD(11) + 2%-NH2-M-30% |
58.5 |
1.6 |
36.6 |
33.9 |
| 6FOD(11) + 2%-NH2-M-32% |
60.8 |
2.1 |
29.0 |
27.1 |
| 6FOD(11) + 2%-NH2-M-35% |
65.8 |
2.4 |
27.4 |
26.6 |
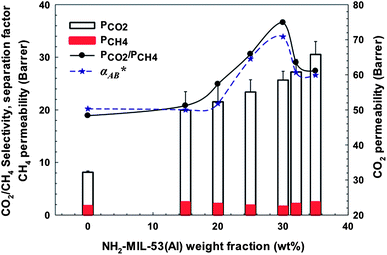 |
| | Fig. 11 CO2 and CH4 permeabilities, ideal selectivity (PCO2/PCH4) and separation factor (α*) for CO2![[thin space (1/6-em)]](https://www.rsc.org/images/entities/char_2009.gif) : :![[thin space (1/6-em)]](https://www.rsc.org/images/entities/char_2009.gif) CH4 = 50 CH4 = 50![[thin space (1/6-em)]](https://www.rsc.org/images/entities/char_2009.gif) : :![[thin space (1/6-em)]](https://www.rsc.org/images/entities/char_2009.gif) 50 as a function of NH2-MIL-53(Al) loading at 308K and 150 psi for 6FOD(11) + 2%-MOF MMMs. 50 as a function of NH2-MIL-53(Al) loading at 308K and 150 psi for 6FOD(11) + 2%-MOF MMMs. | |
4.3.3 Effect of feed pressure.
As mentioned in previous reports,23,24 amino-functionalized MIL-53(Al) exhibits a breathing effect at higher CO2 feed pressures. This effect was also observed in the case of co-polyimide + 2%-MOF MMMs, in which NH2-MIL-53(Al) crystals were used as the dispersed filler. Fig. 12A shows a comparison between separation factor of neat 6FOD(11) + 2% co-polyimide membrane and their MMMs with 25 and 30 wt% NH2-MIL-53(Al) loading as a function of feed pressure for gas blend (CO2![[thin space (1/6-em)]](https://www.rsc.org/images/entities/char_2009.gif) :
:![[thin space (1/6-em)]](https://www.rsc.org/images/entities/char_2009.gif) CH4 = 50
CH4 = 50![[thin space (1/6-em)]](https://www.rsc.org/images/entities/char_2009.gif) :
:![[thin space (1/6-em)]](https://www.rsc.org/images/entities/char_2009.gif) 50). The separation factor of pure 6FOD(11) membrane decreased with increasing feed pressure as reported in the literature.28,43,44 Remarkably, the separation factors of both MMMs containing different MOF loadings were keep constant with increasing feed pressure from 50 psi up to 600 psi. Moreover, the CO2 permeability was decreased with increasing feed pressure for both neat polymer matrix and co-polyimide-MOF MMMs (Fig. 12B).
50). The separation factor of pure 6FOD(11) membrane decreased with increasing feed pressure as reported in the literature.28,43,44 Remarkably, the separation factors of both MMMs containing different MOF loadings were keep constant with increasing feed pressure from 50 psi up to 600 psi. Moreover, the CO2 permeability was decreased with increasing feed pressure for both neat polymer matrix and co-polyimide-MOF MMMs (Fig. 12B).
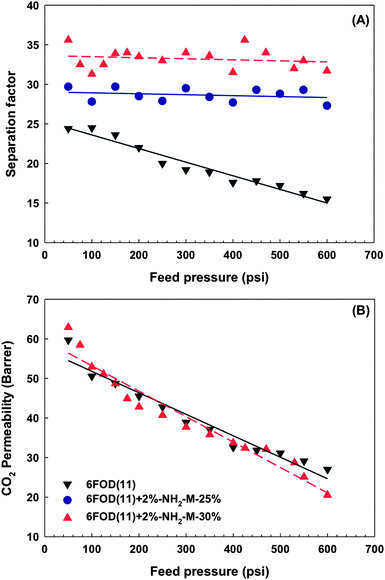 |
| | Fig. 12 Comparison between (A) separation factor and (B) CO2 permeability of neat polyimide and co-polyimide-MOF MMMs for gas blends. The lines are general trends. | |
In the literature, the adsorption isotherm of CO2 has been reaching a first plateau at ∼2.3 mmol g−1 under feed pressure below <12 bar (175 psi), and a drastic increase in the amount adsorbed occurs at 30 °C under higher pressures of 13–20 bar for amino-functionalized MIL-53(Al).23,24 Contrary to our previous observation, a strong increase in CO2/CH4 separation factor has been not found under the same feed pressure range.24 It is considered that this result is combining two effects, including a decrease by neat polymer membrane and an improvement by amino-functionalized MIL-53 with increasing feed pressure. Nevertheless, this constant in separation factor is of interest for industrial applications and defence against plasticization.
4.3.4 Effect of operation temperature.
As showed in Fig. 13, CO2 and CH4 permeabilities of co-polyimide-MOF MMMs were increased whereas ideal selectivity was substantially decreased with increasing temperature. The average diffusion coefficient is a kinetic property related to the amount of energy necessary for the penetrant to execute a diffusive jump through a polymer matrix and an intrinsic degree of segmental packing. Within a temperature range without any significant thermal transitions of the polymer matrix, temperature dependence of the diffusion coefficients typically increases appreciably with increasing temperature. Larger molecules such as CH4 have more limited opportunities for executing jumps at low temperature. Therefore, both diffusivities were increased, which leads to increasing permeability and decreasing selectivity with increasing temperature. This trend is the same as the one for neat polyimide membrane.28
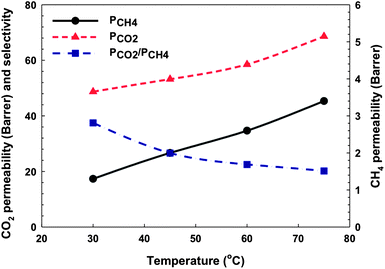 |
| | Fig. 13 CO2 and CH4 permeability and ideal selectivity of 6FOD(11) + 2%-NH2-M-30% membrane as a function of temperature. The lines are general trends. | |
4.3.5 Effect of gas composition.
Since the practical gas streams can have a CO2 content varying from 10–85%, the effect of the gas composition on the CO2/CH4 separation should be investigated. In this work, the separation of CO2–CH4 mixtures with CO2 mole fraction ranging from 0 to 100% was investigated with experiments under pressure of 150 psi for the 6FOD(11) + 2%-NH2-M-30% membrane. Fig. 14 shows the measured average values of CO2/CH4 separation factor (calculated using eqn (8)) as well as the calculated CO2 and CH4 permeability (calculated using eqn (9)) as a function of CO2 mole fraction in the feed at 35 °C and 150 psi. A variation of permeability between the pure gas and gas mixture has always been observed because the transport of a component in the mixture is significantly affected by the presence of other components.45 Hence, CO2 permeability was lowered by the presence of methane. On the other hand, the presence of CO2 increases CH4 permeability. As a result, the separation factor for gas blends was lower than that for neat gases. A similar behaviour was also reported in the literature.46,47 The separation factor of MMMs shows the same trend as the pure polyimide membrane.28,48 At CO2 feed concentration lower than 50%, separation factor was increased with CO2 feed concentration. Above this value, the separation factor decreased with increasing CO2 feed concentration.
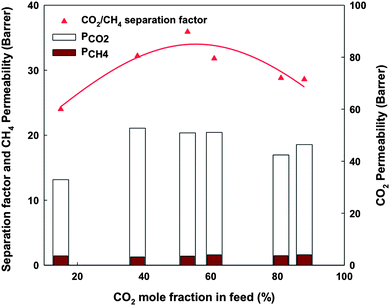 |
| | Fig. 14 Separation factor, permeability of CO2 and CH4 in gas blends as a function of CO2 mole fraction in feed. | |
4.4. Modeling of MMMs
As mentioned above, the MMMs combining amino-functionalized MIL-53(Al) and 6FDA-ODA-DAM(1![[thin space (1/6-em)]](https://www.rsc.org/images/entities/char_2009.gif) :
:![[thin space (1/6-em)]](https://www.rsc.org/images/entities/char_2009.gif) 1) cross-linked with 2% APTMDS co-polyimide showed an improvement in both permeability and separation factor. In order to quantitatively estimate the CO2/CH4 separation performance of these MMMs, the classical Maxwell model as expressed by eqn (3) was firstly applied. The CO2 and CH4 permeabilities of pure MIL-53 membranes cannot, however, be found from the literature. To solve this problem, the CO2 and CH4 permeabilities of NH2-MIL-53 filler should be adjustable parameters and optimized by minimizing the differences between experimental data and the corresponding calculated ones. This difference, namely the average absolute relative errors (%AARE), is expressed as follows:
1) cross-linked with 2% APTMDS co-polyimide showed an improvement in both permeability and separation factor. In order to quantitatively estimate the CO2/CH4 separation performance of these MMMs, the classical Maxwell model as expressed by eqn (3) was firstly applied. The CO2 and CH4 permeabilities of pure MIL-53 membranes cannot, however, be found from the literature. To solve this problem, the CO2 and CH4 permeabilities of NH2-MIL-53 filler should be adjustable parameters and optimized by minimizing the differences between experimental data and the corresponding calculated ones. This difference, namely the average absolute relative errors (%AARE), is expressed as follows:| |  | (10) |
where, NDP is the number of data points. Pcali and Pexpi are the calculated and experimental permeabilites, respectively. The optimized parameter is chosen to best fit the experimental data according to the minimized %AARE.
These MMMs are almost uniform owing to a good compatibility between the NH2-MIL-53(Al) filler and the co-polyimide. Therefore, the effect of some hypothetical nano-size voids could be neglected (see Fig. 5). The average radius of NH2-MIL-53 particles (rd) is assumed to be 75 nm. As listed in Table 8, the CO2 and CH4 permeabilities of 6FOD(1![[thin space (1/6-em)]](https://www.rsc.org/images/entities/char_2009.gif) :
:![[thin space (1/6-em)]](https://www.rsc.org/images/entities/char_2009.gif) 1) + 2% co-polyimide are 32.2 and 1.7 Barrer, respectively. The CO2 permeability was generally increased with increasing amino-functionalized MIL-53 loading (ϕd), whereas for CH4 gas, the permeability does not follow a particular trend. Then, in this section, only CO2 permeation data will be used in model estimation.
1) + 2% co-polyimide are 32.2 and 1.7 Barrer, respectively. The CO2 permeability was generally increased with increasing amino-functionalized MIL-53 loading (ϕd), whereas for CH4 gas, the permeability does not follow a particular trend. Then, in this section, only CO2 permeation data will be used in model estimation.
The predicted values of CO2 permeability and CO2/CH4 selectivity obtained by the Maxwell model are listed in Table 7 and 8 and plotted in Fig. 15 and 16. A good agreement between experimental data and predictions was observed with a relatively low value of %AARE (∼2.5%). As mentioned in the review of Vinh-Thang and Kaliaguine,30 a best fit between experimental data and predictions from the classical Maxwell model is a criterion to conclude that there is an ideal contact between polymer matrix and dispersed filler at the interphase. In this study, this good contact can be attributed to the presence of the amino-functionalized group in MIL-53 framework. The slight discrepancy, which can be seen in Fig. 15 and 16, may be attributed to the polymer chain rigidification effect. As listed in Table 3, Young's modulus values, which are related to the membrane rigidity, were different depending on MOF loading. Therefore, the modified Maxwell model expressed by eqn (4)–(6) was used in order to evaluate the polymer chain rigidification effect on the CO2/CH4 separation performance of co-polyimide-MIL-53 MMMs. In this case, there are four dependent variables: CO2 permeability of NH2-MIL-53(Al) (Pd); interphase thickness (lI); polymer chain rigidification factor (β); and volume fraction of NH2-MIL-53(Al) filler (ϕd). All MMMs filled with different NH2-MIL-53(Al) loadings are assumed to have the same interface thickness (lI) and polymer chain rigidification factor (β). Similar to the Maxwell model, the minimized %AARE value was used to obtain optimized values of the four parameters. The modeling results are also listed in Table 7 and 8 and illustrated in Fig. 15 and 16 to compare with those obtained from the Maxwell model. As expected, a better consistent prediction with experimental data was observed (%AARE ∼ 2.0%).
Table 7 Best fit of the lI (nm), Pd and β parameters in the Maxwell model and the modified Maxwell model for the series of 6FOD(11) + 2%-MOF MMMs
| Parameter |
P
d (Barrer) |
l
I (nm) |
β
|
%AARE |
| Maxwell |
90 |
— |
— |
2.5 |
| Modified Maxwell |
91 |
15 |
1.2 |
2.0 |
Table 8 Comparison of the gas performance predicted by the Maxwell model and the modified Maxwell model with the experimental data of CO2/CH4 permeation through the series of 6FOD(11) + 2%-MOF MMMs
| Membrane |
ϕ
d (vol%) |
P
CH4
exp (Barrer) |
P
CO2 (Barrer) |
P
CO2/PCH4 |
%ARE |
| Experimental |
Maxwell |
Modified Maxwell |
Experimental |
Maxwell |
Modified Maxwell |
Maxwell |
Modified Maxwell |
|
Predicted using the Maxwell model, rd = 75 (nm), lI = 15 (nm), ϕs = 0.83, β = 1.2.
|
| 6FOD(11) + 2% |
0 |
1.7 |
32.2 |
— |
— |
18.9 |
— |
— |
— |
— |
| 6FOD(11) + 2%-NH2-M-15% |
0.38 |
2.4 |
49.9 |
48.2 |
47.6 |
20.8 |
20.1 |
19.8 |
3.4 |
4.5 |
| 6FOD(11) + 2%-NH2-M-20% |
0.47 |
2.1 |
52.3 |
52.8 |
52.0 |
24.9 |
25.2 |
24.8 |
1.0 |
0.5 |
| 6FOD(11) + 2%-NH2-M-25% |
0.54 |
1.8 |
55.1 |
56.7 |
55.7 |
30.6 |
31.5 |
31.0 |
2.9 |
1.1 |
| 6FOD(11) + 2%-NH2-M-30% |
0.6 |
1.6 |
58.5 |
60.2 |
59.1 |
36.6 |
37.6 |
36.9 |
2.9 |
1.0 |
| 6FOD(11) + 2%-NH2-M-32% |
0.63 |
2.1 |
60.8 |
62.0 |
60.8 |
29.0 |
29.5 |
29.0 |
2.0 |
0.0 |
| 6FOD(11) + 2%-NH2-M-35% |
0.66 |
2.4 |
65.8 |
63.9 |
62.6 |
27.4 |
26.6 |
26.1 |
2.9 |
4.9 |
| NH2-MIL-53(Al) |
1 |
3.5a |
— |
90.0 |
91.0 |
— |
25.7 |
26.0 |
— |
— |
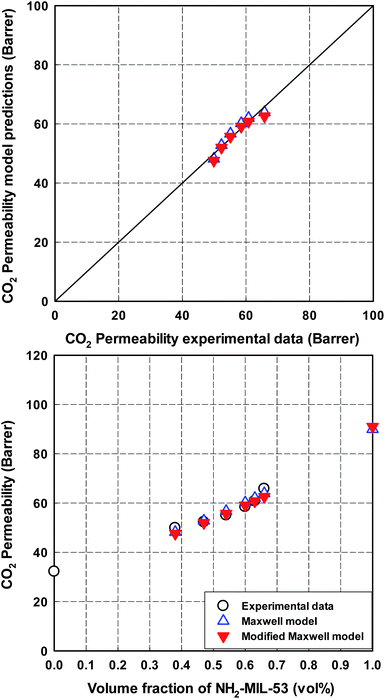 |
| | Fig. 15 Comparison of CO2 permeability of 6FOD(11) + 2%-NH2-MIL-53(Al) MMMs between experimental data and predictions from the Maxwell model and the modified Maxwell model. The optimized CH4 permeability of pure NH2-MIL-53(Al) is predicted by the Maxwell model. | |
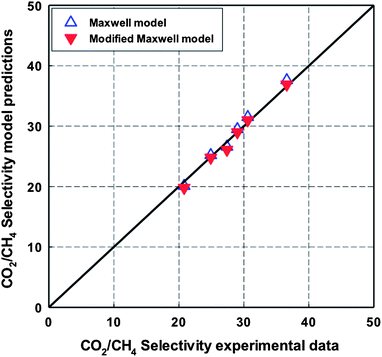 |
| | Fig. 16 Comparison of CO2/CH4 ideal selectivity of 6FOD(11) + 2%-NH2-MIL-53(Al) MMMs between experimental data and predictions from the Maxwell model and the modified Maxwell model. | |
From Table 7, the optimized interphase thickness (lI) value is 15 nm, corresponding to a value of volume fraction of dispersed filler in the interphase (ϕs) of 0.83 (eqn (5)). Such a high ϕs value was also calculated from the values reported by Vu et al.8 for a CMS-Matrimid MMM having CMS particles of 1 μm and rigidified layer thickness of 0.075 μm as established from SEM pictures. Gheimasi et al.49 fitting the same data by different models (including the classical Maxwell and the modified Maxwell model) made the arbitrary assumption of a lower ϕs value of 0.66.
Regarding the β factor, which is related to a reduction in permeability of polymer under polymer chain rigidification effect, the modeling optimized value (β = 1.2) is slightly higher than that (β = 1.09) reported by Gheimasi et al.49 for CO2/CH4 permeation through CMS-Matrimid MMMs.19 It can be explained by the different CO2 transport behaviours of Matrimid and 6FDA-ODA-DAM(1![[thin space (1/6-em)]](https://www.rsc.org/images/entities/char_2009.gif) :
:![[thin space (1/6-em)]](https://www.rsc.org/images/entities/char_2009.gif) 1) cross-linked with 2% APTMDS polymers.
1) cross-linked with 2% APTMDS polymers.
5 Conclusions
In this study, nano-size (100–150 nm) non- and amino-functionalized MIL-53(Al) crystals MOFs were synthesized with narrow particle size distribution. A comparison between particles of NH2-MIL-53(Al) and MIL-53(Al) mixed with two commercial polymers, (Matrimid 5218 and Ultem 1000), and with two synthesized co-polyimides (6FDA-ODA-DAM(1![[thin space (1/6-em)]](https://www.rsc.org/images/entities/char_2009.gif) :
:![[thin space (1/6-em)]](https://www.rsc.org/images/entities/char_2009.gif) 1) and (1
1) and (1![[thin space (1/6-em)]](https://www.rsc.org/images/entities/char_2009.gif) :
:![[thin space (1/6-em)]](https://www.rsc.org/images/entities/char_2009.gif) 4)) and one cross-linked co-polyimide (6FOD(11) + 2% agent cross-linking APTMDS) was performed. The cross-linked co-polyimide showed excellent adhesion with the NH2-MIL-53(Al) particles in MMMs. The cross-linking agent also acts as a compatibilizing agent to improve coherence between the two phases. For this reason, high MOF filler loading (up to 35 wt%) were possible due to hydrogen bonding interaction between the MOF particles and the polymer matrix. MMMs containing 30 wt% of NH2-MIL-53(Al) particles displayed relatively high both CO2 permeability and ideal selectivity. Interestingly, the MMMs made from such “breathing” MOF particles and co-polyimides have shown stable CO2/CH4 separation factor under increasing pressure. This is a significant property for industrial application.
4)) and one cross-linked co-polyimide (6FOD(11) + 2% agent cross-linking APTMDS) was performed. The cross-linked co-polyimide showed excellent adhesion with the NH2-MIL-53(Al) particles in MMMs. The cross-linking agent also acts as a compatibilizing agent to improve coherence between the two phases. For this reason, high MOF filler loading (up to 35 wt%) were possible due to hydrogen bonding interaction between the MOF particles and the polymer matrix. MMMs containing 30 wt% of NH2-MIL-53(Al) particles displayed relatively high both CO2 permeability and ideal selectivity. Interestingly, the MMMs made from such “breathing” MOF particles and co-polyimides have shown stable CO2/CH4 separation factor under increasing pressure. This is a significant property for industrial application.
An excellent agreement between the experimental data and the predictions by both the Maxwell model and the modified Maxwell model was reported. The predictions by the modified Maxwell model are more consistent with the experimental data than those predicted by the Maxwell model, due to their taking into account the polymer chain rigidification effect on the CO2 permeation through co-polyimide-MOF MMMs. A computational optimizing process was proposed for both the Maxwell model and the modified Maxwell model, in order to estimate simultaneously three unknown variables, i.e. gas permeability of dispersed filler (Pd); interphase thickness (lI); polymer chain rigidification factor (β). The effect of particle pore blockage and interfacial voids is, however, not discussed here and will be examined in the future.
The modeling results have shown that an approximately ideal morphology was reached when preparing MMMs containing amino-functionalized NH2-MIL-53(Al) particles dispersed in 6FDA-ODA-DAM(1![[thin space (1/6-em)]](https://www.rsc.org/images/entities/char_2009.gif) :
:![[thin space (1/6-em)]](https://www.rsc.org/images/entities/char_2009.gif) 1) cross-linked with 2% APTMDS co-polyimide. The improvement in both permeability and ideal selectivity values of co-polyimide-NH2-MIL-53(Al) MMMs, combined with the satisfactory mechanical properties, even at high MOF loading (up to 35 wt%), gives these MMMs a promising potential in gas-mixture separation application at industrial scale.
1) cross-linked with 2% APTMDS co-polyimide. The improvement in both permeability and ideal selectivity values of co-polyimide-NH2-MIL-53(Al) MMMs, combined with the satisfactory mechanical properties, even at high MOF loading (up to 35 wt%), gives these MMMs a promising potential in gas-mixture separation application at industrial scale.
Nomenclature
| Average absolute relative error (%) | %AARE |
| Absolute relative error (%) | %ARE |
| Rigidified layer thickness (nm) |
l
I
|
| Number of data points | NDP |
| Permeability (Barrer) |
P
|
| Effective permeability (Barrer) |
P
eff
|
| Particle radius (nm) |
r
d
|
| Membrane thickness (cm) |
l
|
| Upstream pressure (psi) | Δp |
| Downstream volume (cm3) |
V
|
| Universal gas constant (cm3 cmHg mol−1 K−1) |
R
|
| Absolute temperature (K) |
T
|
| Permeation rate (psi s−1) | dp/dt |
Greek letters
| Polymer chain rigidification factor |
β
|
| Volume fraction |
ϕ
|
| Separation factor |
α
*AB
|
Superscripts
| Experimental | exp |
| Calculated | cal |
Subscripts
| Related to the pseudo-dispersed phase | ps |
| Related to the interfacial phase | I |
| Related to the dispersed phase | d |
| Related to the continuous phase or polymer matrix | c |
Acknowledgements
The authors would like to thank the Natural Science and Engineering Research Council of Canada (NSERC) for financial support through a strategic grant.
References
-
G. R. Pastor, J. F. Peters, W. K. Larsen and A. C. Iakovakis, US Pat 4753666, 1988.
-
http://en.wikipedia.org/wiki/Natural_gas., accessed on 05.04.11.
- S. Basu, A. L. Khan, A. Cano-Odena, C. Liu and I. F. J. Vankelecom, Chem. Soc. Rev., 2010, 39, 750–768 RSC.
- W. J. Koros and G. K. Fleming, J. Membr. Sci., 1993, 83, 1–80 CrossRef CAS.
- L. M. Robeson, J. Membr. Sci., 1991, 62, 165–185 CrossRef CAS.
- L. M. Robeson, J. Membr. Sci., 2008, 320, 390–400 CrossRef CAS.
- A. F. Ismail and W. Lorna, Sep. Purif. Technol., 2002, 27, 173–194 CrossRef CAS.
- D. Q. Vu, W. J. Koros and S. J. Miller, J. Membr. Sci., 2003, 211, 335–348 CrossRef CAS.
- T.-S. Chung, L. Y. Jiang, Y. Li and S. Kulprathipanja, Prog. Polym. Sci., 2007, 32, 483–507 CrossRef CAS.
-
C. Liu and S. Kulprathipanja, in Zeolites in Industrial Separation and Catalysis, Wiley-VCH Verlag GmbH & Co. KGaA, 2010, pp. 329–353 Search PubMed.
- A. F. Ismail, P. S. Goh, S. M. Sanip and M. Aziz, Sep. Purif. Technol., 2009, 70, 12–26 CrossRef CAS.
- R. Mahajan and W. J. Koros, Ind. Eng. Chem. Res., 2000, 39, 2692–2696 CrossRef CAS.
- T. T. Moore, R. Mahajan, D. Q. Vu and W. J. Koros, AIChE J., 2004, 50, 311–321 CrossRef CAS.
-
D. W. Breck, Zeolite Molecular Sieves: Structure, Chemistry, and Use, Wiley, New York, USA, 1973 Search PubMed.
- M. A. Aroon, A. F. Ismail, T. Matsuura and M. M. Montazer-Rahmati, Sep. Purif. Technol., 2010, 75, 229–242 CrossRef CAS.
- X. Y. Chen, O. G. Nik, D. Rodrigue and S. Kaliaguine, Polymer, 2012, 53, 3269–3280 CrossRef CAS.
- O. G. Nik, X. Y. Chen and S. Kaliaguine, J. Membr. Sci., 2011, 379, 468–478 CrossRef CAS.
- O. M. Yaghi, M. O'Keeffe, N. W. Ockwig, H. K. Chae, M. Eddaoudi and J. Kim, Nature, 2003, 423, 705–714 CrossRef CAS PubMed.
- S. Kitagawa, R. Kitaura and S.-I. Noro, Angew. Chem., Int. Ed., 2004, 43, 2334–2375 CrossRef CAS PubMed.
- G. Férey, Chem. Soc. Rev., 2008, 37, 191–214 RSC.
-
H. Vinh-Thang and S. Kaliaguine, in Coordination Polymers and Metal Organic Frameworks: Properties, Types and Applications, ed. O. L. Ortiz and L. D. Ramírez, Nova Science Publishers, Hauppauge, N.Y., USA, 2011, ch. 4, pp. 129–168 Search PubMed.
- C. Serre, F. Millange, C. Thouvenot, M. Noguès, G. Marsolier, D. Louër and G. Férey, J. Am. Chem. Soc., 2002, 124, 13519–13526 CrossRef CAS PubMed.
- B. Zornoza, A. Martinez-Joaristi, P. Serra-Crespo, C. Tellez, J. Coronas, J. Gascon and F. Kapteijn, Chem. Commun., 2011, 47, 9522–9524 RSC.
- X. Y. Chen, H. Vinh-Thang, D. Rodrigue and S. Kaliaguine, Ind. Eng. Chem. Res., 2012, 51, 6895–6906 CrossRef CAS.
- B. Seoane, C. Téllez, J. Coronas and C. Staudt, Sep. Purif. Technol., 2013, 111, 72–81 CrossRef CAS.
- T. Rodenas, M. van Dalen, E. García-Pérez, P. Serra-Crespo, B. Zornoza, F. Kapteijn and J. Gascon, Adv. Funct. Mater., 2013 DOI:10.1002/adfm.201203462.
- S. Xiao, R. Y. M. Huang and X. Feng, Polymer, 2007, 48, 5355–5368 CrossRef CAS.
- X. Y. Chen, D. Rodrigue and S. Kaliaguine, Sep. Purif. Technol., 2012, 86, 221–233 CrossRef CAS.
- J. Vaughn and W. J. Koros, Macromolecules, 2012, 45, 7036–7049 CrossRef CAS.
- H. Vinh-Thang and S. Kaliaguine, Chem. Rev., 2013, 113(7), 4980–5028 CrossRef CAS PubMed.
-
J. C. Maxwell, Treatise on Electricity and Magnetism, Oxford University Press, London, UK, 1873 Search PubMed.
- T. T. Moore and W. J. Koros, J. Mol. Struct., 2005, 739, 87–98 CrossRef CAS.
- Y. Li, H.-M. Guan, T.-S. Chung and S. Kulprathipanja, J. Membr. Sci., 2006, 275, 17–28 CrossRef CAS.
- S. Couck, J. F. M. Denayer, G. V. Baron, T. Rémy, J. Gascon and F. Kapteijn, J. Am. Chem. Soc., 2009, 131, 6326–6327 CrossRef CAS PubMed.
- T. Loiseau, C. Serre, C. Huguenard, G. Fink, F. Taulelle, M. Henry, T. Bataille and G. Férey, Chem.–Eur. J., 2004, 10, 1373–1382 CrossRef CAS PubMed.
- S. Marx, W. Kleist, J. Huang, M. Maciejewski and A. Baiker, Dalton Trans., 2010, 39, 3795–3798 RSC.
- Y. Xiao, T.-S. Chung, H. M. Guan and M. D. Guiver, J. Membr. Sci., 2007, 302, 254–264 CrossRef CAS.
- Y. Liu, R. Wang and T.-S. Chung, J. Membr. Sci., 2001, 189, 231–239 CrossRef CAS.
- S. Zhao, Z.-Q. Shi, C.-Y. Wang and M.-M. Chen, J. Appl. Polym. Sci., 2008, 108, 1852–1856 CrossRef CAS.
- S. Biswas, T. Ahnfeldt and N. Stock, Inorg. Chem., 2011, 50, 9518–9526 CrossRef CAS PubMed.
- T. M. Nair, M. G. Kumaran, G. Unnikrishnan and V. B. Pillai, J. Appl. Polym. Sci., 2009, 112, 72–81 CrossRef CAS.
- X. Y. Chen and D. Rodrigue, J. Cell. Plast., 2009, 45, 405–418 CrossRef CAS.
- H. B. Park, C. H. Jung, Y. M. Lee, A. J. Hill, S. J. Pas, S. T. Mudie, E. Van Wagner, B. D. Freeman and D. J. Cookson, Science, 2007, 318, 254–258 CrossRef CAS PubMed.
- C. Staudt-Bickel and W. J. Koros, J. Membr. Sci., 1999, 155, 145–154 CrossRef CAS.
- R. Wang, C. Cao and T.-S. Chung, J. Membr. Sci., 2002, 198, 259–271 CrossRef CAS.
- R. Wang, S. L. Liu, T. T. Lin and T.-S. Chung, Chem. Eng. Sci., 2002, 57, 967–976 CrossRef CAS.
- P. C. Raymond, W. J. Koros and D. R. Paul, J. Membr. Sci., 1993, 77, 49–57 CrossRef CAS.
- X. Y. Chen and S. Kaliaguine, J. Appl. Polym. Sci., 2013, 128, 380–389 CrossRef CAS.
- K. M. Gheimasi, T. Mohammadi and O. Bakhtiari, J. Membr. Sci., 2013, 427, 399–410 CrossRef.
|
| This journal is © The Royal Society of Chemistry 2013 |
Click here to see how this site uses Cookies. View our privacy policy here. ![[thin space (1/6-em)]](https://www.rsc.org/images/entities/char_2009.gif) :
:![[thin space (1/6-em)]](https://www.rsc.org/images/entities/char_2009.gif) 1 and 1
1 and 1![[thin space (1/6-em)]](https://www.rsc.org/images/entities/char_2009.gif) :
:![[thin space (1/6-em)]](https://www.rsc.org/images/entities/char_2009.gif) 4) and cross-linked co-polyimide 6FDA-ODA-DAM (1
4) and cross-linked co-polyimide 6FDA-ODA-DAM (1![[thin space (1/6-em)]](https://www.rsc.org/images/entities/char_2009.gif) :
:![[thin space (1/6-em)]](https://www.rsc.org/images/entities/char_2009.gif) 1, 2% agent cross-linking APTMDS) were used to prepare mixed matrix membranes (MMMs) whilst membranes consisting of MIL-53(Al) and commercial polyimides (Matrimid 5218 and Ultem 1000) were also fabricated for comparison. Pure gases and blends of CO2 and CH4 permeation tests showed enhanced separation performance of MMMs with relatively high NH2-MIL-53(Al) loadings (CO2 permeability up to 65 Barrer, ideal selectivity up to 36.5). A detailed study of the relation between MMM properties and their morphology as affected by the nature of continuous polyimide phase was performed. The separation factor increased with MOF loading. Furthermore, these materials showed stable CO2/CH4 selectivity at increasing feed pressure, in contrast to the traditional polymer membranes. The separation performances as functions of operation temperature and composition of gas mixture were also studied. Experimental permeation data of MMMs with 6FDA-ODA-DAM (1
1, 2% agent cross-linking APTMDS) were used to prepare mixed matrix membranes (MMMs) whilst membranes consisting of MIL-53(Al) and commercial polyimides (Matrimid 5218 and Ultem 1000) were also fabricated for comparison. Pure gases and blends of CO2 and CH4 permeation tests showed enhanced separation performance of MMMs with relatively high NH2-MIL-53(Al) loadings (CO2 permeability up to 65 Barrer, ideal selectivity up to 36.5). A detailed study of the relation between MMM properties and their morphology as affected by the nature of continuous polyimide phase was performed. The separation factor increased with MOF loading. Furthermore, these materials showed stable CO2/CH4 selectivity at increasing feed pressure, in contrast to the traditional polymer membranes. The separation performances as functions of operation temperature and composition of gas mixture were also studied. Experimental permeation data of MMMs with 6FDA-ODA-DAM (1![[thin space (1/6-em)]](https://www.rsc.org/images/entities/char_2009.gif) :
:![[thin space (1/6-em)]](https://www.rsc.org/images/entities/char_2009.gif) 1, 2% agent cross-linking APTMDS) and up to 35 wt% NH2-MIL-53(Al) loading are in excellent agreement with the modeling predictions by both the Maxwell model and the modified Maxwell model. An approximately ideal morphology was reached when preparing MMMs. A computational optimized process was proposed in order to estimate simultaneously three independent parameters, including gas permeability of dispersed filler, interphase thickness and polymer chain rigidification factors, which would be applied for non-ideal MMM systems.
1, 2% agent cross-linking APTMDS) and up to 35 wt% NH2-MIL-53(Al) loading are in excellent agreement with the modeling predictions by both the Maxwell model and the modified Maxwell model. An approximately ideal morphology was reached when preparing MMMs. A computational optimized process was proposed in order to estimate simultaneously three independent parameters, including gas permeability of dispersed filler, interphase thickness and polymer chain rigidification factors, which would be applied for non-ideal MMM systems.


![[thin space (1/6-em)]](https://www.rsc.org/images/entities/char_2009.gif) :
:![[thin space (1/6-em)]](https://www.rsc.org/images/entities/char_2009.gif) DAM 50
DAM 50![[thin space (1/6-em)]](https://www.rsc.org/images/entities/char_2009.gif) :
:![[thin space (1/6-em)]](https://www.rsc.org/images/entities/char_2009.gif) 50 and 20
50 and 20![[thin space (1/6-em)]](https://www.rsc.org/images/entities/char_2009.gif) :
:![[thin space (1/6-em)]](https://www.rsc.org/images/entities/char_2009.gif) 80 mol%) were prepared by solution condensation in NMP. Then APTMDS was added to PAA solutions to form cross-linked co-polyimides. Both reaction mixtures were stirred using a power drill (Mastercraft) connected to a power start variable autotransformer (The Superior Electric co. Bristol Conn, USA) stirrer under an argon atmosphere and placed in an ice–water mixture for 15 h.
80 mol%) were prepared by solution condensation in NMP. Then APTMDS was added to PAA solutions to form cross-linked co-polyimides. Both reaction mixtures were stirred using a power drill (Mastercraft) connected to a power start variable autotransformer (The Superior Electric co. Bristol Conn, USA) stirrer under an argon atmosphere and placed in an ice–water mixture for 15 h.
![[thin space (1/6-em)]](https://www.rsc.org/images/entities/char_2009.gif) :
:![[thin space (1/6-em)]](https://www.rsc.org/images/entities/char_2009.gif) 1.48 acid (amino- or terephthalic acid)
1.48 acid (amino- or terephthalic acid)![[thin space (1/6-em)]](https://www.rsc.org/images/entities/char_2009.gif) :
:![[thin space (1/6-em)]](https://www.rsc.org/images/entities/char_2009.gif) 184.5 DMF. The obtained solution was aged for 24 h and then transferred to a Teflon-lined stainless steel autoclave. The autoclave was heated in an oven at 130 °C for 3 days. After the mixtures were cooled, the as-synthesized yellow (NH2-MIL-53(Al)) or white (MIL-53(Al)) powders were collected by centrifugation at 5000 rpm for 15 min. To remove the incorporated 2-amino- or terephthalic acid, the as-synthesized powders were washed twice with anhydrous DMF in an autoclave at 130 °C for 24 h. Afterward, DMF was removed by acetone Soxhlet extraction for 20 h. Finally, the solids were dried at 100 °C under vacuum for 48 h.
184.5 DMF. The obtained solution was aged for 24 h and then transferred to a Teflon-lined stainless steel autoclave. The autoclave was heated in an oven at 130 °C for 3 days. After the mixtures were cooled, the as-synthesized yellow (NH2-MIL-53(Al)) or white (MIL-53(Al)) powders were collected by centrifugation at 5000 rpm for 15 min. To remove the incorporated 2-amino- or terephthalic acid, the as-synthesized powders were washed twice with anhydrous DMF in an autoclave at 130 °C for 24 h. Afterward, DMF was removed by acetone Soxhlet extraction for 20 h. Finally, the solids were dried at 100 °C under vacuum for 48 h.


![[thin space (1/6-em)]](https://www.rsc.org/images/entities/char_2009.gif) 000, the average elementary particle size is in the range of 100–150 nm.
000, the average elementary particle size is in the range of 100–150 nm.


![[thin space (1/6-em)]](https://www.rsc.org/images/entities/char_2009.gif) :
:![[thin space (1/6-em)]](https://www.rsc.org/images/entities/char_2009.gif) 1); 6FOD(14): pure 6FDA-ODA-DAM(1
1); 6FOD(14): pure 6FDA-ODA-DAM(1![[thin space (1/6-em)]](https://www.rsc.org/images/entities/char_2009.gif) :
:![[thin space (1/6-em)]](https://www.rsc.org/images/entities/char_2009.gif) 4); 6FOD(11) + 2%: 6FDA-ODA-DAM(1
4); 6FOD(11) + 2%: 6FDA-ODA-DAM(1![[thin space (1/6-em)]](https://www.rsc.org/images/entities/char_2009.gif) :
:![[thin space (1/6-em)]](https://www.rsc.org/images/entities/char_2009.gif) 1) containing 2% APTMDS; M: MIL-53(Al); and n%: wt% MOF loading.
1) containing 2% APTMDS; M: MIL-53(Al); and n%: wt% MOF loading.
![[double bond, length as m-dash]](https://www.rsc.org/images/entities/char_e001.gif) O) to either CO or CO2.39 There was no residual absorbed solvent or hydroxyl group, which would have yielded low decomposition temperatures (100–250 °C).
O) to either CO or CO2.39 There was no residual absorbed solvent or hydroxyl group, which would have yielded low decomposition temperatures (100–250 °C).


![[thin space (1/6-em)]](https://www.rsc.org/images/entities/char_2009.gif) :
:![[thin space (1/6-em)]](https://www.rsc.org/images/entities/char_2009.gif) DAM molar ratios were synthesized and used as polymer matrices for co-polyimide-MOF MMMs. The CO2/CH4 separation performance of neat and their co-polyimide-MOF membranes is summarized in Table 5. Interestingly, both neat co-polyimide and co-polyimide-MOF membranes showed higher CO2 permeability for both gases compared to neat Matrimid 5218 and Ultem 1000 as well as their polymer-MOF MMMs, while CH4 permeability was lower. The co-polyimide with ODA:DAM = 1
DAM molar ratios were synthesized and used as polymer matrices for co-polyimide-MOF MMMs. The CO2/CH4 separation performance of neat and their co-polyimide-MOF membranes is summarized in Table 5. Interestingly, both neat co-polyimide and co-polyimide-MOF membranes showed higher CO2 permeability for both gases compared to neat Matrimid 5218 and Ultem 1000 as well as their polymer-MOF MMMs, while CH4 permeability was lower. The co-polyimide with ODA:DAM = 1![[thin space (1/6-em)]](https://www.rsc.org/images/entities/char_2009.gif) :
:![[thin space (1/6-em)]](https://www.rsc.org/images/entities/char_2009.gif) 4 possessed both higher values of CO2 and CH4 permeability compared to those of the one with ODA
4 possessed both higher values of CO2 and CH4 permeability compared to those of the one with ODA![[thin space (1/6-em)]](https://www.rsc.org/images/entities/char_2009.gif) :
:![[thin space (1/6-em)]](https://www.rsc.org/images/entities/char_2009.gif) DAM = 1
DAM = 1![[thin space (1/6-em)]](https://www.rsc.org/images/entities/char_2009.gif) :
:![[thin space (1/6-em)]](https://www.rsc.org/images/entities/char_2009.gif) 1. The change of PCO2/PCH4 ideal selectivity is, however, not pronounced. Note that, due to the weak compatibility between these co-polyimides and dispersed NH2-MIL-53 particles, the maximum value of MOF loading was up to 22 wt%. The MOF powders have very low density, i.e. 0.4 g cm−3, while co-polyimide density is 1.4 g cm−3. Moreover, MMMs with non-functionalized MIL-53(Al) showed an improvement in CH4 permeability, resulting in a decrease in PCO2/PCH4 ideal selectivity and (50/50%) CO2–CH4 mixed gas selectivity, due to the presence of nano-voids at the interfacial contact between MIL-53(Al) particles and co-polyimides (see Fig. 6).
1. The change of PCO2/PCH4 ideal selectivity is, however, not pronounced. Note that, due to the weak compatibility between these co-polyimides and dispersed NH2-MIL-53 particles, the maximum value of MOF loading was up to 22 wt%. The MOF powders have very low density, i.e. 0.4 g cm−3, while co-polyimide density is 1.4 g cm−3. Moreover, MMMs with non-functionalized MIL-53(Al) showed an improvement in CH4 permeability, resulting in a decrease in PCO2/PCH4 ideal selectivity and (50/50%) CO2–CH4 mixed gas selectivity, due to the presence of nano-voids at the interfacial contact between MIL-53(Al) particles and co-polyimides (see Fig. 6).

![[thin space (1/6-em)]](https://www.rsc.org/images/entities/char_2009.gif) :
:![[thin space (1/6-em)]](https://www.rsc.org/images/entities/char_2009.gif) CH4 = 50
CH4 = 50![[thin space (1/6-em)]](https://www.rsc.org/images/entities/char_2009.gif) :
:![[thin space (1/6-em)]](https://www.rsc.org/images/entities/char_2009.gif) 50 as a function of NH2-MIL-53(Al) loading at 308K and 150 psi for 6FOD(11) + 2%-MOF MMMs.
50 as a function of NH2-MIL-53(Al) loading at 308K and 150 psi for 6FOD(11) + 2%-MOF MMMs.![[thin space (1/6-em)]](https://www.rsc.org/images/entities/char_2009.gif) :
:![[thin space (1/6-em)]](https://www.rsc.org/images/entities/char_2009.gif) CH4 = 50
CH4 = 50![[thin space (1/6-em)]](https://www.rsc.org/images/entities/char_2009.gif) :
:![[thin space (1/6-em)]](https://www.rsc.org/images/entities/char_2009.gif) 50). The separation factor of pure 6FOD(11) membrane decreased with increasing feed pressure as reported in the literature.28,43,44 Remarkably, the separation factors of both MMMs containing different MOF loadings were keep constant with increasing feed pressure from 50 psi up to 600 psi. Moreover, the CO2 permeability was decreased with increasing feed pressure for both neat polymer matrix and co-polyimide-MOF MMMs (Fig. 12B).
50). The separation factor of pure 6FOD(11) membrane decreased with increasing feed pressure as reported in the literature.28,43,44 Remarkably, the separation factors of both MMMs containing different MOF loadings were keep constant with increasing feed pressure from 50 psi up to 600 psi. Moreover, the CO2 permeability was decreased with increasing feed pressure for both neat polymer matrix and co-polyimide-MOF MMMs (Fig. 12B).


![[thin space (1/6-em)]](https://www.rsc.org/images/entities/char_2009.gif) :
:![[thin space (1/6-em)]](https://www.rsc.org/images/entities/char_2009.gif) 1) cross-linked with 2% APTMDS co-polyimide showed an improvement in both permeability and separation factor. In order to quantitatively estimate the CO2/CH4 separation performance of these MMMs, the classical Maxwell model as expressed by eqn (3) was firstly applied. The CO2 and CH4 permeabilities of pure MIL-53 membranes cannot, however, be found from the literature. To solve this problem, the CO2 and CH4 permeabilities of NH2-MIL-53 filler should be adjustable parameters and optimized by minimizing the differences between experimental data and the corresponding calculated ones. This difference, namely the average absolute relative errors (%AARE), is expressed as follows:
1) cross-linked with 2% APTMDS co-polyimide showed an improvement in both permeability and separation factor. In order to quantitatively estimate the CO2/CH4 separation performance of these MMMs, the classical Maxwell model as expressed by eqn (3) was firstly applied. The CO2 and CH4 permeabilities of pure MIL-53 membranes cannot, however, be found from the literature. To solve this problem, the CO2 and CH4 permeabilities of NH2-MIL-53 filler should be adjustable parameters and optimized by minimizing the differences between experimental data and the corresponding calculated ones. This difference, namely the average absolute relative errors (%AARE), is expressed as follows:
![[thin space (1/6-em)]](https://www.rsc.org/images/entities/char_2009.gif) :
:![[thin space (1/6-em)]](https://www.rsc.org/images/entities/char_2009.gif) 1) + 2% co-polyimide are 32.2 and 1.7 Barrer, respectively. The CO2 permeability was generally increased with increasing amino-functionalized MIL-53 loading (ϕd), whereas for CH4 gas, the permeability does not follow a particular trend. Then, in this section, only CO2 permeation data will be used in model estimation.
1) + 2% co-polyimide are 32.2 and 1.7 Barrer, respectively. The CO2 permeability was generally increased with increasing amino-functionalized MIL-53 loading (ϕd), whereas for CH4 gas, the permeability does not follow a particular trend. Then, in this section, only CO2 permeation data will be used in model estimation.

![[thin space (1/6-em)]](https://www.rsc.org/images/entities/char_2009.gif) :
:![[thin space (1/6-em)]](https://www.rsc.org/images/entities/char_2009.gif) 1) cross-linked with 2% APTMDS polymers.
1) cross-linked with 2% APTMDS polymers.![[thin space (1/6-em)]](https://www.rsc.org/images/entities/char_2009.gif) :
:![[thin space (1/6-em)]](https://www.rsc.org/images/entities/char_2009.gif) 1) and (1
1) and (1![[thin space (1/6-em)]](https://www.rsc.org/images/entities/char_2009.gif) :
:![[thin space (1/6-em)]](https://www.rsc.org/images/entities/char_2009.gif) 4)) and one cross-linked co-polyimide (6FOD(11) + 2% agent cross-linking APTMDS) was performed. The cross-linked co-polyimide showed excellent adhesion with the NH2-MIL-53(Al) particles in MMMs. The cross-linking agent also acts as a compatibilizing agent to improve coherence between the two phases. For this reason, high MOF filler loading (up to 35 wt%) were possible due to hydrogen bonding interaction between the MOF particles and the polymer matrix. MMMs containing 30 wt% of NH2-MIL-53(Al) particles displayed relatively high both CO2 permeability and ideal selectivity. Interestingly, the MMMs made from such “breathing” MOF particles and co-polyimides have shown stable CO2/CH4 separation factor under increasing pressure. This is a significant property for industrial application.
4)) and one cross-linked co-polyimide (6FOD(11) + 2% agent cross-linking APTMDS) was performed. The cross-linked co-polyimide showed excellent adhesion with the NH2-MIL-53(Al) particles in MMMs. The cross-linking agent also acts as a compatibilizing agent to improve coherence between the two phases. For this reason, high MOF filler loading (up to 35 wt%) were possible due to hydrogen bonding interaction between the MOF particles and the polymer matrix. MMMs containing 30 wt% of NH2-MIL-53(Al) particles displayed relatively high both CO2 permeability and ideal selectivity. Interestingly, the MMMs made from such “breathing” MOF particles and co-polyimides have shown stable CO2/CH4 separation factor under increasing pressure. This is a significant property for industrial application.
![[thin space (1/6-em)]](https://www.rsc.org/images/entities/char_2009.gif) :
:![[thin space (1/6-em)]](https://www.rsc.org/images/entities/char_2009.gif) 1) cross-linked with 2% APTMDS co-polyimide. The improvement in both permeability and ideal selectivity values of co-polyimide-NH2-MIL-53(Al) MMMs, combined with the satisfactory mechanical properties, even at high MOF loading (up to 35 wt%), gives these MMMs a promising potential in gas-mixture separation application at industrial scale.
1) cross-linked with 2% APTMDS co-polyimide. The improvement in both permeability and ideal selectivity values of co-polyimide-NH2-MIL-53(Al) MMMs, combined with the satisfactory mechanical properties, even at high MOF loading (up to 35 wt%), gives these MMMs a promising potential in gas-mixture separation application at industrial scale.