
 Open Access Article
 This Open Access Article is licensed under a
 Creative Commons Attribution 3.0 Unported Licence
Complementary X-ray and neutron imaging of water electrolysers for green hydrogen production
Sebastian J.
Altus
 ,
Beverley J.
Inkson
and
Jennifer
Hack
*
,
Beverley J.
Inkson
and
Jennifer
Hack
*
Department of Materials Science and Engineering, University of Sheffield, Sheffield, S10 2TN, UK. E-mail: j.hack@sheffield.ac.uk
First published on 6th August 2024
Abstract
With the growing interest in green hydrogen as an energy vector, advances in all types of electrolysers are urgently needed. Imaging methods utilising X-rays and neutrons are seen as highly complementary techniques for visualising, analysing and quantifying the properties of electrolysers, whose materials and operational processes span multiple length and timescales. In this perspective, we first outline four key challenge areas for all electrolyser technologies: using less, using alternative materials, increasing durability and recycling, and introduce the various materials (and their corresponding feature sizes and relevant imaging methods) found in the components of the four main electrolyser types anion exchange membrane (AEM), polymer electrolyte membrane (PEM), alkaline water electrolyser (AWE) and solid oxide electrolyser cell (SOEC). After introducing key relevant concepts for X-ray and neutron imaging, we present a detailed summary of the use of these techniques for the imaging of electrolyser technologies. As highlighted throughout the review, these two methods, when used in a complementary manner, are able to capture the full breadth of complex, multiscale, multiphase materials and dynamics that occur in electrolyser technologies. Finally, we give our perspective on the areas we foresee as being highly important for future complementary, multiscale studies of electrolyser materials. By harnessing the power of both imaging methods together, we can ensure the accelerated discovery and optimisation of the next generation of electrolyser technologies, ensuring a stable and reliable supply of green hydrogen in the coming decades and beyond.
 Sebastian J. Altus | Dr Seb Altus is a research associate at the University of Sheffield where he obtained his PhD in Material Science and Engineering. His research targeted the development of novel ceramic solid electrolytes and mixed conductors for all-solid-state batteries. In his current role he is focused on the development of novel cathode electrodes for Li-ion batteries. He has experience in a range X-ray and electrochemical characterisation techniques and has a deep interest in materials for energy storage and production. |
 Beverley J. Inkson | Professor Beverley Inkson is Professor of Nanostructured Materials at The University of Sheffield. Her research advances understanding of nanomechanical, functional and structural properties of advanced ceramics and nanocomposites, with concurrent development of advanced microscopy and in situ methodologies. Her current focus is on battery and in situ tribology science, and is author of over 160 scientific articles. |
 Jennifer Hack | Dr Jennifer Hack is a Royal Academy of Engineering Research Fellow in the Department of Materials Science and Engineering at the University of Sheffield. She joined the department in September 2023 and her research focuses on optimising design and manufacture of electrolyser components, as well as development and utilisation of X-ray and neutron imaging techniques for studying electrochemical devices, including electrolysers and batteries. Prior to joining Sheffield, Jennifer completed her PhD in fuel cell characterisation at UCL, followed by an EPSRC Doctoral Prize Fellowship working on Zn–air batteries, then a Project Lead role on the Faraday Institution LiSTAR project. |
1 Introduction
1.1 The importance of green hydrogen
Hydrogen is expected to become one of the key energy vectors for achieving net-zero carbon emissions and global production of hydrogen is forecast to rapidly increase by 2050, with the International Renewable Energy Agency (IRENA) forecasting that hydrogen will contribute to 12% of global energy demand1 in scenarios limiting global warming to under 1.5 °C in 2050. Hydrogen as an energy vector offers flexibility, high energy-density and holds promise for decarbonising traditionally hard-to-decarbonise sectors, such as industry (e.g. steel and chemical industries),2 heavy duty transport3 and long-duration energy storage.4 To realise these ambitious scale-up targets, new policy incentives are becoming increasingly important for ensuring that the supply of hydrogen can meet the demands of these sectors in the coming years and decades.51.2 Electrolysers as a key technology for enabling scale-up by 2050
In order to achieve significant expansion in hydrogen usage, technologies for producing hydrogen require rapid scale-up. Since hydrogen does not exist naturally in molecular form, it must be produced industrially via a number of viable processes, with varying levels of emissions. These have been classified by a colour system, where the ‘colour’ of hydrogen refers to the associated emissions of the production process. Currently almost all globally produced hydrogen is ‘grey’ hydrogen, which is produced from steam-methane reforming (SMR) of natural gas.6 To reduce the emissions of the process, ‘blue’ hydrogen is being proposed as a greener alternative, in which the carbon dioxide produced via SMR is captured with carbon capture and storage (CCS) technology.7 ‘Green’ hydrogen, produced from electrolysis using electricity generated from renewable sources, like wind or solar, is the greenest form of hydrogen production, with no carbon emissions at point of production. By 2050, green hydrogen is expected to be the dominant type of hydrogen produced to ensure that carbon-reduction targets can be met.8Electrolysers are not a new technology. Hydrogen production using electricity was first reported during the late 18th century, with the first electrolysers demonstrated from around 1890 onwards.9 However, with the recent commitments by countries across the globe to include hydrogen in the path to net-zero, it is critical that understanding and innovation of electrolyser technologies is accelerated to ensure the hydrogen roadmap can be achieved on a global scale.
1.3 Bottlenecks in scale-up: challenges for electrolyser materials
To meet the growing demand for hydrogen, scale-up of electrolysers needs to be from the current ∼700 MW global capacity of today to between 4–5 TW capacity in 2050, as forecast by IRENA.1 This will involve significant materials innovation, in terms of both the materials used and the manufacturing methods used to produce electrolysers at-scale. As an example, polymer electrolyte membrane (PEM) electrolysers rely on iridium catalysts at the anode, and only 7–8 tonnes of iridium is mined globally per year.10 Thus, to ensure stable supply chains of materials for all electrolyser technologies, there are a number of opportunities for electrolyser materials research. Four of the key avenues for electrolyser research can be identified (Fig. 1), which all focus on ensuring a reliable and sustainable supply of the key constituent materials in all electrolyser types well into 2050 and beyond. These are: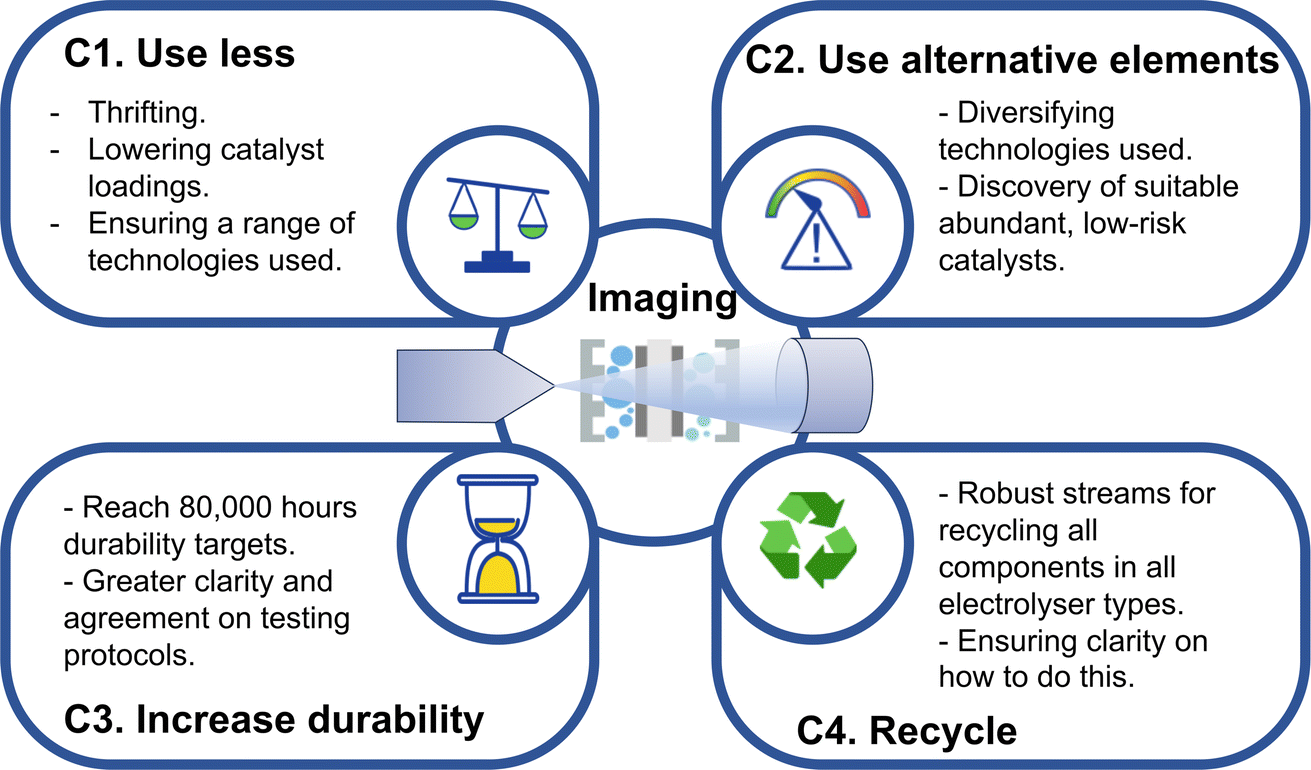 | ||
| Fig. 1 Schematic showing the four key avenues for future electrolyser research, including using less of the existing materials, using alternative elements by using a mix of technologies and discovering new materials, increasing durability to reduce lifetime costs and recycling of components to reuse what we already have available. Underpinning all of these materials discovery is the use of imaging techniques, the focus of this perspective, which can help accelerate this materials discovery process across the four areas. | ||
(C1) Use less. This can be done by reducing catalyst loadings,10 for example reducing total PGM content in PEM electrolysers to meet the US Department of Energy (DoE) targets of 0.125 mg cm−2,11 or by ensuring a mix of technologies is implemented and scaled up, utilising a wider range of available materials and alleviating the pressure on just one or two key elements.
(C2) Use alternative elements, by finding solutions to reduce or replace the amount of precious metal elements used in the various technologies, or diversifying the use of electrolyser types that use abundant metals.12
(C3) Increase durability and extend lifetimes of electrolysers, for example to the 80![[thin space (1/6-em)]](https://www.rsc.org/images/entities/char_2009.gif) 000 h DoE targets for PEM electrolysers11 and high-temperature solid oxide electrolyser cells (SOECs).13 This will reduce lifetime costs of the technology, as well as reducing lifetime materials usage and making available materials go further.
000 h DoE targets for PEM electrolysers11 and high-temperature solid oxide electrolyser cells (SOECs).13 This will reduce lifetime costs of the technology, as well as reducing lifetime materials usage and making available materials go further.
(C4) Recycle. Recycling of catalysts is possible,10,14,15 but until there is sufficient technology that has reached the end of life, there is less demand for recycling. Nonetheless, preparing the methods and technology for recycling of catalysts and materials from electrolysers now will ensure these processes are in place when current technology needs replacing.
We highlight these four key challenge areas as being critical avenues for research, to ensure secure supply chains well into the next decades as we rapidly scale-up these urgently needed technologies. As will be discussed throughout this perspective, imaging methods across length scales are crucial for understanding and quantifying electrolyser performance (Fig. 1), both for analysing the materials in existing technologies as well as across these four approaches as research in these areas grows. As such, where a study has addressed one of these four challenges, this will be highlighted by reference to the relevant identifier i.e. C1, C2, C3 or C4. There are a number of viable electrolyser technologies, each with a unique set of performance properties and materials characteristics, which could hold promise for various applications. Current electrolyser types are discussed in the following section.
1.4 Electrolyser technologies: comparison of design and constituent materials
Electrolysers are a “multiscale” materials challenge, meaning that every type of electrolyser has a unique set of constituent components and materials, ranging from nanometer-size elecrocatalysts to centimenter/meter-sized bipolar plates found in electrolyser stacks. At each length scale, there is a materials challenge to ensure that the chemistry of all materials is compatible with the (often harsh) operating environment of the electrolyser; electrolysers often run at elevated temperatures, under non-neutral pH conditions, and are subject to voltage cycling/fluctuations over thousands of cycles and hours of operation. The US DoE ultimate targets for lifetime operation are currently for 80000 hours of operation for both PEM electrolysers11 and high temperature electrolysers.13
There are currently four key water electrolyser types, which are summarised in detail in Table 1. These are: anion exchange membrane (AEM), polymer electrolyte membrane (PEM), alkaline water electrolysers (AWE), and solid oxide electrolyser cells (SOEC). The name of the electrolyser type is related to the type of electrolyte at the centre of the electrolyser. Whilst the primary function of all electrolyser types is to use electricity to split water (or other fuels including CO2 in the case of SOEC at high temperatures62), into hydrogen at the cathode and oxygen at the anode, the materials that constitute the anode, cathode and electrolyte vary significantly between electrolyser types. The properties of each electrolyser type are summarised in Table 1, including their key materials characteristics, ions transported, operating temperatures and approximate component thicknesses. Each technology has a unique set of materials challenges, for example, the PEM technology relies on expensive, scarce iridium catalysts, AEMs use anion exchange membranes that lack maturity and durability, AWE technologies are reliable but have poorer current densities than PEM electrolysers, and SOECs have flexibility in terms of reactants/products, but the ceramic materials suffer from fatigue due to the high operating temperatures. For an in-depth review of the various technologies, their status and challenges, the reader is referred to the reviews by Kumar and Lim63 and Salehmin et al.,64 or the detailed technical report from the International Renewable Energy Agency (IRENA).65
| AEM | PEM | AWE | SOEC | |
|---|---|---|---|---|
| Operating temperature/°C | 40–60 | 50–80 | 70–90 | 700–850 |
| Anode (oxygen evolution reaction (OER)) catalyst layer (CL) composition | Nickel or NiFeCo alloys; CuCoOx (ref. 16 and 17) | Iridium oxide (IrOx) nanoparticles;18,19 IrxRuyOz (ref. 20 and 21) | Nickel-coated perforated stainless steel22 Pt/NiAl/NiMo/RuO2 coatings have also been demonstrated23 | Perovskites, commonly LSM;24 La0.58Sr0.4Co0.2Fe0.8O3 (ref. 25); LSC26 |
| Anode CL thickness/μm | 10–15 (ref. 27) | Ultra-low loading: 2–2.5 (ref. 28) standard loading: 6–15 (ref. 21 and 29) | 1000 (mesh), with 1.5 coatings23 | 30–50 (ref. 24 and 25) |
| Cathode (hydrogen evolution reaction (HER)) catalyst layer composition | Nickel; Ni/(CeO2–La2O3)/C (ref. 16) | Platinum on carbon (Pt/C)20 | Nickel-coated perforated stainless steel,22 and/or additional electrocatalysts, for example Ru@Cu-TM30 | Ni-YSZ;25,26 NiFe2O4 (NFO)31 |
| Cathode CL thickness/μm | 10–15 (ref. 27) | ∼6–20 (ref. 19 and 28) | 156 (ref. 22) | 8–70 (ref. 25 and 31) |
| Techniques for imaging CLs | ‘Nanoscale’: X-ray nano-CT;18,32 focused-ion beam scanning electron microscopy (FIB-SEM);18,27,28 SEM;25,27,28,30 transmission electron microscopy (TEM);33 atomic force microscopy (AFM);34 ‘microscale’: X-ray micro-CT35,36 | |||
| Electrolyte materials | Anion exchange membrane, e.g. Aemion+,17,33 plus 0.1–1 M KOH17 | Solid polymer PFSA-based membrane, e.g. Nafion19,29 or Aquivion20 | 5–7 M potassium hydroxide (KOH), plus a diaphragm, e.g. zirconia-based Zirfon22,37 | Yttria-stabilised zirconia (YSZ)25,26 |
| Electrolyte (+separator) thickness/μm | 25–80 (ref. 17, 33, 38 and 39) ultrathin: 9 (ref. 16) | ∼100–150 (ref. 20, 40 and 41) | 200–500 (ref. 37 and 42) | 10–90 (ref. 24 and 25) |
| Ion transported | OH− | H+ | OH− | O2− |
| Techniques for imaging electrolytes | X-ray micro-CT; FIB-SEM;33 SEM28,39 | |||
| Porous transport layer (PTL) materials | Nickel foam (anode); Ni foam or carbon cloth (cathode) | Pt-coated porous titanium (anode); carbon paper/cloth or porous titanium (cathode) | Nickel mesh (anode and cathode) | Nickel mesh or foam (anode) |
| PTL thickness/μm | 1000 (ref. 33)–1400 (ref. 38) anode; 270 cathode;33 220 Ni-felts17 | ∼250–350 (ref. 35 and 43) | 56 (ref. 44)–1000 (ref. 45) | 700–900 (ref. 46) |
| Techniques for imaging PTLs | X-ray micro-CT;35,47–49 X-ray radiography;50,51 neutron radiography52–59 neutron CT | |||
| Bipolar plate materials | Nickel-coated stainless steel (anode and cathode) | Pt-coated titanium (anode); Au-coated titanium (cathode); stainless steel43 | Nickel-coated stainless steel (anode and cathode) | Co-coated stainless steel (cathode) |
| Techniques for imaging bipolar plates/flow fields | X-ray CT; X-ray radiography; neutron radiography;60,61 neutron CT; SEM43 | |||
| Key advantages | Less harsh environment than alkaline electrolyser due to less concentrated KOH | Compact and simple design | Very mature technology | Less sensitive to impurities in reactant feed |
| No noble metals required, so cheaper components | Fast voltage response | Cheap widely available materials | Possibilities for co-electrolysis, e.g. with CO2 | |
| High temperature means favourable reaction kinetics | ||||
| Key disadvantages | Not a mature technology, so lots of innovation required | Expensive materials required to withstand the harsh oxidative operating environment | Lower current density/poorer performance compared with other electrolyser types | More susceptible to degradation and failure, e.g. through cracking, due to high temperatures |
| AEMs have poor stability and are susceptible to more rapid failure | Expensive noble metals, like Ir and Pt, used | Challenges with sealing | ||
| Sensitive to poisoning/contaminants in water reactant stream | Slower time for start-up/shut-down | |||
| Little understanding/validation of lifetime performance and durability at-scale | ||||
Key to the design of all electrolyser types is the fact that the materials within them span multiple length-scales, e.g. from nanometer-sized catalyst particles to cm m−1-sized bipolar plate materials, and work must be done to optimise material chemistry and morphologies to improve performance. These length scales are indicated in Table 1 below each component, along with some suggested methods for imaging the features of interest (FOI) at the relevant length scale. During operating and cycling, the materials in all electrolyser types are susceptible to degradation and failure mechanisms. Given their sandwich-like structure the electrochemistry inside all electrolyser types occurs at the internal interfaces between the various components, which makes characterisation of materials properties a particular challenge. It is highly desirable to have access to imaging and analysis methodologies which do not require dismantling of the electrolyser in order to access these internal interfaces/components. Thus, multi-dimensional computed tomography (CT) imaging methodologies, for example X-ray micro-CT and neutron CT, are a powerful way to characterise the operation and failure of both existing and novel electrolyser materials. The current status and potential future of complementary X-ray and neutron imaging of electrolysers will be discussed in detail in this perspective.
2 X-rays and neutrons as complementary imaging techniques
Electrolysers have unique characteristics, with their constituent materials, component morphology and device performance all inherently linked. Thus, characterisation in multiple forms is key to understanding this relationship and ultimately improving electrolyser materials, performance or lifetime. Imaging is a key tool for gaining a deepened understanding of the morphological properties or changes occurring inside electrolyser materials across length scales. However, the challenge for imaging is that many of the processes inside electrolysers occur at internal interfaces between layers in the membrane electrode assembly (MEA) or elsewhere inside the cell. A key aim is to visualise and analyse materials in situ or under operando conditions, which is not possible with conventional imaging techniques like scanning electron microscopy (SEM). In comparison radiography and tomography using more penetrating X-rays and neutrons are powerful methods for visualising and quantifying electrolyser function under real-world or near-real-world conditions. Furthermore, as shown in Table 1 the materials inside all electrolyser types span multiple length scales, and the physical processes, from electron-conduction to water and gas transport to degradation, span multiple length scales. Thus, complementary imaging techniques that harness the unique characteristics of both X-rays and neutrons ensure that a full picture of electrolyser operation and failure can be achieved. This section will provide a brief introduction to X-ray and neutron imaging and the types of imaging and analysis studies that can be done.2.1 Brief introduction to X-rays and neutrons for imaging
X-rays and neutrons are seen as complementary, non-destructive imaging techniques. X-rays interact strongly with the electrons in the electron shells of atoms66 and X-ray-matter interactions due to the photoelectric effect scales with atomic number and density in the analysed volume. Typically, heavy elements generate significant X-ray absorption, whereas regions of light elements, like hydrogen or carbon, generate comparatively little X-ray absorption and are less easily resolved in X-ray images. Beams of X-rays for imaging are generated either in lab-based sources,67 or in synchrotrons at national facilities.68 Lab-based X-ray sources have lower flux and hence lower temporal resolution than synchrotron facilities,67 however they are generally more accessible as beamtime access is a competitive process.In an X-ray CT instrument, the sample sits between an X-ray source and an X-ray detector (Fig. 2a), with the specific properties of each of these three components varying based on the instrument and X-ray source used. In both lab-based and synchrotron-based X-ray imaging experiments, the sample can generally be moved closer to/further from the X-ray source (to help set the desired geometric magnification and voxel resolution) and can also be rotated at increments or ‘projection angles’ through 360° for tomography. The detector is either fixed or can be moved, and additional optics can be used to improve the optical magnification, which can reduce the voxel size and thus improve spatial resolution. For a full, detailed discussion of the physics and practicalities of carrying out X-ray CT, the reader is referred to the review by Withers et al.66
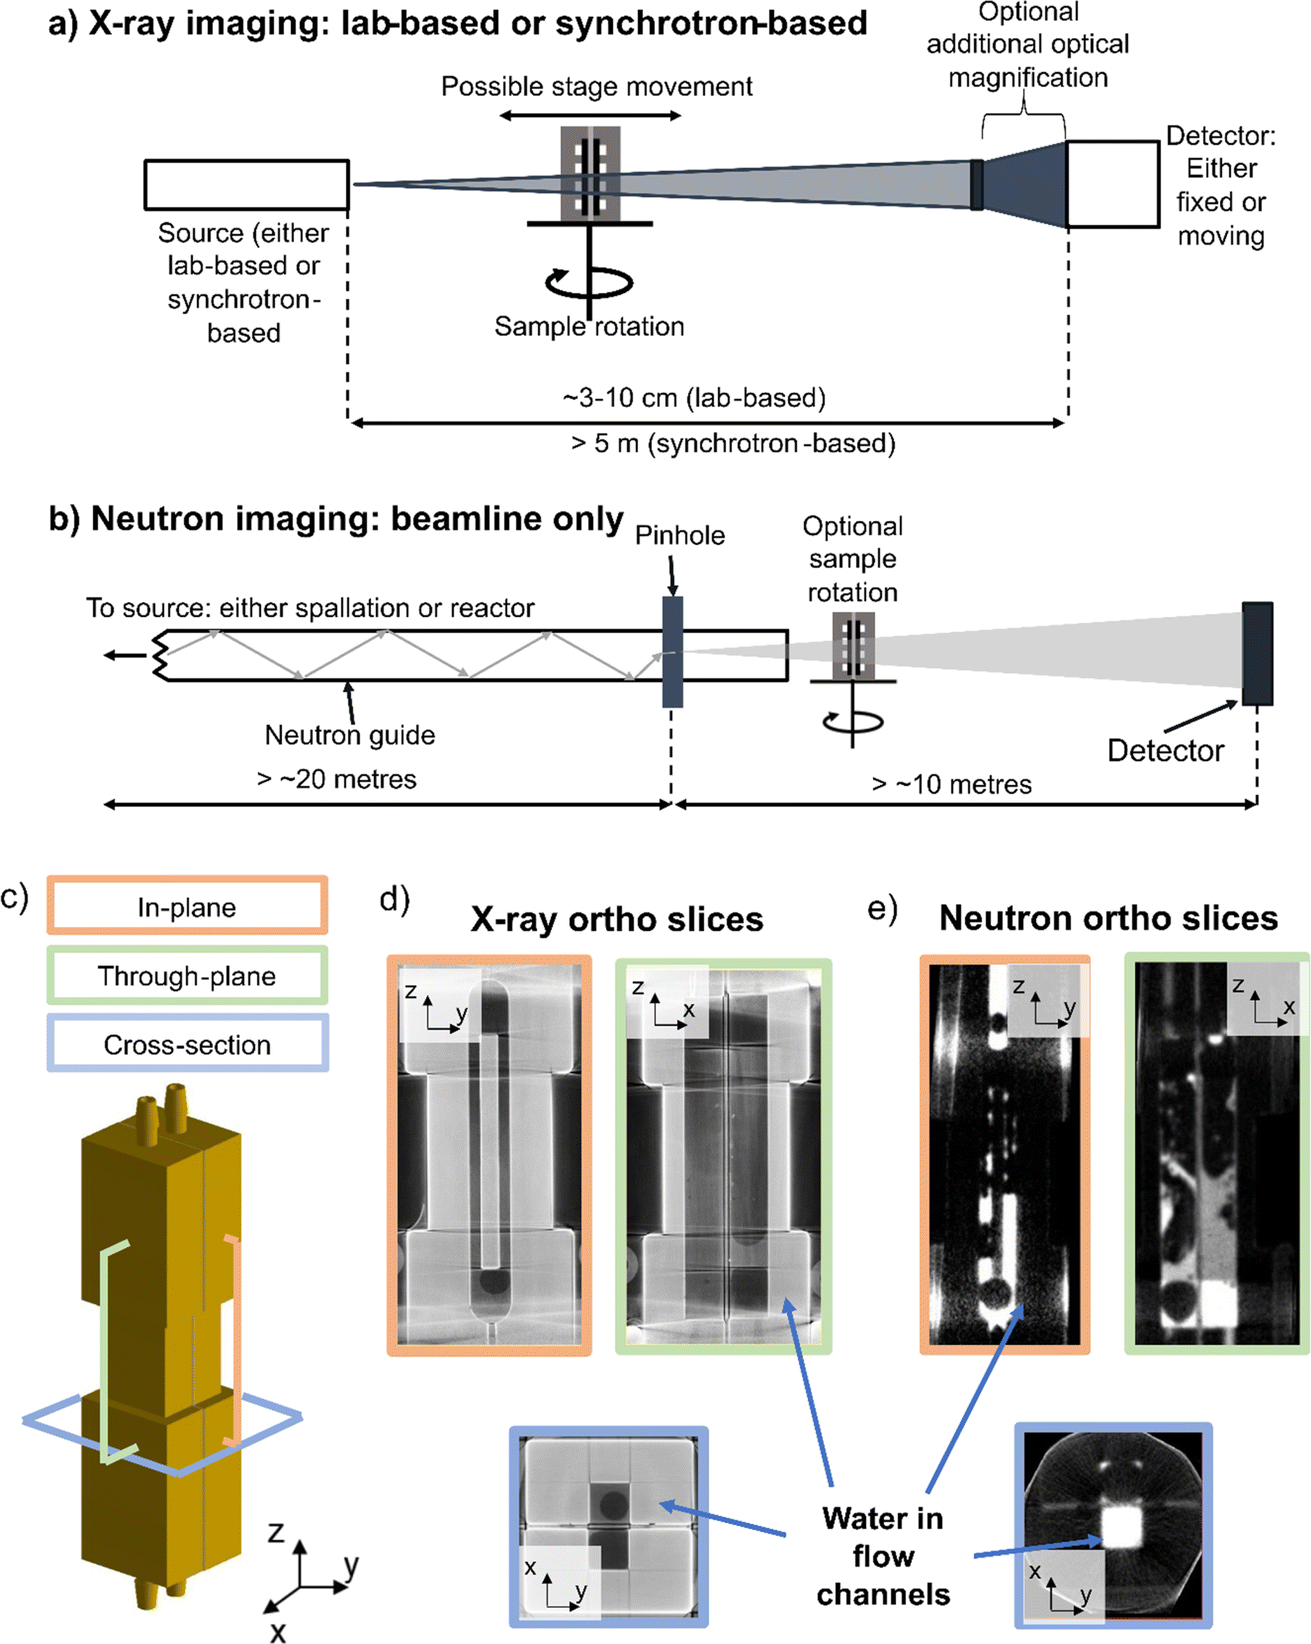 | ||
| Fig. 2 (a) Schematic showing an X-ray imaging set-up, where the source of X-rays is either from a lab-based or synchrotron-based source, the sample sits on a stage that can be moved closer to the source (as required) and can be rotated for 3D imaging. Additional optical magnification can be included to magnify the radiograph thus increasing resolution, and the X-ray detector is an array of pixels which each detect the transmitted X-rays; (b) schematic showing a neutron beamline, where the neutron source is either from a spallation or reactor source and generally transmitted down the beamline via a neutron guide. In the case of neutron tomography, the sample can be rotated, and the detector is generally fixed in position; (c) a cell schematic showing the three ‘orthoslice’ cut-throughs shown in (d and e), where the cell with a single flow channel was filled with some water and capped on either end; in-plane (orange), through-plane (green) and horizontal cross-section (blue) orthoslices for (d) tomogram of the water-filled cell collected with an X-ray source and (e) tomogram of the water-filled cell collected with a neutron source. | ||
The experimental set-up for neutron imaging (Fig. 2b) is largely the same as for X-ray imaging, in that a sample is placed between the neutron source and a detector. However, since there are no lab-based neutron sources, all neutron imaging experiments must be carried out at national facilities. There are two types of neuron facilities available, which generate neutrons in two different ways: spallation sources and reactor sources. In both cases, the neutrons are delivered to the beam through a neutron guide from the source, pass through the sample and the transmitted neutrons are detected by the detector. The sample is mounted on a stage, which can be rotated, either between imaging experiments, for example if a user wanted to carry out a set of through-plane radiography experiments followed by a set of in-plane radiography experiments, or continually during an experiment, in the case of neutron tomography. The time-averaged neutron flux of reactor sources is generally higher than that of spallation sources69,70 which means that high-speed neutron tomography experiments are likely to be more feasible at reactor sources since lower exposure times (number of seconds per radiograph) can be achieved with the continuous neutron beam from the reactor source.70 For a detailed overview of neutron sources and neutron imaging, the reader is referred to the review of Lehmann.71
The interaction of neutrons with matter depends on the interaction of neutrons with the nucleus of the atom. The neutron cross section (in barn, where 1 barn equals 10−24 cm2) does not scale across the periodic table, and instead each element has an inherent neutron cross section, which describes the likelihood of a neutron passing through the atom interacting with the nucleus. Water is particularly well suited to neutron imaging, because hydrogen has a large neutron cross section72 so regions of the sample with water cause strong attenuation of the incident neutron beam.
This effect is highlighted in Fig. 2c–e. Fig. 2c shows a schematic of a simple electrochemical cell (in this case a fuel cell), where the catalyst-coated membrane (CCM) and porous transport layers are sandwiched between two gold-coated aluminium end plates, that have a single flow channel design. The two flow channels were filled with a small amount of water and then sealed. The water-filled cell was imaged using a lab-based X-ray source (Nikon XT H 225) (Fig. 2d) and a neutron source (CONRAD beamline, Helmholtz-Zentrum Berlin (HZB)) (Fig. 2e). Comparing the three ‘orthoslice’ planes (i.e. virtual slice views taken through the reconstructed tomograms), it can be seen how the water residing in the flow channel is difficult to resolve in the X-ray image (Fig. 2d), with several ‘beam-hardening’ streaking effects arising from the high-Z gold coating of the cell. The X-ray attenuation of the water is similar to that of air, resulting in poor contrast between the water and air. In contrast, in the neutron tomogram the water residing in the flow channel has excellent contrast with the aluminium cell, allowing for the water in the channel to be easily resolved. However, it should be noted that the spatial resolution achievable with neutron imaging is poorer than that of X-ray imaging; the Nikon XT 225 instrument used for the X-ray imaging is a ‘macro-CT’ instrument, i.e. a lower spatial resolution X-ray CT instrument, that can achieve voxel resolutions down to ∼3 μm.73 However, by using alternative lab-based sources or synchrotron sources, it is possible to obtain voxel resolutions as low as 50 nm.32 By contrast, a spatial resolution as low as 2 μm has been reported for neutron imaging,74 but requiring a complex set-up. More commonly, neutron imaging can achieve spatial resolutions above 15 μm (ref. 74)–50 μm,75 which is sufficient for imaging water in the >1 mm flow channels, and gas concentration gradients inside electrolyser PTLs, but cannot resolve the internal PTL porosity.
Nonetheless, along with the ability of neutron imaging to effectively resolve water, because of the interaction at the nucleus, neutron imaging can take advantage of isotope effects;76 hydrogen has a large total neutron cross section (82.03 barn (ref. 72)), whereas deuterium has a total cross section that is ∼10 times smaller (7.64 barn (ref. 72)), thus deuterated water, D2O, can be used in place of H2O in neutron studies of electrolysers to distinguish between water in different locations of the cell,60 or for investigating the effect of impurities.77 The advancements in neutron beamline facilities over recent years has meant that the spatial and temporal resolutions achievable for neutron imaging have been continually improving.78 As well as imaging, as with X-rays it is also possible to carry out neutron scattering experiments, for example, to understand local structure/hydration of polymeric membranes.79 A discussion of neutron scattering methods, such as neutron diffraction and spectroscopy, is beyond the scope of this perspective, but are well reviewed by Foglia et al.79
For both X-ray and neutron imaging, it is possible to carry out either radiography, in which the sample remains stationary for the full experiment, or tomography, in which the sample is rotated through defined angles, usually 180° or 360°, and the resulting datasets are reconstructed into a 3D dataset. Because the sample remains static in the incident beam, radiography results in a 2D dataset comprising a 2D array of pixels with defined size mapping the absorption of the beam. Radiography studies on electrolysers are mostly carried out in either a through-plane57 or in-plane80 orientation, with the sample positioned for visualising either the whole flow field or along the plane of the flow channels, respectively. In radiographs, the intensity value of each pixel is representative of the composition of the entire sample along the length of that pixel. In tomography, the resulting 3D dataset comprises of 3D voxels (volume pixels) and tomography experiments capture the entire 3D structure of the sample with each voxel having an intensity value representative of the composition of that particular location in the sample.81
Both X-rays and neutrons have been increasingly widely used for the study of electrochemical devices, including electrolysers, fuel cells and batteries.82–84 With the increasing focus of the research literature towards studying electrolysers, the number of electrolyser studies utilising X-rays and neutrons is increasing. Thus, the purpose of this perspective is to provide the reader with a summary of the currently emerging literature utilising these complementary imaging techniques for studying all electrolyser types, as well as providing a perspective on key avenues for future research.
2.2 From ex situ to in situ and operando imaging: needs for careful cell design
‘Ex situ’, ‘in situ’ and ‘operando’ are three terms commonly used when performing radiography/tomography experiments and can be used to define the nature of the sample environment within the imaging instrument.85 Furthermore, terms such as 3-dimensional (3D) and 4-dimensional (4D) imaging are also used to describe how the experiment has been carried out and the nature of the data generated; 4D is most commonly used when describing a tomography experiment in which 3D tomography datasets are collected alongside one additional dimension, most commonly time. For the purposes of this perspective, we define the terms as the following:Ex situ: the sample is extracted or cut-out of a larger sample volume and imaged, or different samples are scanned to represent the morphology of the feature of interest before and/or during and/or after electrolyser operation, but the samples themselves most likely originate from different electrolysers.
In situ: the sample (either whole or part of an electrolyser) remains within the scanner environment, “on site” or “in place”, and the sample of interest is not removed from the instrument. An external stimulus (e.g. current, water flow, compression temperature etc), is applied to the sample and imaging is carried out at intervals before, during and after application of the stimulus.
Operando: under actual operating conditions, working as the device is intended. All operando measurements are in situ but not all in situ measurements are operando (depending on the operating conditions/stimulus used). Operando measurements are most effective when the temporal resolution is fast (typically mainly during radiography studies), to keep changes in the sample environment between frames to a minimum.
In all three types of tomography experiment (ex situ, in situ, operando), sample preparation and the cell design/environment used to mount the sample is particularly important for ensuring the highest data quality. This means ensuring that the size of the sample is well matched to the spatial resolution achievable with the technique/instrument, and that the materials used for any casing/periphery components do not impede the ability to resolve the feature of interest. For in situ/operando experiments, cell design is of critical importance for achieving the highest quality datasets.
Fig. 3a and b show hypothetical cell schematics for a ‘horizontal’ and ‘vertical’ cell arrangement, respectively. Both cell arrangements have common features, in that the end plate containing the flow field acts to both deliver water to and remove gas from the cell, as well as providing current to the cell and carrying out electrochemical control, and these end plates would be connected to the external circuit. Thus, these end plate flow fields are commonly made of conductive materials, which also have low atomic numbers and are relatively X-ray and neutron transparent, such as aluminium or graphite.50,87 The end plates sandwich the two PTLs and the CCM sits at the centre of the cell. Both designs have advantages and disadvantages for in situ/operando imaging.
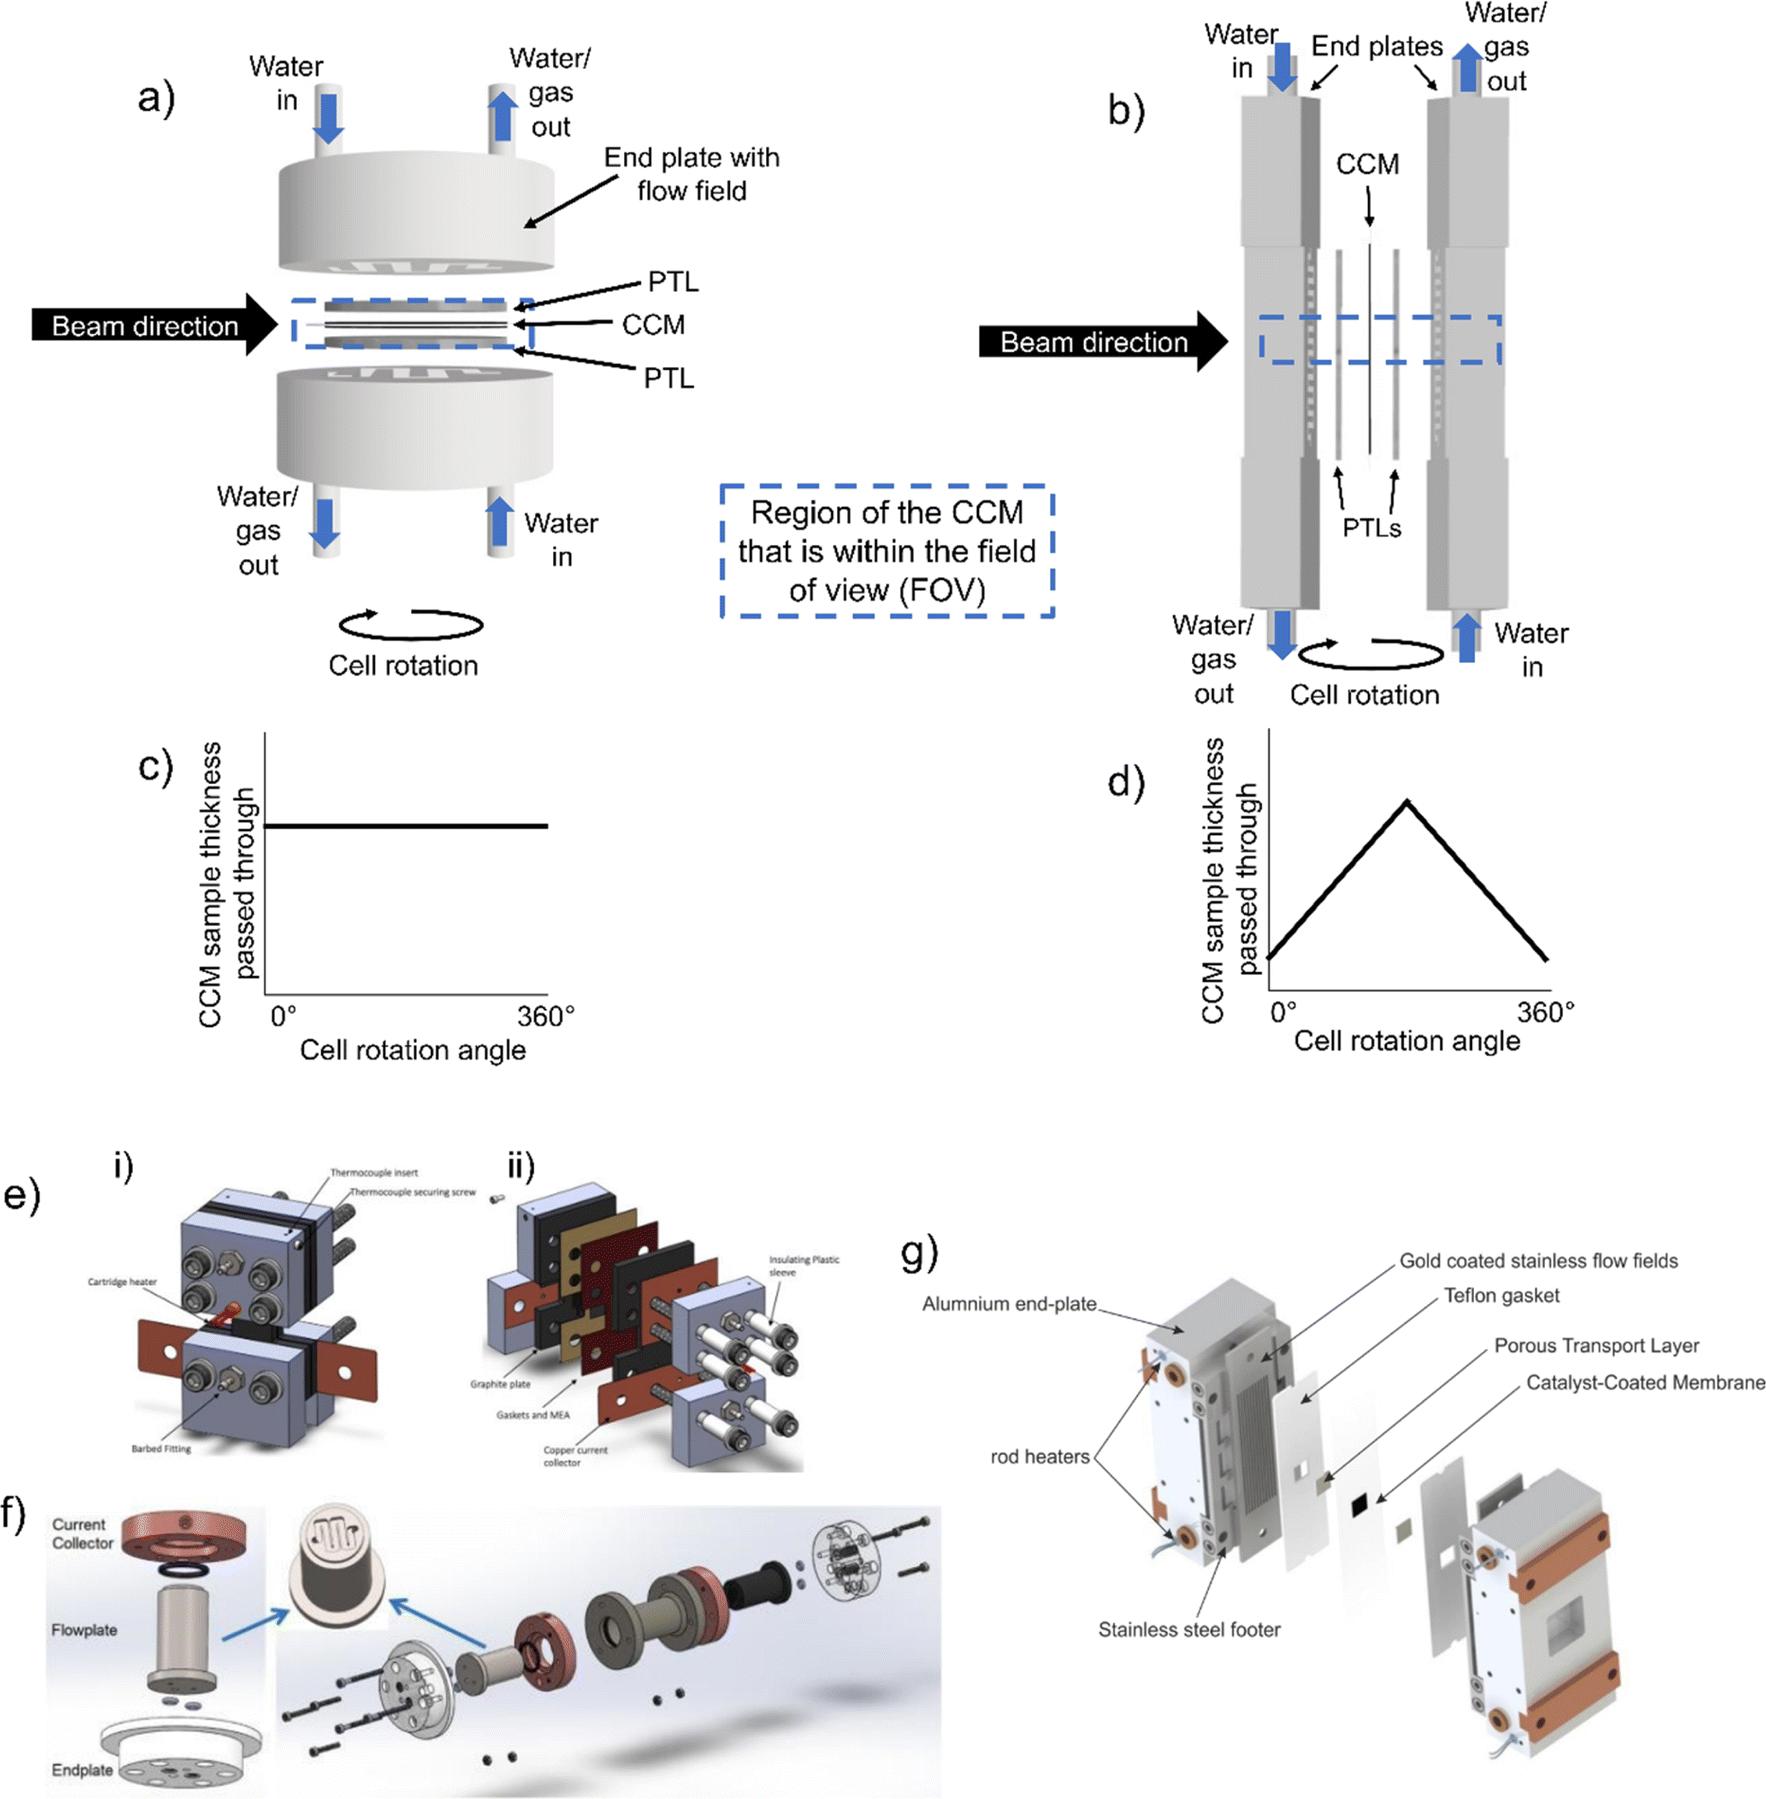 | ||
| Fig. 3 Schematics of an (a) horizontal and (b) vertical cell design, where the end plates contain the flow field, which sandwich the PTLs and the CCMs at the centre. The direction of water flow in and water and/or gas flow out is indicated, along with the direction of the beam and a dashed box representing the region of the CCM that would be within the FOV. The graphs below show the amount of sample material passed through during rotation for (c) the horizontal cell, where the sample thickness is constant throughout and (d) the vertical cell, where the sample thickness increases from a minimum in the through-plane direction (0° and 360°) to a maximum in the in-plane direction (180°). Examples of different electrolyser cell designs for in situ/operando imaging and data collection from (e) X-ray CT experiment with a 1 cm2 CCM area. Adapted with permission from Kulkarni et al.,50 Copyright 2023 American Chemical Society. (f) An 63.6 mm2 cell area for wide/small-angle X-ray scattering (WAXS/SAXS)-CT/(X-ray diffraction (XRD)-CT) experiments. Reprinted from Moss et al.,86 Copyright 2023, with permission from Elsevier; and (g) an example of a cell used for operando neutron imaging with a cell area of 1 cm2. Reprinted under the terms of the Creative Commons Attribution 4.0 International (CC-BY 4.0) license, from Zlobinski et al.,87 Copyright 2021 The Author(s), published on behalf of The Electrochemical Society by IOP Publishing Limited. | ||
In terms of optimum imaging parameters, maintaining a consistent thickness of sample in the beam direction at all angles through 360° is favourable. This is because the transmitted beam intensity remains constant through all projection angles. Thus, the ‘horizontal’ arrangement is more favourable for this, where the sample thickness passed through remains constant at all cell rotation angles (Fig. 3c). As shown in Fig. 3d, in the ‘vertical’ arrangement the sample thickness varies between a minimum value corresponding to the sum of all CCM layers (shown at 0° and 360° in Fig. 3d) when the sample is in the through-plane orientation, and a maximum value when the cell is in the same plane as the beam direction (in-plane, 180° in Fig. 3d) corresponding to the width of the CCM area. This high-aspect ratio can make imaging more challenging due to the higher beam attenuation in the in-plane (higher sample thickness) orientation than in the through-plane (lower sample thickness) orientation.
Conversely, considering the optimum operational conditions, cell design is slightly favoured in the ‘vertical’ arrangement, since compression screws/tie rods and extra cell holder material can be kept outside the imaging field-of-view (FOV) (dashed box in Fig. 3a and b) and provide more straightforward compression and cell sealing, and the sample size can be made larger with some operating regions outside the FOV. Thus, cell design is a balance between these two factors, with slight tendency in the literature to use the ‘vertical’ arrangement, since flux is generally high enough to accommodate the change in transmitted beam intensity in the high aspect ratio samples.
Some example cell designs from literature for electrolyser X-ray50,86 (Fig. 3e and f) and neutron87 (Fig. 3g) experiments are shown in Fig. 3. Another possible addition, as in Fig. 3g, is the use of heaters to provide cell heating. The key difference in the cells shown in Fig. 3 is the orientation of the CCM: the cells from Kulkarni et al.50 and Zlobinski et al.87 have a ‘vertical’ type CCM arrangement (Fig. 3), whereas the cell from Moss et al.86 has a ‘horizontal’ arrangement (Fig. 3). The variation in these literature designs highlight the significant differences between cells used for in situ/operando imaging, particularly in terms of orientation, CCM active area, provision (or not) of heating, and size of the cell casing/end plates. Thus, the performance of these different cells will likely vary as a result of the cell properties themselves, as well as the materials being investigated in the study. There is clearly an opportunity for the community to collaborate on a ‘standard’ design to suit the imaging requirements of different experiments, to ensure better comparison between studies. This is further discussed in Section 5.2.
Given the multiscale nature of electrolyser components and functions discussed previously, not all features of electrolysers will be compatible with each type of radiography or tomography experiment. This particularly emphasises the need for complementary, multi-technique imaging, so that an entire picture of electrolyser materials, operation and degradation can be obtained for all types of electrolysers. The technique chosen for imaging depends on (a) the size of the feature of interest (FOI); and (b) the resolution of the particular technique of interest. These two properties must be suitably matched for imaging to be possible, with the spatial resolution generally around 2–3 times larger than the voxel size88 and represents the smallest possible feature of interest resolvable. For example, X-ray micro-CT has been used to study PEM electrolyser CL morphology with voxel resolution of 1.33 μm and spatial resolution therefore around 5 μm,51 but this method is not able to reveal information about the internal porosity of the CL. Thus, higher resolution X-ray nano CT must be used to study the porous structures within CLs, since the spatial resolution is around 50 nm for nanotomography.32 For neutron imaging, pixel resolutions range from between ∼6–60 μm (ref. 89 and 90) meaning that spatial resolutions are in the region of 20–200 μm.74,75 This means that neutron imaging is well suited to the study of electrolyser flow channels (which are typically ∼1 mm wide), with study of average properties in the PTL (such as gas or water saturation) also possible.56,87,91
With the resolution in mind, the most common types of study conducted on electrolysers using X-rays and/or neutrons are imaging of the catalysts/CLs, imaging the morphology of porous transport layers (PTLs), and imaging water/gas transport through layers. We have indicated the suitability of each tomography/radiography method for imaging these features in Table 2, based on existing studies in the literature discussed within Sections 3 and 4. The traffic light coding of green, amber and red indicates that the feature of interest is well-suited (green), partially-suited under certain conditions (amber), and not well suited (red). The spread of colours in this table particularly emphasises the complementary nature of X-rays and neutrons for imaging electrolysers, and highlights that both types of imaging sources will continue to be invaluable for building up a full picture of electrolyser performance and development, especially within the context of the four key areas for future studies identified in Section 1. The following sections will provide a thorough discussion of the current studies employing X-ray (Section 3) and neutron (Section 4) imaging, before summarising a number of studies combining neutrons with another complementary technique.
| X-ray CT | Neutron CT | X-ray radiography | Neutron radiography | |
|---|---|---|---|---|
| Imaging catalysts |

|

|

|

|
| Porous layers |

|

|

|

|
| Water flow |

|

|

|

|
| Gas transport |

|

|

|

|
3 X-ray imaging of water electrolysers
3.1 Ex situ imaging
X-ray computed tomography (X-ray CT), which is also sometimes referred to as X-ray tomographic microscopy (XTM), is a well-established technique for the imaging and characterisation of electrochemical devices, including lithium-ion batteries (LIBs), polymer electrolyte fuel cells (PEFCs), and solid oxide fuel cells (SOFCs).82,84,92 However, as a tool for the study of water electrolysers it is relatively emergent and not nearly as prevalent. In this section we will be discussing the current literature on ex situ X-ray CT imaging of electrolyser components. The majority of ex situ X-ray CT studies to-date have been on PEM electrolysers, but the type of electrolyser being studied will be identified throughout for clarity.To improve the performance (C1, C3), efficiency (C1, C3) and cost effectiveness (C2, C4) of PEM electrolysers, much of the ex situ research has focused on the investigation and morphological optimisation of one of the most expensive components – the PTL.35,47–49,93–99Ex situ X-ray CT is an accessible, cost-effective and non-destructive method to effectively quantify the PTL morphology. Initial use of X-ray CT for the imaging of the PTL in PEM electrolysers was demonstrated in 2014.100 The study successfully compared the tomographic reconstruction of morphology and calculated transport parameters (C3) of eight PTLs. By varying the PTL morphology, the authors outlined a relation between through-plane thermal conductivity and porosity, as well as through-plane electrical conductivity and water permeability. Fig. 4a shows example tomographic studies of PTLs, including a gradient fibrous mat (Fig. 4a(i)), a 1 mm fibrous mat (Fig. 4a(ii)) and a sintered sample (Fig. 4a(iii)), demonstrating their varied morphology, and the ability of the rendered tomograms to visualise the global and local pore and solid size distribution.
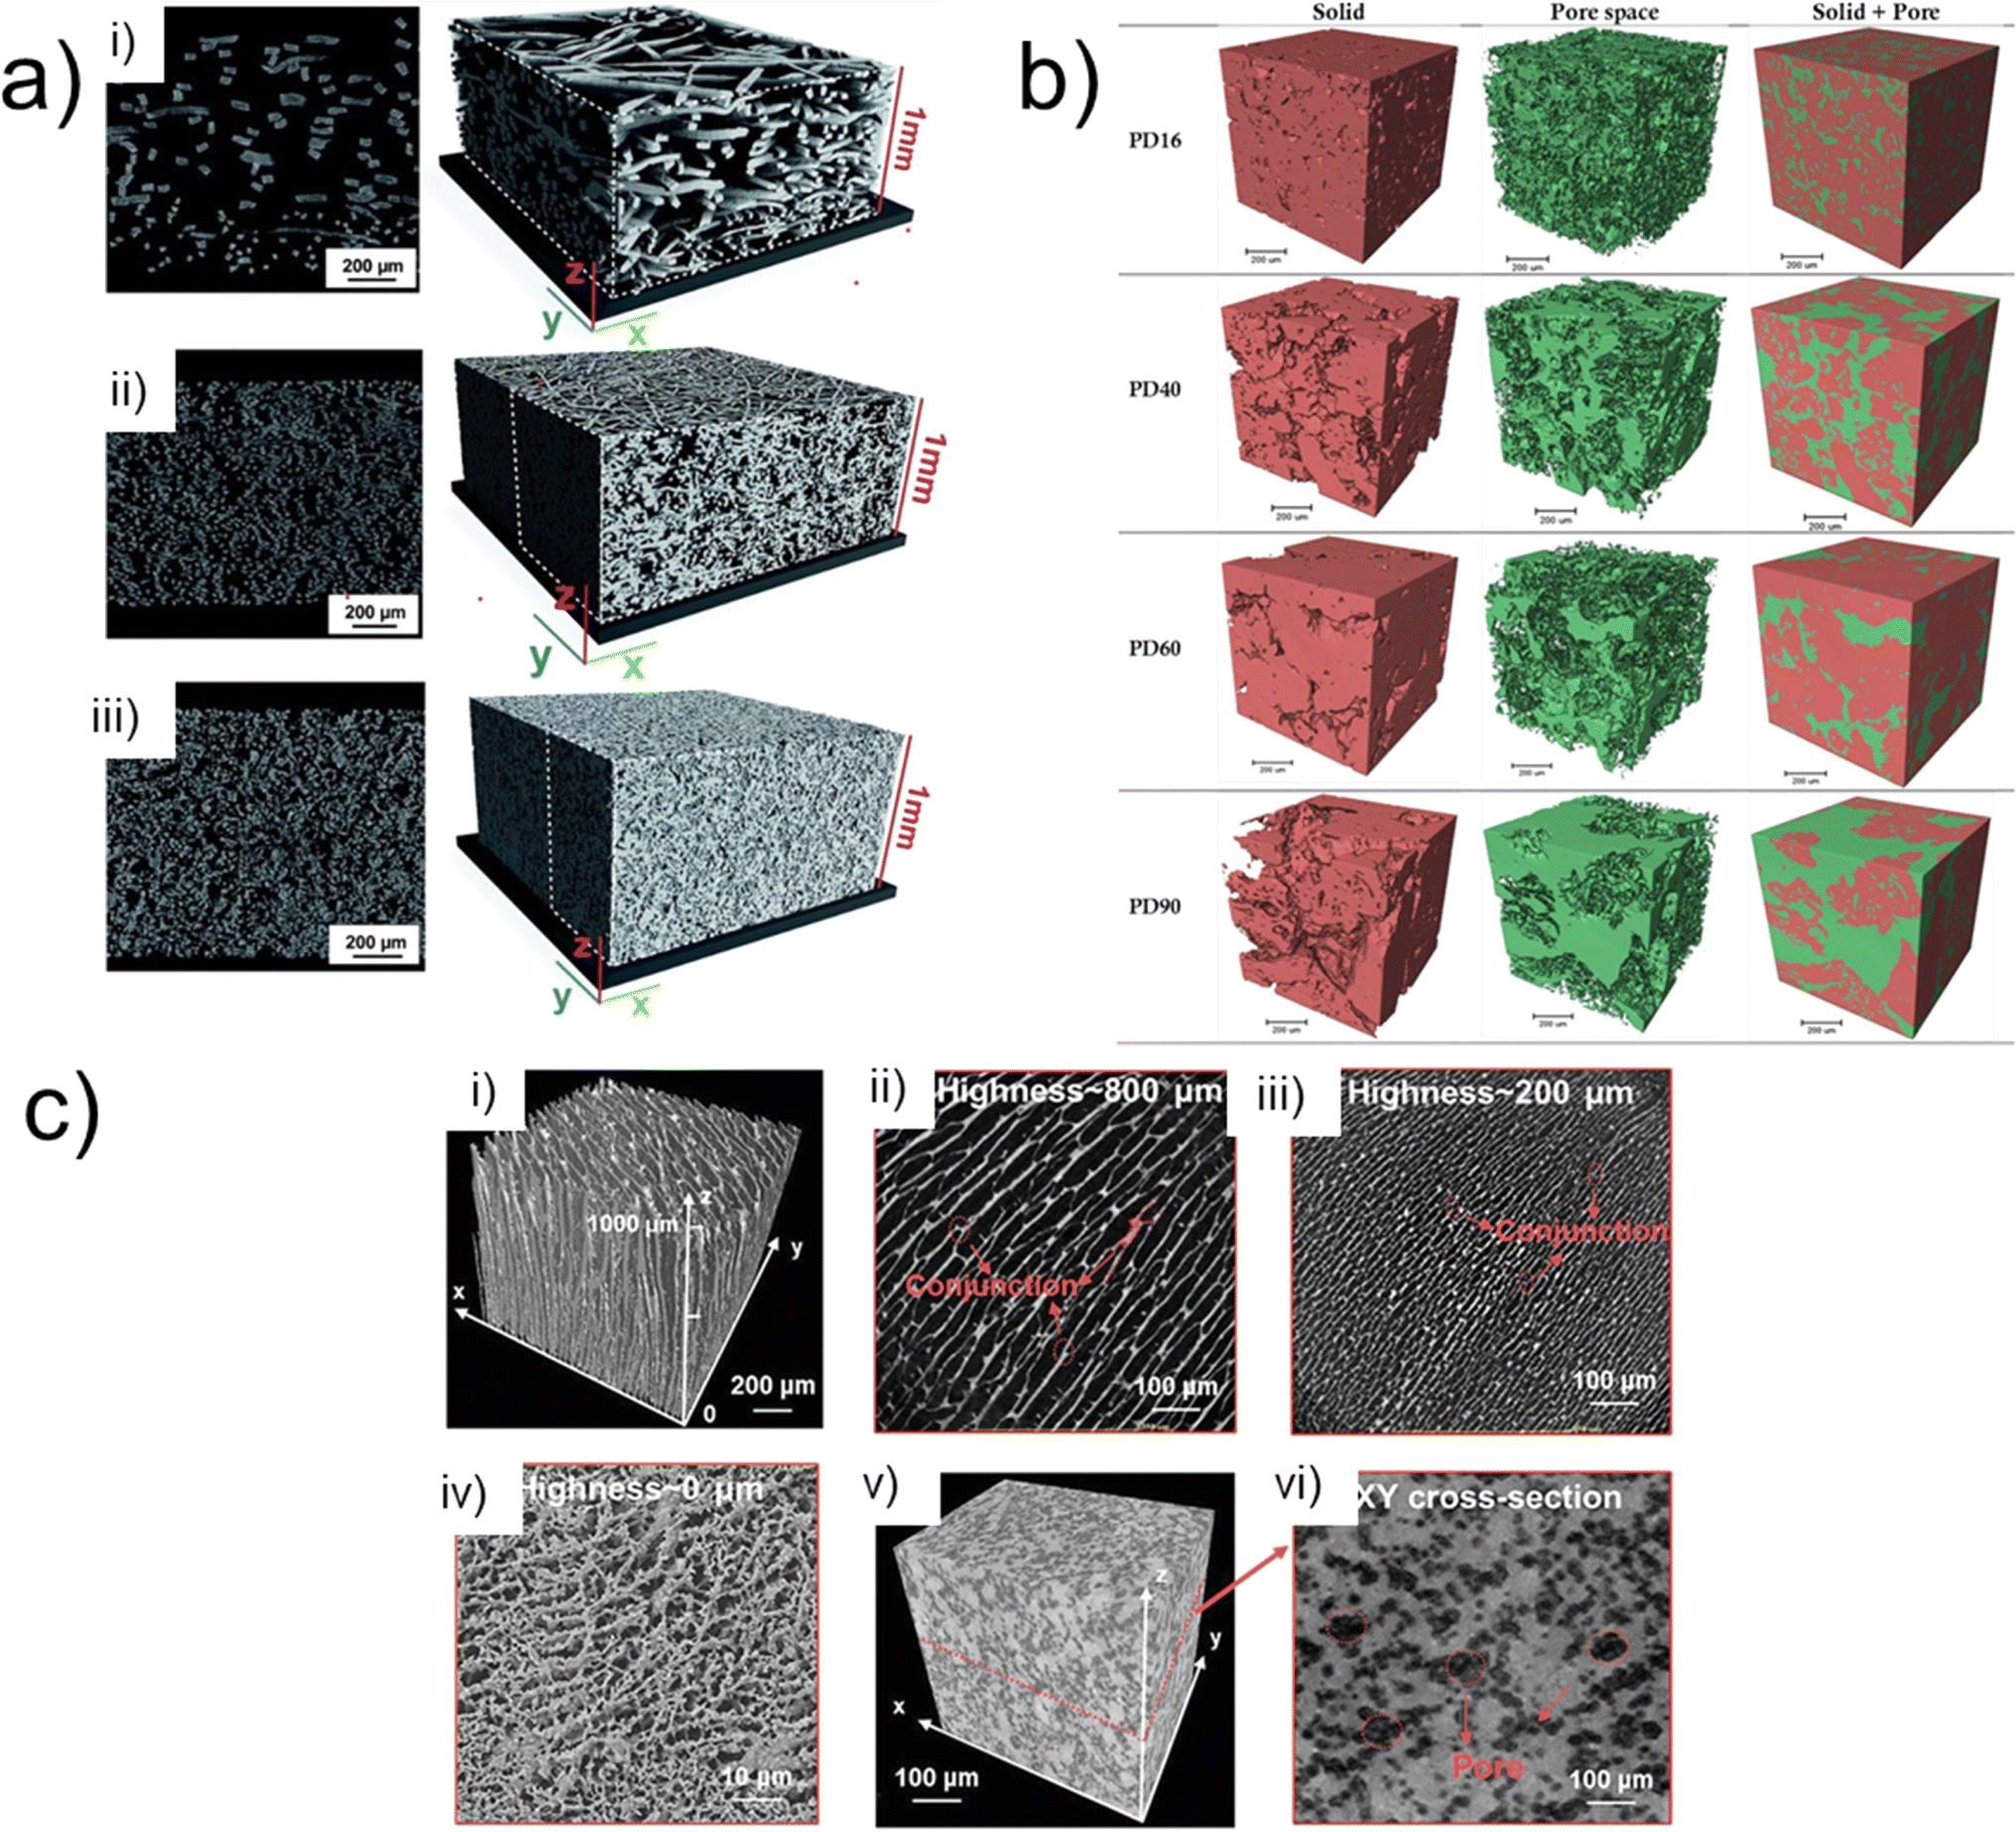 | ||
| Fig. 4 (a) Left: 2D slices through the X-ray reconstructed volume. (Right): Varied three-dimensional geometrical configuration of PTL. (i) Gradient fibrous mat. (ii) 1 mm fibrous mat (iii) sintered sample. Reprinted under the terms of the Creative Commons Attribution 3.0 Unported (CC-BY 3.0) license, from Zielke et al.,100 Copyright 2014 The Author(s), published by the Royal Society of Chemistry; (b) X-ray CT 3D volumes highlighting the various mean pore diameters (16 μm, 40 μm, 60 μm and 90 μm from top to bottom) within the PTL of PEM water electrolyser scale bar is 200 μm. Reprinted from Majasan et al.,97 Copyright 2019, with permission from Elsevier; (c) (i) 3D CT tomographic reconstruction of SOEC micro channel scaffold, (ii–iv) corresponding X–Y cross section at thickness of 800200, and 0 μm respectively. (v) 3D volumetric reconstruction of sponge-like scaffold with (vi) its XY-plane cross section. Reprinted from Cao et al.,26 Copyright 2022, with permission from Wiley-VCH GmbH. | ||
X-ray CT has been used to link PTL morphology to device performance (C3) in a number of studies.47,99,101,102 An example is the work by Majasan et al.,97 who leveraged the technique in the 3D visualisation of the PTL, focusing on the relationship between the microstructure and the subsequent electrochemical performance in a titanium sintered PTL with different pore sizes. The micro sized pore diameters (PD) were varied between average mean sizes of 16 μm, 40 μm, 60 μm, 90 μm (Fig. 4b; PD16, PD40, PD60, and PD90 from top-bottom rows, respectively) and subsequently imaged by X-ray CT. The X-ray tomography coupled with electrochemical measurements revealed a strong correlation between mean pore size and the PTL performance. Smaller pore sizes exhibited lower ohmic resistances albeit higher mass transport resistance at high current densities of 3.0 mA cm−2. Two of the key final conclusions of the study proposed that one, an optimum pore size was ca. 60 μm (PD60), beyond which the advantage of macro-porosity on mass transport is diminished, and two, that the maximum contact points between PTL and the CL is the key aspect in determining the overall performance.
Another example of work correlating microstructure to electrochemical performance is presented in a two-part paper series by Schuler et al.,48,98 who varied the morphological properties of a PTL matrix with two porosities and three fibre diameters, which was compared to a titanium powder sintered material. First, the morphology and topology of PTL structures and post-operando MEAs were investigated by X-ray CT.48 In a similar vein to the previously mentioned studies,97,100 the authors investigated key bulk properties, including porosity, pore and solid size distribution, and fibre orientation, and from this the mass transport properties, such as diffusivity, permeability, and conductivities were determined. The morphological and structural characterisation was then correlated to in-depth electrochemical analysis.98 The inclusion of micro-porous layers (MPLs) has also been recently proposed as a promising avenue for improving PEM electrolyser performance (C3). Mimicking the graded pore structure found in fuel cells,92 MPL-PTLs could help with water and gas transport through the porous structures, aiding in the improvement of performance.47,50,87
Whilst these investigations predominantly focused on the morphological optimisation of PTLs for cell performance, X-ray CT imaging may similarly be used to gain understanding of the effects of the manufacturing (C1) and processing steps of the various cell components.47,95,103 An example includes the work by Lettenmeier et al.,103 where a novel vacuum plasma spraying (VPS) technique was utilised to produce a new type of PTL with a controlled gradient in pore-size and distribution. The study successfully utilised X-ray CT with complimentary mercury intrusion porosimetry (MIP) to quantify the porosity, pore radii distribution, and pore entry distribution of the VPS produced PTL. Analysis revealed an optimal pore diameter in contact with the electrode to be between 6 and 11 μm with a porosity greater than 22%, helping reduce tortuosity, capillary pressure and subsequent mass transport limitations; overall demonstrating comparable performance to sintered Ti-PTL.
As well as the PTL, X-ray imaging is also well suited to studying the morphology of CLs in electrolysers. Bierling et al.93 evaluated the structure and catalyst distribution of a porous transport electrode (PTE) produced via spray coating of IrO2 catalyst ink directly on a titanium fibre PTL (C1, C2). Their work utilised X-ray CT to visualise the catalyst layer morphology, layer thickness and distribution. Analysed results from micro-CT revealed a porosity gradient of the PTE and a mean CL layer thickness around the upper half of the fibres of ca. 1.3 μm. The authors propose that lower surface roughness, lower porosity, and lower mean fibre diameter combined with a downward-flowing ink, are the main responsible factors for the catalyst distributions in PTEs. Combining X-ray CT, cross sectional imaging and traditional electrochemical measurements a model for the deposition process was developed that correlated with tomographic data of catalyst distribution. With an ability to produce high quality tomograms, X-ray CT facilitates an understanding of the intricate interplay between CL, PTL, morphology, structures, and resulting electrochemical performance of the whole electrochemical cell; providing a crucial tool for effective structural optimisation. An example of this effective method has been demonstrated by Schuler et al.47 in enabling the optimisation of a PEM electrolyser that includes a new class of microporous layers PTL (ML-PTL) materials with tailored interfaces for PEWE (C1, C2, C3).
As described in Section 2.2, X-ray microCT has resolution limitations, making it possible to image the general bulk structure of components like CLs, but making it a challenge to visualise their internal pore-structure. As mentioned, the spatial resolution of X-ray nano-CT is well suited for analysing the internal nanostructures within electrolyser electrodes. An example of this is the work by Cao et al.,26 who demonstrated the use of X-ray nano-CT on the anode catalyst of a solid oxide electrolysis cell (SOEC). A La0.6Sr0.4CoO3−δ anode catalyst nano-layer was fabricated on a vertically aligned micro channel scaffold (Fig. 4c(i)). Promoting accelerated oxygen release and improved interfacial strength resulting from an integrated anode-electrolyte interface the subsequent cell achieved a ultra-high current density of 5.96 A cm−2 at 800 °C under the constant operating voltage of 1.3 V. X-ray nanoCT was used to visualise the structure of the micro channelled (MC) scaffold, and the comparison between the MC structure (Fig. 4c(i–iv)) and a more conventional sponge-like structure (Fig. 4c(v and vi)), highlighting the unique anode design of the MC with its vertical arrangement (C2, C3).
Synchrotron X-ray nanoCT was also demonstrated by Lee et al.32 who were able to resolve the internal 3D pore structure of an iridium-based catalyst. Fig. 5a(i) displays the tomographic reconstruction of the catalyst, with an internal cross section, or ‘orthoslice’ shown in Fig. 5a(ii). Factors like the pore and agglomerate diameter (given resolution of individual iridium particles was below the resolution limit) were extracted and quantified (Fig. 5a(iii and iv)), with an average pore diameter of the structure found to be 203 nm with a mean agglomerate diameter of ca. 247 nm. The authors also investigated the effect of varying the ionomer layer thickness, a crucial layer for ensuring good ion conduction and binding of the catalyst layer, by simulating ionomer layers of 30, 60 and 90 nm thickness overlaid on the tomograms. The red, green and blue orthoslices indicated in Fig. 5b represent cross-sections at varying heights through the sample. Analysis indicated that the increase in pore volume occupied within the CL with increasing ionomer content, significantly reduced the effective electrical conductivity and two-phase permeability. Other work employing high-spatial-resolution tomography include the work by De Angelis et al.,104 who performed X-ray ptychographic tomography at cryogenic temperatures to study the multiphase pore structure of a core–shell based CL, with tortuosity and effective conductivity simulations performed on the 3D nanoscale dataset. Overall, these studies display the effective coupling of tomographic reconstruction and computational numerical simulation to help deepen the understanding and characterisation of pore networks and optimise transport properties, effective electrical and protonic conductivity (C1, C3). The use of image-based modelling allows for the extension of understanding and insight into a range of phenomena, including electrodynamics and transport properties exhibited by the system as result of structure and morphology,26,32,49 as well as for the proposal of new microstructures using stochastic methodologies based on properties extracted from imaging datasets.105 This is a field that is expected to continue growing, as the prevalence of machine-learning and artificial intelligence tools for image processing continues to increase.106–108
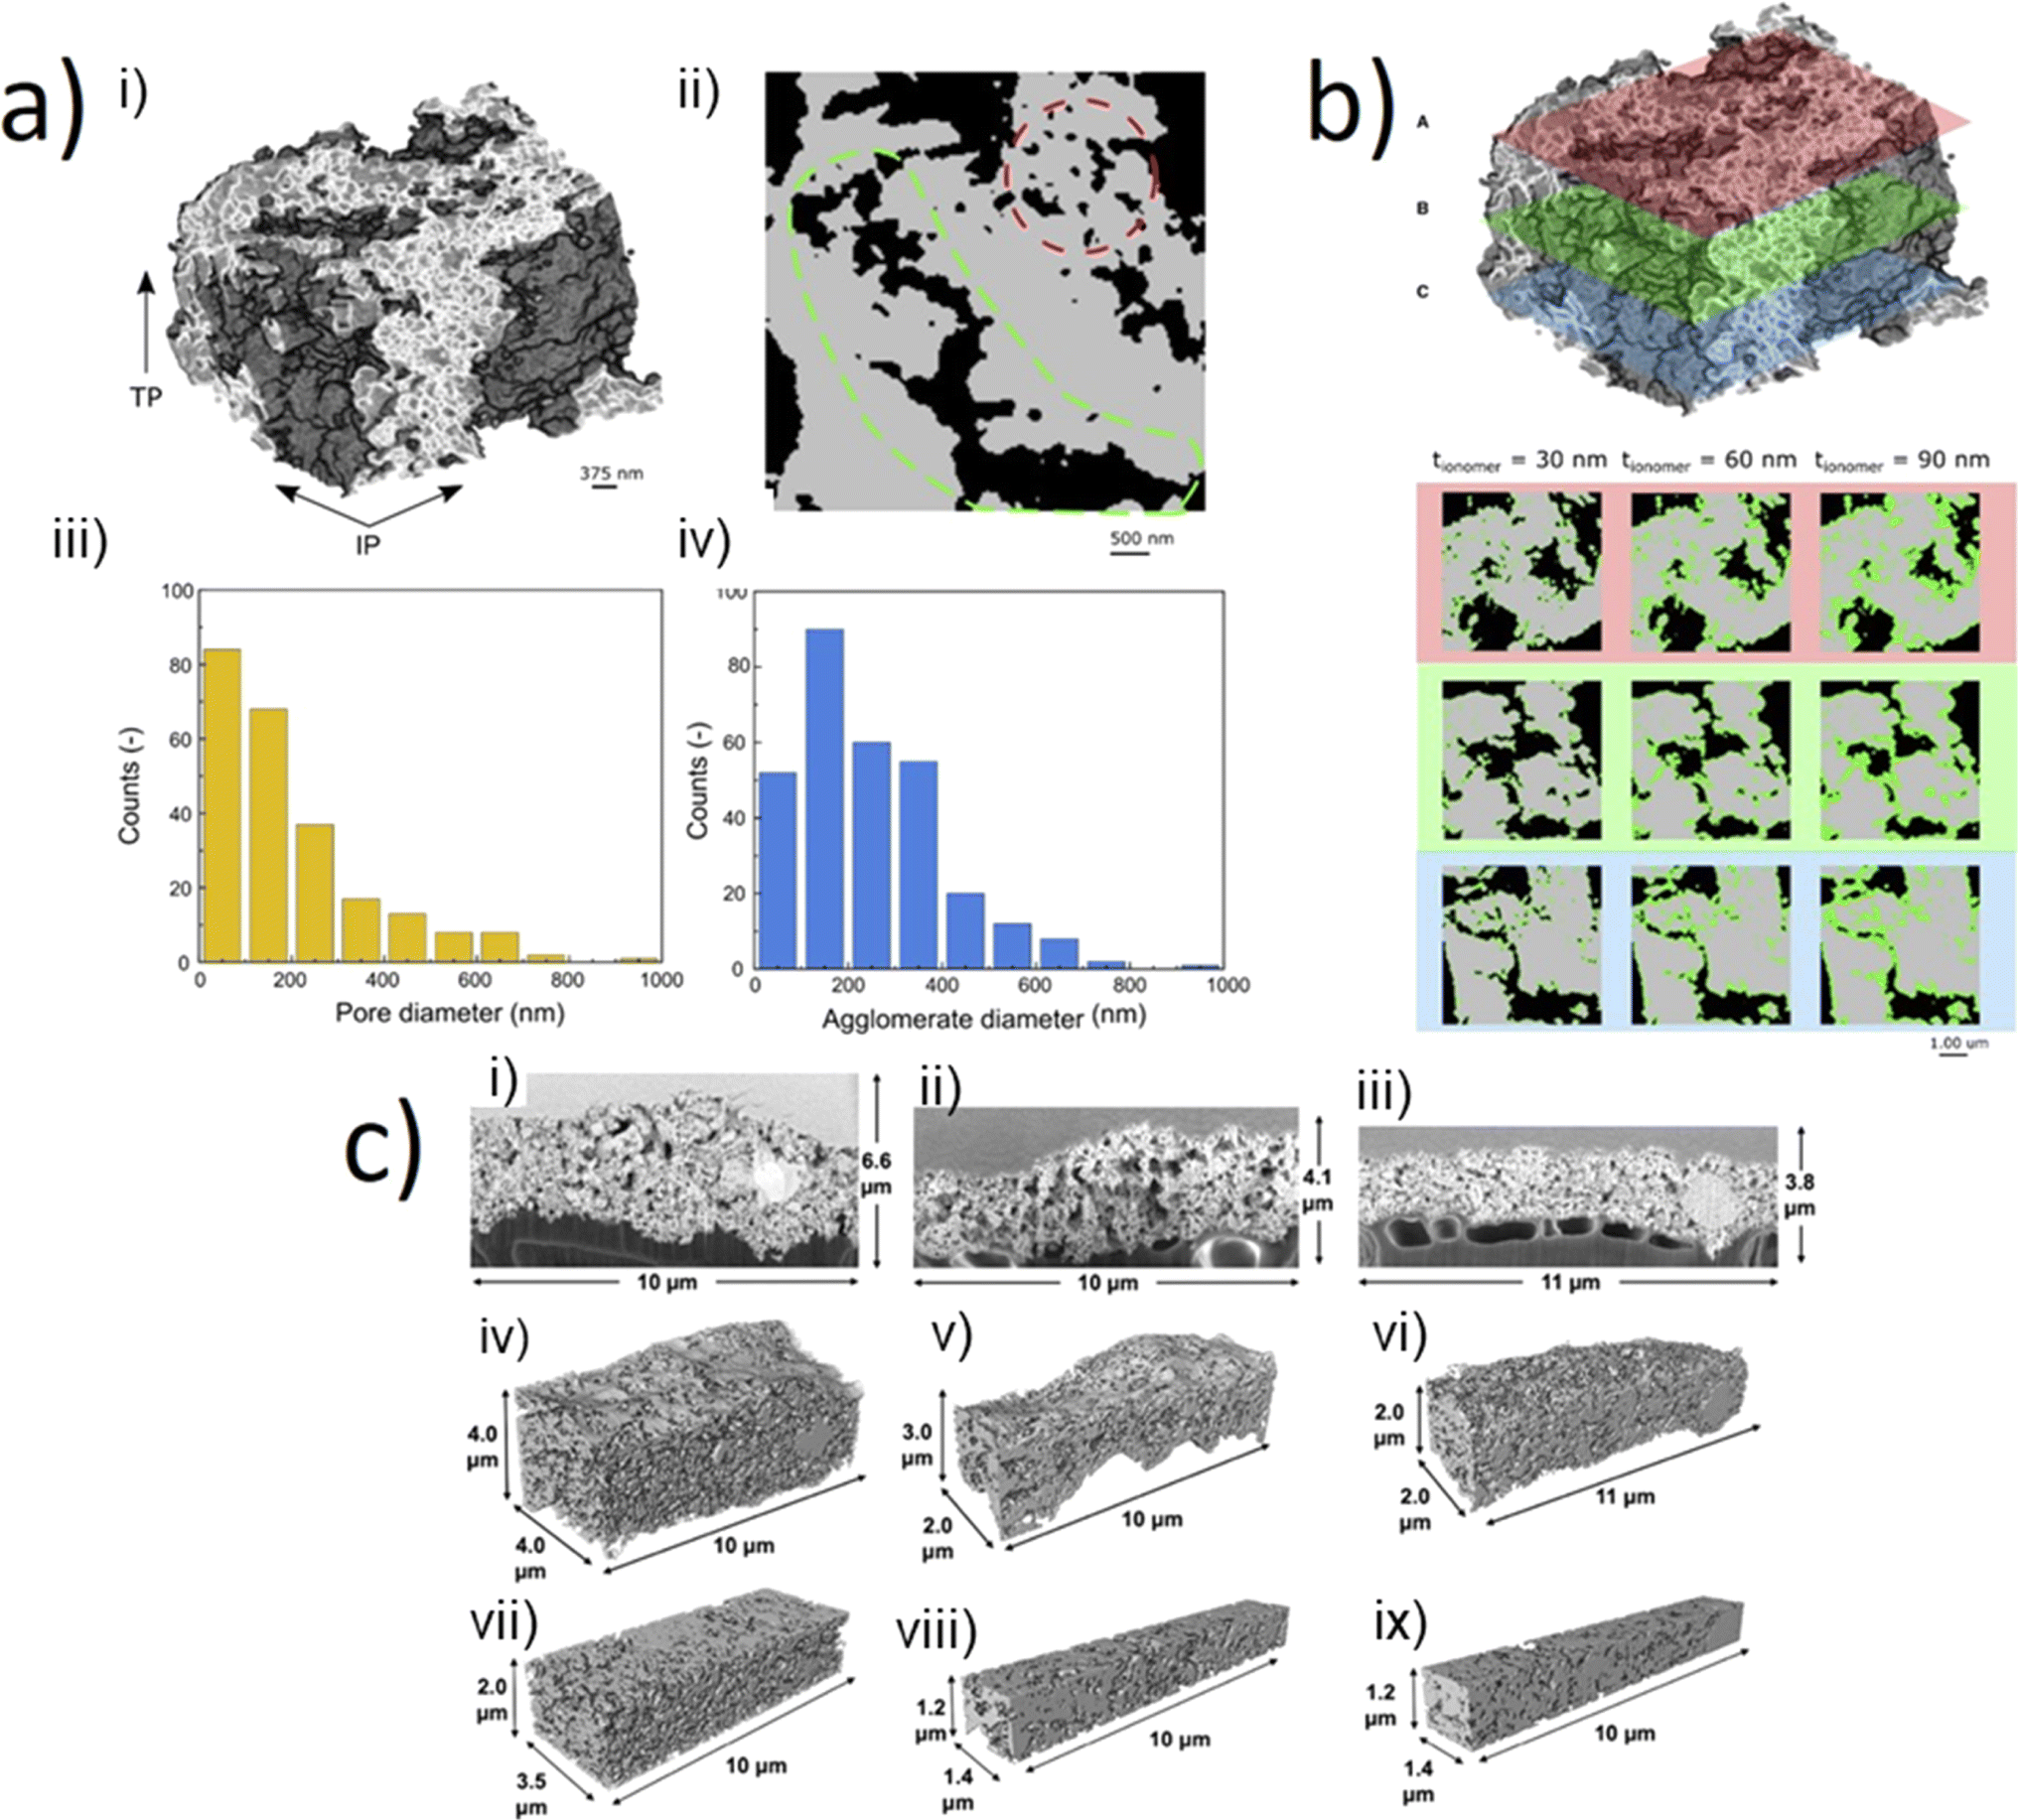 | ||
| Fig. 5 (a) (i) Nano-tomographic reconstruction of iridium-based catalyst for a PEM electrolyser. (ii) Cross sectional image highlighting the range of pore size, extracted slice from tomographic reconstruction. (iii) Pore size distribution & (iv) agglomerate size distribution of the iridium-based catalyst. (b) Numerically added ionomer layer onto nano-tomography at varying thicknesses (30 nm, 60 nm, and 90 nm) shown in a top (red), middle (green) and bottom (blue) region of the sample. Figure (a and b) reprinted from Lee et al.,32 Copyright 2023, with permission from Elsevier. (c) SEM cross-section images of the CL morphologies (i–iii), full segmented volumes (iv–vi), and internal volumes (vii–ix). The images may be grouped by column where (left) is pristine blade-coated, (centre) PTL pore region of tested blade coated, and (right) PTL fibre compressed region of tested blade coated CL. The images highlight the capability of FIB-SEM in rendering a 3D image for microstructural data analysis. Reprinted under the terms of the Creative Commons Attribution 4.0 International (CC-BY 4.0) licence, from Ferner et al.,18 Copyright 2024, The Author(s), published by Elsevier. | ||
A key aspect in X-ray CT measurements is the resolution; as discussed, resolving nm features is challenging and few examples currently successful resolve important internal pore regions to a submicron scale with X-ray nano-CT. However, an alternative method to further increase the resolution of such regions at the nanoscale has been achieved using focused-ion-beam scanning electron microscope (FIB-SEM) tomography;21,109 FIB tomography can resolve electrolyser catalysts with high resolution of 6 nm,22 and can allow for evaluation of ionomer content within electrolyser CLs.21 FIB-SEM can achieve higher spatial resolutions than X-ray nano-CT, allowing for a more precise reconstruction of the sample. An example includes the CL pore structures shown in Fig. 5c, where the pore structures of different regions of a sample could be qualitatively compared demonstrating a range of particles and thicknesses were observed.18 However the destructive nature of the technique owing to the serial sectioning data collection methodology does limit further investigation of samples. Nonetheless, FIB-SEM tomography has potential for complementing microscale studies of electrolyser CL morphologies, especially as novel electrocatalysts for both PEM, AEM and SOEC technologies emerge (C2).
Whilst ex situ X-ray CT has been extensively utilised in the imaging of PTL and CL morphologies for performance optimisation, little work has been conducted imaging mechanical changes arising from operation. Electrolysers operate at elevated temperature, with complex two-phase dynamics of water and gas, which depend on factors like the operating current, speed of water transport and pressure or compression of the cell. All of these factors can lead to mechanical stresses and can influence cell performance. To investigate the effects of the clamping pressure on membrane swelling and the subsequent mechanical interaction between the different layers Hoppe et al.110 utilised X-ray CT to image samples in 2 states (dry and wet), with five different compressive forces between 0.36 and 1.63 MPa. Comparison between the two states revealed that swelling of the CCM resulted in a compensatory decrease in thickness of the PTLs, accompanied by a decrease in PTL porosity. However, the authors were not able to tie a change in PTL porosity to a change in mass transport or any subsequent limitations due to the swelling, highlighting the challenges in relating morphological changes to electrochemical performance, particularly in an ex situ environment (C3).
Ex situ imaging provides a powerful and effective tool in the evaluation of the morphology for a range of PEM device components. The high resolution and careful experimental parameter control can provide 3D imaging with spatial resolutions down to ∼50 nm. However, due to the static nature of the characterisation method, consequential changes in electrochemical properties have to be evaluated serially by separately imaging different samples at different stages of an experiment. As such a clear disadvantage is the lack of characterisation and visualisation of dynamic processes, in situ/operando imaging offers an alternative for the coupling and quantification of these complex transient phenomena within electrolysers.
3.2 In situ/operando imaging
Due to the complexity of all electrolyser types, including the two-phase transport processes, and the multilayered, multiscale materials, key insights into phenomena that involve dynamic processes such as fluid flow, gas evolution and electrocatalyst morphology evolution are often omitted from ex situ X-ray imaging studies. To therefore gain a deeper understanding of dynamic processes and degradation mechanisms occurring under operational conditions in real-time, in situ/operando X-ray imaging techniques must be applied (C3).The use of time-resolved X-ray radiography was initially demonstrated in 2007 by imaging an operating PEM fuel cell to evaluate the evolution and transport of water in the fuel cell flow channel.60 The technique was quickly utilised in several other studies to visualise transport of water through the porous gas diffusion media,111 and water transport from gas diffusion media to the flow channels.94 The first use of in-operando X-ray radiography for electrolysers was demonstrated by Hoeh et al.36 in 2015 (Fig. 6a) where the authors were successful in conducting imaging in both in-plane (Fig. 6a(i–iv)) and through-plane (Fig. 6a(v–vii)) orientations of the gas bubble discharge from the PTL into the flow channels, with a temporal resolution of 5 s and a 2.15 μm pixel size. Analysis of the images successfully determined the bubble formation and discharge periodicity at current densities of 10, 75, and 200 mA cm−2. A drawback of radiography is that resultant radiography images in the through-plane direction are the result of the superposition of all electrolyser components passed through by the X-ray beam in that plane. Thus, as shown by the dashed and solid outlines representing the cathode and anode flow channels, respectively (Fig. 6a(v–vii)), operando radiography experiments often require modification of one of the flow channels to ensure the difference between water/gas species in the anode and cathode can be discerned. Nonetheless, neutron radiography has been widely used for visualising and quantifying gas transport and bubble formation in both PEM electrolysers80,112 and other electrolyser types, such as a direct toluene electro-hydrogenation electrolyser.113
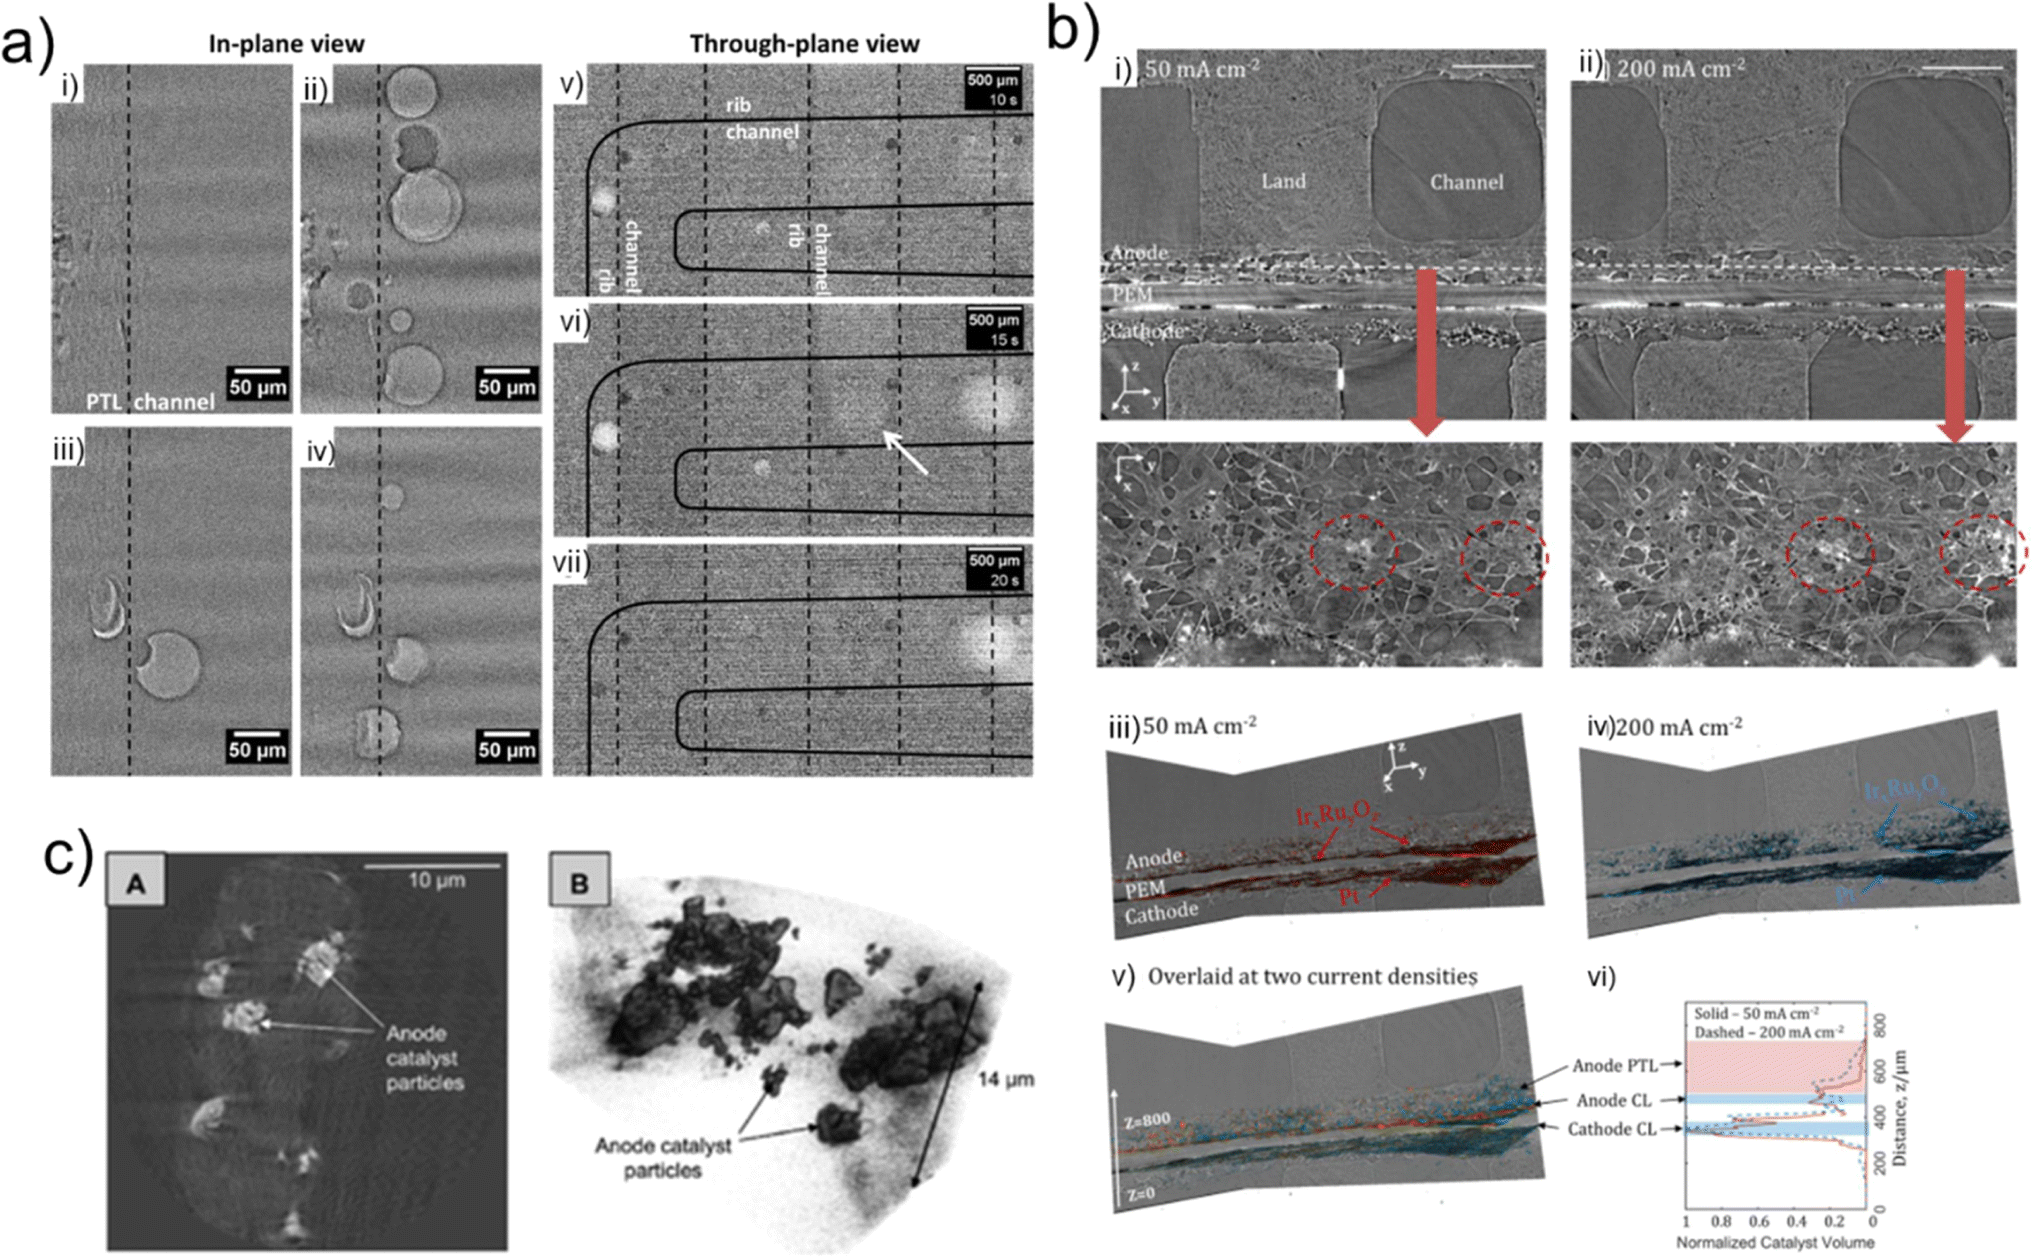 | ||
| Fig. 6 (a) In-plane (left) and through-plane (right) views of the electrolyser, showing bubble evolution in the flow channels using X-ray radiography. Reprinted from Hoeh et al.,36 Copyright 2015, with permission from Elsevier. (b) (i and ii) Orthoslices showing the through-plane (top) and in-plane (bottom) views of the electrolyser for (i) 50 mA cm−2 and (ii) 200 mA cm−2 current holds; volume renderings of the anode and cathode CLs from the (iii) 50 mA cm−2 and (iv) 200 mA cm−2, (v) overlaid view and (vi) graph showing depth of catalyst migration into the PTL. Reprinted from Leonard et al.,51 Copyright 2018, with permission from Elsevier; (c) (Left (A)): tomographic cross-section and (right (B)): volumetric reconstruction of the CCM anode catalyst layer. Nano-CT provides high spatial resolution of the in-plane catalyst particles. Reproduced from Leonard et al.35 | ||
To overcome the morphological imaging constraints imposed by the two-dimensional radiography projection, Leonard et al.51 combined operando X-ray radiography with X-ray computed tomography (Fig. 6b). This enabled the dual study of transport phenomena and degradation in PEM electrolysers at current densities of 50, 100, and 200 mA cm−2. X-ray tomography enabled the three-dimensional morphological quantification, highlighting an increased rate of degradation in the IrxRuyOz catalyst layer on the anode side with increasing current density, as shown in Fig. 6b, where the extent of catalyst migration into the PTL is more significant for the 200 mA cm−2 hold (Fig. 6b(ii and iv)) than for the 50 mA cm−2 hold (Fig. 6b(i and iii)). To understand sub-second oxygen bubble evolution, X-ray radiography with an exposure time per frame of 100 ms was used as a complementary technique. This enabled the transient transport phenomena to be captured as a function of current density. The coupling of the two X-ray imaging techniques demonstrated a complementary approach to the operando visualisation and quantification of morphological degradation and sub-second transient transport phenomena in an operating PEM electrolyser (C3).
The efficacy of operando X-ray tomography has been further demonstrated focusing on the interfacial contact between the transport layers and the catalyst particles of a catalyst-coated membrane (CCM) electrolyser (i.e. one in which the CL is deposited onto the membrane) and a porous transport electrode (PTE) electrolyser (i.e. one in which the CL is deposited onto the PTL).35 Using X-ray radiography and X-ray micro-CT the performance of the two electrolysers were compared at two different current densities of 500 and 800 mA cm−2. The tomography unveiled non-homogenous distribution of IrOx electrocatalysts, such as in the CCM anode shown in Fig. 6c, and similarly radiography displayed oxygen gas transport within the electrolyser (C3). A more recent study by Kulkarni et al.50 displayed a novel image processing technique coupled with operando X-ray microtomography and radiography. The use of stained water illustrated oxygen flow patterns and enabled the quantification of time averaged oxygen saturation in PTLs with varying MPL thicknesses. Based on their findings they were able to propose a set of design considerations for the optimisation of PTL/MPL morphology (C1, C3).
Overall, the complementary combination of operando X-ray CT and X-ray radiography provides a powerful tool kit for the collection of information about component morphology, degradation mechanisms, transient transport phenomena, and oxygen bubble evolution/detachment in electrolysers across length- and time-scales. Further development of complementary operando techniques will enable the effective design and manufacture of the next generation of all electrolyser types, as the four key challenge areas discussed in Section 1 are addressed.
3.3 Adding dimensions beyond X-ray-CT
An alternative approach to 3D tomographic reconstruction based on X-ray attenuation is the use of elastic scattering (diffraction) techniques. X-ray diffraction provides additional data and information about the sample crystallography that cannot be determined using X-ray absorption tomography alone. X-ray diffraction computed tomography (XRD-CT), provides a valuable insight into the material crystallinity, including crystallographic structure, crystallite size, strain, and residual stress. The XRD-CT tomographic reconstructions can provide detailed spatial information about these quantities, with spatial resolutions of 1 μm (ref. 114) and 20 × 20 × 3 μm (ref. 115) having been reported, as well as paired phase/crystallite information. The XRD-CT technique has seen effective use in the characterisation of battery materials providing valuable information on material degradation and phase changes.116,117 As with X-ray absorption CT reconstruction, the XRD-CT technique can be hampered by long scan times and complex experimental set up.The effective application of operando XRD-CT measurements were demonstrated on a complex Ni–Pd/CeO2–ZrO2/Al2O3 catalyst where it was possible to observe the evolution of various phases of interest during the partial oxidation of methane.118 Time and spatially resolved phase distribution maps (Fig. 7a) were produced to reveal the dynamic processes of the catalyst under operating conditions. The authors demonstrated three dimensional spatial tomographic reconstructions coupled with one diffraction dimension and one dimension covering imposed chemical environments, effectively providing a 5D tomographic reconstruction. Although the technique is yet to be implemented in the analysis and imaging of electrolysers, successful application for analysing catalysts and electrode materials within PEFCs119 and SOFCs120 has been demonstrated. Synchrotron XRD-CT may therefore present a useful tool in the characterisation of phase changes of the CL and/or catalysts within electrolyser cells.
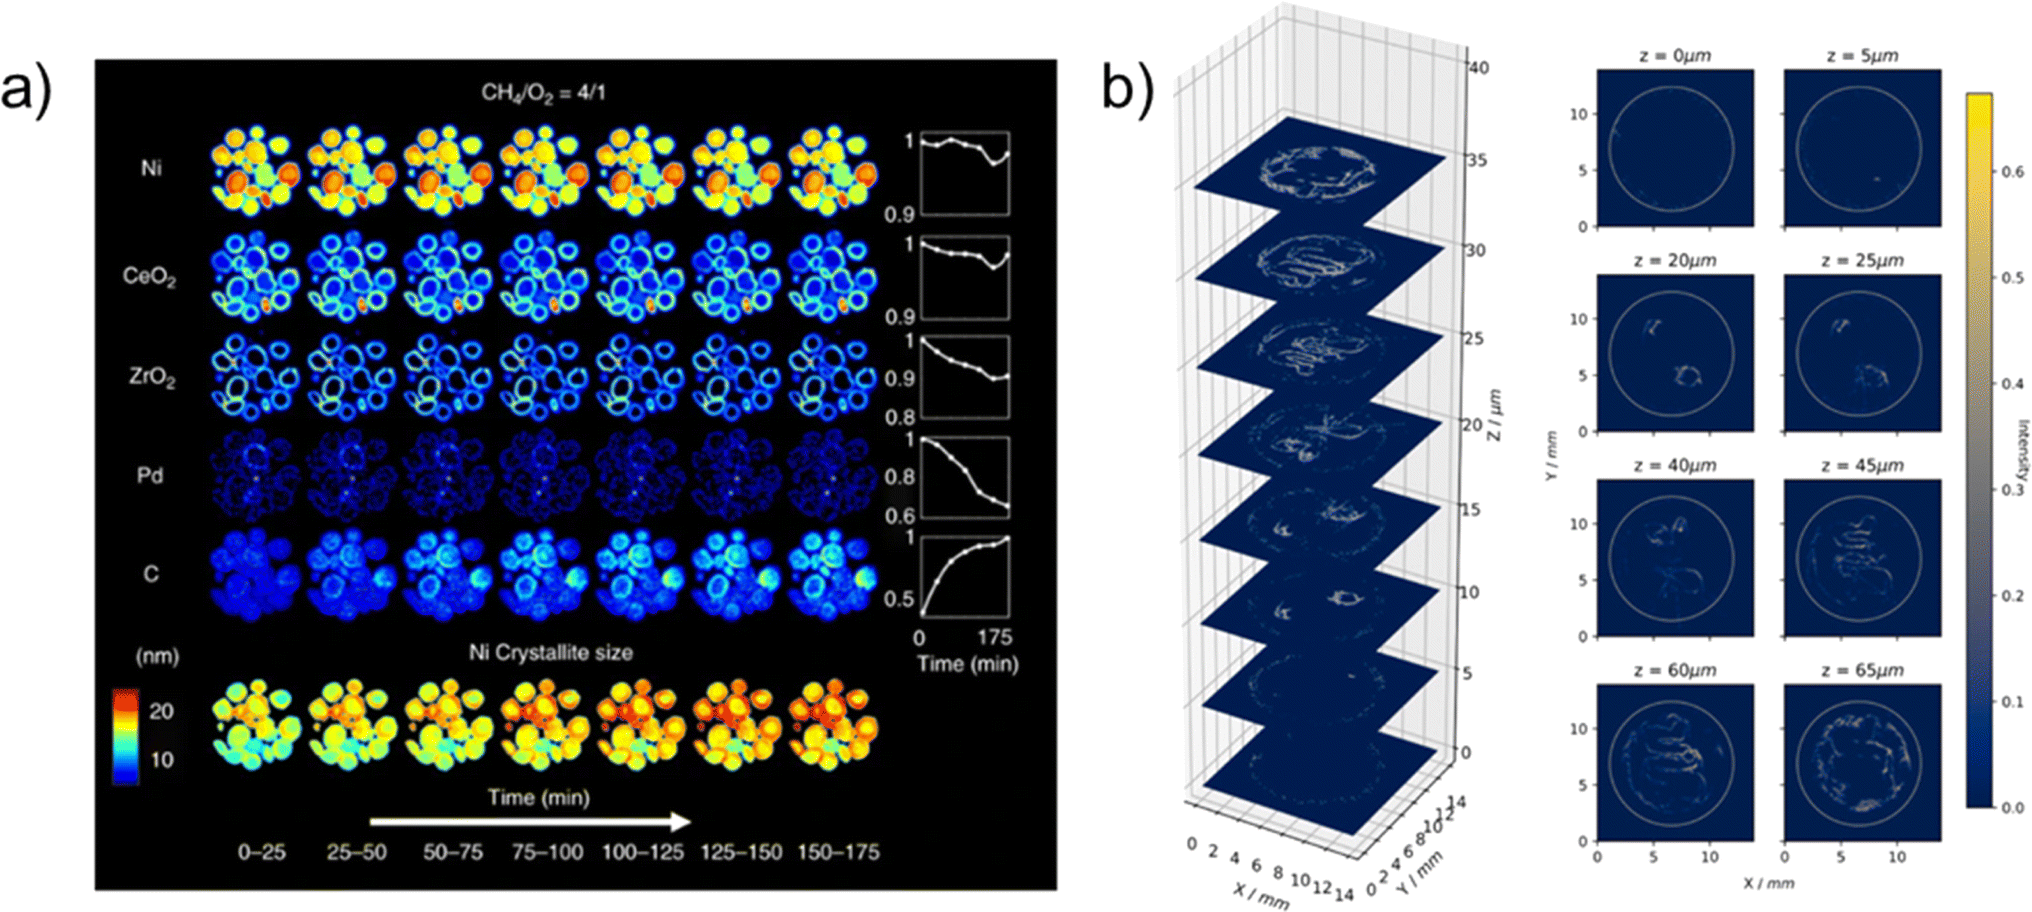 | ||
| Fig. 7 (a) (Top): Synchrotron XRD-CT reconstruction showing chemical evolution of the complex Ni–Pd/CeO2–ZrO2/Al2O3 catalyst during partial oxidation of methane. Phase distribution maps of Ni, CeO2, ZrO2, Pd and C are derived from Rietveld analysis. (Bottom): Crystallite size map of Ni, displaying the change in crystallite size, collected during partial oxidation of methane experiment. Reprinted under the terms of the Creative Commons Attribution 4.0 International (CC-BY 4.0) license, from Vamvakeros et al.,118 Copyright 2018, The Author(s), published by Springer Nature. (b) XRD-CT scan of the MEA's Cu catalyst layer, demonstrating the versatile high energy X-ray transparent CO2 electrolysis cell for operando WAXS/SAXS-CT measurements. The plotted intensity correspond to the surface oxide (Cu2O) XRD with one voxel resolution of 69.5 μm and the slice dimensions of 200 × 200 voxels (13.9 × 13.9 mm2). Reprinted from Moss et al.,86 Copyright 2023, with permission from Elsevier. | ||
XRD-CT is not the only elastic scattering technique that may be combined with computed tomography. Other techniques that are being pioneered include small-angle X-ray scattering (SAXS)121 and X-ray ptychographic tomography.104,119 Due the scattering distance being inversely proportional to the distance in real space, SAXS may provide information on the structure and morphology on a nanometer scale, whilst X-ray ptychographic CT122,123 is a phase-contrast imaging technique that is capable of providing 3D maps at high nanometric resolution. A number of authors have developed X-ray techniques for carrying out the multi-dimensional imaging on a range of energy technologies.86,104,117–120,122,123 For example, Moss et al.86 developed an electrolysis cell suitable for carrying out either wide-angle X-ray scattering (WAXS) or SAXS XRD-CT (shown in Fig. 3b), with the authors reporting a resolution of 69.5 μm. The versatile cell was developed for enabling a range of reactant flow to the MEA, with CO2 electrolysis demonstrated by the authors, but with the flexible design allowing, in theory, for a range of electrolyser studies, including AEM and PEM. The authors collected XRD-CT data for the copper catalyst layer prior to reaction (Fig. 7b), as well as operando data to study the oxidation of copper during operation. The development of cell designs such as this, along with the developments in experimental techniques, could allow for wide-ranging studies on a variety of electrolyser catalysts, in particular for application to the challenge areas of emerging catalysts or catalyst degradation (Fig. 1) (C1, C2, C3). This showcases the potential for multi-dimensional X-ray CT characterisation of electrolysers, in particular for identifying phase or chemical information of catalyst layers, or for providing insight into the nanoporosity of CLs (C1, C2). As these techniques come online, there is increasing scope for application to electrolysers. This can provide much needed information about operation, distribution of species, in particular catalysts, and crucially degradation mechanisms (C3).
4 Neutron imaging of water electrolysers
4.1 Radiography studies of liquid distribution in electrolysers
As discussed in Section 2, the resolution of neutron imaging techniques are well suited to imaging liquid water and gas distribution inside electrolysers, and dependent on energy can penetrate through large samples. Currently, to the author's best knowledge, there are no neutron studies of SOECs. There is increasing promise for using neutron imaging to investigate alkaline and AEM electrolysers, given that the hydroxide-based electrolytes contain hydrogen and would allow for visualisation and analysis in neutron studies. Given the emerging nature of AEM research, this is a key area with potential for application of neutron imaging since the two-phase flow behaviour of the hydroxide-based electrolyte is expected to be different from that of water in PEM technologies. As with X-ray imaging, the majority of papers employing neutron imaging techniques are focussed on the understanding of PEM electrolysers.As mentioned in Section 2.2, voxel dimensions for neutron imaging studies are in the range of ∼6–60 μm, meaning that spatial resolutions are generally upwards of ∼20–200 μm (depending on the voxel size). Given that PTL thickness is generally >200 μm (Table 1), and flow channel dimensions are around 1 mm, the spatial resolution of neutron imaging primarily allows for the study of flow channels, with some limited understanding of two-phase dynamics in PTLs. In neutron imaging studies, it is common for authors to report on the gas thickness or gas saturation,77,87,91,96,124,125 which is done by normalising radiographs collected against a reference image of the region of interest, with known water content. Thus, while the individual pores within a PTL cannot be resolved with radiography, regions of relative high or low gas saturation within the PTL can be determined. Furthermore, because of the lower temporal resolution of neutron imaging (as compared with X-rays), there are currently no studies applying neutron CT to investigate water dynamics in electrolysers. While this was recently reported for fuel cells,90 it is expected that the ongoing upgrades of neutron beamlines will enable 4D studies of electrolyser dynamics at higher spatial and temporal resolutions in the coming years. Nonetheless, most of the imaging studies on electrolysers using neutron techniques are in situ or operando in nature, meaning that water/gas dynamics and evolution have been the focus of studies.
Given the complementary match between the spatial resolution achievable with neutron imaging and the need to understand water and gas dynamics in both the PTL (C3) and the flow channels of electrolysers, most of the neutron imaging studies have focused on these two components. An example of a neutron radiograph showing the flow channels in a multi-channel serpentine flow field, and its relation to the entire flow field, is shown in Fig. 8a. Variation in the gas thickness can be observed by the scale bar, with the transition from black to white grayscale values indicating an increase in gas thickness through the flow channel (Fig. 8a(ii)). Early work on the application of neutron radiography to the study of water and gas in electrolysers used small cell designs, with active electrode areas of around 1 cm2, to demonstrate the evolution of gas and water in the anode and cathode side, respectively with increasing current density (C3).58,59 Lee et al.126 employed operando neutron imaging to study the effect of dry cathode nitrogen purging on PEM electrolyser performance. By operating the cell in a “dry-cathode” mode, i.e. without flowing water over the hydrogen-evolving cathode and using nitrogen as a purge gas, it was possible to accurately measure the anode oxygen evolution (C3). More recent work by the same group studied the temperature-dependence of mass transport in PEM electrolysers,127 where operando neutron radiography highlighted that increasing the operating temperature decreased mass transport overpotentials but increased the amount of gas observed in the anode. Temperature-dependence has also been studied on PEM electrolyser cells with 16 parallel flow channels,56 with higher gas saturations found at lower temperatures, with a 15% increase in gas saturation from 80 °C → 40 °C. As well as investigations on operating conditions, Minnaar et al.61 used through-plane neutron radiography (combined with in situ current mapping) to study the effect of flow field design on electrolyser performance (C1, C3). A parallel (PAR) flow field and a pin-type flow field were compared, and while electrolyser polarisation performance was similar for both flow field designs, results of neutron radiography suggested that the pin-type flow field offered improved current and temperature distribution compared with the PAR design.
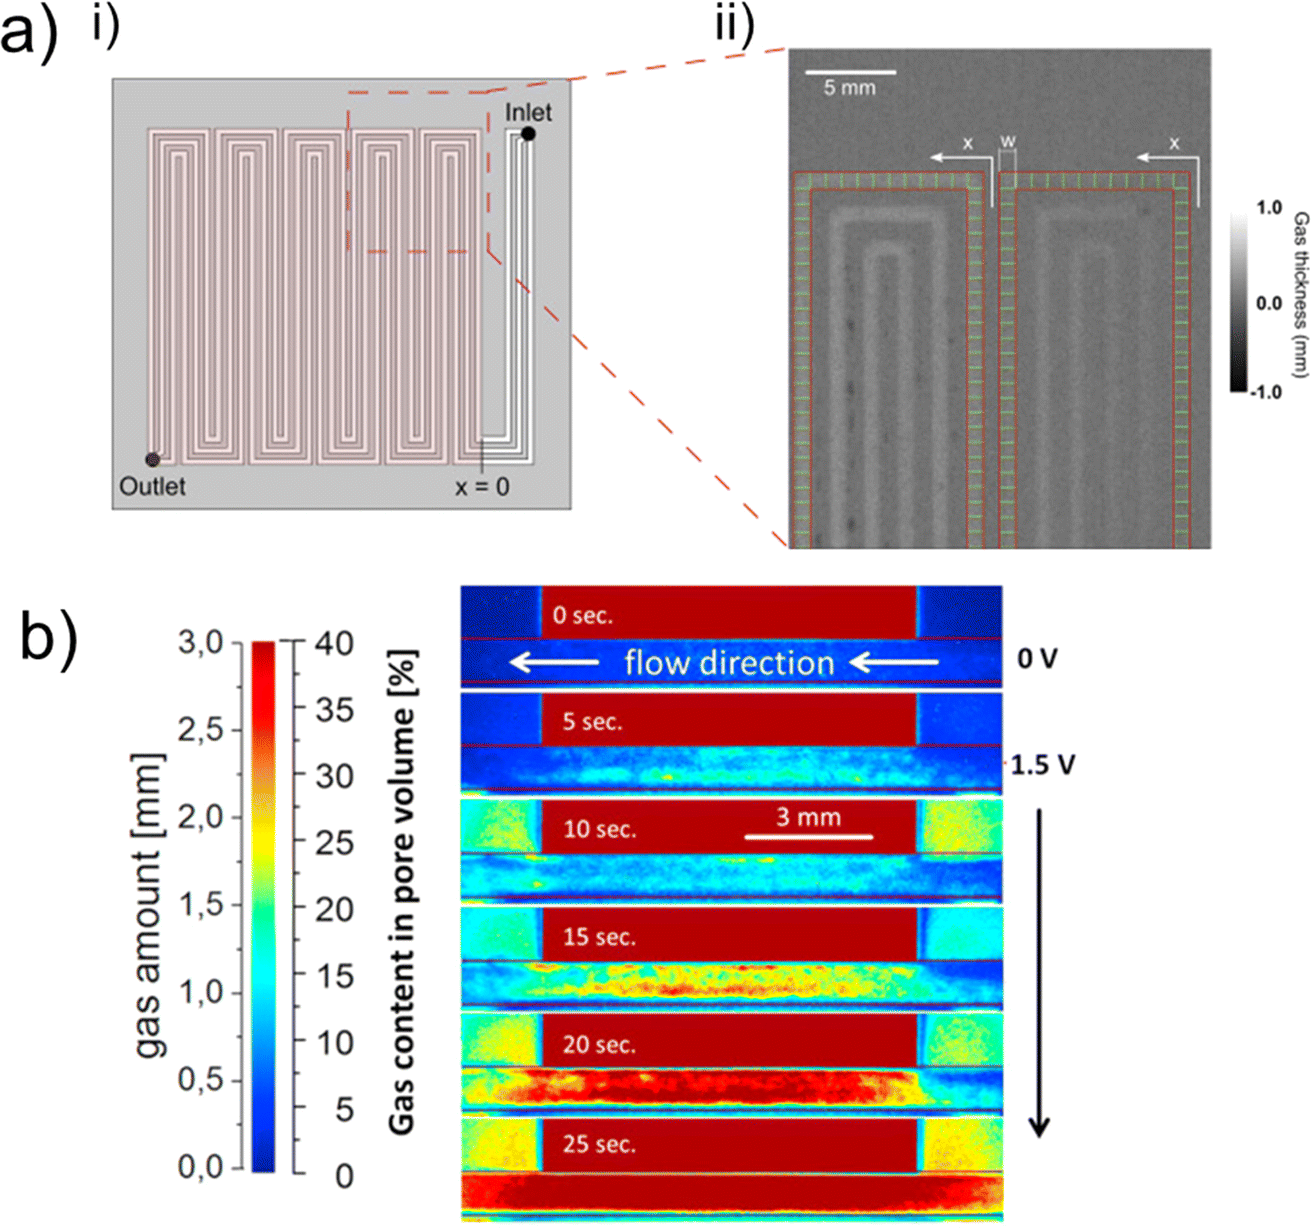 | ||
| Fig. 8 (a) (i) Entire flow channel with an active cell area of 25 cm2 and a triple serpentine flow channel. The region of interest for the sample in the through-plane orientation investigated by neutron radiography is indicated by the red dashed box, and an example radiograph is shown in (ii). The thickness of gas, calculated by normalisation versus a reference image in which the channels were entirely filled with water, can be observed by the scale bar. Reprinted from Lee et al.126 Copyright 2018, with permission from Elsevier. (b) In-plane, normalised radiographs showing a view through a flow channel, where the land region is indicated by the block red value in all images. The evolution of gas amount, in mm, as indicated by the corresponding scale bar, can be observed with increasing voltage going down the images. The gas evolves first at the PTL/CL interface, particularly clear in the 15 s figure, where there is a greater thickness of gas at this boundary (shown by the deeper red colour). Reprinted from Panchenko et al.91 Copyright 2018, with permission from Elsevier. | ||
For PEM electrolysers, the PTL represents a crucial component for ensuring the optimum distribution of both water supply to, and gas supply away from, the CL. As discussed in Section 1.4, the PTL generally comprises a titanium-based porous network, with pores on the order of microns. PTL design and optimisation is of growing interest to the electrolyser community and neutrons have been widely used to deepen the understanding of both existing and novel/emerging PTL designs.56,59,87,91,94,96,124,125 Titanium sinters and titanium felts have been two of the most commonly used PTL structures, and using a 1.5 cm2 cell with 6.3 μm per pixel, Panchenko et al.91 were able to study the two-phase distribution of species within these two different structures. Given the voxel size, resolution of individual pores within the PTL was not possible, but using the Beer–Lambert law, it was possible to quantify the variation in gas thickness within the flow channel and PTL (Fig. 8b). Results showed that in general a greater amount of gas was found under land regions of the PTL than channel regions (represented by the greater concentration of red colour under the ‘land’ region in Fig. 8b), attributed to greater electrical contact and pressure, as well as the fact that the coarser, larger pores of the fibre PTL led to less uniform gas distribution but better gas removal than the sintered PTL with the smaller pores (C3). It is interesting to note that both X-rays and neutrons have proven important techniques for studying PTLs, with the literature discussed in Section 3 employing X-rays to understand key structural properties of the PTLs, and neutrons used to investigate transport properties. As is the focus of this review, clearly the different imaging sources are highly complementary for building a complete picture of the PTL influence on performance in PEM electrolysers.
Recently, research has increasingly focused on the development of novel PTL structures that can enhance the two-phase flow properties within the PTL (C1, C3). Examples include the work by Zlobinski et al.,87 in which the authors implemented various microporous layer (MPL)-containing PTLs, or multi-layer PTLs (ML-PTLs) to study the water/gas evolution regimes in these hierarchical structures. Findings showed that the inclusion of an MPL created multiple regimes for gas and water transport, and that the smaller pores of the MPL improved water filling and distribution. However, the authors highlighted the need for greater focus and understanding of the CL water filling, as well as more insight into the CL-PTL interface. Graded-porosity PTLs have also been studied by Lee et al.96 (Fig. 9a), where the low-to-high porosity regime (Fig. 9a(i)) resulted in the decrease of cell potential by 29%, which was attributed to a reduction in cell overpotentials and high-frequency resistance. Plots of gas saturation profiles in the low-to-high porosity (Fig. 9a(i)) and high-to-low porosity (Fig. 9a(ii)) regimes also highlight the effectiveness of the low-to-high porosity PTL at removing gas from the PTL, since gas was found to accumulate at the interface between the high and low-porosity region in the high-to-low porosity PTL, as indicated by the red/green ‘hotspots’ in Fig. 9a(i) corresponding to regions of higher gas thickness. Treatment of the PTL with hydrophobic coating has also proven to be effective in improving electrolyser performance, such as the NH4OH (25%):H4O4 (30%):H2O (45%) solution that the Ti-PTL was boiled in the work by Zhao et al.,125 with results showing an 11% efficiency improvement in the treated cell (C1, C3). Results of operando neutron radiography showed a much lower oxygen gas saturation in the treated PTL, as well as a more homogeneous gas distribution. This avoids the build-up of gas-saturated “hot spots” and ensures a more even current distribution across the CCM.
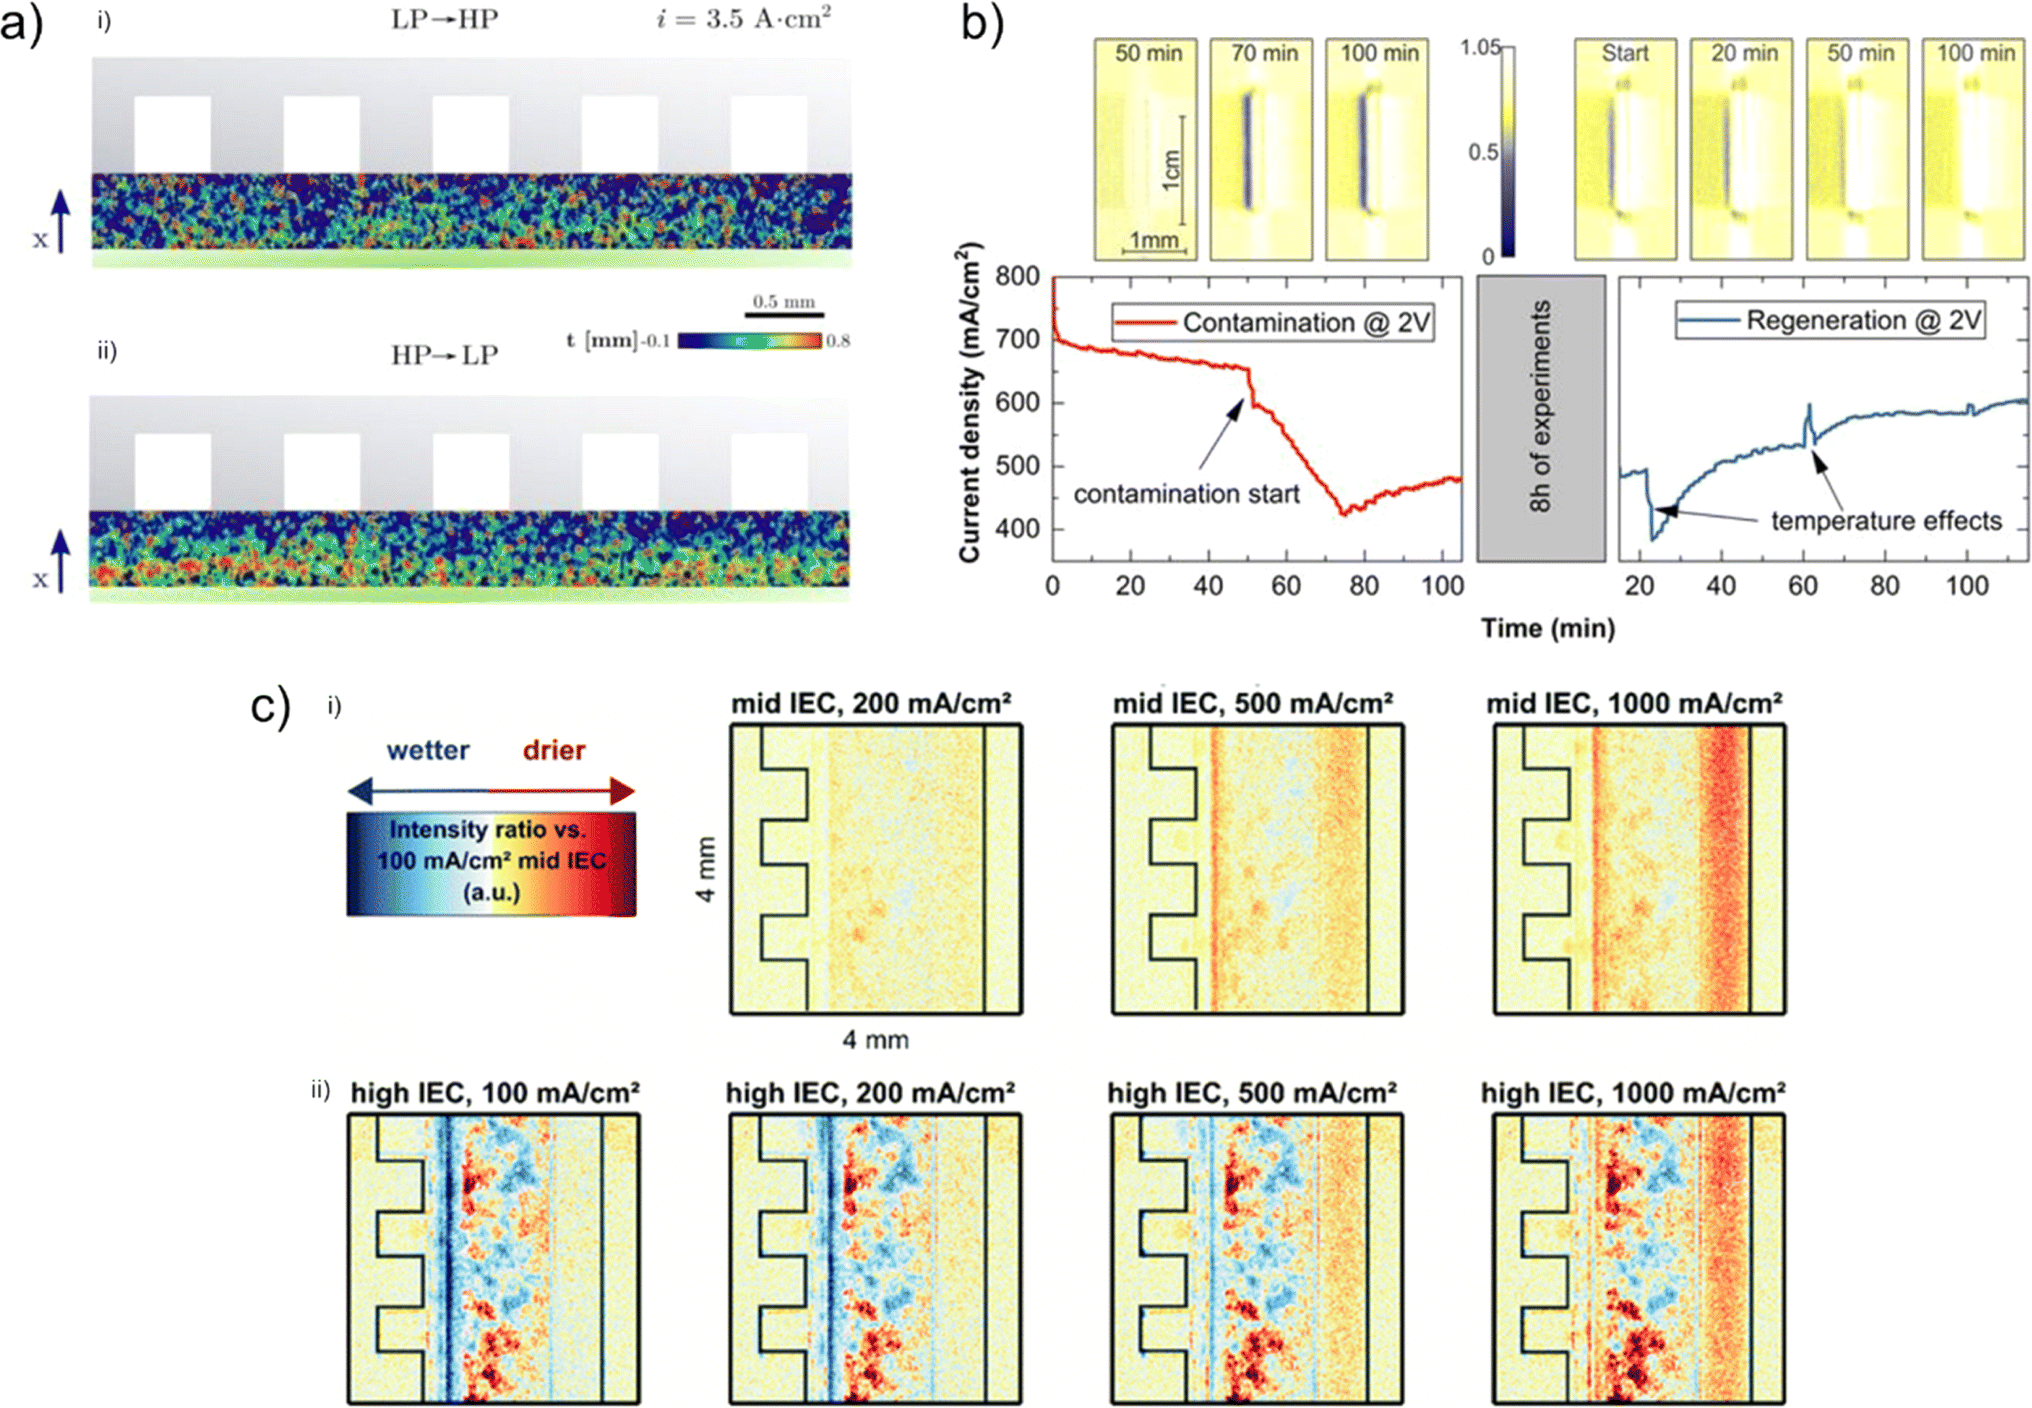 | ||
| Fig. 9 (a) (i) Distribution of water and gas species in the low-to-high porosity (top) and (ii) high-to-low porosity (bottom) region, where gas distribution is more homogeneous in the low-to-high structure as shown by the more uniform gas thickness (where blue-red colour indicates gas thickness from 0.1–0.8 mm). Reprinted from Lee et al.,96 Copyright 2020, with permission from Elsevier. (b) Diagram showing the diffusion of the Gd3+ gadolinium ions into the CCM with increasing duration, as indicated by the increasing amount of blue voxels with increasing time, and attempts to recover performance after 8 h of experiments, with the associated loss of Gd3+ as shown by the reduction in ‘blue’ voxels representing gadolinium ions. Reprinted under the terms of the Creative Commons Attribution 4.0 International (CC-BY 4.0) license, from Zlobinski et al.,77 Copyright 2020, The Author(s), published on behalf of The Electrochemical Society by IOP Publishing Limited. (c) Neutron radiographs showing the effect of ionomer additive on water accumulation at various current densities in an AEM electrolyser. The scale bar represents the change in neutron intensity in the PTL vs. the 100 mA cm−2 mid IEC radiograph, where redder colours represent drier cases with less water, and bluer colours represent wetter cases with more water. Reprinted under the terms of the Creative Commons Attribution 3.0 Unported (CC-BY 3.0) license, from Koch et al.,55 Copyright 2022, The Author(s), published by the Royal Society of Chemistry. | ||
Another key area of interest for understanding electrolysers is the presence of impurities in the water supply and the subsequent effect of such impurities on electrolyser performance as a result of poisoning or damage (C3).77,128,129 Zlobinski et al.77 used Gd3+ as a model impurity, owing to its high neutron scattering cross section (>300 times greater than water), making it a suitable candidate for imaging with neutron radiography. The results showed that Gd3+ ions migrated into the CCM during operation and mostly diffused back into the membrane (Fig. 9b), albeit much slower, when not being operated. Regeneration of electrolyser performance has also been investigated by using a CO2-based regeneration system to remove Fe3+ impurities.128 A Gd3+ system was used to show that ion impurities accumulate primarily in the cathode CL, and this insight was used to inform the introduction of the CO2 feed into the cathode water stream. Results showed that 95% of the performance could be restored after 1500 min, highlighting that the effect of ion impurities on degradation is largely reversible.
While PEM electrolysers have been the main focus of the neutron imaging literature so far, some studies into alternative electrolyser types have begun to emerge. Dry-cathode operation in AEM electrolysers was investigated by using in situ neutron radiography to study the effect of dry-cathode operation on water distribution in the AEM cell (C1).55 By using a high ion-exchange capacity (IEC) ionomer additive in the cathode CL, a greater amount of water could be retained in the CCM region on the right of the radiographs (Fig. 9c(ii)) compared with the mid IEC (Fig. 9c(i)), which counteracted the drying-effect of the dry cathode gas stream. As mentioned in Section 1, AWEs present a cheaper alternative to PEM electrolysers, and recently, zero-gap alkaline electrolysers, which have reduced distance between electrodes, have been investigated as promising AWE technologies, which can help increase current density by reducing the distance between electrodes and lowering cell resistances.22 Renz et al.130 recently reported the use of high-speed neutron radiography, with 50 frames per second (fps), to study the gas bubble dynamics in a zero-gap AWE cell and compared this to electrochemical performance.
Beyond water electrolysis, the electrolysis of CO2 is of interest to the electrolysis community generally, given the ability to electrochemically reduce waste CO2 from industry to produce other high-value chemical products.131 Disch et al.52 used neutron radiography to study a zero-gap electrolyser, with an anion-exchange membrane, an IrO2 anode and a silver cathode. Findings of the high-resolution radiography, with a pixel size of 6 μm, indicated that suspected KHCO3 salts were responsible for pore-blocking in the cathode PTL, thus inhibiting electrochemical reactions and leading to a drop in Faradaic efficiency and cell performance (C3).
As mentioned at the start of this section, neutron tomography has currently been demonstrated in application to the study of other types of electrochemical devices, including fuel cells90,132 and batteries,83 but has not yet been applied to the study of any electrolyser types. However, there is significant scope for application on neutron tomography to study the 3D, time-resolved evolution of water and gas in water electrolyser PTLs and flow channels. In particular, this would avoid the need for quantifying gas thickness through the depth of the PTL samples, as is commonly done, since the quantity of gas present in every voxel through the entire sample could be studied. As investigation into both novel PTL morphologies, as well as emerging electrolyser types, like AEMs, increases, it is expected that neutron tomography studies will become a common choice for studying these technologies.
4.2 Complementary neutron-with-X-ray studies
While many studies have successfully used neutron radiography to quantify the materials properties of the various flow-containing components in electrolysers, many studies have also combined neutron radiography with other characterisation and analysis techniques to further probe the operation and dynamics within electrolysers. Examples include work done on studying two-phase flow and current distribution in electrolyser flow fields.61,133 Selamet et al.133 combined optical imaging with neutron radiography to enable bubble formation to be visualised, and the additional S++ current mapping plate integrated by Minnaar et al.61 allowed for the current distribution (Fig. 10a) to be correlated to water distribution (Fig. 10b) in the parallel and pin-type flow field designs (left and right in both figures for parallel and pin, respectively). For all complementary experiments, cell design is of particular importance, since cells are often subject to harsh operating environments, with extreme pHs and components across multiple length scales. Thus, the cell design parameters must meet the spatial/temporal demands of both/all techniques used, as well as the materials being compatible with the operating conditions used.53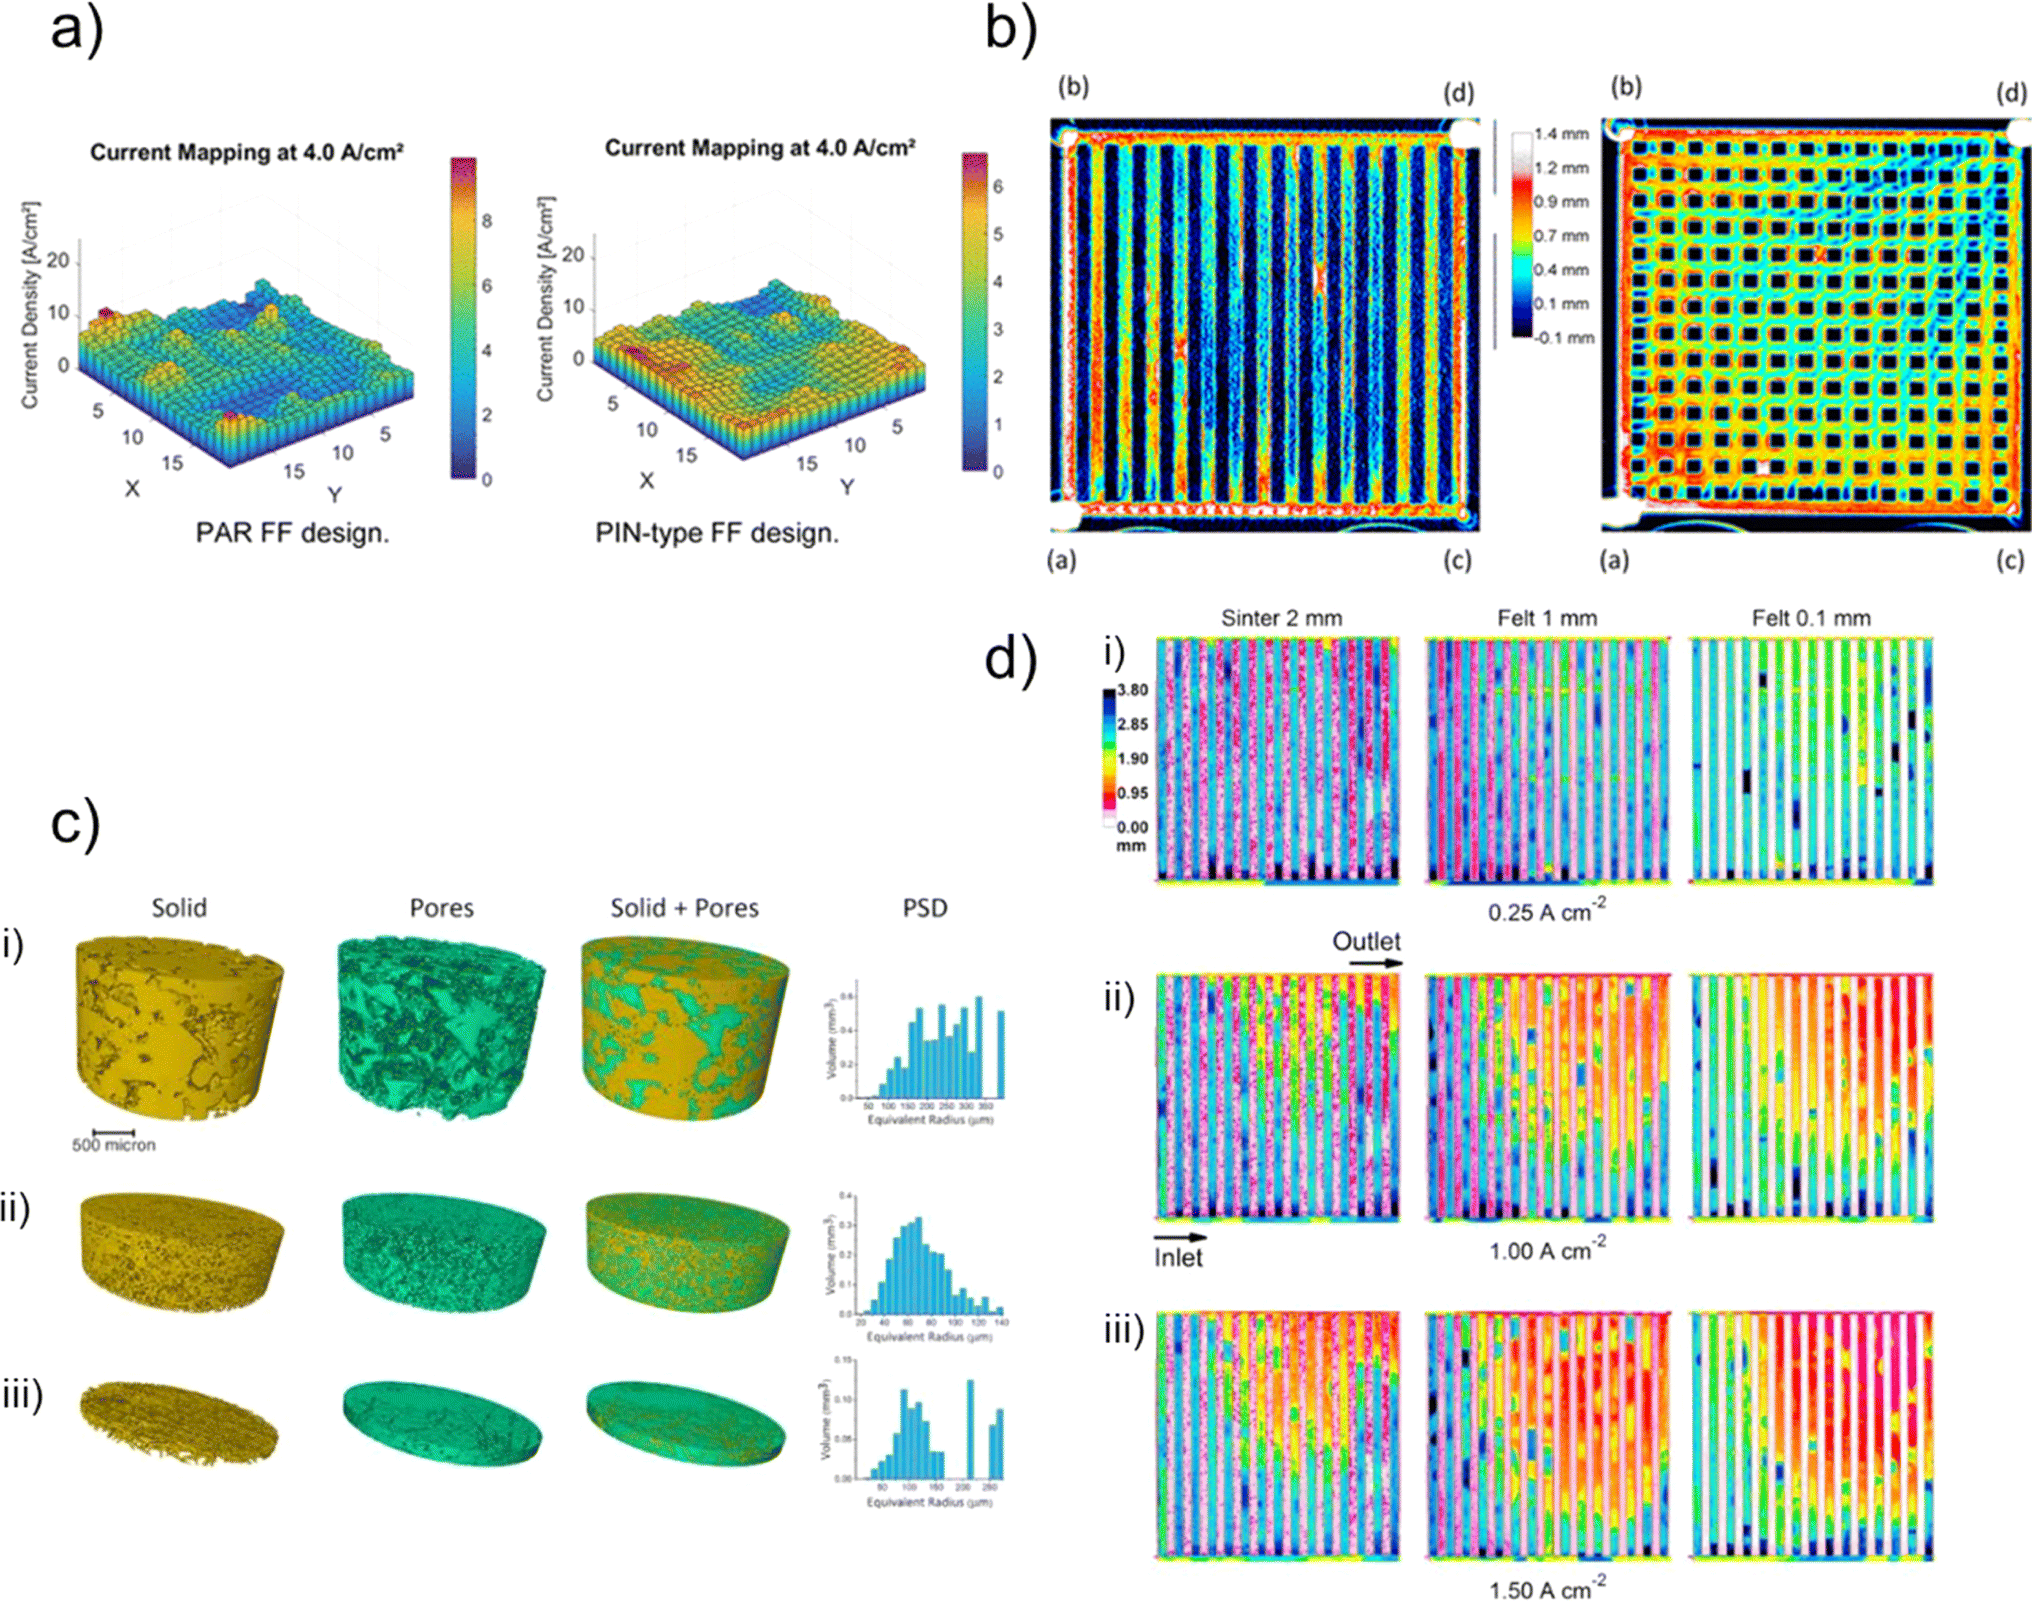 | ||
| Fig. 10 (a) 19 × 19 array of the S++ plate used to show the current density distribution inside the parallel (left) and pin-type (right) flow field designs. The scale bar represents current density of each region of the array, with blue → red indicating low → high current density, and (b) complementary neutron radiographs showing water thickness (from 0.1 mm (blue) to 1.4 mm (white)) inside the parallel (left) and pin (right) flow fields. The letters in the corners in these figures (a–d) represent water inlets/outlets. (a and b) both reprinted with permission from Minnaar et al.,61 Copyright 2020 American Chemical Society. (c) Microscale X-ray CT datasets of the different PTLs, namely (i) sinter, (ii) thick felt and (iii) thin felt, showing solid phase (yellow), pore phase (green) and PSD, and (d) corresponding neutron radiographs showing the distribution of water/gas in the different PTL structures and varying current densities, where white/pink → blue/black corresponds to increasing water thickness from 0 → 3.8 mm. (c and d) reprinted from Maier et al.,57 Copyright 2020, with permission from Elsevier. | ||
As is the subject of this review, neutron methodologies have also seen wide use in combination with X-ray techniques to harness the complementary nature of the spatial resolution achievable with X-rays with the ability to study water and gas dynamics using neutrons. In early work from 2015 by Hoeh et al.,54 X-ray and neutron radiography were combined, where neutron radiography enabled the study of water distribution in the flow field and X-ray radiography enabled visualisation of gas bubbles within the channel. As well as its use for analysing transport properties, X-ray CT has been used to extract morphological parameters of electrolyser components, in particular the pore-size distribution of the PTL extracted using both continuous pore size distribution (cPSD) and simulated mercury intrusion porosimetry (MIP).124 The structural properties obtained with X-ray CT could then be correlated to the findings of neutron experiments, with results suggesting that two-phase flow is capillary driven, and the pore network of the PTL results in trapping of gas at a local level (C3). The use of complementary X-ray CT and neutron radiography has also been extended to the study of mass transport in different PTL designs57 (Fig. 10), again with pore network models being extracted from X-ray CT datasets (Fig. 10c) to investigate the morphological properties of the different PTL phases: solid and pore (Fig. 10c (i) sinter, (ii) thick felt and (iii) thin felt) and neutron radiography used to investigate the distribution of water at 0.25, 1.00 and 1.50 A cm−2 (Fig. 10b(i–iii) for 0.25, 1.00 and 1.5 A cm−2, respectively). Results agreed with those of Panchenko et al.,91 where the coarser, larger pores of the sinter results in a less homogeneous gas distribution than for the felt samples with smaller pores (C2, C3).
Another promising avenue for complementary neutron imaging is the use of advanced computer modelling tools to enable rapid data analysis and prediction. As with X-ray imaging methods (discussed in Section 3.1), this is an area that is expected to rapidly increase as the interest in, and research on, AI and ML rapidly advances. An example is the work by Pang and Wang107 who applied convolutional neural networks to in situ neutron radiography image analysis of PEM fuel cells, with results providing good agreement with literature and ∼1/3 faster analysis time. This approach holds promise for application to electrolyser experiments, in which significant amounts of data are generated and the limiting factor is often the time/effort required to extract trends from these datasets. The successful use of these techniques, however, rely on the generation, transformation and validation of large datasets gathered through multiple neutron/X-ray CT imaging datasets. However data is often collected from a small sample set which does not provide a realistic representation of an electrolyser system as a whole. As such results may be insufficient for confirming the validity of image based modelling, or for training an ML or deep learning (DL) model. Some studies on fuel cells have begun to specifically address the need for multiple sample regions and larger, high-resolution sample areas, for example by scanning multiple locations in a sample,134 or using DL algorithms to achieve high-resolution, large area scans.135 The needs for continuing with development of statistical methods and ML/DL techniques for data analysis will be discussed further in Section 5.2.
5 Conclusions and perspectives
5.1 Conclusion and summary of current use of X-rays and neutron imaging for water electrolyser characterisation
This perspective has focused on the use of complementary X-ray and neutron imaging for accessing internal interfaces in water electrolysers and allowing for visualisation and deepened understanding of both existing and emerging electrolyser materials and components across multiple length scales. Given the four key challenge areas outlined in Section 1.3, expressing the needs of future electrolyser development (use alternative elements, use less, increase durability, recycle), imaging studies are of continuing importance for ensuring a full picture of electrolyser operation and degradation can be captured as the materials inside the different electrolyser types continue to evolve. As research into electrolyser materials intensifies, we see X-ray and neutron imaging as playing a central role in the 3D, time-resolved characterisation of these materials, including their performance under operando conditions.5.2 A perspective on the future needs for complementary X-ray and neutron imaging complementary imaging to help work towards solving the four challenges
At the start of this review, we outlined four key challenges that are facing all electrolyser types to ensure that electrolysers reach their full potential as a method of producing green hydrogen at scale. These challenges were: C1 – use less; C2 – use alternative elements; C3 – increase durability and C4: recycle. Throughout this perspective, we have linked the research articles discussed in detail to these four challenges, highlighting particular examples where a paper has addressed one on more of them. The links between the current research methods and the materials challenges are mapped on the left-hand side of the schematic in Fig. 11. While the challenge areas of using less and alternative materials and making electrolysers last longer (C1–C3) have been widely addressed by the existing literature using X-ray nano-CT, X-ray micro-CT and neutron imaging, it can be seen how these imaging methods have not yet been used to address the challenge of recycling materials (C4).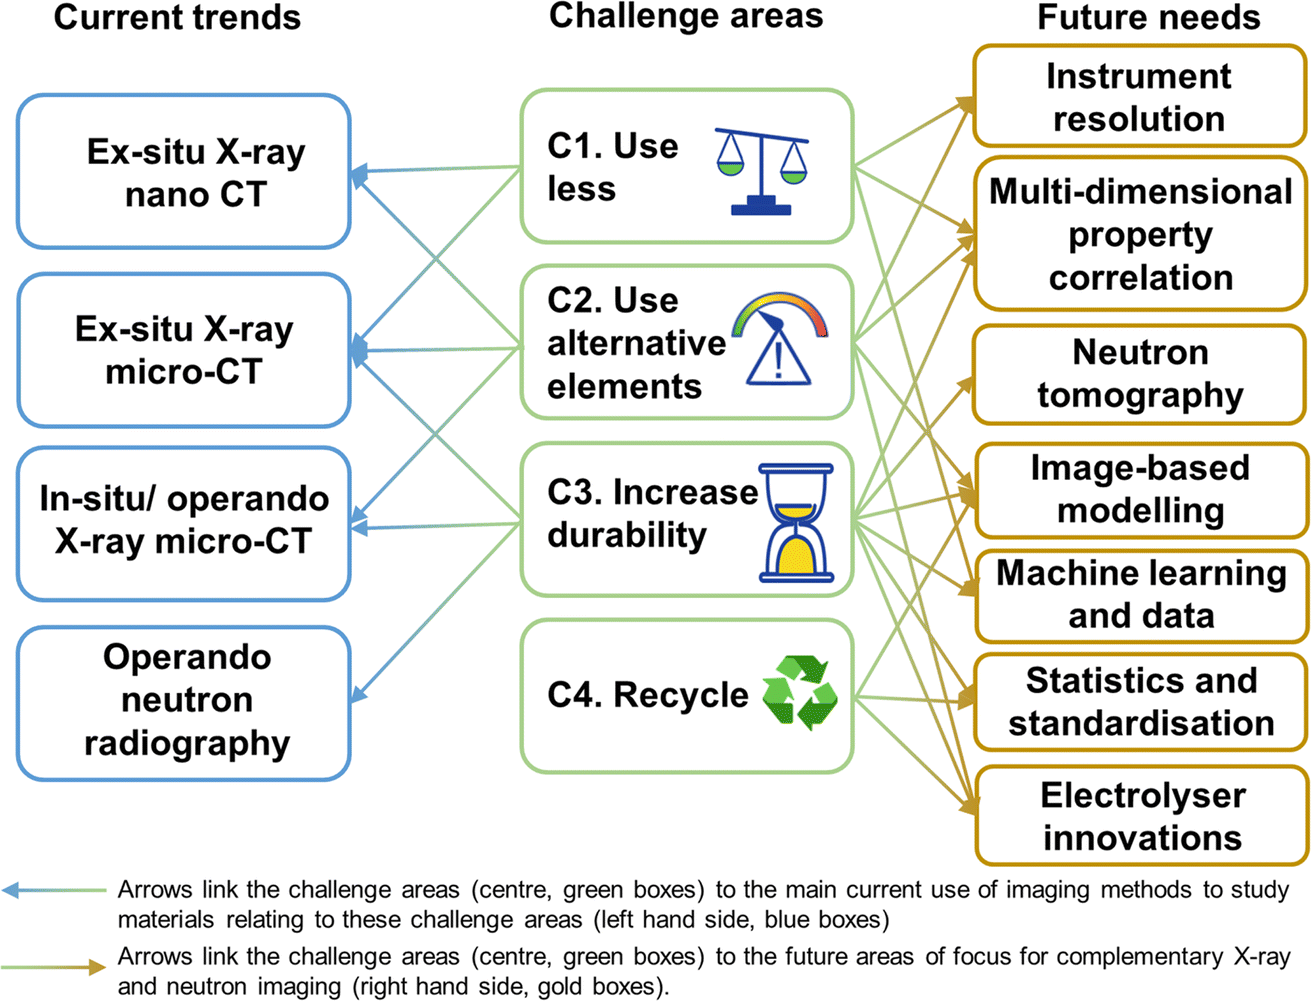 | ||
| Fig. 11 Schematic showing the links between the four key materials challenges for the next generation of electrolyser technologies (centre, green boxes) and the current imaging trends (left hand side, blue boxes), and future needs (right hand side, gold boxes). | ||
Due to the low numbers of electrolysers currently deployed, with even fewer having reached their end-of-life, recycling is still mostly limited to methods for recovering the PGM catalysts,136 and there is still a way to go in terms of ensuring robust processing streams for end-of-life management of all electrolyser materials.136,137 In terms of opportunities for imaging end of-life, recycling processes, possible areas of research could in include imaging of catalyst breakdown and segregation, the effect of reuse of PTL layers following stripping, evaluating debonding and separation (e.g. the CL from the PTL), or CL evaluation and metal recovery (either PGM from PEM technologies, or Ni-based catalysts from AEMs). Finally, as has already been shown for battery technologies,138 CT could be used as a pre-screening method to evaluate internal morphology non-destructively prior to disassembly. This could help the concept of ‘second-life’, where an electrolyser that has not reached end-of-life, but does still exhibit a satisfactory performance, could be diverted for re-use in a lower power application.
We have also mapped the challenge areas onto a set of future needs (Fig. 11, gold boxes, right-hand side) that we believe to be of key importance for future imaging studies. By developing these imaging methods further, it will be possible to continue to address the first three challenge areas along with concepts around recycling, as these studies begin to emerge in the literature. The following sections will expand on each of the future needs in turn.
Specifically, for X-ray based methods, the focus could be on imaging larger sample regions with high resolution. For example, a scan that can resolve the internal nano-porosity of the CL (with the ∼50 nm resolution of X-ray nano-CT) but with a sample area of an X-ray micro-CT scan (i.e. 1 mm). This has begun to be demonstrated using deep-learning-based algorithms for achieving ‘super-resolution’ data of a fuel cell.135 This involves colleting a high-resolution, small area scan of a sub-volume taken from a low-resolution, coarse scan. The deep-learning algorithm is then trained on these datasets to ‘super-resolve’ unseen low-res scans that have the effective resolution of the high-res scan. Such methods could enable image-based modelling of water and gas flow in electrolysers within the PTL pores, although the data-intensive nature could present limitations for conducting operando studies. As well as larger sample areas, improvements in resolution at the nanoscale could also allow for the in situ/operando study of the internal CL porosity and materials using X-ray nano-CT. This would allow degradation of the catalysts themselves to be visualised and observed (currently limited to bulk CL properties in micro-CT), and nanoscale changes in the porosity or material distribution inside the CL could be visualised (C3).
For neutron imaging, as discussed in Section 3.2, progress has been made towards lowering the spatial resolution of neutron imaging, and recent work has demonstrated advances in temporal resolution making tomography of electrochemical devices possible.83,90 Thus, continued work with neutron detector systems will help ensure that spatial resolutions below 10 μm become standard, in combination with ‘high-speed’ tomograms on the order of 18 s per tomogram132 or below. This will enable spatial and temporal resolution of the internal PTL porosity and allow for visualisation and quantification of water (and gas) inside these pores.
Data availability
Data (tomograms) for Fig. 2d and e are not currently available as this work was undertaken over 5 years ago. Otherwise, no other data were generated or analysed as part of this perspective.Author contributions
Sebastian Altus: conceptualisation, writing – original draft, writing – review & editing, Beverley Inkson: conceptualisation, writing – review & editing; Jennifer Hack: conceptualisation, writing – original draft, writing – review & editing.Conflicts of interest
There are no conflicts to declare.Acknowledgements
JH acknowledges the Royal Academy of Engineering for funding through the Research Fellowships scheme. SJA and BJI acknowledge the support of the Faraday Institution FutureCat project (FIRG065). The authors would like to acknowledge Dr Nikolay Kardjilov, Dr Henning Markötter and Dr Ingo Manke (Helmholtz-Zentrum Berlin) for assistance with collecting the neutron tomogram in Fig. 2e. The authors would like to acknowledge the Electrochemical Innovation Lab for assistance with collecting the X-ray tomogram in Fig. 2d.References
- IRENA, Global Hydrogen Trade to Meet the 1.5 °C Climate Goal: Part I – Trade Outlook for 2050 and Way Forward, Abu Dhabi, 2022 Search PubMed.
- S. Griffiths, B. K. Sovacool, J. Kim, M. Bazilian and J. M. Uratani, Energy Res. Social Sci., 2021, 80, 102208, DOI:10.1016/j.erss.2021.102208.
- M. A. Khan, C. MacKinnon, C. Young and D. B. Layzell, Techno-economics of a New Hydrogen Value Chain Supporting Heavy Duty Transport, 2022 Search PubMed.
- A. Mayyas, M. Wei and G. Levis, Int. J. Hydrogen Energy, 2020, 45, 16311–16325, DOI:10.1016/j.ijhydene.2020.04.163.
- IEA, Tracking Clean Energy Progress 2023, Paris, 2023 Search PubMed.
- M. Hermesmann and T. E. Müller, Prog. Energy Combust. Sci., 2022, 90, 100996, DOI:10.1016/j.pecs.2022.100996.
- C. Bauer, K. Treyer, C. Antonini, J. Bergerson, M. Gazzani, E. Gencer, J. Gibbins, M. Mazzotti, S. T. McCoy, R. McKenna, R. Pietzcker, A. P. Ravikumar, M. C. Romano, F. Ueckerdt, J. Vente and M. van der Spek, Sustain. Energy Fuels, 2022, 6, 66–75, 10.1039/D1SE01508G.
- M. Company, Global Energy Perspective 2023: Hydrogen outlook, https://www.mckinsey.com/industries/oil-and-gas/our-insights/global-energy-perspective-2023-hydrogen-outlook, accessed 17th April, 2024.
- T. Smolinka, H. Bergmann, J. Garche and M. Kusnezoff, in Electrochemical Power Sources: Fundamentals, Systems, and Applications, ed. T. Smolinka and J. Gcarhe, Elsevier, 2022, DOI:10.1016/B978-0-12-819424-9.00010-0, pp. 83–164.
- J. Matthey, Recycling and thrifting: the answer to the iridium question in electrolyser growth, https://matthey.com/science-and-innovation/expert-insights/2022/recycling-and-thrifting-the-answer-to-the-iridium-question-in-electrolyser-growth, accessed 17th April, 2024.
- DOE, Technical Targets for Proton Exchange Membrane Electrolysis, https://www.energy.gov/eere/fuelcells/technical-targets-proton-exchange-membrane-electrolysis, accessed 17th April, 2024.
- L. M. Salonen, D. Y. Petrovykh and Y. V. Kolen'ko, Mater. Today Sustain., 2021, 11–12, 100060, DOI:10.1016/j.mtsust.2021.100060.
- DOE, Technical Targets for High Temperature Electrolysis, https://www.energy.gov/eere/fuelcells/technical-targets-high-temperature-electrolysis, accessed 17th April 2024.
- H. Dong, J. Zhao, J. Chen, Y. Wu and B. Li, Int. J. Miner. Process., 2015, 145, 108–113, DOI:10.1016/j.minpro.2015.06.009.
- M. Carmo, G. P. Keeley, D. Holtz, T. Grube, M. Robinius, M. Müller and D. Stolten, Int. J. Hydrogen Energy, 2019, 44, 3450–3455, DOI:10.1016/j.ijhydene.2018.12.030.
- I. Vincent, A. Kruger and D. Bessarabov, Int. J. Electrochem. Sci., 2018, 13, 11347–11358, DOI:10.20964/2018.12.84.
- B. Mayerhöfer, F. D. Speck, M. Hegelheimer, M. Bierling, D. Abbas, D. McLaughlin, S. Cherevko, S. Thiele and R. Peach, Int. J. Hydrogen Energy, 2022, 47, 4304–4314, DOI:10.1016/j.ijhydene.2021.11.083.
- K. J. Ferner, J. Park, Z. Kang, S. A. Mauger, M. Ulsh, G. Bender and S. Litster, Int. J. Hydrogen Energy, 2024, 59, 176–186, DOI:10.1016/j.ijhydene.2024.02.020.
- P. Yang, J. Huang, J. Li, K. Luo, L. Zhang, Q. Fu, X. Zhu and Q. Liao, Int. J. Hydrogen Energy, 2024, 52, 170–176, DOI:10.1016/j.ijhydene.2023.10.108.
- S. Siracusano, V. Baglio, E. Moukheiber, L. Merlo and A. S. Aricò, Int. J. Hydrogen Energy, 2015, 40, 14430–14435, DOI:10.1016/j.ijhydene.2015.04.159.
- F. Hegge, R. Moroni, P. Trinke, B. Bensmann, R. Hanke-Rauschenbach, S. Thiele and S. Vierrath, J. Power Sources, 2018, 393, 62–66, DOI:10.1016/j.jpowsour.2018.04.089.
- S. Krishnan, V. Koning, M. Theodorus de Groot, A. de Groot, P. G. Mendoza, M. Junginger and G. J. Kramer, Int. J. Hydrogen Energy, 2023, 48, 32313–32330, DOI:10.1016/j.ijhydene.2023.05.031.
- D. Pletcher, X. Li and S. Wang, Int. J. Hydrogen Energy, 2012, 37, 7429–7435, DOI:10.1016/j.ijhydene.2012.02.013.
- J. Laurencin, D. Kane, G. Delette, J. Deseure and F. Lefebvre-Joud, J. Power Sources, 2011, 196, 2080–2093, DOI:10.1016/j.jpowsour.2010.09.054.
- D. The, S. Grieshammer, M. Schroeder, M. Martin, M. Al Daroukh, F. Tietz, J. Schefold and A. Brisse, J. Power Sources, 2015, 275, 901–911, DOI:10.1016/j.jpowsour.2014.10.188.
- J. Cao, Y. Li, Y. Zheng, S. Wang, W. Zhang, X. Qin, G. Geng and B. Yu, Adv. Energy Mater., 2022, 12, 2200899, DOI:10.1002/aenm.202200899.
- J. E. Park, H. E. Bae, M. Karuppannan, K. M. Oh, O. J. Kwon, Y.-H. Cho and Y.-E. Sung, J. Ind. Eng. Chem., 2022, 109, 453–460, DOI:10.1016/j.jiec.2022.02.033.
- H. Yu, L. Bonville, J. Jankovic and R. Maric, Appl. Catal., B, 2020, 260, 118194, DOI:10.1016/j.apcatb.2019.118194.
- W. Xu and K. Scott, Int. J. Hydrogen Energy, 2010, 35, 12029–12037, DOI:10.1016/j.ijhydene.2010.08.055.
- Y. Zuo, S. Bellani, M. Ferri, G. Saleh, D. V. Shinde, M. I. Zappia, R. Brescia, M. Prato, L. De Trizio, I. Infante, F. Bonaccorso and L. Manna, Nat. Commun., 2023, 14, 4680, DOI:10.1038/s41467-023-40319-5.
- W. Chin, J. Huang, Y. Liu, Y. Wu and Y. Lee, Int. J. Hydrogen Energy, 2024, 52, 994–1001, DOI:10.1016/j.ijhydene.2023.03.476.
- J. K. Lee, P. Kim, K. Krause, P. Shrestha, M. Balakrishnan, K. Fahy, K. Fatih, N. Shaigan, M. Ge, W.-K. Lee and A. Bazylak, Cell Rep. Phys. Sci., 2023, 4, 101232, DOI:10.1016/j.xcrp.2022.101232.
- S. Koch, P. A. Heizmann, S. K. Kilian, B. Britton, S. Holdcroft, M. Breitwieser and S. Vierrath, J. Mater. Chem. A, 2021, 9, 15744–15754, 10.1039/D1TA01861B.
- C. Liu, M. Shviro, G. Bender, A. S. Gago, T. Morawietz, M. J. Dzara, I. Biswas, P. Gazdzicki, Z. Kang, S. F. Zaccarine, S. Pylypenko, K. A. Friedrich, M. Carmo and W. Lehnert, J. Electrochem. Soc., 2023, 170, 034508, DOI:10.1149/1945-7111/acc1a5.
- E. Leonard, A. D. Shum, N. Danilovic, C. Capuano, K. E. Ayers, L. M. Pant, A. Z. Weber, X. Xiao, D. Y. Parkinson and I. V. Zenyuk, Sustain. Energy Fuels, 2020, 4, 921–931, 10.1039/C9SE00364A.
- M. A. Hoeh, T. Arlt, I. Manke, J. Banhart, D. L. Fritz, W. Maier and W. Lehnert, Electrochem. Commun., 2015, 55, 55–59, DOI:10.1016/j.elecom.2015.03.009.
- D. Aili, M. R. Kraglund, S. C. Rajappan, D. Serhiichuk, Y. Xia, V. Deimede, J. Kallitsis, C. Bae, P. Jannasch, D. Henkensmeier and J. O. Jensen, ACS Energy Lett., 2023, 8, 1900–1910, DOI:10.1021/acsenergylett.3c00185.
- H. Ito, N. Miyazaki, S. Sugiyama, M. Ishida, Y. Nakamura, S. Iwasaki, Y. Hasegawa and A. Nakano, J. Appl. Electrochem., 2018, 48, 305–316, DOI:10.1007/s10800-018-1159-5.
- I. Vincent, A. Kruger and D. Bessarabov, Int. J. Hydrogen Energy, 2017, 42, 10752–10761, DOI:10.1016/j.ijhydene.2017.03.069.
- S. Siracusano, A. Di Blasi, V. Baglio, G. Brunaccini, N. Briguglio, A. Stassi, R. Ornelas, E. Trifoni, V. Antonucci and A. S. Aricò, Int. J. Hydrogen Energy, 2011, 36, 3333–3339, DOI:10.1016/j.ijhydene.2010.12.044.
- S. A. Grigoriev, K. A. Dzhus, D. G. Bessarabov and P. Millet, Int. J. Hydrogen Energy, 2014, 39, 20440–20446, DOI:10.1016/j.ijhydene.2014.05.043.
- J. Brauns, J. Schönebeck, M. R. Kraglund, D. Aili, J. Hnát, J. Žitka, W. Mues, J. O. Jensen, K. Bouzek and T. Turek, J. Electrochem. Soc., 2021, 168, 014510, DOI:10.1149/1945-7111/abda57.
- G. Yang, J. Mo, Z. Kang, F. A. List, J. B. Green, S. S. Babu and F.-Y. Zhang, Int. J. Hydrogen Energy, 2017, 42, 14734–14740, DOI:10.1016/j.ijhydene.2017.04.100.
- M. Schalenbach, O. Kasian and K. J. J. Mayrhofer, Int. J. Hydrogen Energy, 2018, 43, 11932–11938, DOI:10.1016/j.ijhydene.2018.04.219.
- V. N. Kuleshov, N. V. Kuleshov, S. A. Grigoriev, E. Y. Udris, P. Millet and A. S. Grigoriev, Int. J. Hydrogen Energy, 2016, 41, 36–45, DOI:10.1016/j.ijhydene.2015.10.141.
- M. Canavar and Y. Kaplan, Int. J. Hydrogen Energy, 2015, 40, 7829–7834, DOI:10.1016/j.ijhydene.2014.11.101.
- T. Schuler, J. M. Ciccone, B. Krentscher, F. Marone, C. Peter, T. J. Schmidt and F. N. Büchi, Adv. Energy Mater., 2020, 10, 1903216, DOI:10.1002/aenm.201903216.
- T. Schuler, R. De Bruycker, T. J. Schmidt and F. N. Büchi, J. Electrochem. Soc., 2019, 166, F270, DOI:10.1149/2.0561904jes.
- C. C. Weber, J. A. Wrubel, L. Gubler, G. Bender, S. De Angelis and F. N. Büchi, ACS Appl. Mater. Interfaces, 2023, 15, 34750–34763, DOI:10.1021/acsami.3c04151.
- D. Kulkarni, R. Ouimet, B. Erb, D. Y. Parkinson, H.-M. Chang, C. Wang, A. Smeltz, C. Capuano and I. V. Zenyuk, ACS Appl. Mater. Interfaces, 2023, 15, 48060–48071, DOI:10.1021/acsami.3c06899.
- E. Leonard, A. D. Shum, S. Normile, D. C. Sabarirajan, D. G. Yared, X. Xiao and I. V. Zenyuk, Electrochim. Acta, 2018, 276, 424–433, DOI:10.1016/j.electacta.2018.04.144.
- J. Disch, L. Bohn, S. Koch, M. Schulz, Y. Han, A. Tengattini, L. Helfen, M. Breitwieser and S. Vierrath, Nat. Commun., 2022, 13, 6099, DOI:10.1038/s41467-022-33694-y.
- M. Gebhard, M. Paulisch, A. Hilger, D. Franzen, B. Ellendorff, T. Turek, I. Manke and C. Roth, Materials, 2019, 12, 1275 CrossRef CAS PubMed.
- M. A. Hoeh, T. Arlt, N. Kardjilov, I. Manke, J. Banhart, D. L. Fritz, J. Ehlert, W. Lüke and W. Lehnert, ECS Meet. Abstr., 2015, 1514, DOI:10.1149/MA2015-02/37/1514.
- S. Koch, J. Disch, S. K. Kilian, Y. Han, L. Metzler, A. Tengattini, L. Helfen, M. Schulz, M. Breitwieser and S. Vierrath, RSC Adv., 2022, 12, 20778–20784, 10.1039/D2RA03846C.
- C. H. Lee, J. K. Lee, B. Zhao, K. F. Fahy, J. M. LaManna, E. Baltic, D. S. Hussey, D. L. Jacobson, V. P. Schulz and A. Bazylak, J. Power Sources, 2020, 446, 227312, DOI:10.1016/j.jpowsour.2019.227312.
- M. Maier, J. Dodwell, R. Ziesche, C. Tan, T. Heenan, J. Majasan, N. Kardjilov, H. Markötter, I. Manke, L. Castanheira, G. Hinds, P. R. Shearing and D. J. L. Brett, J. Power Sources, 2020, 455, 227968, DOI:10.1016/j.jpowsour.2020.227968.
- J. Seweryn, J. Biesdorf, P. Boillat and T. J. Schmidt, ECS Meet. Abstr., 2015, 649, DOI:10.1149/MA2015-03/3/649.
- J. Seweryn, J. Biesdorf, T. J. Schmidt and P. Boillat, J. Electrochem. Soc., 2016, 163, F3009, DOI:10.1149/2.0641607jes.
- I. Manke, C. Hartnig, N. Kardjilov, M. Messerschmidt, A. Hilger, M. Strobl, W. Lehnert and J. Banhart, Appl. Phys. Lett., 2008, 92, 244101, DOI:10.1063/1.2946664.
- C. Minnaar, F. De Beer and D. Bessarabov, Energy Fuels, 2020, 34, 1014–1023, DOI:10.1021/acs.energyfuels.9b03814.
- S. D. Ebbesen and M. Mogensen, J. Power Sources, 2009, 193, 349–358, DOI:10.1016/j.jpowsour.2009.02.093.
- S. Shiva Kumar and H. Lim, Energy Rep., 2022, 8, 13793–13813, DOI:10.1016/j.egyr.2022.10.127.
- M. N. I. Salehmin, T. Husaini, J. Goh and A. B. Sulong, Energy Convers. Manage., 2022, 268, 115985, DOI:10.1016/j.enconman.2022.115985.
- IRENA, Green Hydrogen Cost Reduction: Scaling up Electrolysers to Meet the 1.5 °C Climate Goal International Renewable Energy Agengy, Abu Dhabi, 2020 Search PubMed.
- P. J. Withers, C. Bouman, S. Carmignato, V. Cnudde, D. Grimaldi, C. K. Hagen, E. Maire, M. Manley, A. Du Plessis and S. R. Stock, Nat. Rev. Methods Primers, 2021, 1, 18, DOI:10.1038/s43586-021-00015-4.
- E. A. Zwanenburg, M. A. Williams and J. M. Warnett, Meas. Sci. Technol., 2022, 33, 012003, DOI:10.1088/1361-6501/ac354a.
- C. Ponchut, N. Tartoni and D. Pennicard, Radiat. Meas., 2021, 140, 106459, DOI:10.1016/j.radmeas.2020.106459.
- M. Strobl, Nucl. Instrum. Methods Phys. Res. Sect. A Accel. Spectrom. Detect. Assoc. Equip., 2009, 604, 646–652, DOI:10.1016/j.nima.2009.03.075.
- M. Shukla, N. Ray and T. Patel, in Neutron Imaging: Basics, Techniques and Applications, ed. D. K. Aswal, P. S. Sarkar and Y. S. Kashyap, Springer Singapore, Singapore, 2022, DOI:10.1007/978-981-16-6273-7_4, pp. 97–162.
- E. H. Lehmann, J. Imaging, 2017, 3(4), 52, DOI:10.3390/jimaging3040052.
- NIST, Neutron scattering lengths and cross sections, https://www.ncnr.nist.gov/resources/n-lengths/, accessed 17th April, 2024.
- Nikon XT H 225, https://nxct.ac.uk/facilities/university-college-london/nikon-xth-225/, accessed 27/06/24, 2024.
- D. S. Hussey, J. M. LaManna, E. Baltic and D. L. Jacobson, Nucl. Instrum. Methods Phys. Res. Sect. A Accel. Spectrom. Detect. Assoc. Equip., 2017, 866, 9–12, DOI:10.1016/j.nima.2017.05.035.
- M. Morgano, P. Trtik, M. Meyer, E. H. Lehmann, J. Hovind and M. Strobl, Opt. Express, 2018, 26, 1809–1816, DOI:10.1364/OE.26.001809.
- C. D. Pruitt, R. J. Charity, L. G. Sobotka, J. M. Elson, D. E. M. Hoff, K. W. Brown, M. C. Atkinson, W. H. Dickhoff, H. Y. Lee, M. Devlin, N. Fotiades and S. Mosby, Phys. Rev. C, 2020, 102, 034601, DOI:10.1103/PhysRevC.102.034601.
- M. Zlobinski, U. Babic, M. Fikry, L. Gubler, T. J. Schmidt and P. Boillat, J. Electrochem. Soc., 2020, 167, 144509, DOI:10.1149/1945-7111/abc83b.
- N. Kardjilov, I. Manke, A. Hilger, M. Strobl and J. Banhart, Mater. Today, 2011, 14, 248–256, DOI:10.1016/S1369-7021(11)70139-0.
- F. Foglia, S. Lyonnard, V. G. Sakai, Q. Berrod, J.-M. Zanotti, G. Gebel, A. J. Clancy and P. F. McMillan, J. Phys.: Condens. Matter, 2021, 33, 264005, DOI:10.1088/1361-648X/abfc10.
- P. J. Kim, C. H. Lee, J. K. Lee, K. F. Fahy and A. Bazylak, J. Electrochem. Soc., 2020, 167, 124522, DOI:10.1149/1945-7111/abb173.
- U. Bonse and F. Busch, Prog. Biophys. Mol. Biol., 1996, 65, 133–169, DOI:10.1016/S0079-6107(96)00011-9.
- J. T. Lang, D. Kulkarni, C. W. Foster, Y. Huang, M. A. Sepe, S. Shimpalee, D. Y. Parkinson and I. V. Zenyuk, Chem. Rev., 2023, 123, 9880–9914, DOI:10.1021/acs.chemrev.2c00873.
- R. F. Ziesche, N. Kardjilov, W. Kockelmann, D. J. L. Brett and P. R. Shearing, Joule, 2022, 6, 35–52, DOI:10.1016/j.joule.2021.12.007.
- T. M. M. Heenan, C. Tan, J. Hack, D. J. L. Brett and P. R. Shearing, Mater. Today, 2019, 31, 69–85, DOI:10.1016/j.mattod.2019.05.019.
- N. Schlüter, P. Novák and D. Schröder, Adv. Energy Mater., 2022, 12, 2200708, DOI:10.1002/aenm.202200708.
- A. B. Moss, J. Hätinen, P. Kúš, S. Garg, M. Mirolo, I. Chorkendorff, B. Seger and J. Drnec, J. Power Sources, 2023, 562, 232754, DOI:10.1016/j.jpowsour.2023.232754.
- M. Zlobinski, T. Schuler, F. N. Büchi, T. J. Schmidt and P. Boillat, J. Electrochem. Soc., 2021, 168, 014505, DOI:10.1149/1945-7111/abcf19.
- J. Scharf, M. Chouchane, D. P. Finegan, B. Lu, C. Redquest, M.-c. Kim, W. Yao, A. A. Franco, D. Gostovic, Z. Liu, M. Riccio, F. Zelenka, J.-M. Doux and Y. S. Meng, Nat. Nanotechnol., 2022, 17, 446–459, DOI:10.1038/s41565-022-01081-9.
- S. S. Alrwashdeh, F. M. Alsaraireh, M. A. Saraireh, H. Markötter, N. Kardjilov, M. Klages, J. Scholta and I. Manke, AIMS Energy, 2018, 6, 607–614, DOI:10.3934/energy.2018.4.607.
- R. F. Ziesche, J. Hack, L. Rasha, M. Maier, C. Tan, T. M. M. Heenan, H. Markötter, N. Kardjilov, I. Manke, W. Kockelmann, D. J. L. Brett and P. R. Shearing, Nat. Commun., 2022, 13, 1616, DOI:10.1038/s41467-022-29313-5.
- O. Panchenko, E. Borgardt, W. Zwaygardt, F. J. Hackemüller, M. Bram, N. Kardjilov, T. Arlt, I. Manke, M. Müller, D. Stolten and W. Lehnert, J. Power Sources, 2018, 390, 108–115, DOI:10.1016/j.jpowsour.2018.04.044.
- Q. Meyer, J. Hack, N. Mansor, F. Iacoviello, J. J. Bailey, P. R. Shearing and D. J. L. Brett, Fuel Cells, 2019, 19, 35–42, DOI:10.1002/fuce.201800047.
- M. Bierling, D. McLaughlin, B. Mayerhöfer and S. Thiele, Adv. Energy Mater., 2023, 13, 2203636, DOI:10.1002/aenm.202203636.
- C. Hartnig, I. Manke, R. Kuhn, S. Kleinau, J. Goebbels and J. Banhart, J. Power Sources, 2009, 188, 468–474, DOI:10.1016/j.jpowsour.2008.12.023.
- J. K. Lee, G. Y. Lau, M. Sabharwal, A. Z. Weber, X. Peng and M. C. Tucker, J. Power Sources, 2023, 559, 232606, DOI:10.1016/j.jpowsour.2022.232606.
- J. K. Lee, C. Lee, K. F. Fahy, P. J. Kim, J. M. LaManna, E. Baltic, D. L. Jacobson, D. S. Hussey, S. Stiber, A. S. Gago, K. A. Friedrich and A. Bazylak, Energy Convers. Manage., 2020, 226, 113545, DOI:10.1016/j.enconman.2020.113545.
- J. O. Majasan, F. Iacoviello, J. I. S. Cho, M. Maier, X. Lu, T. P. Neville, I. Dedigama, P. R. Shearing and D. J. L. Brett, Int. J. Hydrogen Energy, 2019, 44, 19519–19532, DOI:10.1016/j.ijhydene.2019.05.222.
- T. Schuler, T. J. Schmidt and F. N. Büchi, J. Electrochem. Soc., 2019, 166, F555, DOI:10.1149/2.1241908jes.
- C. C. Weber, S. De Angelis, R. Meinert, C. Appel, M. Holler, M. Guizar-Sicairos, L. Gubler and F. N. Büchi, EES Catal., 2024, 2, 585–602, 10.1039/D3EY00279A.
- L. Zielke, A. Fallisch, N. Paust, R. Zengerle and S. Thiele, RSC Adv., 2014, 4, 58888–58894, 10.1039/C4RA12402B.
- T. Schuler, C. C. Weber, J. A. Wrubel, L. Gubler, B. Pivovar, F. N. Büchi and G. Bender, Adv. Energy Mater., 2024, 14, 2302786, DOI:10.1002/aenm.202302786.
- M. Suermann, K. Takanohashi, A. Lamibrac, T. J. Schmidt and F. N. Büchi, J. Electrochem. Soc., 2017, 164, F973, DOI:10.1149/2.13517109jes.
- P. Lettenmeier, S. Kolb, N. Sata, A. Fallisch, L. Zielke, S. Thiele, A. S. Gago and K. A. Friedrich, Energy Environ. Sci., 2017, 10, 2521–2533, 10.1039/C7EE01240C.
- S. De Angelis, T. Schuler, M. Sabharwal, M. Holler, M. Guizar-Sicairos, E. Müller and F. N. Büchi, Sci. Rep., 2023, 13, 4280, DOI:10.1038/s41598-023-30960-x.
- T. Seip, J. K. Lee, M. Ge, W.-K. Lee, N. Shaigan, M. Dinu, K. Fatih and A. Bazylak, Electrochim. Acta, 2023, 462, 142701, DOI:10.1016/j.electacta.2023.142701.
- D. P. Finegan, I. Squires, A. Dahari, S. Kench, K. L. Jungjohann and S. J. Cooper, ACS Energy Lett., 2022, 7, 4368–4378, DOI:10.1021/acsenergylett.2c01996.
- Y. Pang and Y. Wang, Energy AI., 2023, 14, 100265, DOI:10.1016/j.egyai.2023.100265.
- A. D. Santamaria, M. Mortazavi, V. Chauhan, J. Benner, O. Philbrick, R. Clemente, H. Jia and C. Ling, J. Electrochem. Soc., 2021, 168, 054505, DOI:10.1149/1945-7111/abfa5c.
- M. D. Uchic, L. Holzer, B. J. Inkson, E. L. Principe and P. Munroe, MRS Bull., 2007, 32, 408–416, DOI:10.1557/mrs2007.64.
- E. Hoppe, S. Holtwerth, M. Müller and W. Lehnert, J. Power Sources, 2023, 578, 233242, DOI:10.1016/j.jpowsour.2023.233242.
- C. Hartnig, I. Manke, R. Kuhn, N. Kardjilov, J. Banhart and W. Lehnert, Appl. Phys. Lett., 2008, 92, 134106, DOI:10.1063/1.2907485.
- U. Panchenko, T. Arlt, I. Manke, M. Müller, D. Stolten and W. Lehnert, Fuel Cells, 2020, 20, 300–306, DOI:10.1002/fuce.201900055.
- F. I. Reyna-Peña, A. Atienza-Márquez, S. Jang, R. Shiono, K. Shigemasa, T. Araki, K. Nagasawa and S. Mitsushima, Int. J. Hydrogen Energy, 2024, 50, 787–798, DOI:10.1016/j.ijhydene.2023.08.132.
- D. P. Finegan, A. Vamvakeros, L. Cao, C. Tan, T. M. M. Heenan, S. R. Daemi, S. D. M. Jacques, A. M. Beale, M. Di Michiel, K. Smith, D. J. L. Brett, P. R. Shearing and C. Ban, Nano Lett., 2019, 19, 3811–3820, DOI:10.1021/acs.nanolett.9b00955.
- D. Matras, T. E. Ashton, H. Dong, M. Mirolo, I. Martens, J. Drnec, J. A. Darr, P. D. Quinn, S. D. M. Jacques, A. M. Beale and A. Vamvakeros, J. Power Sources, 2022, 539, 231589, DOI:10.1016/j.jpowsour.2022.231589.
- K. M. Ø. Jensen, X. Yang, J. V. Laveda, W. G. Zeier, K. A. See, M. D. Michiel, B. C. Melot, S. A. Corr and S. J. L. Billinge, J. Electrochem. Soc., 2015, 162, A1310, DOI:10.1149/2.0771507jes.
- A. Vamvakeros, D. Matras, T. E. Ashton, A. A. Coelho, H. Dong, D. Bauer, Y. Odarchenko, S. W. T. Price, K. T. Butler, O. Gutowski, A.-C. Dippel, M. v. Zimmerman, J. A. Darr, S. D. M. Jacques and A. M. Beale, Small Methods, 2021, 5, 2100512, DOI:10.1002/smtd.202100512.
- A. Vamvakeros, S. D. M. Jacques, M. Di Michiel, D. Matras, V. Middelkoop, I. Z. Ismagilov, E. V. Matus, V. V. Kuznetsov, J. Drnec, P. Senecal and A. M. Beale, Nat. Commun., 2018, 9, 4751, DOI:10.1038/s41467-018-07046-8.
- I. Martens, A. Vamvakeros, R. Chattot, M. V. Blanco, M. Rasola, J. Pusa, S. D. M. Jacques, D. Bizzotto, D. P. Wilkinson, B. Ruffmann, S. Heidemann, V. Honkimäki and J. Drnec, J. Power Sources, 2019, 437, 226906, DOI:10.1016/j.jpowsour.2019.226906.
- T. Li, T. M. M. Heenan, M. F. Rabuni, B. Wang, N. M. Farandos, G. H. Kelsall, D. Matras, C. Tan, X. Lu, S. D. M. Jacques, D. J. L. Brett, P. R. Shearing, M. Di Michiel, A. M. Beale, A. Vamvakeros and K. Li, Nat. Commun., 2019, 10, 1497, DOI:10.1038/s41467-019-09427-z.
- F. Schaff, M. Bech, P. Zaslansky, C. Jud, M. Liebi, M. Guizar-Sicairos and F. Pfeiffer, Nature, 2015, 527, 353–356, DOI:10.1038/nature16060.
- M. Dierolf, A. Menzel, P. Thibault, P. Schneider, C. M. Kewish, R. Wepf, O. Bunk and F. Pfeiffer, Nature, 2010, 467, 436–439, DOI:10.1038/nature09419.
- F. Pfeiffer, Nat. Photonics, 2018, 12, 9–17, DOI:10.1038/s41566-017-0072-5.
- M. Zlobinski, T. Schuler, F. N. Büchi, T. J. Schmidt and P. Boillat, J. Electrochem. Soc., 2020, 167, 084509, DOI:10.1149/1945-7111/ab8c89.
- B. Zhao, C. Lee, J. K. Lee, K. F. Fahy, J. M. LaManna, E. Baltic, D. L. Jacobson, D. S. Hussey and A. Bazylak, Cell Rep. Phys. Sci., 2021, 2, 100580, DOI:10.1016/j.xcrp.2021.100580.
- C. Lee, R. Banerjee, N. Ge, J. K. Lee, B. Zhao, E. Baltic, J. M. LaManna, D. S. Hussey, D. L. Jacobson, R. Abouatallah, R. Wang and A. Bazylak, Electrochim. Acta, 2018, 279, 91–98, DOI:10.1016/j.electacta.2018.05.066.
- C. Lee, J. K. Lee, M. G. George, K. F. Fahy, J. M. LaManna, E. Baltic, D. S. Hussey, D. L. Jacobson and A. Bazylak, Energy Convers. Manage., 2020, 213, 112797, DOI:10.1016/j.enconman.2020.112797.
- U. Babic, M. Zlobinski, T. J. Schmidt, P. Boillat and L. Gubler, J. Electrochem. Soc., 2019, 166, F610, DOI:10.1149/2.0851910jes.
- H. Becker, J. Murawski, D. V. Shinde, I. E. L. Stephens, G. Hinds and G. Smith, Sustain. Energy Fuels, 2023, 7, 1565–1603, 10.1039/D2SE01517J.
- S. Renz, T. Arlt, N. Kardjilov, L. Helfen, C. Couture, A. Tengattini, F. Lohmann-Richters and W. Lehnert, ECS Meet. Abstr., 2022, 1448, DOI:10.1149/MA2022-02391448mtgabs.
- O. J. Guerra, H. M. Almajed, W. A. Smith, A. Somoza-Tornos and B.-M. S. Hodge, Joule, 2023, 7, 1111–1133, DOI:10.1016/j.joule.2023.05.002.
- J. Hack, R. F. Ziesche, M. Fransson, T. Suter, L. Helfen, C. Couture, N. Kardjilov, A. Tengattini, P. Shearing and D. Brett, J. Phys.: Energy, 2024, 6, 025021, DOI:10.1088/2515-7655/ad3984.
- O. F. Selamet, U. Pasaogullari, D. Spernjak, D. S. Hussey, D. L. Jacobson and M. D. Mat, Int. J. Hydrogen Energy, 2013, 38, 5823–5835, DOI:10.1016/j.ijhydene.2013.02.087.
- J. Hack, P. A. García-Salaberri, M. D. R. Kok, R. Jervis, P. R. Shearing, N. Brandon and D. J. L. Brett, J. Electrochem. Soc., 2020, 167, 013545, DOI:10.1149/1945-7111/ab6983.
- Y. D. Wang, Q. Meyer, K. Tang, J. E. McClure, R. T. White, S. T. Kelly, M. M. Crawford, F. Iacoviello, D. J. L. Brett, P. R. Shearing, P. Mostaghimi, C. Zhao and R. T. Armstrong, Nat. Commun., 2023, 14, 745, DOI:10.1038/s41467-023-35973-8.
- A. Valente, D. Iribarren and J. Dufour, Int. J. Hydrogen Energy, 2019, 44, 20965–20977, DOI:10.1016/j.ijhydene.2019.01.110.
- T. Uekert, H. M. Wikoff and A. Badgett, Adv. Sustainable Syst., 2024, 8, 2300449, DOI:10.1002/adsu.202300449.
- A. Ran, S. Chen, S. Zhang, S. Liu, Z. Zhou, P. Nie, K. Qian, L. Fang, S.-X. Zhao, B. Li, F. Kang, X. Zhou, H. Sun, X. Zhang and G. Wei, RSC Adv., 2020, 10, 19117–19123, 10.1039/D0RA03602A.
| This journal is © The Royal Society of Chemistry 2024 |