
 Open Access Article
 This Open Access Article is licensed under a Creative Commons Attribution-Non Commercial 3.0 Unported Licence
Interaction of anionic Fe3O4 nanoparticles with lipid vesicles: a review on deformation and poration under various conditions
Mohammad Abu Sayem Karal
 *a,
Md. Masum Billah
*b,
Tawfika Nasrin
a and
Md. Moniruzzaman
a
*a,
Md. Masum Billah
*b,
Tawfika Nasrin
a and
Md. Moniruzzaman
a
aDepartment of Physics, Bangladesh University of Engineering and Technology, Dhaka 1000, Bangladesh. E-mail: asayem221@phy.buet.ac.bd; Fax: +880-2-58613046; Tel: +880-2-9665613
bDepartment of Physics, Jashore University of Science and Technology, Jashore 7408, Bangladesh. E-mail: mm.billah@just.edu.bd; Fax: +880-2-42142012; Tel: +880-242142046
First published on 19th August 2024
Abstract
This review focuses on the deformation and poration of lipid vesicles caused by the interaction of anionic magnetite nanoparticles (MNPs). Effects of various factors, such as surface charge density, salt and sugar concentrations in buffer, membrane cholesterol content, polymer-grafted phospholipid, and membrane potential have been discussed for the interaction of MNPs with lipid vesicles. To quantify these effects on the vesicles, compactness, fraction of deformation and poration, dynamics of membrane permeation, and kinetics of membrane permeation have been critically evaluated. The review explores the potential advancements as well as future directions of the research field in the biomedical application of MNPs.
 Mohammad Abu Sayem Karal | Mohammad Abu Sayem Karal is a Professor in the Department of Physics at Bangladesh University of Engineering and Technology, Bangladesh. He obtained his PhD from Shizuoka University, Japan, specializing in membrane biophysics. His research focuses on elucidating the mechanisms of lipid membrane rupture and pore formation induced by nanoparticles, irreversible electroporation, micropipette aspiration, and antimicrobial peptides. |
 Md. Masum Billah | Md. Masum Billah serves as an Assistant Professor in the Department of Physics at Jashore University of Science and Technology, Bangladesh. He earned his PhD from Shizuoka University, Japan, with a specialization in membrane biophysics. His research interest is to examine the physicochemical properties of vesicles/cells and to reveal the effect of osmotic pressure and lipid compositions on the antimicrobial peptides-induced pore formation and pore evolution in model membranes, and their mechanisms. |
 Tawfika Nasrin | Tawfika Nasrin received Master of Philosophy degree from Department of Physics, Bangladesh University of Engineering and Technology, Bangladesh. Her research interest is investigating the statics and dynamics of lipid vesicles while interacting with nanoparticles. |
 Md. Moniruzzaman | Md. Moniruzzaman received Master of Science degree from Department of Physics, Bangladesh University of Engineering and Technology, Bangladesh. His research interest is revealing the mechanism of membrane permeation in lipid vesicles induced by nanoparticles under various membrane potentials. |
1. Introduction
Nanoparticles are considered to be potential biomedical tools, offering promise in both diagnostic and therapeutic endeavors due to their adaptability and compatibility with biological systems.1–5 Magnetite nanoparticles (Fe3O4; MNPs) exhibit promising applications in various fields including MRI contrast, precious delivery of drugs, bacteria identification, cell labeling, bioseparation, and anticancer therapy due to their physical and chemical properties.6–11 For instance, MNPs can be enveloped with either pharmaceutical compounds or biomolecules to facilitate interaction with, or binding to, specific biological targets, thus enhancing their suitability for various medical interventions.12–15 However, the adverse effects of the NPs have also been reported.16–21 MNPs are found in the environment from natural sources like volcanic eruptions and meteorite impacts, and from human activities such as industrial processes, power plants, and marine seeds.22,23 The presence of MNPs potentially impacts human health and the environment.21 Depending on the MNPs size, shape and coating, they have varying characteristics and levels of toxicity.24 The substantial ratio of surface area to volume of MNPs induces aggregation to minimize surface energies.25 Moreover, the inherent high chemical reactivity and subsequent oxidation of uncoated MNPs necessitate strategies for their structural and property preservation, commonly achieved through coating with the organic/inorganic molecules. This coating not only enhances stability but also facilitates functionalization of the MNPs.26–30 The type of coating also affects their interactions with cell membranes.31Recently, researchers have focussed on studying the giant unilamellar vesicles (GUVs) as a model of cells in various experiments.32–35 Vesicle deformation and membrane poration are two vital processes that result from interactions between MNPs and biomembranes/lipid bilayers.36,37 The interaction with anionic MNPs provides insights into membrane permeability, fluidity, and mechanism of interaction.38,39 Studies on their interaction with GUVs help in enhancing drug delivery.40 MNPs used in magnetic hyperthermia can be optimized by studying their interactions with GUVs.7 In diagnostic and imaging applications, MNPs can enhance the sensitivity and specificity of biosensors,41 improve the contrast in MRI, and their interaction with GUVs is essential for improving imaging contrast and biocompatibility.42 In toxicological studies, developing biocompatible NPs involves understanding their interaction with GUVs.43
Comprehending the mechanism of interactions between MNPs and vesicles membranes is pivotal for ensuring their safe and efficient utilization in medicine.44,45 Until now, there has been a lack of comprehensive review devoted to investigate the impacts of MNPs on vesicle deformation and membrane damage (poration or rupture) under various experimental conditions. We discussed the interaction of MNPs with cell mimetic GUVs under various membrane charges, buffer salt concentrations, sugar concentrations, membrane cholesterols, polymer-grafted phospholipids, and membrane potentials. These conditions greatly influence the membrane bending rigidity.46–49 We discussed several parameters, e.g., compactness, fraction of deformation and poration, dynamics of membrane permeation, and the kinetics of permeation.
2. Experimental techniques for preparing vesicles and NPs
Natural swelling is a popular approach for preparing the GUVs (size 1 μm to 100 μm)50 by varying membrane surface charge and buffer salt concentration,51 sugar concentration,52 polymer grafted phospholipid,53 and membrane potential.54 Purification is essential to separate the GUVs from lipid aggregates and small vesicles.55,56 The extrusion method is also a well-known technique to prepare liposomes, such as large unilamellar lipid vesicles (LUVs) of sizes 10 nm to 1 μm.57 MNPs of size 18 nm were prepared using the green synthesis technique.58 The zeta potential of the MNPs was −21.3 ± 4.8 mV.51 The interaction of MNPs with GUVs was conducted using an inverted phase contrast fluorescence microscope. A modified oxidative hydrolysis method was employed for coating the MNPs cores of 25–30 nm with polyethyleneimine (PEI-MNPs) and poly(acrylic acid) (PAA-MNPs).59 The zeta potential evolution of PEI-MNPs and PAA-MNPs after incubation in DMEM supplemented with FBS showed −12 mV and −11 mV, respectively. The in vitro experiments on PEI-MNPs and PAA-MNPs uptake were carried out on human neuroblastoma cell line (SH-SY5Y).3. Findings and interpretations
3.1 Effect of surface charge and salt concentration
 | (1) |
 | ||
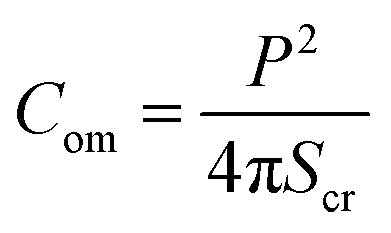
| Fig. 1 Deformation of GUV and compactness. Phase contrast images shows the deformation of a (a) DOPG/DOPC (60/40)-GUV and (b) DOPC-GUV interacted with 3.33 μg/mL MNPs. The numerical values above each image represent the duration (in minutes) of MNPs adsorption. (c) Time dependent compactness (Com) of the GUVs as shown in (a) and (b). (d) The MNPs concentration dependent of average compactness (Cavom) for various DOPG%. (e) The MNPs concentration dependent of Cavom for different NaCl concentrations. The figures have been adapted from ref. 51 with permission from Elsevier B. V., copyright 2020. | ||
In DOPC, hydrophilicity is maintained by a single dipole, wherein a phosphate group (PO2−) is separated by approximately 0.5 nm from a N+ choline group, forming a substantial dipole denoted as (P−–N+), with a considerable magnitude of around 20 debye.61 The orientation of the dipole vector is 50–80° concerning the normal to the bilayer surface.62 In DOPG, hydrophilicity is achieved through multiple short dipoles formed by OH groups, each with an equilibrium bond length of 0.097 nm. The total dipole moment of a PG molecule is 1.76 debye.63 The stronger adsorption of anionic MNPs onto DOPG/DOPC-GUVs compared to DOPC-GUVs leads to increased lateral tension in the external layer of the membrane. This elevation in tension results in greater total elastic energy and a mismatch in surface areas between the two layers (Fig. 1c). The impact of electrostatic interactions is crucial in colloidal systems and lipid vesicle suspensions.64–67 As the surface charge density increases, the repulsive forces among lipid molecules also rise, thereby enhancing electrostatic effects.68 On the other hand, higher salt ion in the colloidal solution acts to shield the surface charges of membrane lipids and leads to weaker the electrostatic effect.67,68 Thus, the electrostatic interaction effect is more pronounced at higher DOPG and lower NaCl concentrations. Consequently, higher DOPG (Fig. 1d) and lower NaCl concentration (Fig. 1e) correspond to higher Com values. Additionally, increased MNPs concentrations induce greater membrane tension, further enhancing compactness.
 | ||
| Fig. 2 Influence of membrane surface charge density and NaCl concentration on MNPs-induced fraction of deformation (Frd) of DOPG/DOPC-GUVs. (a) Time course of Frd induced by 3.33 μg/mL MNPs at various DOPG%. (b) Dependence of Frd on MNPs concentration for several DOPG%. (c) Time course of Frd induced by 3.33 μg/mL MNPs for different NaCl concentrations. (d) Dependence of Frd on the concentration of MNPs for various concentration of NaCl. The figures have been adapted from ref. 51 with permission from Elsevier B. V., copyright 2020. | ||
The formation of vesicles can result in various stationary forms with different shapes, each associated with its specific energy.72,73 The perfectly spherical shaped GUV is characterized by a minimum free energy (Es) compared to other stable forms. Nevertheless, there is invariably a finite chance for a GUV to maintain a stable non-spherical, or deformed, configuration, characterized by an energy (Ed) considerably exceeding that of the preferred spherical shape (Es). Under normal situation, the probability of a vesicle adopting a spherical shape is almost one (100%), while the probability of non-spherical shaped GUV is nearly zero. The fraction of deformed GUVs can be assessed accordingly.51
 | (2) |
The increases of Es due the adsorption of MNPs increase the possibility of getting non-spherical GUVs. The transition rate from a spherical to a non-spherical shape is maintained by the height of the barrier energy. As the energy of Es increases, the height of barrier energy decreases, resulting to increase the rate of transformation of spherical shaped vesicles to non-spherical ones.
3.2 Impact of sugar concentration
 | ||
| Fig. 3 The impact of sugar concentration on the calcein leakage from the interior of GUVs interacted with 3.33 μg/mL MNPs. a(i and iii) and b(i and iii) display the phase contrast images of DOPG/DOPC (40/60)-GUVs and DOPC-GUVs, respectively. The fluorescence images of the corresponding GUVs reveal a gradual reduction in calcein from the interior of the GUVs. The numbers on each image indicates the time (in second) after inducing the MNPs into the suspension of GUVs. Time dependent fluorescence intensity (FI) of calcein for (c) DOPG/DOPC (40/60)-GUVs and (e) DOPC-GUVs as displayed in (a) and (b), respectively. The inset displays the quick shift of FI over time. Time course of FI for several (d) DOPG/DOPC (40/60)-GUVs and (f) DOPC-GUVs under same condition. (g) The average time of poration varies in accordance with the concentration of sugar. The figures have been adapted from ref. 52 with permission from PLOS, copyright 2022. | ||
The time dependent FI of these representative GUVs are presented in Fig. 3(c) and (e), respectively. The decrease in FI of the GUV-lumen is attributed to the leakage of calcein molecules from the interior to the exterior of the GUVs. Consequently, upon interaction with MNPs, two distinct states of GUVs emerge: an intact state where luminal fluorescence remains unchanged, and a pore state characterized by the decrease in FI over time until reaching zero. Fig. 3(d) and (f) display the time dependent FI for several such GUVs, demonstrating that pore formation occurs at different times, indicating a stochastic process. Before starting the calcein leakage, MNPs initially bind to vesicles, inducing surface pressure on the membrane and subsequently leading to transmembrane pore. The stochastic formation of pore in several GUVs arises from the stochastic initiation of prepore in the membranes.87–89 The average time of poration increases with rising sugar concentrations for both GUV types (Fig. 3g).
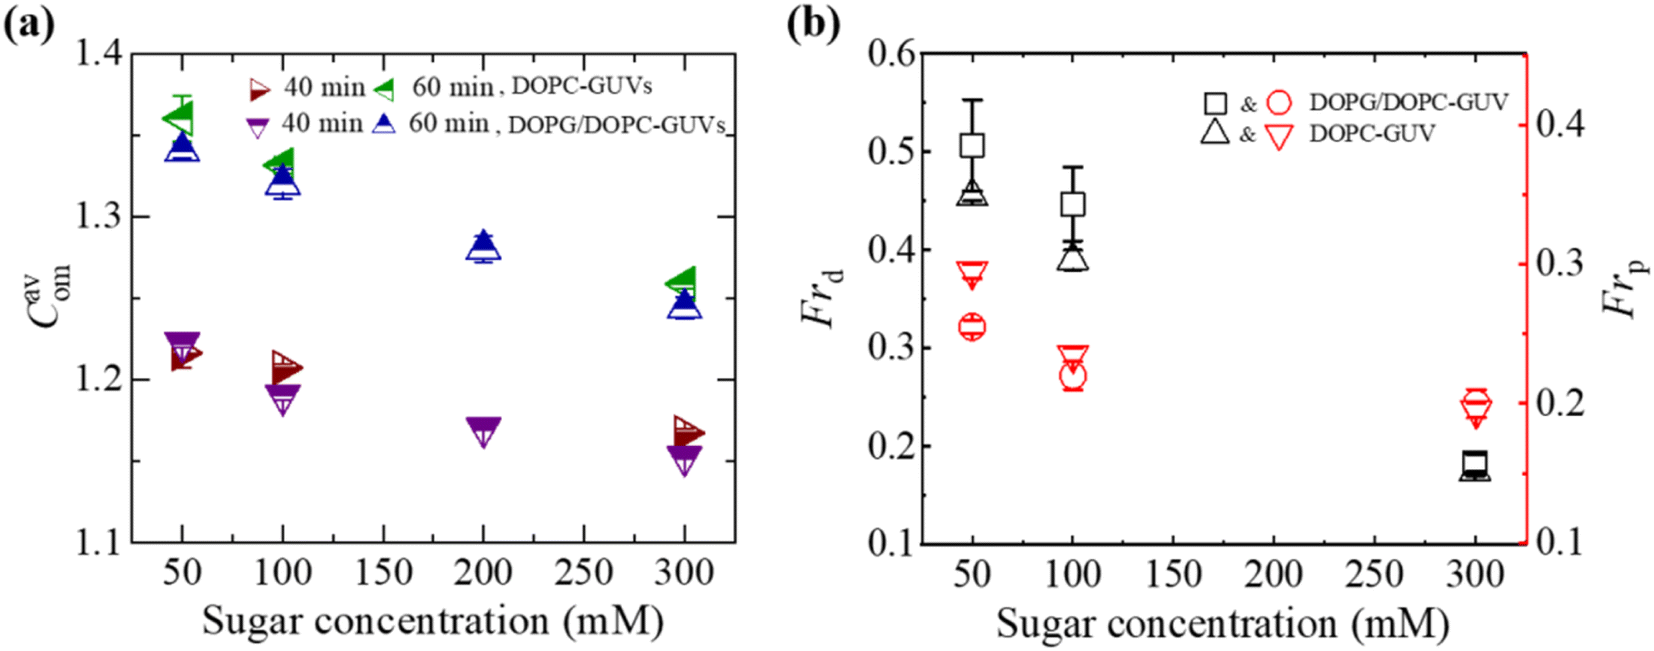 | ||
| Fig. 4 Sugar concentration dependent Cavom, Frd, and Frp in DOPG/DOPC (40/60)-GUVs and DOPC-GUVs interacted with 3.33 μg/mL MNPs. (a) Sugar concentration dependent Cavom at 40 and 60 min. (b) Sugar concentration dependent Frd and Frp at 40 min. The figures have been adapted from ref. 52 with permission from PLOS, copyright 2022. | ||
The bending rigidity of lipid membranes is influenced by the concentration of sugar.81,83 At relatively low sugar concentrations, sugar molecules interact strongly with the lipid membranes, positioning themselves between the head groups of phospholipids.90 This interaction reduces the area of the lipid head groups by increasing the surface pressure. In the aqueous phase, some of the carbohydrate molecules integrate into the membrane, acting as an additive.79,91 The interaction between sugar and lipid head groups at lower sugar concentrations is ascribed to enthalpy-driven forces, fostering an attractive interaction. Conversely, at higher sugar concentration, the repulsion between sugar and head group of lipids is attributed to entropy-driven forces. This interplay of attractive and repulsive interactions between sugar and lipid molecules aligns with findings from previous studies.92,93 Under a specific concentration of MNPs, surface pressure is lesser at higher sugar concentrations compared to lower ones, owing to the differing amount of bound sugar molecules at the bilayer interface. These variations in surface pressure significantly impact the membrane stability, compactness as well as deformation.
3.3 Cholesterol effect
 | ||
| Fig. 5 Calcein leakage from the interior of DOPG/DOPC/Chol-GUVs interacted with 3.33 μg/mL MNPs. (a) Phase contrast fluorescent microscopic images of the DOPG/DOPC/Chol (46/39/15)-GUVs. (i) and (iii) show the phase contrast image, and (ii) shows the fluorescence images of the gradual change in encapsulating calcein. The numerical values on each image represent the duration (in seconds) of MNPs introducing into the suspension of GUVs. (b) Time dependent fluorescence intensity (FI) of GUV as shown in (a). The inset displays the quick shift in FI over time. (c) Time dependent FI for five separate GUVs as the same conditions of (b). (d) Cholesterol dependent pore formation time (with SD). The figures have been adapted from ref. 95 with permission from Royal Society of Chemistry, copyright 2022. | ||
The stochastic nature of pore formation reveals variations in poration timing among multiple GUVs (Fig. 5c). The average poration time increases with higher cholesterol (Fig. 5d). In addition, the average poration time for DOPG/DOPC/Chol-GUVs is much greater than that of DOPC/Chol-GUVs. Thus, the incorporation of cholesterol into membranes suppresses MNPs-induced poration.
 | ||
| Fig. 6 The Cavom, Frd, and Frp of DOPG/DOPC/Chol-GUVs induced by 3.33 μg/mL MNPs. (a) Time course of Cavom for various cholesterol contents. (b) Cholesterol dependent Cavom of charged and neutral GUVs at 50 min. (c) Cholesterol dependent Frd and Frp at 50 min. The figures have been adapted from ref. 95 with permission from Royal Society of Chemistry, copyright 2022. | ||
3.4 Effect of polyethylene glycol (PEG)-grafted phospholipid
 | ||
| Fig. 7 Compactness of PEG-DOPE/DOPC-GUVs interacted with 2.00 μg/mL MNPs. (a) Time course of Cavom under various PEG-DOPE%. (b) PEG-DOPE% dependent Cavom at several times. The figures have been adapted from ref. 53 with permission from PLOS, copyright 2023. | ||
 | ||
| Fig. 8 Effects of PEG-DOPE on the calcein leakage from the interior of GUVs interacted with 2.00 μg/mL MNPs. (a) PEG-DOPE/DOPC (2/98)-GUV in the phase contrast and fluorescence images before and after the interaction of MNPs. The time in second indicates the time of interaction of MNPs with GUVs. (b) Time dependent fluorescence intensity (FI) as displayed in (a). (c) Time dependent FI for several GUVs under the same conditions of (b). (d) PEG-DOPE% dependent average poration time in GUVs. (e) PEG-DOPE% dependent Frd and Frp at 60 min of interaction of MNPs. The figures have been adapted from ref. 53 with permission from PLOS, copyright 2023. | ||
3.5 Effect of membrane potential
 | (3) |
To discuss the effects of φm, at first, 2.00 μg/mL MNPs interacted with DOPG/DOPC/GrA (40/60/0.01)-GUVs under φm = 0. Utilizing GrA (i.e., Gramicidin A) primarily aims to establish ion channels in the lipid bilayer, as studies earlier.109–111 These ion channels are effective in generating a membrane potential across the bilayer, thereby contributing to crucial cellular processes.104,112 Fig. 9a(i) shows the phase contrast image of the GUV before addition of MNPs. After adding the MNPs, the fluorescence of the GUV-lumen remained same for a while as shown in Fig. 9a(ii). The lumen intensity started decreasing gradually and at a certain stage, the GUV-lumen was indistinguishable from the background. The phase contrast image at 240 s of the same GUV shown in Fig. 9a(iii). Fig. 9b shows the time dependent leakage of fluorescence intensity (FI) as presented in Fig. 9a. The FI of GUV-lumen is shown to remain nearly constant until 68 s, and ∼90% calcein leaked out in 180 s. Fig. 9c shows the time dependent leakage of several GUVs, in which the leakage happens at different times. Subsequently, the impact of 2.00 μg per mL MNPs on DOPG/DOPC/GrA (40/60/0.01)-GUVs is examined under φm = – 90 mV, contrasting with observations made at φm = 0 mV. Fig. 9e presents microscopic images of a single GUV at φm = – 90 mV, showing the phase contrast image prior to MNPs addition (Fig. 9e(i)), fluorescence images captured at various interaction timepoints (Fig. 9e(ii)), and the phase contrast image at 240 s post-interaction (Fig. 9e(iii)). Additionally, Fig. 9f presents the time dependent FI observed in Fig. 9e.
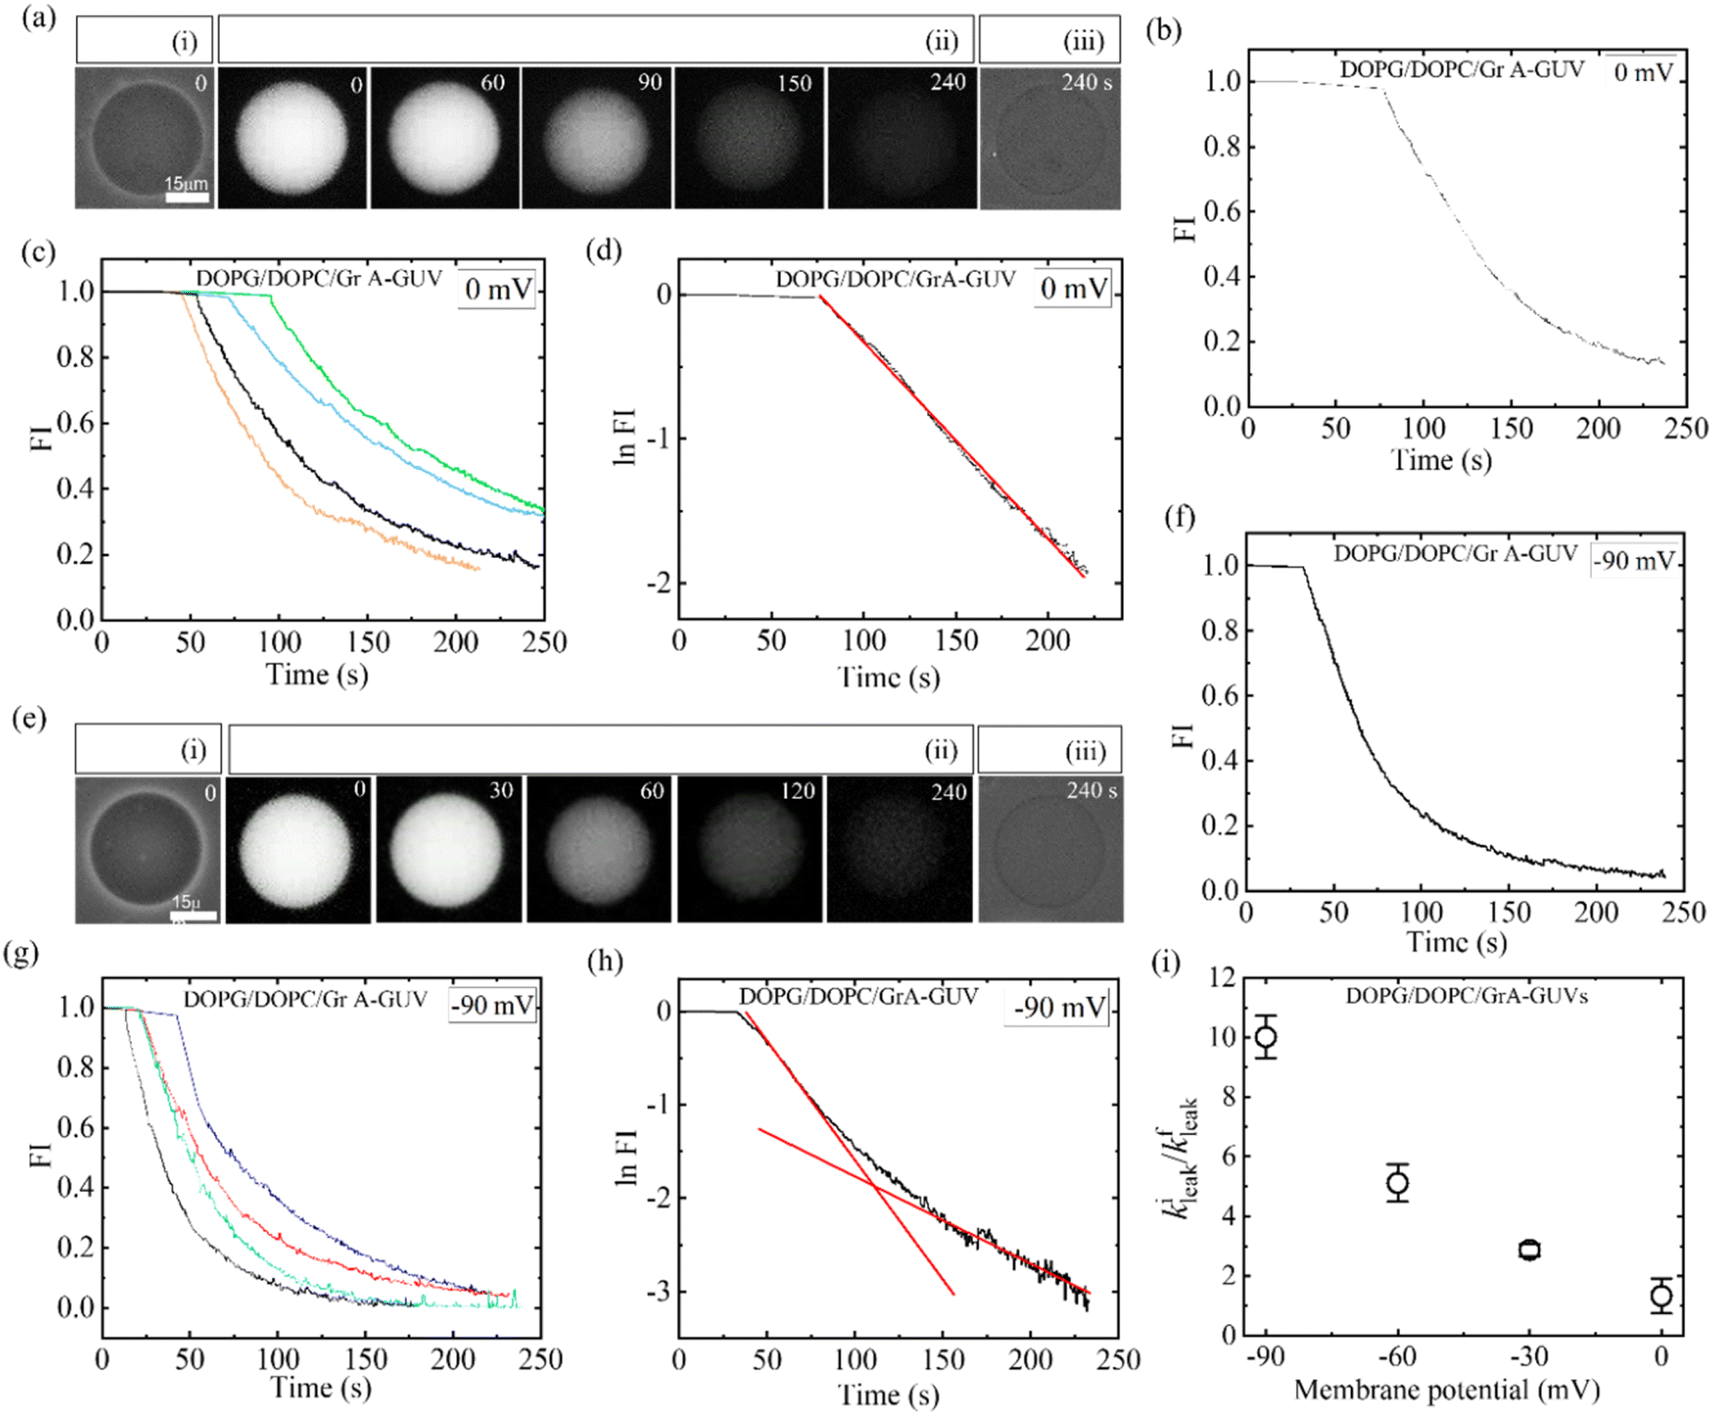 | ||
| Fig. 9 DOPG/DOPC/GrA (40/60/0.01)-GUVs under φm = 0 and φm = −90 mV interacted with 2.00 μg/mL MNPs. (a) Calcein leakage from the inside of GUV under φm = 0. Phase contrast images before and after the interaction of MNPs are shown in (i) and (iii), respectively. (ii) Fluorescence images of the GUV after the introduction of MNPs. (b) Time dependent fluorescence intensity (FI) as shown in (a). (c) Time dependent FI for several GUVs under the identical condition of (b). (d) Time dependent logarithm of FI under φm = 0, where the fitting curve of eqn (4) is represented by a solid red line. (e) Calcein leakage from the inside of GUV under φm = −90 mV. Phase contrast images captured both before and after the introduction of MNPs are shown in (i) and (iii), respectively. (ii) The fluorescence images of the same GUV following the interaction of MNPs. (f) Time dependent FI for several GUVs under the identical condition of (e). (g) Time dependent FI for several GUVs under the same condition of (f). The time of interaction, depicted in seconds, is annotated on each fluorescence image in panels (a) and (e). (h) Time dependent logarithm of FI at φm = – 90 mV, where the solid line (red) shows the fitting curve of eqn (4). (i) Membrane potential dependent kileak/kfleak. The figures have been adapted from ref. 54 with permission from Royal Society of Chemistry, copyright 2023. | ||
This indicates, until 35 s, the FI remains constant, and then gradually dropped to zero at 240 s. The same leakage pattern is observed for several GUVs under the same condition (Fig. 9g). At φm = – 90 mV, 60% GUVs experienced pores, but at φm = 0, it was 30%. At φm = 0 mV, the leakage exhibits a decay pattern consistent with a single exponential function (Fig. 9d), contrasting with the absence of such decay pattern observed at φm = – 90 mV (Fig. 9h). To obtain the leakage rate constant (kleak), the time course of logarithmic FI was fitted at initial state and final state separately using an equation as follows:
| ln[FIin(t)/FIin(t0)] = −kleak(t − t0) | (4) |
At φm = 0 mV, the leakage constant (kleak) for several GUVs was obtained (9.20 ± 0.09) × 10−3 s−1. For φm = −90 mV, both the initial and final stages were fitted using eqn (4), and obtained two rate constants, namely initial leakage constant kileak and final leakage constant kfleak. The corresponding values of kileak and kfleak for several experimented GUVs were obtained (23.02 ± 0.09) × 10−3 s−1 and (1.96 ± 0.02) × 10−3 s−1. The kileak/kfleak rises with the negative membrane potential (Fig. 9i). Consequently, the rate of leakage at the beginning stage increased more quickly and the rate of leakage at the end stage decreased more slowly as the φm increased. The similar calcein leakage is also observed for the antimicrobial peptide.113
 | ||
| Fig. 10 Membrane potential dependent (a) Frp and (b) Frd of DOPG/DOPC/GrA (40/60/0.01)-GUVs due to the interaction of 2.00 μg/mL MNPs. The figures have been adapted from ref. 54 with permission from Royal Society of Chemistry, copyright 2023. | ||
The absence of GrA in DOPG/DOPC (40/60)-GUVs results in a rapid leakage phenomenon (shown in Fig. 3), where the logarithm FI follows a linear trend. The rapid leakage is attributed to the creation of submicron pores in the membrane.87,114 Adding GrA significantly alters the membrane's surface tension.110 Furthermore, GrA impacts the spontaneous curvature of the monolayer,111 leading to changes in the mechanical characteristics of the bilayer. This alteration results in a slower leakage of calcein from the DOPG/DOPC/GrA (40/60/0.01)-GUVs due to the adsorption of MNPs (Fig. 9c). Under higher φm, a considerable number of MNPs become adsorbed to the outer layer of the bilayer, consequently increasing tension in the external layer. In the early stages of leakage, a larger single pore forms as a result of increased surface pressure caused by the enhanced tension. At the first stage of poration, a rapid leakage is seen because the larger pore causes a greater rate of calcein leakage. After initiation of leakage, the pore size becomes smaller, resulting a slow leakage at final stage.54 When a membrane potential is present, it induces elevated external tension on the vesicle membrane, exceeding the energy threshold required for deformation. Consequently, under higher membrane potential conditions, vesicles are more prone to undergo poration rather than deformation.
4. Interaction of anionic polystyrene NPs with liposomes
In this section, we discuss the interaction of anionic NPs with liposomes (size 10 nm to 1 μm) instead of GUVs (size 1–100 μm). The carboxyl-modified (≈0.91 e− nm−2) anionic white polystyrene nanoparticles (PNPs) latex of size 20 nm were mixed by vortex into the DLPC liposome containing embedded Laurdan, which is an uncharged fluorescent dye whose emission indicates the phase state of phospholipid membranes (Fig. 11).115 The local phase state of lipid bilayer can be altered by the binding of anionic PNPs, which preferentially interact with the N-terminus of the PC head group. This interaction increases the tilt angle from 0° to 3°, characteristic of the fluid phase (Fig. 11a and b). The deformation of vesicles can be well explained by the analysis of changing the dipole angle. In Fig. 11c, the progressive rise of blue emission and loss of red emission as PNPs concentration increased—suggestive of fluid–gel phase coexistence such that the proportion of fluid to gel phase varies. Fig. 11d shows the intensity fraction of these two peaks plotted against the normalized concentration of PNPs, revealing that the changes are linear over a considerable range of PNP concentrations. The findings are independent of the lipid choice. The interaction between anionic PNPs and liposomes was confirmed by the shrinking of liposomes, as the area per lipid head group is smaller in the gel phase compared to the fluid phase.115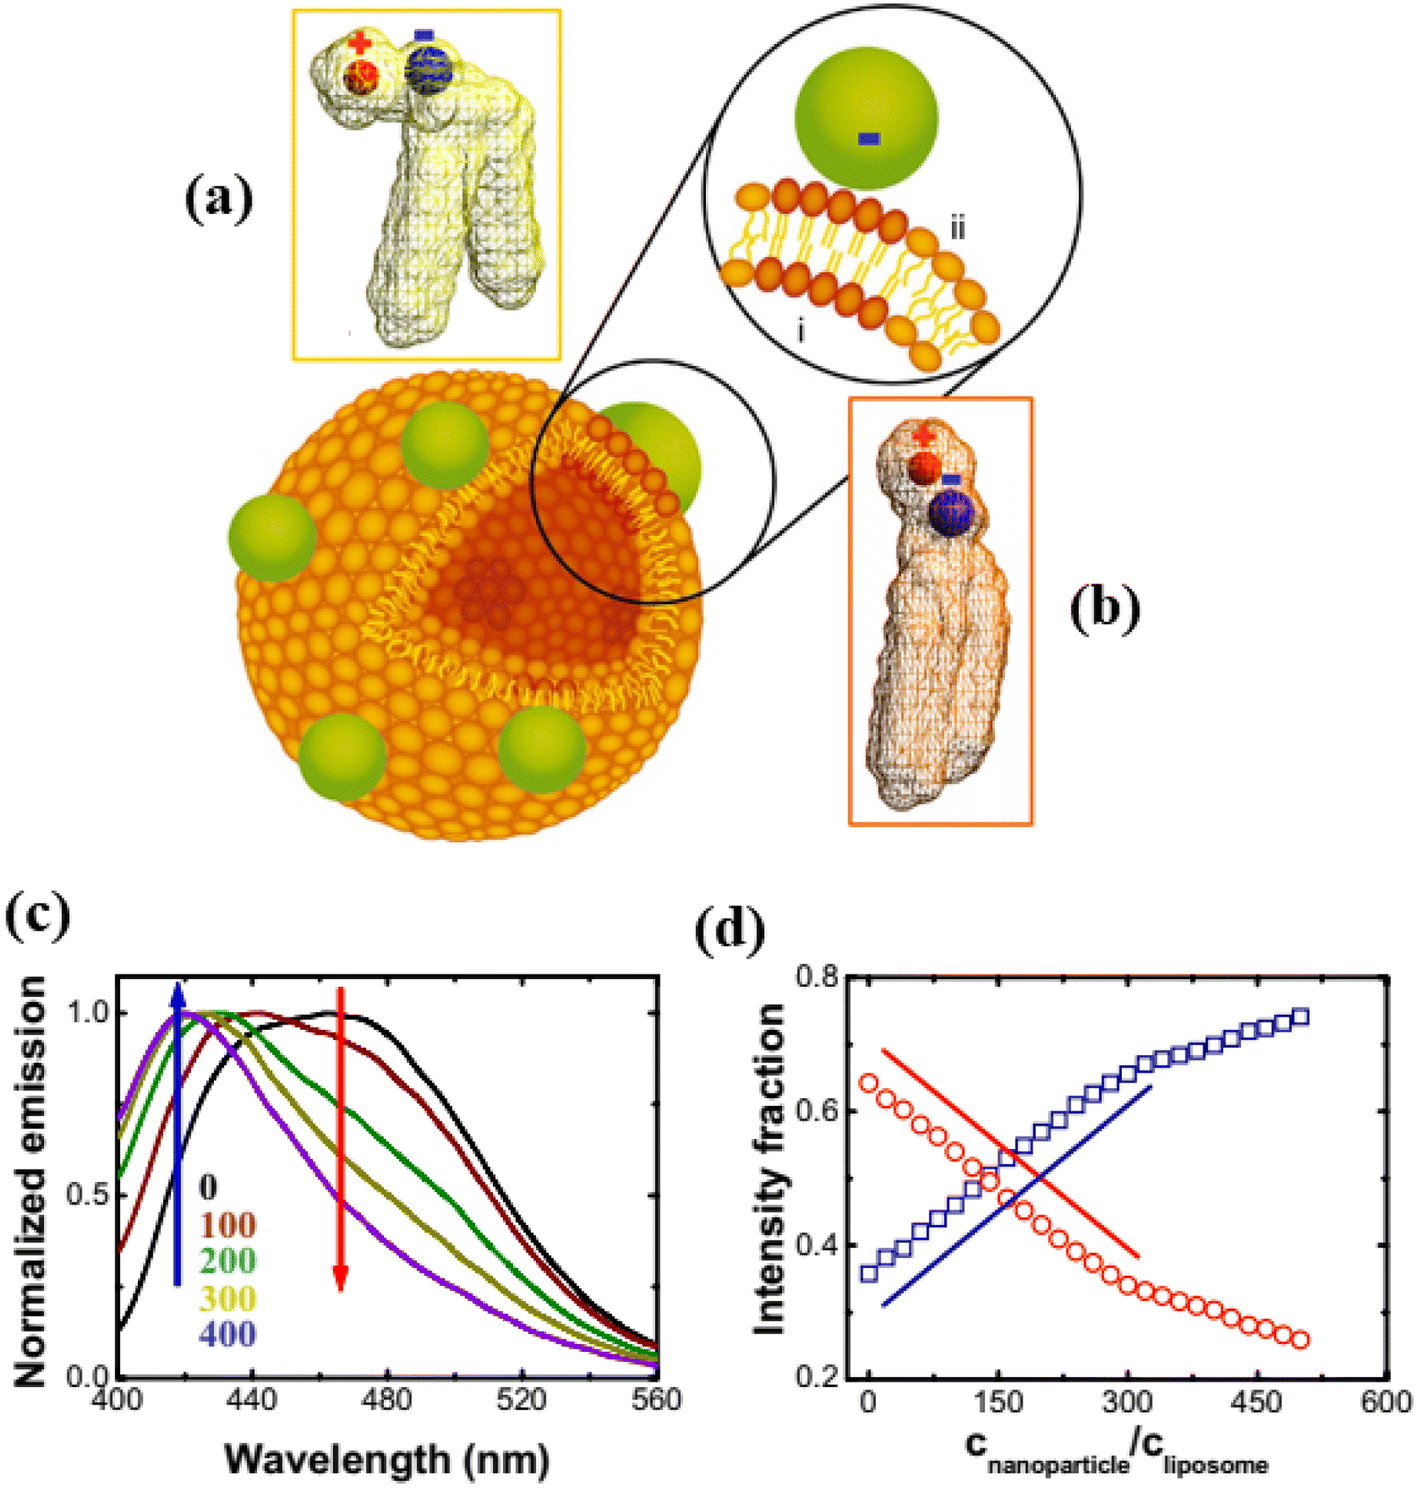 | ||
| Fig. 11 Binding of anionic PNPs to the lipid bilayer. Schematic diagram of the binding-induced reorientation of the PC head group causes lipids in the fluid phase to have lower density (a) than in the gel phase (b). The fluorescence spectrum of Laurdan shows (c) normalized emission plotted against wavelength after anionic PNPs bind to 200 nm DLPC liposomes and (d) the intensity fraction of blue and red emission at 416 (blue) and 473 nm (red) is plotted against CNPs/CL. Lines with slope of unity are drawn for comparison. The figures have been adapted from ref. 115 with permission from The National Academy of Sciences of the USA, copyright 2008. | ||
5. PEI-MNPs and PAA-MNPs uptake by SH-SY5Y
We discuss the cell viability of SH-SY5Y cell line when incubated with PEI-MNPs and PAA-MNPs at 15 and 72 h incubation time in Fig. 12.59 The analysis, conducted using Trypan blue assays and flow cytometry, revealed that cell viability levels for both PEI-MNPs and PAA-MNPs were comparable to the control sample, even at a concentration of 50 μg/mL of MNPs. Notably, the amount of MNPs associated with the cells was significantly higher for PEI-MNPs than for PAA-MNPs. Consequently, the data in Fig. 12 pertains to MNPs that are either incorporated into or strongly attached to the cell membrane. A linear relationship was observed between the total amounts of added and incorporated MNPs for both types. At 15 h, the uptake rate as a function of MNP concentration was fitted with straight lines, yielding slopes of 0.54 for PEI-MNPs and 0.27 for PAA-MNPs, respectively. The cells were able to incorporate only a 54% (PEI-MNPs) and 27% (PAA-MNPs) of the particles available. At 72 h, the increase was also linear, but the slopes 1.03 for PEI-MNPs indicated that after replication the new cells were able to incorporate the 100% of the MNPs added. In contrast, for the PAA-MNPs, the slope was 0.58, meaning that only 58% of the MNPs could be incorporated. Hence different proteins adsorbed could in turn determine different cell internalization pathways. The MNPs can be completely engulfed by the cell membrane and subsequently detach from the inner surface in a process known as fission, leaving behind a typically transient membrane pore.116,117 If the adhesion energy is not sufficiently strong, the NPs undergo Brownian collisions with the membrane without adhering. Alternatively, the NPs can sit at the membrane interface, partially wrapped by the lipid bilayer. | ||
| Fig. 12 Cell-uptaken total mass as a function of total added amount of PEI-MNPs and PAA-MNPs at 15 and 72 h incubation time. The figures have been adapted from ref. 59 with permission from Elsevier B. V., copyright 2014. | ||
6. Mechanism of deformation and poration of vesicles induced by MNPs
To consider the mechanism of MNPs-induced deformation (shape change) and poration (membrane permeation), a hypothesis has been proposed on the adsorption of MNPs into the external layer of lipid membrane as illustrated in Fig. 13. The adsorption mechanism of anionic MNPs is quite similar as discussed in Section 4. In DOPC head groups, electric dipole (e.g., P−–N+ dipole) occurs between the choline group (N+) and the phosphate group (P−) (Fig. 13a). At the beginning, the bilayer-surface and the vector of dipole moment is aligned at an acute angle. Because of the electrostatic attraction that considerably alters the dipole's alignment, the adsorbed MNPs are attracted to the N+ terminus (Fig. 13b). In accordance with the bilayer coupling model, the vesicle's spherical shape is governed primarily by the elastic energy (Wel), which arising from the bilayer bending energy (Wb).49,118 It doesn't consider the monolayer stretching energy (Wr). In the ADE (area difference elasticity) model,119,120 Wel = Wb + Wr where Wr ∝ (ΔA − ΔA0).2 Here ΔA0 denotes the area difference in the absence of MNPs and ΔA denotes the area difference in the presence of MNPs between the exterior and interior layer of the bilayer. MNPs adhering to the exterior layer induce membrane stretching, causing an area mismatch between the layers and resulting in GUV deformation. The adsorption of MNPs on the exterior layer induces a stretching, e.g., lateral tension (σ) in both the layers. Such tension leads to the creation of membrane pores or vesicle rupture.121–126 However, the direction of σ is opposite for the interior and exterior layers, as indicated by arrowheads in Fig. 13c. Consequently, thermal fluctuations of lipid molecules in the MNPs-binding region increase, leading to prominent local condensation and rarefaction of lipid molecules. This heightened local rarefaction enhances the probability of forming nanopores. The initial stage of nanopore formation can be evaluated by monitoring the decrease in fluorescence intensity from the inside of GUVs.88,127 Nevertheless, the nanopore are unable to undergo further growth into micrometer-scale pore due to the dominance of line tension, Γ, (e.g., pore edge tension) at the pore rim, which effectively counters the lateral membrane-tension (σ) and facilitates the closure of the pore (Fig. 13d).128–130 The prepore free energy is expressed as follows:124,131–134| E(r, σ) = 2πrΓ − πr2σ, | (5) |
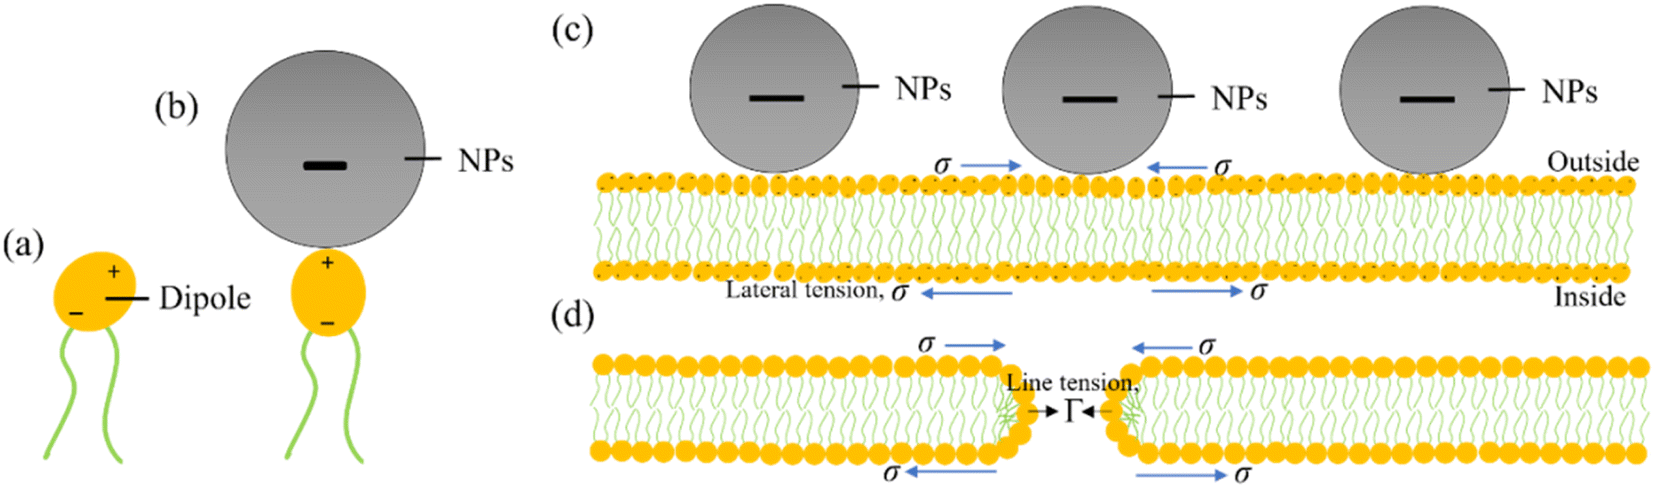 | ||
| Fig. 13 An illustration on the adsorption of anionic MNPs in the membrane. (a) A DOPC molecule where lipid head acts as a dipole. (b) Adsorption of a MNPs into the DOPC lipid head. (c) Adsorption of MNPs into the lipid membrane. (d) Formation of a toroidal pore in the membrane. | ||
7. Significance of this study
The interaction of anionic NPs with giant vesicles, liposomes, and cells can significantly contribute to multiple scientific disciplines, including chemistry, physics, materials science, biology, and chemical engineering. Understanding the interaction mechanisms between anionic MNPs and GUVs aids in the synthesis of more effective MNPs with specific surface chemistries tailored for biomedical applications.42 This can shed light on the chemical stability and reactivity of MNPs in biological environments, influencing the development of MNPs that maintain functionality under physiological conditions.7 This also help in exploring how MNPs interact with GUVs can inform on their magnetic behavior in biological systems, essential for applications in magnetic hyperthermia and imaging.39 This review can delve into the physics of electrostatic interactions between anionic MNPs and lipid bilayers, enhancing the understanding of fundamental principles governing NPs-membrane interactions. In materials science, the insights into the interaction between MNPs and GUVs can guide the design of nanomaterials with specific properties for targeted drug delivery and other biomedical applications.137 In addition, understanding how MNPs interact with lipid membranes helps in developing colloidally stable formulations that are crucial for in vivo applications.43 In biology, the MNPs–GUVs interaction can elucidate how NPs affect cellular membranes, which is critical for understanding MNPs uptake and intracellular trafficking.138 It highlights how functionalized MNPs can be used for targeted drug delivery and diagnostic applications, enhancing the therapeutic potential of these nanomaterials. In chemical engineering, understanding the interaction mechanisms helps in optimizing the production processes for MNPs, ensuring reproducibility and scalability for industrial applications.139 This can provide a comprehensive overview of the safety and efficacy of MNPs in biomedical applications, guiding the development of safe and effective NPs-based therapies.40 Thus, this review on the interaction of anionic MNPs with GUVs contributes to the development of multiple scientific disciplines by providing a comprehensive understanding of the fundamental principles and practical applications of these interactions. This interdisciplinary knowledge fosters innovation in nanotechnology, enhances the development of targeted therapies, and informs the design of safer and more effective nanomaterials.8. Concluding remarks
This review explores the influences of several elements on vesicle deformation and poration induced by anionic MNPs. The factors such as the membrane surface charge, salt and sugar concentrations in the buffer, as well as the membrane potential, can all play roles in influencing the deformation and poration of cell sized vesicles. The inclusion of membrane cholesterol and polyethylene glycol influence MNPs-induced vesicle deformation and lipid membrane poration significantly. Gramicidin A impacts the adsorption mechanism of MNPs. Taking into account the membrane potential, researchers along with clinicians have the opportunity to refine the design and optimization of MNPs, aiming to mitigate their detrimental impacts on cellular membranes and overall cellular functionality.140 The exploration of various leakage regimes holds significant importance in evaluating the impact of MNPs on cells. Overall, this review contributes in revealing the fundamental mechanism underlying the interaction of anionic NPs with cells/vesicles, and offers crucial insights for the secure and efficient advancement of nanotechnology-based biomedical applications.Data availability
The corresponding author is available to provide the data supporting these findings upon request, in accordance with reasonable inquiry.Author contributions
The authors designed the paper, organizing the graphical representations and data, as well as drafting the manuscript.Conflicts of interest
The authors affirm that there are no conflicts of interest.Acknowledgements
The authors extend their gratitude to collaborators and colleagues for their invaluable insights and contributions to this review. Special thanks are extended to the Basic Research Grant provided by Bangladesh University of Engineering and Technology (Est/R-60/Re-6714(37)). Research Grant from Jashore University of Science and Technology (JUST/Research Cell/162) to Md. Masum Billah is acknowledged. The perspective design, data assembly, analysis, and decision to publish were all independent of any influence or involvement from funders. Furthermore, no external funding was secured for this work.References
- G. Han, P. Ghosh and V. M. Rotello, Nanomedicine, 2007, 2, 113–123 CrossRef CAS PubMed.
- W. H. D. Jong and P. J. A. Borm, Int. J. Nanomedicine, 2008, 3(2), 133–149 CrossRef PubMed.
- D. A. Giljohann, D. S. Seferos, W. L. Daniel, M. D. Massich, P. C. Patel and C. A. Mirkin, Angew Chem. Int. Ed. Engl., 2010, 49, 3280–3294 CrossRef CAS.
- S. Salassi, E. Canepa, R. Ferrando and G. Rossi, RSC Adv., 2019, 9, 13992–13997 RSC.
- R. Awasthi, A. Roseblade, P. M. Hansbro, M. J. Rathbone, K. Dua and M. Bebawy, Curr. Drug Targets, 2018, 19, 1696–1709 CrossRef CAS PubMed.
- S. M. Dadfar, K. Roemhild, N. I. Drude, S. von Stillfried, R. Knüchel, F. Kiessling and T. Lammers, Adv. Drug Delivery Rev., 2019, 138, 302–325 CrossRef CAS PubMed.
- S. Laurent, D. Forge, M. Port, A. Roch, C. Robic, L. Vander Elst and R. N. Muller, Chem. Rev., 2008, 108, 2064–2110 CrossRef CAS.
- M. Bilal, Y. Zhao, T. Rasheed and H. M. N. Iqbal, Int. J. Biol. Macromol., 2018, 120, 2530–2544 CrossRef CAS PubMed.
- M. H. Pablico-Lansigan, S. F. Situ and A. C. S. Samia, Nanoscale, 2013, 5, 4040–4055 RSC.
- Y. Li, N. Wang, X. Huang, F. Li, T. P. Davis, R. Qiao and D. Ling, ACS Appl. Bio Mater., 2020, 3, 121–142 CrossRef CAS PubMed.
- K. Wu, D. Su, J. Liu, R. Saha and J.-P. Wang, Nanotechnology, 2019, 30, 502003 CrossRef CAS PubMed.
- R. C. Popescu, E. Andronescu and B. S. Vasile, Nanomaterials, 2019, 9, 1791 CrossRef CAS PubMed.
- M. Basini, A. Guerrini, M. Cobianchi, F. Orsini, D. Bettega, M. Avolio, C. Innocenti, C. Sangregorio, A. Lascialfari and P. Arosio, J. Alloys Compd., 2019, 770, 58–66 CrossRef CAS.
- R. A. Bohara, N. D. Thorat and S. H. Pawar, RSC Adv., 2016, 6, 43989–44012 RSC.
- S. Mornet, S. Vasseur, F. Grasset and E. Duguet, J. Mater. Chem., 2004, 14, 2161–2175 RSC.
- V. L. Colvin, Nat. Biotechnol., 2003, 21, 1166–1170 CrossRef CAS PubMed.
- N. Lewinski, V. Colvin and R. Drezek, Small, 2008, 4, 26–49 CrossRef CAS.
- B. Fadeel and A. E. Garcia-Bennett, Adv. Drug Delivery Rev., 2010, 62, 362–374 CrossRef CAS.
- C. Egbuna, V. K. Parmar, J. Jeevanandam, S. M. Ezzat, K. C. Patrick-Iwuanyanwu, C. O. Adetunji, J. Khan, E. N. Onyeike, C. Z. Uche, M. Akram, M. S. Ibrahim, N. M. El Mahdy, C. G. Awuchi, K. Saravanan, H. Tijjani, U. E. Odoh, M. Messaoudi, J. C. Ifemeje, M. C. Olisah, N. J. Ezeofor, C. J. Chikwendu and C. G. Ibeabuchi, J. Toxicol., 2021, 2021, e9954443 Search PubMed.
- R. Abbasi, G. Shineh, M. Mobaraki, S. Doughty and L. Tayebi, J. Nanopart. Res., 2023, 25, 43 CrossRef CAS PubMed.
- M. Kaloyianni, A. Dimitriadi, M. Ovezik, D. Stamkopoulou, K. Feidantsis, G. Kastrinaki, G. Gallios, I. Tsiaoussis, G. Koumoundouros and D. Bobori, J. Hazard. Mater., 2020, 383, 121204 CrossRef CAS.
- K. Khanna, N. Sharma, P. Ohri and R. Bhardwaj, in Plant and Nanoparticles, Springer, Singapore, 2022, pp. 1–52 Search PubMed.
- A. Barhoum, M. L. García-Betancourt, J. Jeevanandam, E. A. Hussien, S. A. Mekkawy, M. Mostafa, M. M. Omran, M. S Abdalla and M. Bechelany, Nanomaterials, 2022, 12, 177 CrossRef CAS.
- I. Castellanos-Rubio, O. Arriortua, L. Marcano, I. Rodrigo, D. Iglesias-Rojas, A. Barón, A. Olazagoitia-Garmendia, L. Olivi, F. Plazaola, M. L. Fdez-Gubieda, A. Castellanos-Rubio, J. S. Garitaonandia, I. Orue and M. Insausti, Chem. Mater., 2021, 33, 3139–3154 CrossRef CAS PubMed.
- X. Chu, J. Yu and Y.-L. Hou, Chin. Phys. B, 2015, 24, 014704 CrossRef.
- S. Venkateswarlu, B. Natesh Kumar, C. H. Prasad, P. Venkateswarlu and N. V. V. Jyothi, Phys. B, 2014, 449, 67–71 CrossRef CAS.
- A. K. Das, A. Marwal and R. Verma, Res. Rev.: J. Pharm. Nanotechnol., 2014, 2, 21–24 CAS.
- M. Shah, D. Fawcett, S. Sharma, S. Tripathy, G. Poinern, M. Shah, D. Fawcett, S. Sharma, S. K. Tripathy and G. E. J. Poinern, Materials, 2015, 8, 7278–7308 CrossRef CAS.
- S. Kanagasubbulakshmi and K. Kadirvelu, Def. Life Sci. J., 2017, 2, 422 CrossRef.
- N. Shreyash, S. Bajpai, M. A. Khan, Y. Vijay, S. K. Tiwary and M. Sonker, ACS Appl. Nano Mater., 2021, 4, 11428–11457 CrossRef CAS.
- M. Lazaratos, K. Karathanou, E. Mainas, A. Chatzigoulas, N. Pippa, C. Demetzos and Z. Cournia, Biochim. Biophys. Acta, Gen. Subj., 2020, 1864, 129671 CrossRef CAS PubMed.
- M. Yamazaki, in Advances in Planar Lipid Bilayers and Liposomes, Academic Press, 2008, vol. 7, pp. 121–142 Search PubMed.
- M. Z. Islam, J. M. Alam, Y. Tamba, M. A. S. Karal and M. Yamazaki, Phys. Chem. Chem. Phys., 2014, 16, 15752–15767 RSC.
- R. Dimova and C. M. Marques, The Giant Vesicle Book, CRC Press, Taylor & Francis Group, 2019 Search PubMed.
- M. M. R. Moghal, F. Hossain and M. Yamazaki, Biophys. Rev., 2020, 12, 339–348 CrossRef CAS PubMed.
- M. Laurencin, T. Georgelin, B. Malezieux, J.-M. Siaugue and C. Ménager, Langmuir, 2010, 26, 16025–16030 CrossRef CAS.
- S. Li and N. Malmstadt, Soft Matter, 2013, 9, 4969–4976 RSC.
- R. van der Meel, L. J. C. Vehmeijer, R. J. Kok, G. Storm and E. V. B. van Gaal, Adv. Drug Delivery Rev., 2013, 65, 1284–1298 CrossRef CAS PubMed.
- O. L. Gobbo, K. Sjaastad, M. W. Radomski, Y. Volkov and A. Prina-Mello, Theranostics, 2015, 5, 1249–1263 CrossRef CAS.
- C. Alexiou, R. J. Schmid, R. Jurgons, M. Kremer, G. Wanner, C. Bergemann, E. Huenges, T. Nawroth, W. Arnold and F. G. Parak, Eur. Biophys. J., 2006, 35, 446–450 CrossRef CAS.
- L. Dykman and N. Khlebtsov, Chem. Soc. Rev., 2012, 41, 2256–2282 RSC.
- A. K. Gupta and M. Gupta, Biomaterials, 2005, 26, 3995–4021 CrossRef CAS PubMed.
- V. Pilati, G. Gomide, R. C. Gomes, G. F. Goya and J. Depeyrot, Langmuir, 2021, 37, 1129–1140 CrossRef CAS PubMed.
- E. Piosik, A. Zaryczniak, K. Mylkie and M. Ziegler-Borowska, Int. J. Mol. Sci., 2021, 22, 5939 CrossRef CAS PubMed.
- E. Piosik, P. Klimczak, M. Ziegler-Borowska, D. Chełminiak-Dudkiewicz and T. Martyński, Mater. Sci. Eng., C, 2020, 109, 110616 CrossRef CAS PubMed.
- R. Dimova, Adv. Colloid Interface Sci., 2014, 208, 225–234 CrossRef CAS PubMed.
- H. A. Faizi, S. L. Frey, J. Steinkühler, R. Dimova and P. M. Vlahovska, Soft Matter, 2019, 15, 6006–6013 RSC.
- R. Ashkar, M. Doktorova, F. A. Heberle, H. Scott, E. Kelley, M. Nagao, R. Usery, F. N. Barrera, G. W. Feigenson, J. Katsaras and G. Khelashvili, Biophys. J., 2019, 116, 328a CrossRef.
- M. A. S. Karal, M. M. Billah, M. Ahmed and M. K. Ahamed, Soft Matter, 2023, 19, 8285–8304 RSC.
- J. P. Reeves and R. M. Dowben, J. Cell. Physiol., 1969, 73, 49–60 CrossRef CAS PubMed.
- M. A. S. Karal, S. Ahammed, V. Levadny, M. Belaya, M. K. Ahamed, M. Ahmed, Z. B. Mahbub and A. K. M. A. Ullah, Chem. Phys. Lipids, 2020, 230, 104916 CrossRef CAS PubMed.
- S. Hasan, M. A. S. Karal, S. Akter, M. Ahmed, M. K. Ahamed and S. Ahammed, PLoS One, 2022, 17, e0275478 CrossRef CAS.
- M. A. S. Karal, S. Sultana, M. M. Billah, M. Moniruzzaman, M. A. Wadud and R. C. Gosh, PLoS One, 2023, 18, e0289087 CrossRef CAS PubMed.
- M. Moniruzzaman, M. A. S. Karal, M. A. Wadud and M. M. O. Rashid, Phys. Chem. Chem. Phys., 2023, 25, 23111–23124 RSC.
- Y. Tamba, H. Terashima and M. Yamazaki, Chem. Phys. Lipids, 2011, 164, 351–358 CrossRef CAS.
- M. A. S. Karal, M. Rahman, M. K. Ahamed, S. U. A. Shibly, M. Ahmed and M. M. Shakil, Eur. Biophys. J., 2019, 48, 349–359 CrossRef CAS PubMed.
- A. Akbarzadeh, R. Rezaei-Sadabady, S. Davaran, S. W. Joo, N. Zarghami, Y. Hanifehpour, M. Samiei, M. Kouhi and K. Nejati-Koshki, Nanoscale Res. Lett., 2013, 8, 102 CrossRef.
- M. M. Zaman, M. A. S. Karal, M. N. I. Khan, A. R. M. Tareq, S. Ahammed, M. Akter, A. Hossain and A. K. M. A. Ullah, ChemistrySelect, 2019, 4, 7824–7831 CrossRef CAS.
- M. P. Calatayud, B. Sanz, V. Raffa, C. Riggio, M. R. Ibarra and G. F. Goya, Biomaterials, 2014, 35, 6389–6399 CrossRef CAS PubMed.
- A. Fenster, Ultrasound Med. Biol., 2001, 27, 727 CrossRef.
- J. C. W. Shepherd and G. Büldt, Biochim. Biophys. Acta, Biomembr., 1978, 514, 83–94 CrossRef CAS.
- M. Petrov, L. Cwiklik and P. Jungwirth, Collect. Czech. Chem. Commun., 2011, 76, 695–711 CrossRef CAS.
- A. Pabis, J. Szala-Bilnik and D. Swiatla-Wojcik, Phys. Chem. Chem. Phys., 2011, 13, 9458–9468 RSC.
- M. A. S. Karal, M. Ahmed, V. Levadny, M. Belaya, M. K. Ahamed, M. Rahman and M. M. Shakil, Phys. Rev. E, 2020, 101, 012404 CrossRef CAS.
- M. A. S. Karal, V. Levadnyy, T. Tsuboi, M. Belaya and M. Yamazaki, Phys. Rev. E, 2015, 92, 012708 CrossRef.
- M. A. S. Karal, U. S. Orchi, M. Towhiduzzaman, M. K. Ahamed, M. Ahmed, S. Ahammed, N. A. Mokta, S. Sharmin and M. K. Sarkar, Chem. Phys. Lipids, 2020, 231, 104935 CrossRef CAS.
- J. N. Israelachvili, in Intermolecular and Surface Forces, Elsevier, 2011, pp. 291–340 Search PubMed.
- G. Cevc, Phospholipid Bilayers: Physical Principles and Models, Wiley, New York, 1987 Search PubMed.
- G. Cevc, Biochim. Biophys. Acta, Rev. Biomembr., 1990, 1031, 311–382 CrossRef CAS PubMed.
- M. Langner and K. Kubica, Chem. Phys. Lipids, 1999, 101, 3–35 CrossRef CAS PubMed.
- R. Messina, J. Phys.: Condens. Matter, 2008, 21, 199801 CrossRef.
- H. J. Deuling and W. Helfrich, J. Phys., 1976, 37, 1335–1345 CrossRef CAS.
- O.-Y. Zhong-can and W. Helfrich, Phys. Rev. Lett., 1987, 59, 2486–2488 CrossRef PubMed.
- H. J. Bohnert, D. E. Nelson and R. G. Jensen, Plant Cell, 1995, 7, 1099–1111 CrossRef CAS.
- E. A. Bray, Trends Plant Sci., 1997, 2, 48–54 CrossRef.
- P. H. Yancey, M. E. Clark, S. C. Hand, R. D. Bowlus and G. N. Somero, Science, 1982, 217, 1214–1222 CrossRef CAS.
- L. M. Crowe, D. S. Reid and J. H. Crowe, Biophys. J., 1996, 71, 2087–2093 CrossRef CAS PubMed.
- M. d. C. Luzardo, F. Amalfa, A. M. Nuñez, S. Díaz, A. C. Biondi de Lopez and E. A. Disalvo, Biophys. J., 2000, 78, 2452–2458 CrossRef CAS.
- H.-G. Döbereiner, O. Selchow and R. Lipowsky, Eur. Biophys. J., 1999, 28, 174–178 CrossRef.
- V. Vitkova, D. Mitkova, K. Antonova, G. Popkirov and R. Dimova, Colloids Surf., A, 2018, 557, 51–57 CrossRef CAS.
- J. Genova, A. Zheliaskova and M. D. Mitov, Colloids Surf., A, 2006, 282–283, 420–422 CrossRef.
- J. F. Nagle, M. S. Jablin, S. Tristram-Nagle and K. Akabori, Chem. Phys. Lipids, 2015, 185, 3–10 CrossRef CAS.
- V. Vitkova, J. Genova, M. D. Mitov and I. Bivas, Mol. Cryst. Liq. Cryst., 2006, 449, 95–106 CrossRef CAS.
- M. K. Sarkar, M. A. S. Karal, V. Levadny, M. Belaya, M. Ahmed, M. K. Ahamed and S. Ahammed, Eur. Biophys. J., 2022, 51, 401–412 CrossRef CAS.
- D. Venturoli and B. Rippe, Am. J. Physiol.: Renal Physiol., 2005, 288, F605–F613 CrossRef CAS PubMed.
- A. B. Goins, H. Sanabria and M. N. Waxham, Biophys. J., 2008, 95, 5362–5373 CrossRef CAS PubMed.
- Y. Tamba and M. Yamazaki, J. Phys. Chem. B, 2009, 113, 4846–4852 CrossRef CAS PubMed.
- M. Hasan, M. A. S. Karal, V. Levadnyy and M. Yamazaki, Langmuir, 2018, 34, 3349–3362 CrossRef CAS PubMed.
- M. K. Ahamed, M. A. S. Karal, M. Ahmed and S. Ahammed, Eur. Biophys. J., 2020, 49, 371–381 CrossRef CAS.
- I. J. Vereyken, V. Chupin, R. A. Demel, S. C. M. Smeekens and B. De Kruijff, Biochim. Biophys. Acta, Biomembr., 2001, 1510, 307–320 CrossRef CAS PubMed.
- R. A. Demel, E. Dorrepaal, M. J. M. Ebskamp, J. C. M. Smeekens and B. de Kruijff, Biochim. Biophys. Acta, Biomembr., 1998, 1375, 36–42 CrossRef CAS.
- A. Dhaliwal, A. Khondker, R. Alsop and M. C. Rheinstädter, Membranes, 2019, 9, 15 CrossRef PubMed.
- H. D. Andersen, C. Wang, L. Arleth, G. H. Peters and P. Westh, Proc. Natl. Acad. Sci. U. S. A., 2011, 108, 1874–1878 CrossRef CAS.
- J. W. DePierre and M. L. Karnovsky, J. Cell Biol., 1973, 56, 275–303 CrossRef CAS.
- S. Akter, M. A. S. Karal, S. Hasan, M. K. Ahamed, M. Ahmed and S. Ahammed, RSC Adv., 2022, 12, 28283–28294 RSC.
- E. C. Giakoumatos, L. Gascoigne, B. Gumí-Audenis, Á. G. García, R. Tuinier and I. K. Voets, Soft Matter, 2022, 18, 7569–7578 RSC.
- A. Mahendra, H. P. James and S. Jadhav, Chem. Phys. Lipids, 2019, 218, 47–56 CrossRef CAS.
- D. Marsh, R. Bartucci and L. Sportelli, Biochim. Biophys. Acta, Biomembr., 2003, 1615, 33–59 CrossRef CAS PubMed.
- L. Abdul Kadir, M. Stacey and R. Barrett-Jolley, Front. physiol., 2018, 9, 1661 CrossRef.
- Basic Neurochemistry: Principles of Molecular, Cellular, and Medical Neurobiology, ed. S. T. Brady, G. J. Siegel, R. W. Albers and D. L. Price, Elsevier, Amsterdam, Paris, 8th edn, 2011 Search PubMed.
- J. P. Stratford, C. L. A. Edwards, M. J. Ghanshyam, D. Malyshev, M. A. Delise, Y. Hayashi and M. Asally, Proc. Natl. Acad. Sci. U. S. A., 2019, 116, 9552–9557 CrossRef CAS PubMed.
- A. Higuchi and T. Nakagawa, J. Membr. Sci., 1987, 32, 267–280 CrossRef CAS.
- M. M. R. Moghal, M. Z. Islam, F. Hossain, S. K. Saha and M. Yamazaki, Biophys. J., 2020, 118, 57–69 CrossRef CAS.
- F. Hossain, M. M. R. Moghal, M. Z. Islam, M. Moniruzzaman and M. Yamazaki, J. Biol. Chem., 2019, 294, 10449–10462 CrossRef CAS PubMed.
- F. Hossain, H. Dohra and M. Yamazaki, J. Bacteriol., 2021, 203, e00021 CrossRef CAS.
- T. Numata, T. Murakami, F. Kawashima, N. Morone, J. E. Heuser, Y. Takano, K. Ohkubo, S. Fukuzumi, Y. Mori and H. Imahori, J. Am. Chem. Soc., 2012, 134, 6092–6095 CrossRef CAS PubMed.
- A.-S. Feiner and A. J. McEvoy, J. Chem. Educ., 1994, 71, 493 CrossRef CAS.
- M. M. O. Rashid, M. M. R. Moghal, M. M. Billah, M. Hasan and M. Yamazaki, Biochim. Biophys. Acta, Biomembr., 2020, 1862, 183381 CrossRef CAS PubMed.
- E. Bamberg and P. Läuger, J. Membr. Biol., 1973, 11, 177–194 CrossRef CAS.
- A. Ring, Biochim. Biophys. Acta, Biomembr., 1996, 1278, 147–159 CrossRef PubMed.
- J. A. Szule and R. P. Rand, Biophys. J., 2003, 85, 1702–1712 CrossRef CAS PubMed.
- S. Sundelacruz, M. Levin and D. L. Kaplan, Stem Cell Rev. Rep., 2009, 5, 231–246 CrossRef.
- Y. Tamba, H. Ariyama, V. Levadny and M. Yamazaki, J. Phys. Chem. B, 2010, 114, 12018–12026 CrossRef CAS PubMed.
- Y. Tamba and M. Yamazaki, Biochemistry, 2005, 44, 15823–15833 CrossRef CAS PubMed.
- B. Wang, L. Zhang, S. C. Bae and S. Granick, Proc. Natl. Acad. Sci. U. S. A., 2008, 105, 18171–18175 CrossRef CAS.
- C. Contini, M. Schneemilch, S. Gaisford and N. Quirke, J. Exp. Nanosci., 2018, 13, 62–81 CrossRef CAS.
- F. Campelo and V. Malhotra, Annu. Rev. Biochem., 2012, 81, 407–427 CrossRef CAS PubMed.
- J. Käs and E. Sackmann, Biophys. J., 1991, 60, 825–844 CrossRef.
- U. Seifert, K. Berndl and R. Lipowsky, Phys. Rev. A, 1991, 44, 1182–1202 CrossRef CAS.
- V. Kralj-Iglič, V. Heinrich, S. Svetina and B. Žekš, Eur. Phys. J. B, 1999, 10, 5–8 CrossRef.
- S. J. Ludtke, K. He, W. T. Heller, T. A. Harroun, L. Yang and H. W. Huang, Biochemistry, 1996, 35, 13723–13728 CrossRef CAS PubMed.
- F. Brochard-Wyart, P. G. de Gennes and O. Sandre, Phys. A, 2000, 278, 32–51 CrossRef CAS.
- W. Rawicz, K. C. Olbrich, T. McIntosh, D. Needham and E. Evans, Biophys. J., 2000, 79, 328–339 CrossRef CAS.
- E. Evans, V. Heinrich, F. Ludwig and W. Rawicz, Biophys. J., 2003, 85, 2342–2350 CrossRef CAS.
- M. A. S. Karal, J. M. Alam, T. Takahashi, V. Levadny and M. Yamazaki, Langmuir, 2015, 31, 3391–3401 CrossRef CAS.
- M. M. Billah, M. M. O. Rashid, M. Ahmed and M. Yamazaki, Biochim. Biophys. Acta, Biomembr., 2023, 1865, 184112 CrossRef CAS PubMed.
- N. Yoshida, M. Tamura and M. Kinjo, Single Mol., 2000, 1, 279–283 CrossRef CAS.
- E. Karatekin, O. Sandre, H. Guitouni, N. Borghi, P.-H. Puech and F. Brochard-Wyart, Biophys. J., 2003, 84, 1734–1749 CrossRef CAS PubMed.
- F. S. C. Leomil, M. Zoccoler, R. Dimova and K. A. Riske, Bioinform. Adv., 2021, 1, vbab037 CrossRef PubMed.
- M. A. S. Karal, M. M. Billah and M. K. Ahamed, Phys. Chem. Chem. Phys., 2024, 26, 6107–6117 RSC.
- J. D. Litster, Phys. Lett. A, 1975, 53, 193–194 CrossRef.
- V. Levadny, T. Tsuboi, M. Belaya and M. Yamazaki, Langmuir, 2013, 29, 3848–3852 CrossRef CAS.
- S. A. Akimov, P. E. Volynsky, T. R. Galimzyanov, P. I. Kuzmin, K. V. Pavlov and O. V. Batishchev, Sci. Rep., 2017, 7, 12152 CrossRef PubMed.
- S. A. Akimov, P. E. Volynsky, T. R. Galimzyanov, P. I. Kuzmin, K. V. Pavlov and O. V. Batishchev, Sci. Rep., 2017, 7, 12509 CrossRef PubMed.
- D. Sengupta, H. Leontiadou, A. E. Mark and S.-J. Marrink, Biochim. Biophys. Acta, Biomembr., 2008, 1778, 2308–2317 CrossRef CAS PubMed.
- M.-T. Lee, T.-L. Sun, W.-C. Hung and H. W. Huang, Proc. Natl. Acad. Sci. U. S. A., 2013, 110, 14243–14248 CrossRef CAS PubMed.
- F. M. Kievit and M. Zhang, Acc. Chem. Res., 2011, 44, 853–862 CrossRef CAS PubMed.
- M. Mahmoudi, S. Laurent, M. A. Shokrgozar and M. Hosseinkhani, ACS Nano, 2011, 5, 7263–7276 CrossRef CAS PubMed.
- O. C. Farokhzad and R. Langer, ACS Nano, 2009, 3, 16–20 CrossRef CAS.
- J. Wolfram, M. Zhu, Y. Yang, J. Shen, E. Gentile, D. Paolino, M. Fresta, G. Nie, C. Chen, H. Shen, M. Ferrari and Y. Zhao, Curr. Drug Targets, 2015, 16, 1671–1681 CrossRef CAS PubMed.
| This journal is © The Royal Society of Chemistry 2024 |