
 Open Access Article
 This Open Access Article is licensed under a
 Creative Commons Attribution 3.0 Unported Licence
Molecular dynamics simulations reveal disruptive self-assembly in dynamic peptide libraries†
I. R.
Sasselli
 a,
I. P.
Moreira
a,
R. V.
Ulijn
abcd and
T.
Tuttle
*a
a,
I. P.
Moreira
a,
R. V.
Ulijn
abcd and
T.
Tuttle
*a
aDepartment of Pure & Applied Chemistry, WestCHEM, University of Strathclyde, 295 Cathedral Street, Glasgow, G1 1XL, UK. E-mail: tell.tuttle@strath.ac.uk; sasselli89@googlemail.com
bAdvanced Science Research Center (ASRC) of the Graduate Center, City University of New York (CUNY), 85 St Nicholas Terrace, New York, NY 10031, USA
cHunter College, Department of Chemistry and Biochemistry, 695 Park Avenue, New York, NY 10065, USA
dPhD Program in Chemistry, The Graduate Center of the City University of New York, New York, NY 10016, USA
First published on 26th July 2017
Abstract
There is significant interest in the use of unmodified self-assembling peptides as building blocks for functional, supramolecular biomaterials. Recently, dynamic peptide libraries (DPLs) have been proposed to select self-assembling materials from dynamically exchanging mixtures of dipeptide inputs in the presence of a nonspecific protease enzyme, where peptide sequences are selected and amplified based on their self-assembling tendencies. It was shown that the results of the DPL of mixed sequences (e.g. starting from a mixture of dileucine, L2, and diphenylalanine, F2) did not give the same outcome as the separate L2 and F2 libraries (which give rise to the formation of F6 and L6), implying that interactions between these sequences could disrupt the self-assembly. In this study, coarse grained molecular dynamics (CG-MD) simulations are used to understand the DPL results for F2, L2 and mixed libraries. CG-MD simulations demonstrate that interactions between precursors can cause the low formation yield of hexapeptides in the mixtures of dipeptides and show that this ability to disrupt is influenced by the concentration of the different species in the DPL. The disrupting self-assembly effect between the species in the DPL is an important effect to take into account in dynamic combinatorial chemistry as it affects the possible discovery of new materials. This work shows that combined computational and experimental screening can be used complementarily and in combination providing a powerful means to discover new supramolecular peptide nanostructures.
Introduction
Peptide-based nanostructures have been studied over the last few decades as potential new supramolecular materials with promising applications in biomedicine and nanotechnology.1 There is increased interest in the use of unmodified, short peptides, as short as dipeptides, which form nanostructures spontaneously from minimalistic, easy to synthesize, building blocks.2Peptide derivatives, such as peptide amphiphiles (PAs)3 and aromatic peptide amphiphiles (APAs),4 take advantage of aliphatic or aromatic non-peptide groups, respectively, to enhance the self-assembling tendency of a peptide, allowing tripeptides,5 dipeptides6 and some modified single amino acids7 to form nanostructures spontaneously in solution. Clearly, peptides are attractive building blocks for nanostructures due to the chemical diversity of amino acids, which can in turn result in diverse structures and functions of the resulting self-assembled systems.
During the last few years, an effort has been made to search for the sequence space for minimalistic unmodified self-assembling peptides.2a,b,8 Frederix et al. employed coarse grained molecular dynamics (CG-MD) simulations using the MARTINI force field to investigate the self-assembling propensity of the 400 dipeptides and 8000 tripeptides.8c,d Firstly, the dipeptide work was used to demonstrate that CG-MD simulations are able to reproduce known supramolecular nanostructures. Once validated, this methodology was applied to map the space of the more numerous tripeptides and this led to the discovery of four new tripeptide hydrogelators, which were verified experimentally.8c In all of the gel-forming systems, the predicted self-assembled structure corresponded to nanofibers.
Complementary to the computational mapping of the sequence space, Pappas et al. implemented an experimental methodology to discover new self-assembling pure peptides using dynamic peptide libraries (DPLs).9 Although the use of DPLs has been previously implemented to study the different self-assembling tendencies of closely related self-assembling peptides,10 this represented the first example of DPLs that allowed both exchange of the amide bonds and elongation of the peptide chain in both directions, with the aim to discover new, purely peptidic self-assembling molecules. Pappas et al.'s experiments consisted of exposing unprotected dipeptides to a nonspecific protease, which can break and form amide bonds. Although thermodynamically amide hydrolysis is favoured over condensation (in aqueous media), the energetically downhill self-assembling process in itself can overcome the bias for hydrolysis and drive the process to enhance the formation of the most stable self-assembling molecules. In these experiments both the conditions and the starting dipeptide composition were modified to discover a number of new self-assembling peptides, such as F6, L6, W4, F2L2 and (FDFS)2.9
However, some of the results in the experiments from Pappas et al. deserve further attention (Fig. 1).9 In particular, mixing of F2 (30 mM) with thermolysin (ExpF) shows a major formation of F6 (75%). A similar result is observed when L2 (30 mM) is mixed with thermolysin (ExpL), where the major product is also the hexapeptide, L6, but with a lower yield (60%) compared to F6 in the previous experiment. However, in a competitive dipeptide experiment, mixing F2 (15 mM) and L2 (15 mM) with thermolysin (ExpF–L) there is no peptide that shows yields of formation higher than 5%, including those that previously yielded over 50% in the non-competitive experiments.9 The reduction in yield can, at least in part, be explained by simple mass action and equilibrium considerations through the use of reduced concentrations, but there may also be additional interactions between library components that could affect the outcome. In particular, the absence of significant formation of F6 caught our interest. Hence, we decided to use CG-MD simulations to gain an understanding of the variations in self-assembling tendencies for mixtures of components, i.e., assessing the possible co-assembly between the species in the mixture.
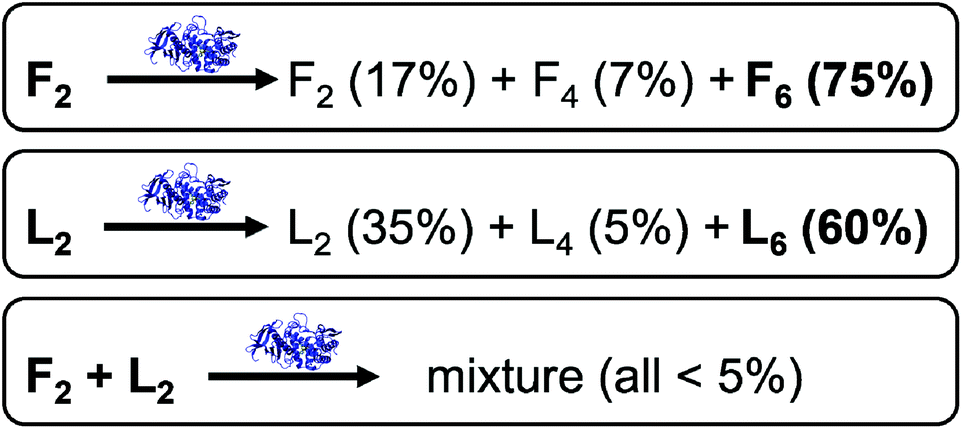 | ||
| Fig. 1 Summary of the results obtained by Pappas et al. in three different DPLs with F2 (ExpF), with L2 (ExpL); and with a mixture of both (ExpF–L). The protein structure above the reaction arrow represents the addition of the protease (thermolysin at 1 mg ml−1). | ||
While the validity of CG-MD to study the self-assembly of pure peptides has been validated by Frederix et al., these systems consisted of di- and tripeptides,8c,d and hence, this study will also assess the validity of the MARTINI force field for the study of longer self-assembling peptides. Furthermore, while the validity of the MARTINI force field for the co-assembly of multiple peptide species has been previously demonstrated by Guo et al., this study investigated the co-assemblies of peptides containing only phenylalanine, F2 and F3.11 The current study extends the validation of the MARTINI force field for peptide co-assemblies containing homopeptides with different amino acids, in this case L and F.
Therefore, in this study CG-MD simulations with the MARTINI force field will be implemented to: (a) test its ability to reproduce the experimental results of ExpF and ExpL in order to evaluate its use as a predictive tool for peptides longer than three amino acids; (b) assess the ability of this method to model the co-assembly of multicomponent systems; and (c) to improve the understanding of the experimental results presented by Pappas et al. and determine why F6 is not formed in ExpF–L.
The study starts with the CG-MD simulations of the three species that give significant yields in ExpF and ExpL. This is used to assess the ability of the model to reproduce the self-assembling behaviour of these peptides. The simulations were made at two concentrations to compare and evaluate the differences in the self-assembling tendency of F6 and L6. After this, simulations that combine F6 and L2 at different compositions are presented to show how the presence of L2 modifies the self-assembling tendency of F6 to explain why this molecule does not appear as a thermodynamically favoured product in ExpF–L.
Methods
Systems
Zwitterionic peptides coordinate files were created in Avogadro12 and converted to CG representation in the MARTINI force field (version 2.2)13 using martinize.py.14 Zwitterionic peptides were used as it is the expected protonation state in solution at pH 7, which will determine the initial propensity of the peptides to aggregate or not. This approach is consistent with that used in previous studies on di- and tripeptides by Frederix et al.8c,d While there is evidence that upon self-assembly the local environment of the peptides can result in variable protonation states of the residues,15 the model is not able to capture these changes and as such the degree to which the final nanostructures obtained are consistent with the experimental structures can be affected by the local environment. However, in this work we focus on the initial ability of the systems to interact and aggregate into stable structures and the protonation state of the residues in the non-aggregated state will be a critical parameter for this. The coiled coil (C) secondary structure was used, which differs from the previous examples on di- and tripeptides where the extended (E) secondary structure was used. The main difference between C and E is the lack of a torsion potential to limit backbone flexibility in the former one. Therefore, this choice is less relevant in the previously studied systems but for those in this study C ensures the maximum flexibility of the tetra- and hexapeptides. Previous studies showed that although a PA system (formed by 13 amino acids) experimentally showed the presence of β-sheet conformation (E in the MARTINI model), this was found not to be a deterministic parameter in the simulations.16 Therefore, if this parameter was not key for a PA formed by 13 amino acids, it can be expected to be less influential for the tetra- and hexapeptides of this study.All systems were built in a cubic box 21.5 × 21.5 × 21.5 nm3 and solvated using CG water. The first simulations were built at a constant concentration of amino acids, all the systems contain 3600 L or F. Therefore, the F2 and L2 systems consist of 1800 molecules, F4 and L4 consist of 900, and F6 and L6 of 600. This results in a model system concentration ca. ten times greater than the experimental conditions for the dipeptides (300 mM), which is consistent with previous work in this area.8c,17 The tetrapeptide (150 mM) and hexapeptide (100 mM) systems correlate in the same way to the experimental concentrations while also assuming 100% conversion. The co-assembly systems were composed of F6 and L2 as shown in Table 1 (F–L100–1500, F–L200–1200, F–L300–900, F–L400–600 and F–L500–300), making the number of amino acids constant for all the simulations. Extra control simulations were run to assess the concentration effect and serve as a reference for the co-assembly systems – the composition of the controls corresponds to the co-assembly systems with no L2 (Table 1: F1006, F2006, F3006, F4006 and F5006). This amount of product implies, for the total conversion of F2, initial concentrations of 50 mM, 100 mM, 150 mM (as used under the experimental conditions), 200 mM and 250 mM.
| System | Number of molecules | Concentration (mM) | ||
|---|---|---|---|---|
| F6 | L2 | F6 | L2 | |
| F–L100–1500 | 100 | 1500 | 17 | 250 |
| F–L200–1200 | 200 | 1200 | 33 | 200 |
| F–L300–900 | 300 | 900 | 50 | 150 |
| F–L400–600 | 400 | 600 | 67 | 100 |
| F–L500–300 | 500 | 300 | 83 | 50 |
| F1006 | 100 | — | 17 | — |
| F2006 | 200 | — | 33 | — |
| F3006 | 300 | — | 50 | — |
| F4006 | 400 | — | 67 | — |
| F5006 | 500 | — | 83 | — |
For some of the systems simulations were run doubling the concentration (600 mM for dipeptides, 300 mM for tetrapeptides and 200 mM for hexapeptides). These were built in half of the volume (17.1 × 17.1 × 17.1 nm3) to keep the number of molecules constant. This was made to ensure that the effects were due to the higher concentration and not due to an increment in the number of molecules.
All visualizations were rendered using VMD.18
Simulations
Simulations were carried out in GROMACS version 4.5.3.19 Simulations used periodic boundary conditions. Lennard–Jones interactions shifted to zero in the range 0.9–1.2 nm, and electrostatic interactions in the range of 0.0–1.2 nm (using no Particle Mesh Ewald method). For screening the electrostatic interactions, a relative dielectric constant of 15 was used. In all the cases, the box was firstly minimized for 5000 steps or until forces in atoms converged under 200 pN. The box was then equilibrated for 500![[thin space (1/6-em)]](https://www.rsc.org/images/entities/char_2009.gif) 000 steps using Berendsen algorithms to keep temperature (τT = 1 ps) and pressure (τP = 3 ps) around 303 K and 1 bar (NPT ensemble), respectively.20 A 25 fs per step was used. Simulations were run for 100000000 steps which corresponds to 10 μs effective time.13a,21
000 steps using Berendsen algorithms to keep temperature (τT = 1 ps) and pressure (τP = 3 ps) around 303 K and 1 bar (NPT ensemble), respectively.20 A 25 fs per step was used. Simulations were run for 100000000 steps which corresponds to 10 μs effective time.13a,21
Analysis
Co-assembly and control simulations were analysed using the radial distribution function (RDF) to assess the change of the molecular order on these systems. For the analysis, the third backbone bead of the F6 molecules was used as is, with the fourth, the closest to the centre of mass. Root mean square deviation (RMSD) analysis was used in the non-competitive self-assembly simulations to assess the differences in mobility of the molecules with time. All analyses were performed in GROMACS 4.5.3.19Results and discussion
Non-competitive peptide self-assembly
The simulations show the formation of nanostructures for the three F-containing peptides (Fig. 2a–c). Only even-numbered peptide lengths (2, 4, 6) were considered in this study as a clear preference for this behaviour was shown by Pappas et al. in their experimental work, which could be related to the formation of equal numbers of H-bonds on both faces, thus favouring unidirectional assembly for even-numbered peptides only. The snapshots show the well-known tubes for F2 (Fig. 2a and d)2a,22 and the F6 fibres (Fig. 2c), recently discovered.9 In addition, the simulations show that F4 also forms a fibre-like structure (Fig. 2b), which is consistent with the previous experimental work which reported the ability of F4 to form nanostructures.17b This demonstrates the ability of the MARTINI force field to reproduce experimental self-assembly results for tetra- and hexapeptides, and, to our knowledge, this is the first time this has been shown for peptides more than 3 amino acids in length.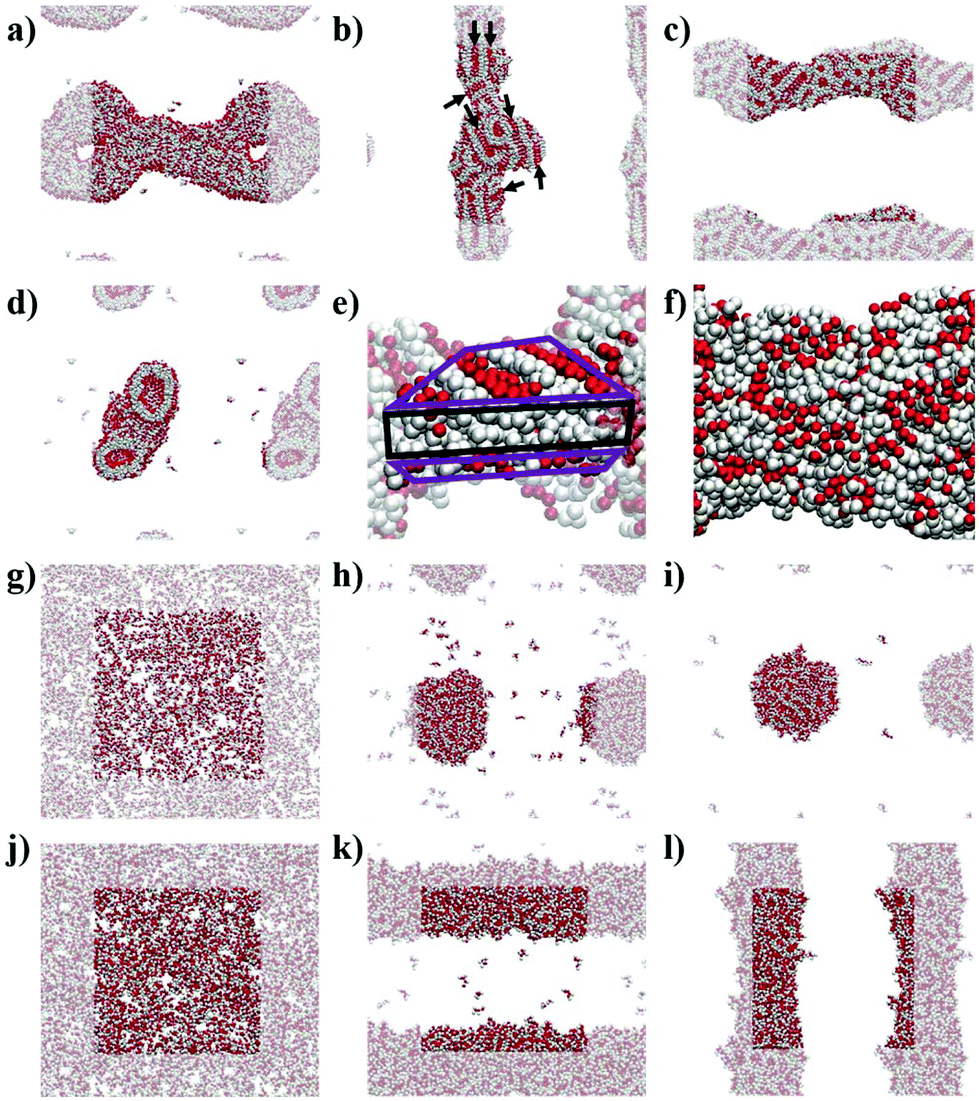 | ||
| Fig. 2 Simulation snapshots at 10 μs for: (a) F2, (b) F4, (c) F6, (g) L2, (h) L4, (i) L6, (j) concentrated L2, (h) concentrated L4, (i) concentrated L6; (d) cross-section of F2 at 10 μs; and the zoomed structures at 10 μs for (e) F4 and (f) F6. All images show backbone beads in red and side chain beads in white. (a–d; f–l) Periodic images are semi-transparent. (e) Highlighted bilayer-like arrangement showing the rest of the fibre as semi-transparent; the hydrophilic region of the bilayer-like is highlighted in purple and the hydrophobic region in black. (b) Alignment of backbone beads is highlighted with black arrows. | ||
While both F6 and F4 form fibre-like structures, they show key differences. F6 (Fig. 2c and f) looks similar to the fibres shown by Frederix et al.8c and by Scott et al.,23 with no clear patterns on the surface. However, F4 on a closer inspection (Fig. 2e) shows a clear pattern, which reveals a bilayer-like arrangement situating the aromatic side chains (in white) between the layers of well-aligned backbone beads, in order to decrease the contact of the aromatic sidechains with water. The alignment of the backbones can be seen in the whole F4 fibre (Fig. 2b) indicating that the fibre is composed of aggregated tapes. These differences are important as, experimentally, F6 is thermodynamically favoured over F4 and thus these structural insights highlight the key features of a nanostructure which provide thermodynamic stability. The patterns observed at this concentration for F4 are found in the concentrated simulations of F4 and F6 (Fig. S9 and S10†). The concentrated F4 shows no movement through 9 μs (1–10 μs) which suggest that the molecules adopt a solid/crystalline-like structure. The RMSD analysis confirms this lack of movement, more precisely after 2 μs (Fig. S14c†) for F4 but also for F2, while F6 shows some fluctuations through the whole simulation. These results suggest that F4 and F2 have a higher tendency to precipitate than F6 despite their lower hydrophobicity.
The L-containing peptides do not show formation of one-dimensional nanostructures (Fig. 2g–i). The L2 dipeptides do not aggregate, probably due to their higher solubility, relative to F2, (Fig. 2g). Although this is not consistent with the fibres shown by TEM,9 as no cryo-TEM was reported for this system, it cannot be guaranteed that the L2 fibres do not appear as a result of drying in the TEM sample preparation. The broad and weak amide I signal in the FT-IR of the initial L2 solution also does not suggest highly ordered H-bonding, which is typically reported for short peptide fibers.2a,8d At these concentrations, simulations show spherical aggregates for both L4 and L6 (Fig. 2h and i). L4 is not favoured in the experiments, suggesting that the self-assembling driving force is not strong enough or at least weaker than in the case of L6. Therefore, a lower tendency to form nanostructures correlates with a lower driving force and hence, the simulated L4 result (Fig. 2h), showing the formation of an aggregate and not a fibre, is consistent with the low formation of L4 in the experiments. However, at this concentration, the L6 aggregate (Fig. 2i) is not consistent with the experimental results, which showed fibres. However, upon concentrating the system, both L4 (Fig. 2k) and L6 (Fig. 2l) form fibrous nanostructures, while even at higher concentrations L2 does also not form aggregates in these simulations. This observation suggests that fibre formation is not simply a consequence of concentration but relates to specific, peptide length-dependent molecular interactions. The L4 and L6 fibres do not show patterns as those observed for F4 in the less concentrated simulations. Nevertheless, there is a difference between the concentrated L4 and L6 which is the number of molecules in solution: while all the L6 molecules are involved in forming the fibre, 10 L4 molecules (1.1% of the total 900) remain in solution at the end of the simulation. This partition behaviour suggests a higher stability of the L6 fibres relative to L4. In the case of F-peptides, only F2 shows 10 molecules (0.6% of the total 1800) in solution after the 10 μs of simulation, but the shape of the nanostructure formed by F2 already shows clear differences with F4 and F6.
The fact that F6 is able to form one-dimensional nanostructures at a lower concentration than that required by L6 suggests the higher self-assembling tendency of the former, which is consistent with its higher experimental yield (F6 = 75% and L6 = 60%, Fig. 1).
These results confirm that the MARTINI force field can reproduce the overall self-assembly tendencies observed on these di-, tetra- and hexapeptides in non-competitive systems although concentration dependencies cannot be accurately replicated.
F6–L2 co-assembly
The snapshots from the control systems show that F1006, F2006 and F3006 are not able to form fibres (Fig. 3a–c) and can be considered to be below the simulated critical fibre concentration (SCFC – we distinguish here between the experimental and simulated CFC due to the difference in concentration required in the model and the experimental system), while the fibre shape is evident for the other two systems, F4006 and F5006 (Fig. 3d and e). Therefore, the concentration clearly affects the F6 self-assembly tendency and could be sufficient to explain the experimental results. Because ExpF–L uses only 15 mM of F2 (and 15 mM of L2, to give a total of 30 mM), which, with a total conversion of F2 into F6 would correspond to the F3006 simulated system (150 mM of F2 and hence, 50 mM of F6, at 10 times the experimental concentration), this does not form a fibre-like structure (Fig. 3c). Although L6 showed nanostructures at concentrations lower than the corresponding computational concentration, this result shows that there is a clear concentration effect which should be taken into account experimentally when carrying out DPL studies.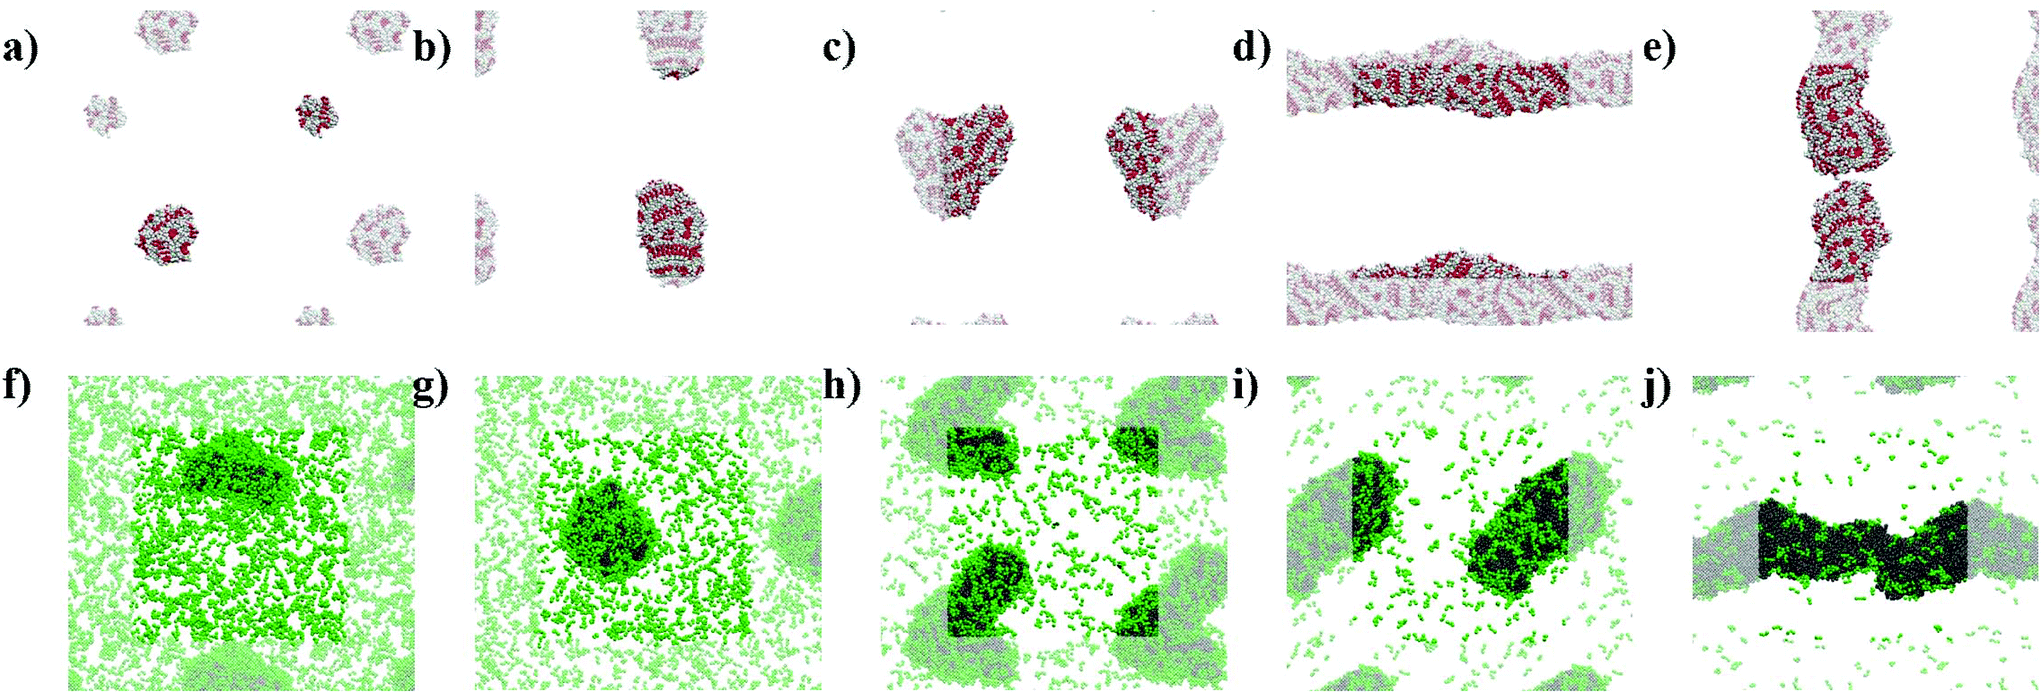 | ||
| Fig. 3 Simulation snapshots at 10 μs for: (a) F1006, (b) F2006, (c) F3006, (d) F4006, (e) F5006, (f) F–L100–1500, (g) F–L200–1200, (h) F–L300–900, (i) F–L400–600 and (j) F–L500–300. (a–e) F6 systems show backbone beads in red and side chain beads in white; (f–j) and F–L systems show F6 molecules in grey and L2 in green. Periodic images are transparent for all the systems. | ||
When L2 is added to the systems to study its co-assembly effect in the F6 structures, only F–L500–300 presents the formation of a fibre (Fig. 3j). Although F–L400–600 has enough F6 molecules to form a fibre, as the F4006 system demonstrated (Fig. 3d), it only forms an elongated aggregate (Fig. 3i). The RDF analysis (Fig. 4) further corroborates the differences between F4006 and F–L400–600 showing differences in the intermolecular order. The trends for the peaks at r = 19 Å (Fig. 4c) and at r = 15 Å (Fig. 4d) show a change when they reach 400 F6 molecules for the control simulations, F4006, but this change is not observed for the co-assembly systems, F–L400–600. This trend change in the control simulations would suggest that the SCFC has been reached. However, this is not observed for the co-assembly system, suggesting that the L2 molecules modify the SCFC of F6.
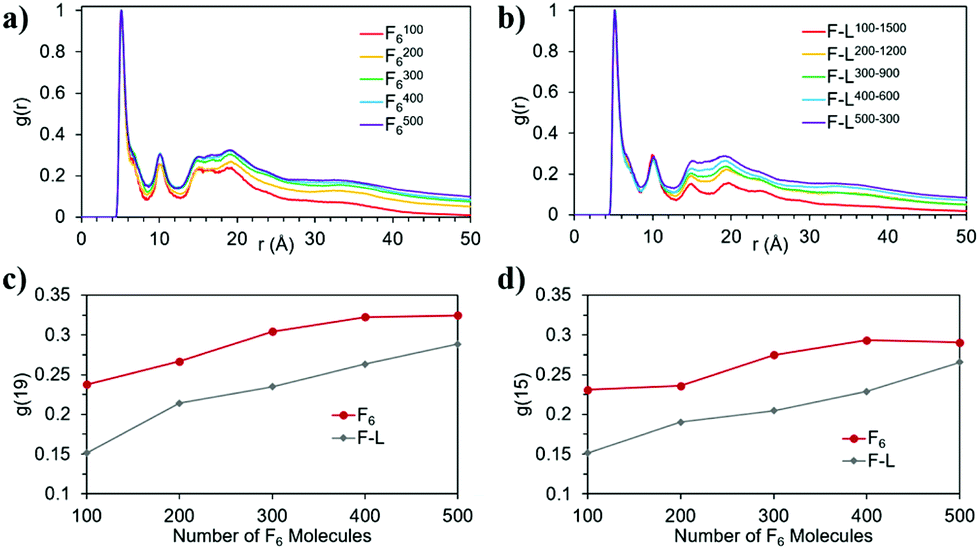 | ||
| Fig. 4 Normalized RDF of the F6 molecules in the (a) control and (b) co-assembly simulation; and evolution of the RDF intensity, g(r), at (c) r = 19 and (d) r = 15 for the control (F6) and co-assembly (F–L) systems as a function of the number of F6 molecules. | ||
This difference in fibre formation for systems containing the same number of F6 molecules evidences a L2 disrupting effect on the F6 self-assembly. This effect seems to be insufficient to avoid the formation of the fibre when the F6 concentration is higher than the L2, in F–L500–300 (Fig. 3j). F–L300–900 (Fig. 3h) and F3006 (Fig. 3c) show similar structures for the same number of F6 molecules, which might suggest that the L2 disrupting effect only breaks self-assembled structures and not aggregates, thus, modifying the SCFC, but not the simulated critical aggregation concentration (SCAC). F3006 is the system that corresponds to the experimental concentration and indicates that no fibre formation is possible under these conditions.
As shown in Fig. 3, the L2 molecules interact and affect the F6 assemblies. In all of the F–L systems the F6 molecules aggregate (grey, Fig. 3f–j) and the L2 molecules (green), which in the absence of other molecules remain dispersed (Fig. 2g), accumulate on the surface of the F6 aggregate. Therefore, this behaviour of L2 adhering to the fibre surface and increasing the solubility of the F6 aggregate is what leads to the increase in the SCFC of F6 and makes F–L400–600 unable to form fibres while F4006 does. Therefore, we propose that L2 plays a stabilizing surfactant-like role on the F6 aggregate surface, which increases the SCFC such that F–L400–600 cannot form fibres.
These results suggest that there is a disrupting effect of L2 in the F6 fibres. This reduces the self-assembling ability of the peptides in the mixture. As a result of this, in competition experiments, the thermodynamic gain from self-assembly is unable to drive the formation of longer peptide structures. The ability of the peptides to interact and affect the relative self-assembly tendencies is of special importance for library experiments as it suggests that these experiments might not always be selecting the same self-assembling molecule observed in non-competitive systems. Furthermore, the results show that the self-assembly tendency of F6 in the presence of L2 also depends on the relative concentration of both species. This suggests that, experimentally, some products might be unlocked by modifying the proportions of the different starting products in the mixtures.
Conclusions
In this work, it has been possible to demonstrate several important features of the methodology that is being increasingly applied in the literature to predict self-assembly. Namely:(a) The MARTINI force field can be used to predict the self-assembling tendency of peptides longer than three amino acids. However, this study also suggests that different concentrations might be required to ensure that molecules do not self-assemble at all (L2) rather than excluding molecules with a relatively low self-assembling tendency (L4 and L6).
(b) As well as reproducing the cooperative effects, as shown by Guo et al., the MARTINI force field can reproduce destructive co-assembly effects in peptides. These disrupting co-assembly effects are a potential explanation for the low yields in the DPL experiments with mixtures of components.9
In addition to the methodological insights for computational studies of these systems, this work also reveals several important features of peptide co-assembly that need to be taken into account when performing competition experiments. The results show that the different components of the libraries can interact and modify the tendency of other species to self-assemble and, as self-assembly is the driving force, for these components to be formed in the library. In this case, L2 is found to disrupt the self-assembly of F6, increasing the SCFC.
Although recent studies have reported the combination of F2 with F3 and with an F2 derivative,11,24 the co-assembly in peptide based nanomaterials has not been extensively studied. However, the current work suggests that it could be critical when employing combinatorial chemistry. The possible co-assembly or disruptive assembly of the different components should be taken into account when working with libraries because these effects have the potential to mask the self-assembling tendencies of the studied molecules. Finally, this work also provides a suggested approach for determining the nature of these effects in experimental systems. Changes in the relative concentrations of the different species may help to check the validity of the results. As the interaction between the peptides is concentration dependent, this can be varied in order to assess the effect of the interaction. In the specific case of the libraries for material discovery, the species ratio changes can help to unlock new species which do not give relevant yields due to disrupting self-assembly, or even on adding both dipeptides at the same concentration they were in the single dipeptide system.
Acknowledgements
The authors gratefully acknowledge the financial support by the EC 7th Framework Programme Marie Curie Actions via the European ITN SMARTNET No. 316656 and EMERgE/ERC No. 258775. Results were obtained using the EPSRC funded ARCHIE-WeSt High Performance Computer (https://www.archie-west.ac.uk). EPSRC grant no. EP/K000586/1.Notes and references
- (a) S. Zhang, Nat. Biotechnol., 2003, 21, 1171–1178 CrossRef CAS PubMed; (b) T. Aida, E. Meijer and S. Stupp, Science, 2012, 335, 813–817 CrossRef CAS PubMed; (c) J. D. Hartgerink, E. Benlash and S. L. Stupp, Science, 2001, 294, 1684–1688 CrossRef CAS PubMed; (d) A. R. Hirst, B. Escuder, J. F. Miravet and D. K. Smith, Angew. Chem., Int. Ed., 2008, 47, 8002–8018 CrossRef CAS PubMed; (e) N. Singh, M. Kumar, J. F. Miravet, R. V. Ulijn and B. Escuder, Chem. – Eur. J., 2016, 23, 981–993 CrossRef PubMed; (f) Y. Li, F. Wang and H. Cui, Bioeng. Transl. Med., 2016 Search PubMed; (g) C. M. R. Pérez, N. Stephanopoulos, S. Sur, S. S. Lee, C. Newcomb and S. I. Stupp, Ann. Biomed. Eng., 2015, 43, 501–514 CrossRef PubMed.
- (a) M. Reches and E. Gazit, Science, 2003, 300, 625–627 CrossRef CAS PubMed; (b) H. Erdogan, E. Babur, M. Yilmaz, E. Candas, M. Gordesel, Y. Dede, E. E. Oren, G. B. Demirel, M. K. Ozturk and M. S. Yavuz, Langmuir, 2015, 31, 7337–7345 CrossRef CAS PubMed; (c) L. Adler-Abramovich and E. Gazit, Chem. Soc. Rev., 2014, 43, 6881–6893 RSC.
- H. Cui, A. G. Cheetham, E. T. Pashuck and S. I. Stupp, J. Am. Chem. Soc., 2014, 136, 12461–12468 CrossRef CAS PubMed.
- S. Fleming and R. V. Ulijn, Chem. Soc. Rev., 2014, 43, 8150–8177 RSC.
- A. K. Das, P. P. Bose, M. G. B. Drew and A. Banerjee, Tetrahedron, 2007, 63, 7432–7442 CrossRef CAS.
- R. Vegners, I. Shestakova, I. Kalvinsh, R. M. Ezzell and P. A. Janmey, J. Pept. Sci., 1995, 1, 371–378 CrossRef CAS PubMed.
- (a) Z. Yang, H. Gu, D. Fu, P. Gao, J. K. Lam and B. Xu, Adv. Mater., 2004, 16, 1440–1444 CrossRef CAS; (b) H. ChandraáKotamarthi, Soft Matter, 2013, 9, 10141–10145 RSC.
- (a) N. Sanchez-de Groot, T. Parella, F. Aviles, J. Vendrell and S. Ventura, Biophys. J., 2007, 92, 1732–1741 CrossRef CAS PubMed; (b) S. Marchesan, C. D. Easton, K. Styan, L. Waddington, K. Kushkaki, L. Goodall, K. McLean, J. S. Forsythe and P. G. Hartley, Nanoscale, 2014, 6, 5172–5180 RSC; (c) P. W. J. M. Frederix, G. G. Scott, Y. M. Abul-Haija, D. Kalafatovic, C. G. Pappas, N. Javid, N. T. Hunt, R. V. Ulijn and T. Tuttle, Nat. Chem., 2015, 7, 30–37 CrossRef CAS PubMed; (d) P. W. J. M. Frederix, R. V. Ulijn, N. T. Hunt and T. Tuttle, J. Phys. Chem. Lett., 2011, 2, 2380–2384 CrossRef CAS PubMed.
- C. G. Pappas, R. Shafi, I. R. Sasselli, H. Siccardi, T. Wang, V. Narang, R. Abzalimov, N. Wijerathne and R. V. Ulijn, Nat. Nanotechnol., 2016, 11, 960–967 CrossRef CAS PubMed.
- (a) R. J. Williams, A. M. Smith, R. Collins, N. Hodson, A. K. Das and R. V. Ulijn, Nat. Nanotechnol., 2009, 4, 19–24 CrossRef CAS PubMed; (b) N. Sreenivasachary and J.-M. Lehn, Proc. Natl. Acad. Sci. U. S. A., 2005, 102, 5938–5943 CrossRef CAS PubMed; (c) J. M. Lehn, Chem. – Eur. J., 1999, 5, 2455–2463 CrossRef CAS; (d) J. M. A. Carnall, C. A. Waudby, A. M. Belenguer, M. C. A. Stuart, J. J.-P. Peyralans and S. Otto, Science, 2010, 327, 1502–1506 CrossRef CAS PubMed; (e) P. G. Swann, R. A. Casanova, A. Desai, M. M. Frauenhoff, M. Urbancic, U. Slomczynska, A. J. Hopfinger, G. C. Le Breton and D. L. Venton, Pept. Sci., 1996, 40, 617–625 CrossRef CAS.
- C. Guo, Z. A. Arnon, R. Qi, Q. Zhang, L. Adler-Abramovich, E. Gazit and G. Wei, ACS Nano, 2016, 10, 8316–8324 CrossRef CAS PubMed.
- M. D. Hanwell, D. E. Curtis, D. C. Lonie, T. Vandermeersch, E. Zurek and G. R. Hutchison, J. Cheminf., 2012, 4, 17 CAS.
- (a) S. J. Marrink, H. J. Risselada, S. Yefimov, D. P. Tieleman and A. H. de Vries, J. Phys. Chem. B, 2007, 111, 7812–7824 CrossRef CAS PubMed; (b) L. Monticelli, S. K. Kandasamy, X. Periole, R. G. Larson, D. P. Tieleman and S.-J. Marrink, J. Chem. Theory Comput., 2008, 4, 819–834 CrossRef CAS PubMed; (c) D. H. de Jong, G. Singh, W. F. D. Bennett, C. Arnarez, T. A. Wassenaar, L. V. Schäfer, X. Periole, D. P. Tieleman and S. J. Marrink, J. Chem. Theory Comput., 2013, 9, 687–697 CrossRef CAS PubMed.
- martinize.py, 2.0 <http://md.chem.rug.nl/cgmartini/index.php/downloads/tools/204-martinize>.
- C. Tang, A. M. Smith, R. F. Collins, R. V. Ulijn and A. Saiani, Langmuir, 2009, 25, 9447–9453 CrossRef CAS PubMed.
- O.-S. Lee, V. Cho and G. C. Schatz, Nano Lett., 2012, 12, 4907–4913 CrossRef CAS PubMed.
- (a) C. Guo, Y. Luo, R. Zhou and G. Wei, ACS Nano, 2012, 6, 3907–3918 CrossRef CAS PubMed; (b) E. Mayans, G. Ballano, J. Casanovas, A. Díaz, M. M. Pérez-Madrigal, F. Estrany, J. Puiggalí, C. Cativiela and C. Alemán, Chem. – Eur. J., 2015, 21, 16895–16905 CrossRef CAS PubMed.
- W. Humphrey, A. Dalke and K. Schulten, J. Mol. Graphics, 1996, 14, 33–38 CrossRef CAS PubMed.
- B. Hess, C. Kutzner, D. van der Spoel and E. Lindahl, J. Chem. Theory Comput., 2008, 4, 435–447 CrossRef CAS PubMed.
- H. J. C. Berendsen, J. P. M. Postma, W. F. van Gunsteren, A. DiNola and J. R. Haak, J. Chem. Phys., 1984, 81, 3684–3690 CrossRef CAS.
- S. J. Marrink, A. H. de Vries and A. E. Mark, J. Phys. Chem. B, 2004, 108, 750–760 CrossRef CAS.
- X. Yan, Y. Cui, Q. He, K. Wang, J. Li, W. Mu, B. Wang and Z. C. Ou-yang, Chem. – Eur. J., 2008, 14, 5974–5980 CrossRef CAS PubMed.
- G. G. Scott, P. J. McKnight, T. Tuttle and R. V. Ulijn, Adv. Mater., 2016, 28, 1381–1386 CrossRef CAS PubMed.
- L. Adler-Abramovich, P. Marco, Z. A. Arnon, R. C. Creasey, T. C. Michaels, A. Levin, D. J. Scurr, C. J. Roberts, T. P. Knowles, S. J. Tendler and E. Gazit, ACS Nano, 2016, 10, 7436–7442 CrossRef CAS PubMed.
Footnote |
| † Electronic supplementary information (ESI) available: Extra simulation snapshots. See DOI: 10.1039/c7ob01268c |
| This journal is © The Royal Society of Chemistry 2017 |